

#alphabetsharesslide10%inlatetrading
alphabetsharesslide10%inlatetrading
Hot
Latest

·
--
#alphabetsharesslide10%inlatetrading
Alphabet's After-Hours Plunge
📉 Alphabet Shares Slide Over 10% in After-Hours Trading! 🚨
Tech markets are feeling the shockwaves as Google’s parent company, Alphabet, faced a sharp selloff following its Q3 earnings release. While the company posted a strong 25% year-on-year revenue increase to $127.6 billion, a notable profit miss and surging AI costs sent shockwaves through Wall Street.
Key Takeaways to Know:
The Earnings Miss: Alphabet reported adjusted earnings of $2.12 per share, falling short of analyst expectations of around $3.00–$3.02.
Heavy AI Capital Expenditure: Massive infrastructure spending pushed free cash flow below zero as the tech giant scales up its AI capabilities.
Cloud Strength vs. Ad Concerns: Google Cloud proved to be a major bright spot (surging past expectations), but softer-than-expected ad revenue growth weighed heavily on investor sentiment.
The Big Question: Is this double-digit correction a warning sign of overextended tech/AI spending, or is it a classic market overreaction and a long-term dip-buying opportunity?
Why It Matters: As Big Tech continues to pour billions into artificial intelligence, investors are increasingly demanding clear, near-term proof of profitability. Moves like this in mega-cap stocks can quickly ripple across the broader tech and crypto sectors as liquidity and sentiment shift.
💬 What’s your take? Are you buying the dip on Alphabet, or staying cautious as AI infrastructure costs ramp up? Drop your thoughts below! 👇
#Google #Alphabet #technews #StockMarket $NVDAB $AAPLB $MSFTB
91

·
--
Verified
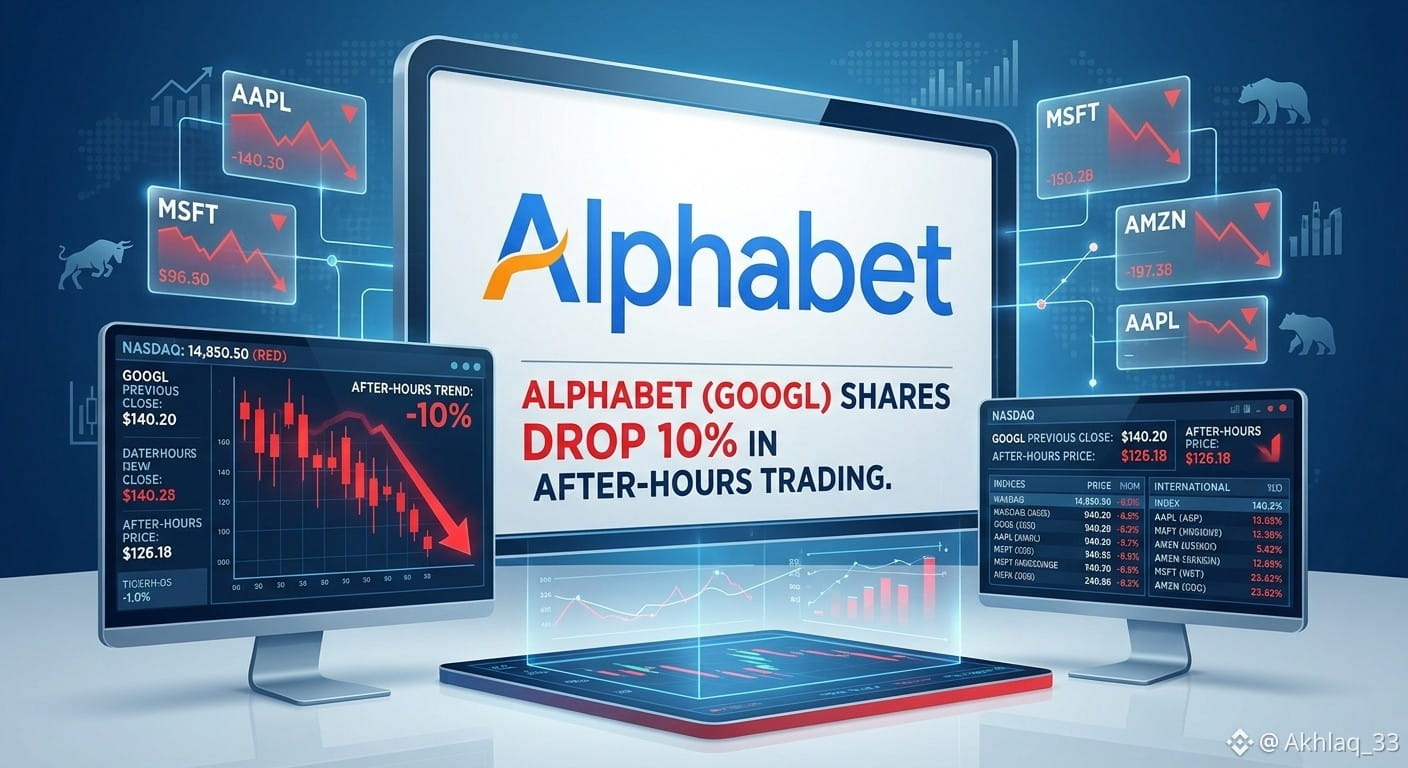
🚨 ALPHABET SHARES DROP 10% IN AFTER-HOURS TRADING
A sharp late-trading selloff puts Alphabet under pressure as investors reassess the tech giant’s outlook.
The key question is whether this is a temporary market reaction or a warning sign for the broader AI and tech sector.
📉 A 10% decline can quickly shift investor sentiment.
📊 Traders will be watching the next session for signs of recovery or further downside.
Is this a buying opportunity for Alphabet or a signal to stay cautious?
Key context: Alphabet's selloff followed its Q3 earnings report, which showed revenue slightly below expectations and rising concerns over heavy AI investment. Google Cloud remained a major bright spot, but investors are demanding clearer evidence of AI profitability.
#alphabetsharesslide10%inlatetrading $GOOGLB
{spot}(GOOGLBUSDT)
🚨 ALPHABET SHARES DROP 10% IN AFTER-HOURS TRADING
A sharp late-trading selloff puts Alphabet under pressure as investors reassess the tech giant’s outlook.
The key question is whether this is a temporary market reaction or a warning sign for the broader AI and tech sector.
📉 A 10% decline can quickly shift investor sentiment.
📊 Traders will be watching the next session for signs of recovery or further downside.
Is this a buying opportunity for Alphabet or a signal to stay cautious?
Key context: Alphabet's selloff followed its Q3 earnings report, which showed revenue slightly below expectations and rising concerns over heavy AI investment. Google Cloud remained a major bright spot, but investors are demanding clearer evidence of AI profitability.
#alphabetsharesslide10%inlatetrading $GOOGLB

177


·
--
#AlphabetSharesSlide10%InLateTrading
🚨 Alphabet Shares Slide 10% After Earnings : Is AI Spending Becoming a Concern?
Google’s parent company, Alphabet, faced heavy selling pressure in after-hours trading after its Q3 2026 earnings disappointed investors.
Revenue reached $127.6 billion, up 25% year over year, but fell short of the $128.2 billion analyst expectation. Google Cloud was the bright spot, with revenue surging 103% to $30.7 billion.
So why did the stock drop?
Investors are worried about weaker-than-expected advertising performance and rising AI infrastructure costs. Alphabet also reported negative free cash flow of $9.07 billion, highlighting the enormous expense of expanding its AI capabilities.
My take: The market wants more than impressive AI growth; it wants profitable growth. Google Cloud is performing strongly, but Alphabet must prove that its AI investments can generate sustainable returns without weakening its core Search business.
Would you buy this dip or wait for clearer signs of recovery? 👇
#Alphabet #EarningsSeason #BinanceSquare #Binance
1
61

·
--
Bearish
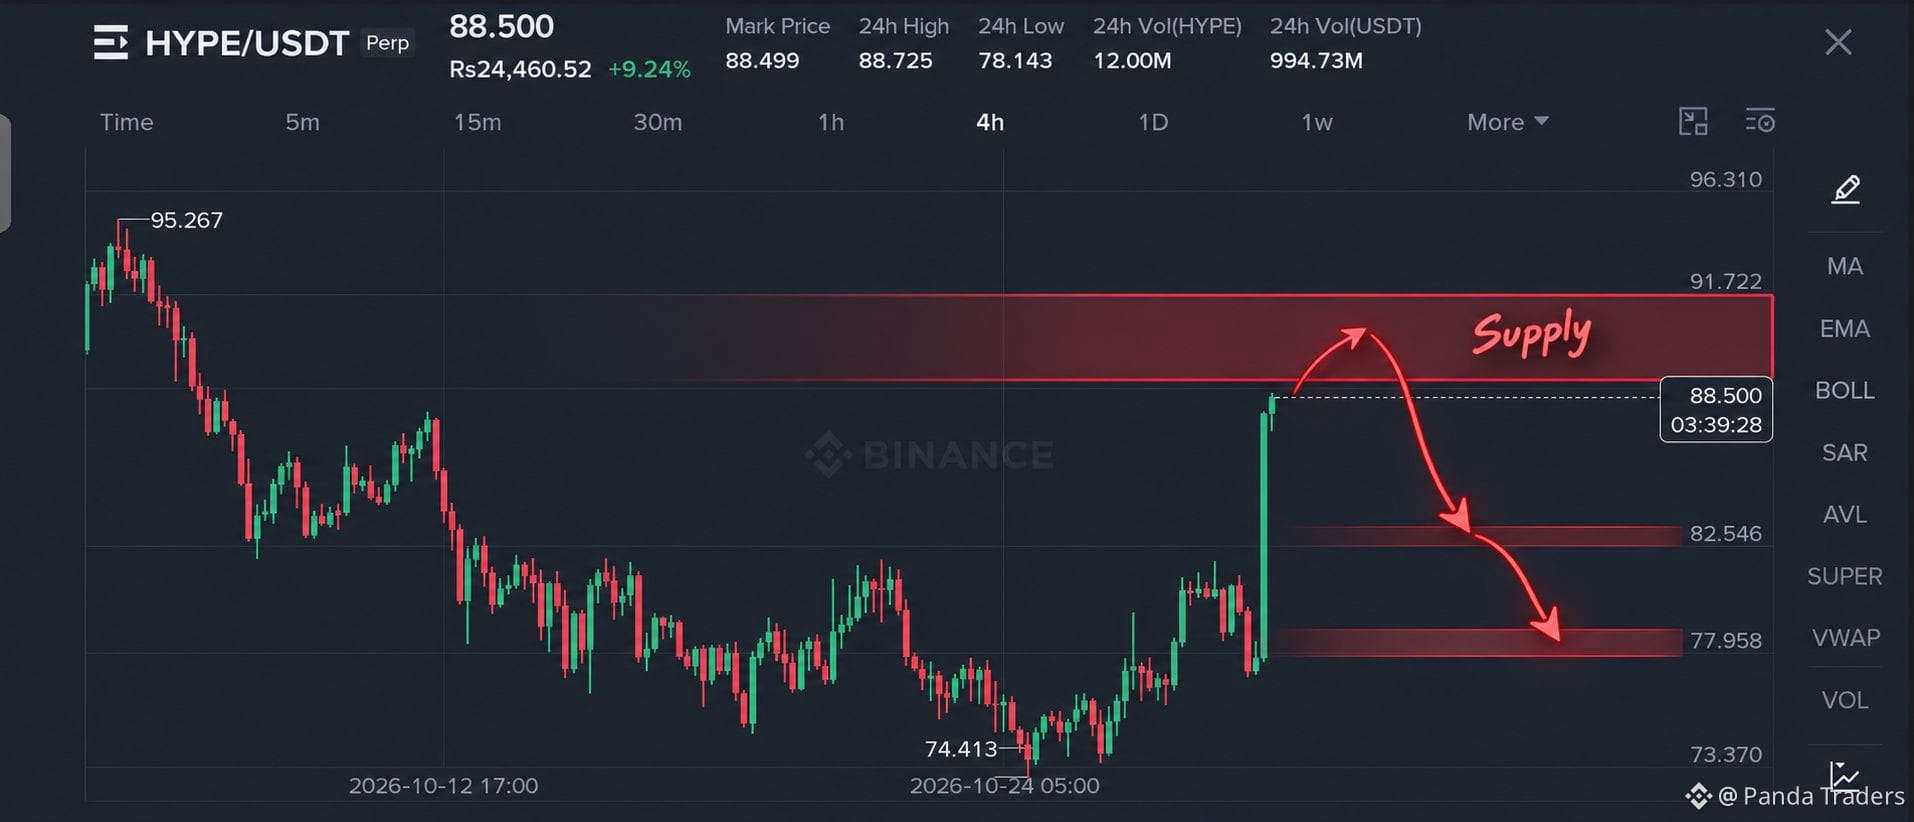
$HYPE watch Alert 🚨📉
Guys watch this coin between 87-90$ ..If it gets rejection it can dump towards 80$
DOWNSIDE Targets 🎯
SL: 92
🎯 TP1: $85.00
🎯 TP2: $82.50
🎯 TP3: $80.50
Then trail upto 78.00
Wait for rejection before entering
Always DYOR
{future}(HYPEUSDT)
#hype #AlphabetSharesSlide10%InLateTrading
$HYPE watch Alert 🚨📉
Guys watch this coin between 87-90$ ..If it gets rejection it can dump towards 80$
DOWNSIDE Targets 🎯
SL: 92
🎯 TP1: $85.00
🎯 TP2: $82.50
🎯 TP3: $80.50
Then trail upto 78.00
Wait for rejection before entering
Always DYOR
#hype #AlphabetSharesSlide10%InLateTrading
Guys watch this coin between 87-90$ ..If it gets rejection it can dump towards 80$
DOWNSIDE Targets 🎯
SL: 92
🎯 TP1: $85.00
🎯 TP2: $82.50
🎯 TP3: $80.50
Then trail upto 78.00
Wait for rejection before entering
Always DYOR
#hype #AlphabetSharesSlide10%InLateTrading
amro 1996:
She doesn't know anything in life except shorting
Did you ever catch a move before it happens??
3
3
1.3k

·
--
Bullish
I’m keeping the read simple: price, structure and volume.
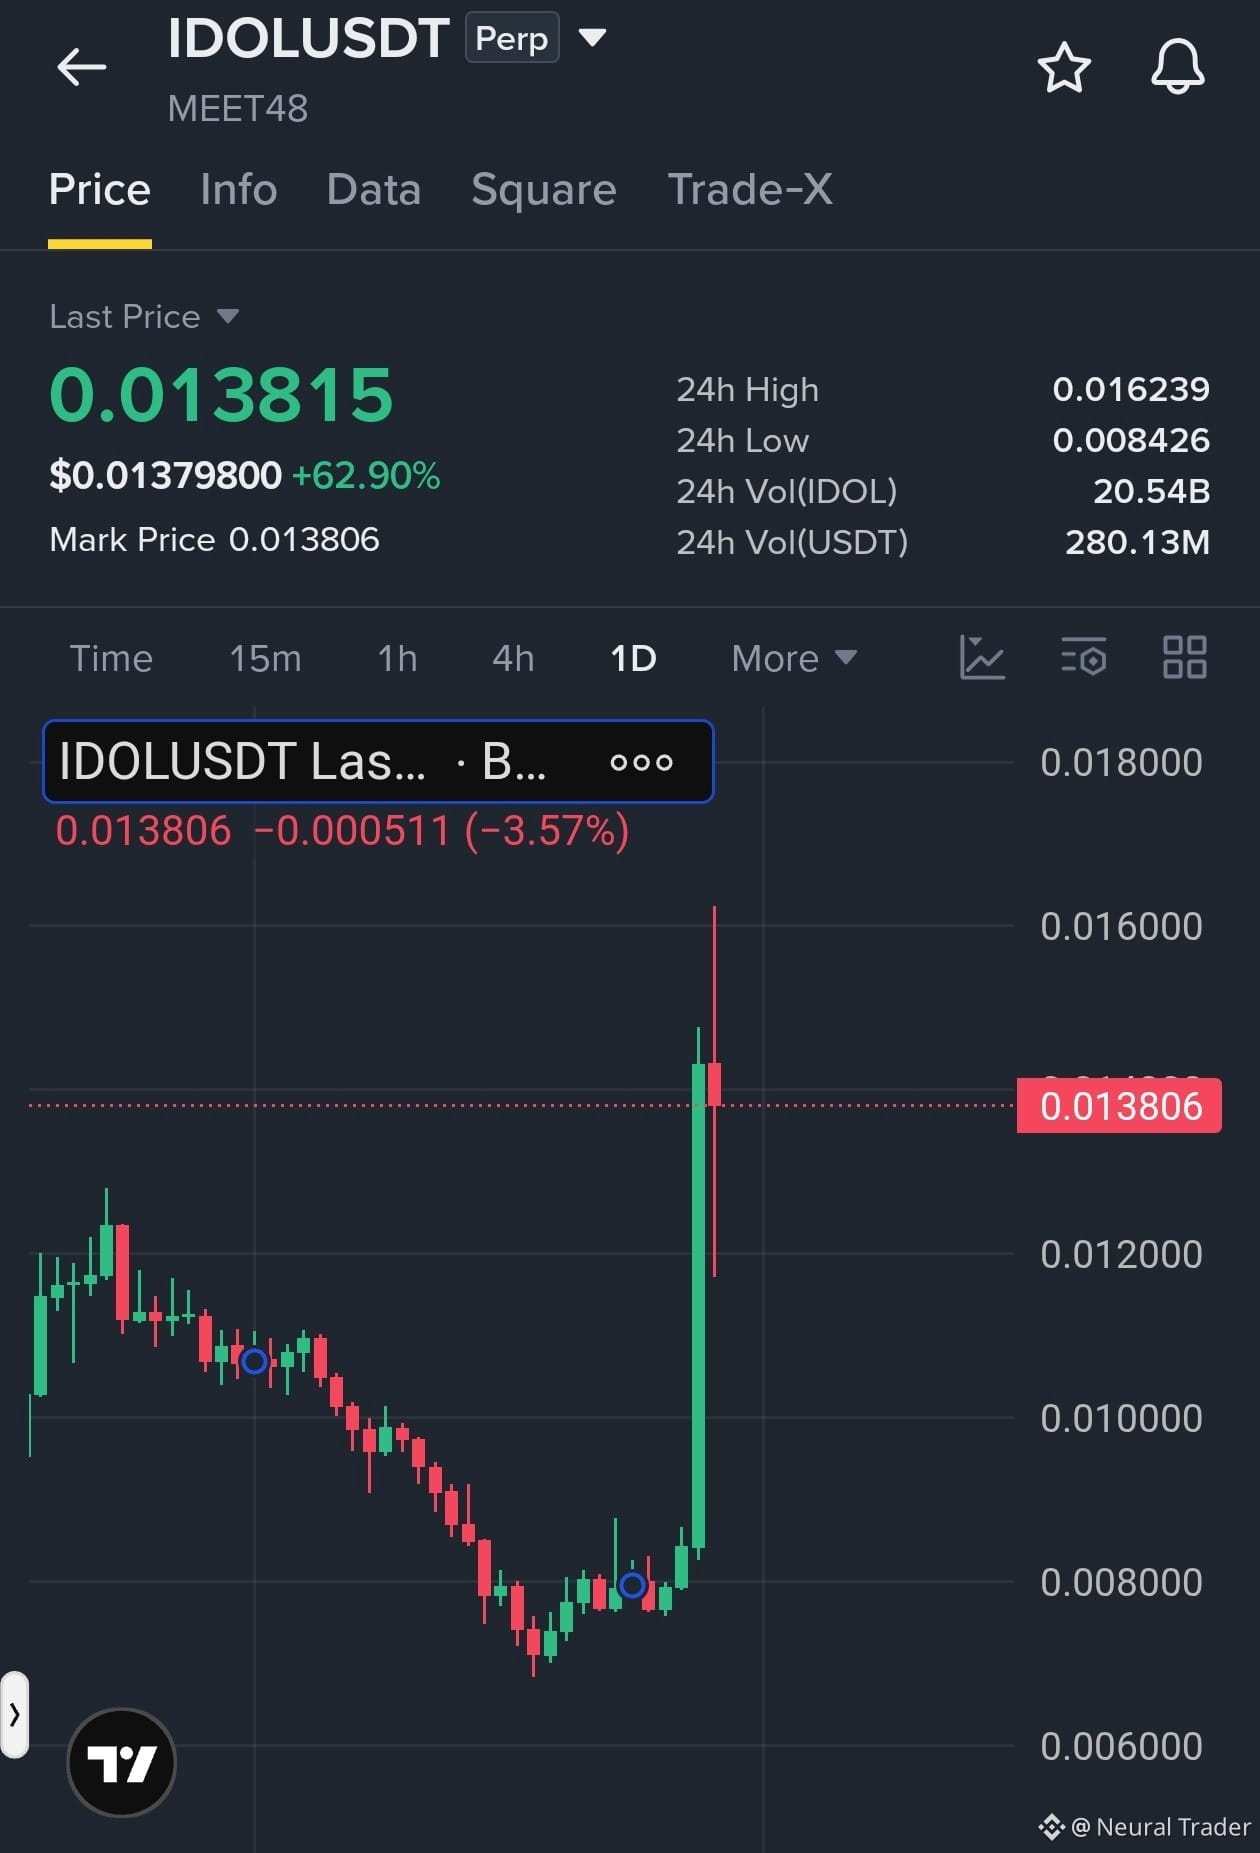
$IDOL is trading near 0.013924. Resistance: 0.014249. Support: 0.012245. RSI: 61.7. Upside checklist is improving. I’m watching the chart, not claiming a guaranteed move.
#FedWatch #AlphabetSharesSlide10%InLateTrading
{future}(IDOLUSDT)
I’m keeping the read simple: price, structure and volume.
$IDOL is trading near 0.013924. Resistance: 0.014249. Support: 0.012245. RSI: 61.7. Upside checklist is improving. I’m watching the chart, not claiming a guaranteed move.
#FedWatch #AlphabetSharesSlide10%InLateTrading
$IDOL is trading near 0.013924. Resistance: 0.014249. Support: 0.012245. RSI: 61.7. Upside checklist is improving. I’m watching the chart, not claiming a guaranteed move.
#FedWatch #AlphabetSharesSlide10%InLateTrading
99

🚨$BTC : A FAMILIAR 2023 SETUP?
$BTCUSDT weekly RSI trendline has broken and is now being retested, a pattern similar to early 2023.
Could this be the beginning of another major bull run?
$ETH USDT
The next move could be significant.
#FedWatch #AlphabetSharesSlide10%InLateTrading #EarningsSeason #BitcoinCoreIdentifiesThreeVulnerabilities
{spot}(ETHUSDT)
{spot}(BTCUSDT)
🚨$BTC : A FAMILIAR 2023 SETUP?
$BTCUSDT weekly RSI trendline has broken and is now being retested, a pattern similar to early 2023.
Could this be the beginning of another major bull run?
$ETH USDT
The next move could be significant.
#FedWatch #AlphabetSharesSlide10%InLateTrading #EarningsSeason #BitcoinCoreIdentifiesThreeVulnerabilities

1
67

{spot}(BTCUSDT)
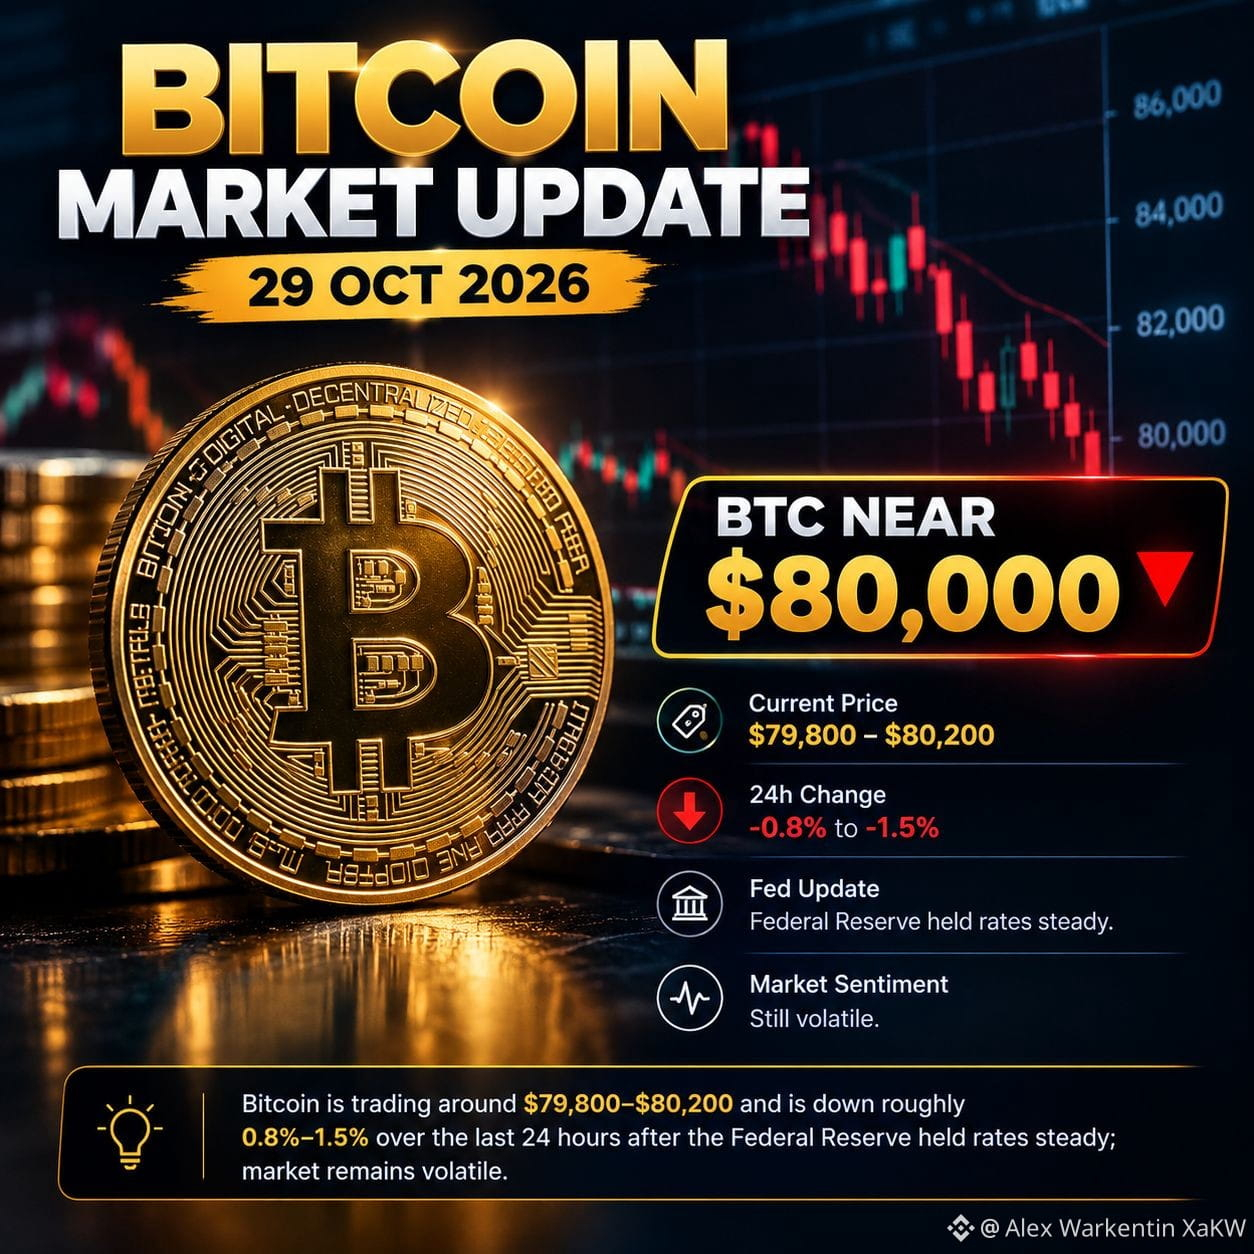
$BTC Bitcoin Latest Analysis — 29 October 2026
Latest market update · BTC/USD
Bitcoin (BTC)
$80,000
Approximate price; down around 0.8%–1.5% over 24 hours.
Market Analysis: Bitcoin is trading near $80,000 as selling pressure continues following the Federal Reserve’s decision to keep interest rates unchanged.
Support: $79,500, then $77,500.
Resistance: $81,400–$82,500.
Bullish scenario: A sustained break above $82,500 could support a recovery.
Bearish scenario: Losing $79,500 could expose Bitcoin to further downside.
Outlook: Short-term sentiment remains cautious. Watch support levels and trading volume before making any decision.
Educational analysis only — not financial advice.
#Bitcoin #BTC #CryptoNews #BitcoinAnalysis #CryptoMarkets #AlphabetSharesSlide10%InLateTrading #FedWatch #EarningsSeason

·
--
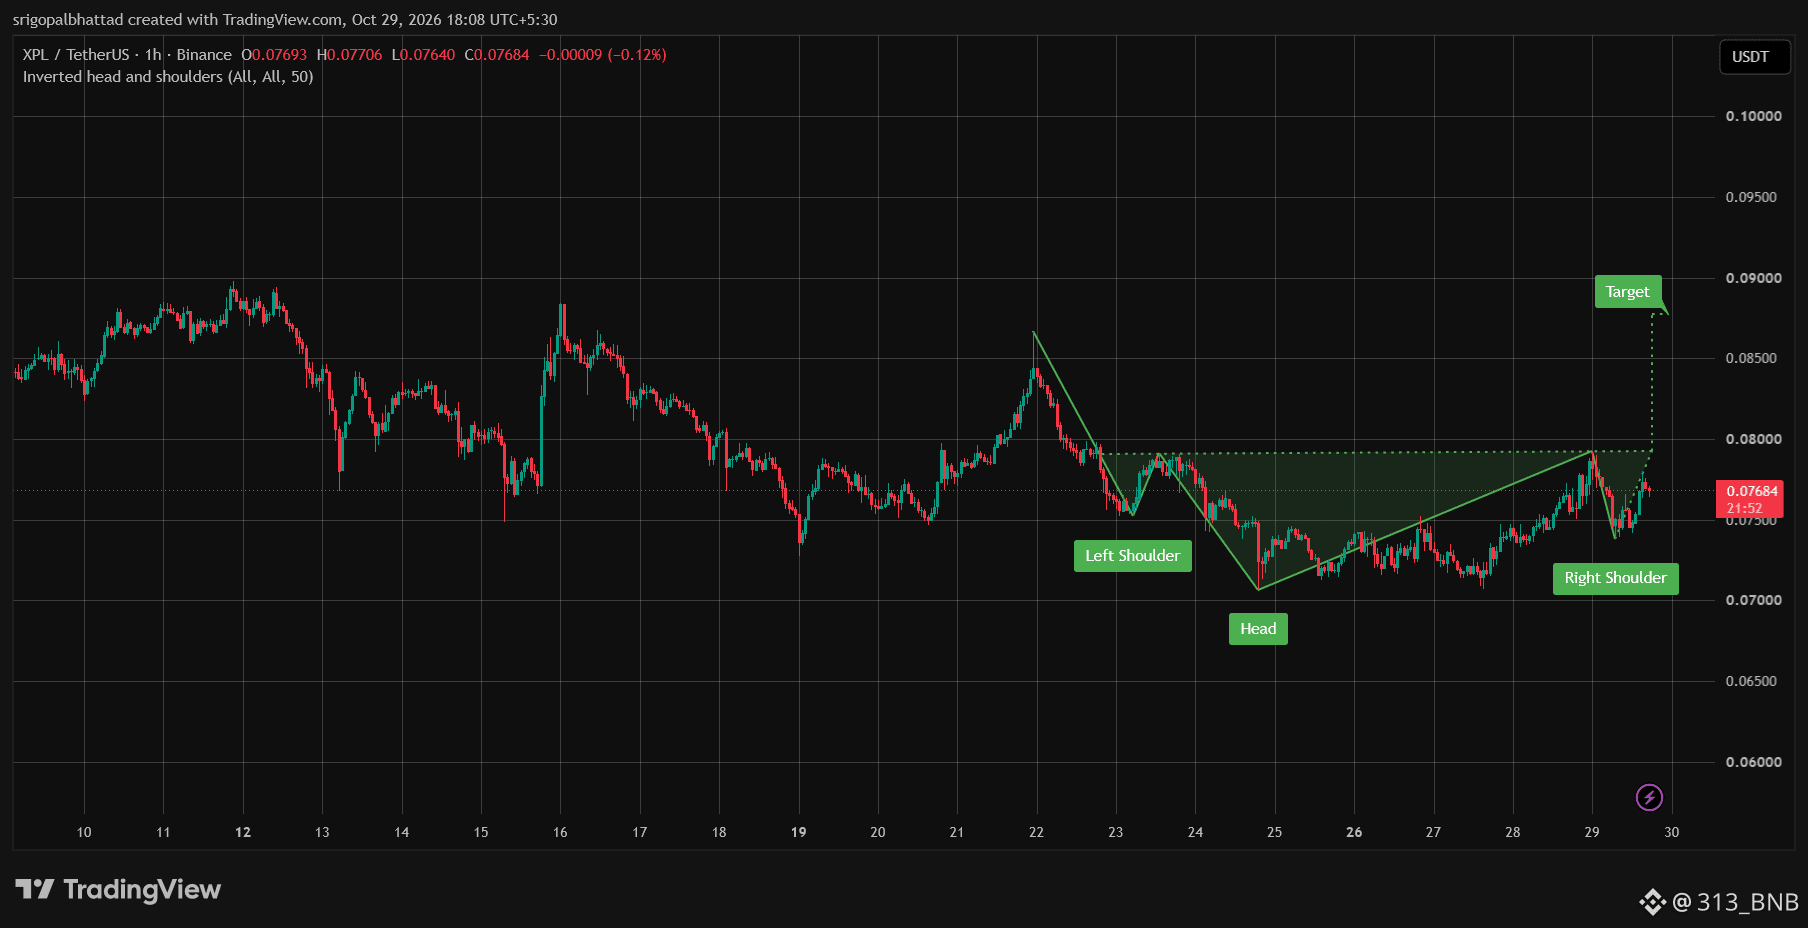
$XPL Inverse Head & Shoulders Signals Bullish Potential!
Price: $0.07684 | 1H Chart
An inverse head & shoulders pattern is forming, hinting at a possible bullish reversal.
Support: $0.070–$0.072
Neckline resistance: $0.079–$0.080
Chart target: ~$0.089
Bullish confirmation: 1H candle close above $0.080
A break below $0.070 could invalidate the setup.
Will $XPL break out toward $0.089? #Write2Earn #Binance #Crypto #FedWatch #AlphabetSharesSlide10%InLateTrading
1
14

·
--
Bullish
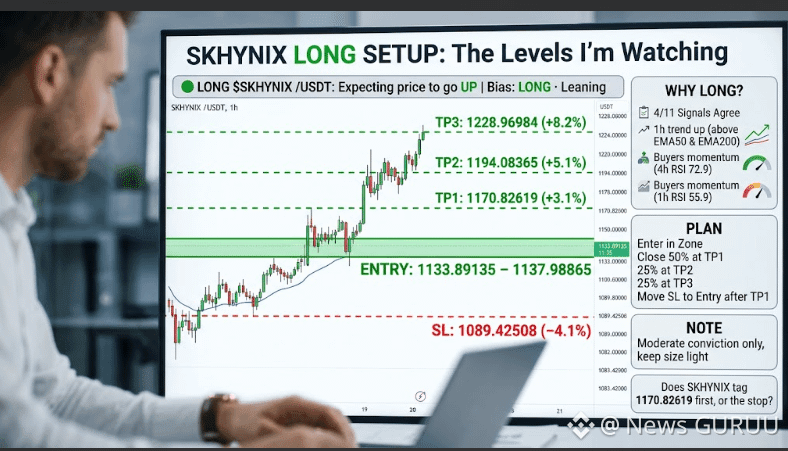
🟢 $SKHYNIX/USDT — LONG SETUP
📍 Entry: 1133.89–1137.99
🎯 TP1: 1170.83 (+3.1%)
🎯 TP2: 1194.08 (+5.1%)
🎯 TP3: 1228.97 (+8.2%)
🛑 Stop-Loss: 1089.43 (-4.1%)
📊 Bias: Bullish, with moderate conviction. 4/11 signals favor LONG, supported by the 1H trend and RSI momentum.
⚠️ Keep position size light and manage risk carefully.
👀 Will $SKHYNIX hit TP1 or the stop-loss first?."CLICK ON THE BELOW YELLOW COIN TAG TO GO TO DESIRED TRADING PAGE TO GET BENEFIT TRADE"$SKHYNIX
{future}(SKHYNIXUSDT)
#SKHYNIX #cryptotrading #FedWatch #RussiaProposedNonCustodialWalletLimitsExcludeIntlSettlements #AlphabetSharesSlide10%InLateTrading
🟢 $SKHYNIX /USDT — LONG SETUP
📍 Entry: 1133.89–1137.99
🎯 TP1: 1170.83 (+3.1%)
🎯 TP2: 1194.08 (+5.1%)
🎯 TP3: 1228.97 (+8.2%)
🛑 Stop-Loss: 1089.43 (-4.1%)
📊 Bias: Bullish, with moderate conviction. 4/11 signals favor LONG, supported by the 1H trend and RSI momentum.
⚠️ Keep position size light and manage risk carefully.
👀 Will $SKHYNIX hit TP1 or the stop-loss first?."CLICK ON THE BELOW YELLOW COIN TAG TO GO TO DESIRED TRADING PAGE TO GET BENEFIT TRADE"$SKHYNIX
#SKHYNIX #cryptotrading #FedWatch #RussiaProposedNonCustodialWalletLimitsExcludeIntlSettlements #AlphabetSharesSlide10%InLateTrading
12
·
--
Bearish
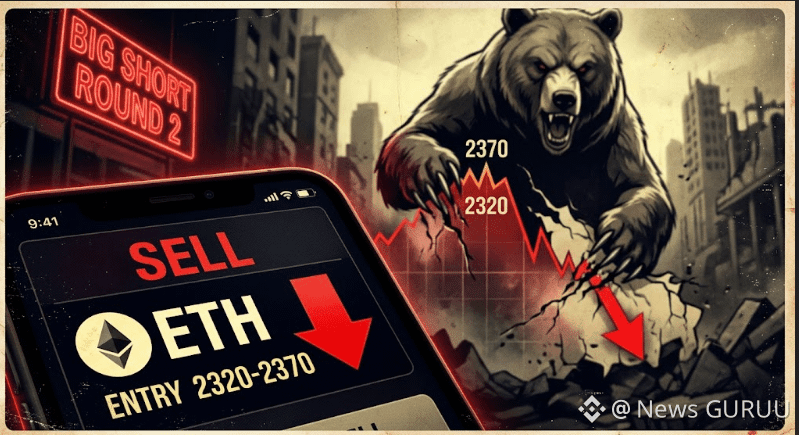
🔴 $ETH — SHORT SETUP: ROUND 2
Another bearish setup on Ethereum! 📉
🎯 Entry Zone: $2,320–$2,370
🔻 Bias: Bearish / Short
Will $ETH move lower from here? 👀."CLICK ON THE BELOW YELLOW COIN TAG TO GO TO DESIRED TRADING PAGE TO GET BENEFIT TRADE"$ETH
#ETH #FedWatch #RussiaProposedNonCustodialWalletLimitsExcludeIntlSettlements #AlphabetSharesSlide10%InLateTrading
{spot}(ETHUSDT)
🔴 $ETH — SHORT SETUP: ROUND 2
Another bearish setup on Ethereum! 📉
🎯 Entry Zone: $2,320–$2,370
🔻 Bias: Bearish / Short
Will $ETH move lower from here? 👀."CLICK ON THE BELOW YELLOW COIN TAG TO GO TO DESIRED TRADING PAGE TO GET BENEFIT TRADE"$ETH
#ETH #FedWatch #RussiaProposedNonCustodialWalletLimitsExcludeIntlSettlements #AlphabetSharesSlide10%InLateTrading
1
23

·
--
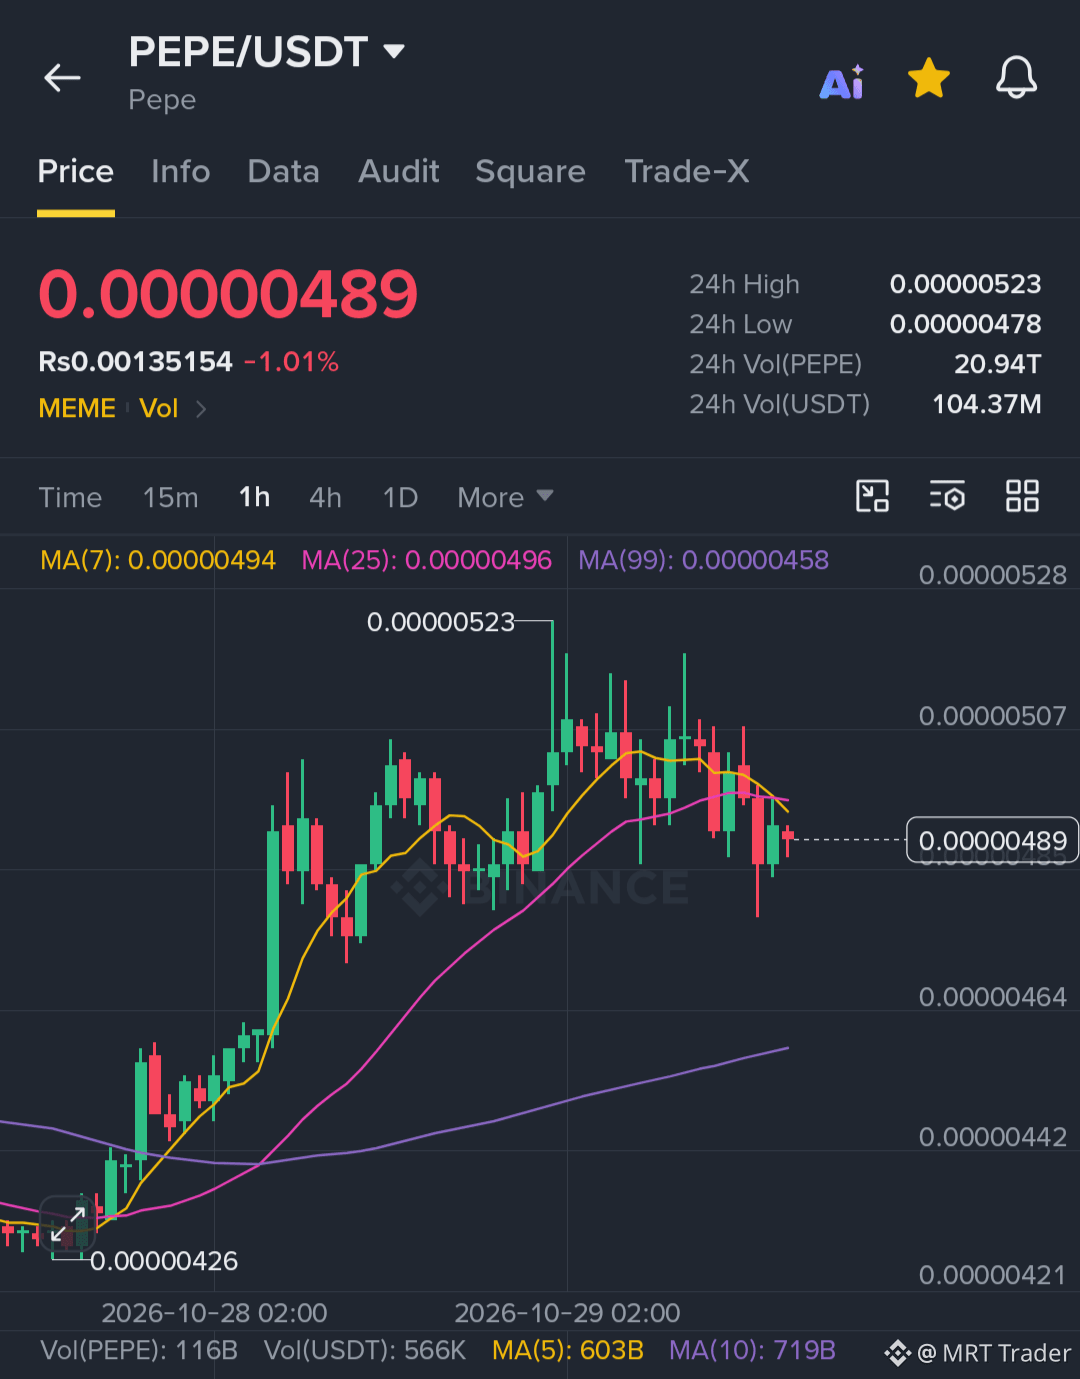
$PEPE is losing its bounce. ❌
Don't catch a falling knife — short the weakness and manage your risk. 📉
Click here to trade now 👉 $PEPE
{spot}(PEPEUSDT)
#PEPE #AlphabetSharesSlide10%InLateTrading #FedWatch
$PEPE is losing its bounce. ❌
Don't catch a falling knife — short the weakness and manage your risk. 📉
Click here to trade now 👉 $PEPE
#PEPE #AlphabetSharesSlide10%InLateTrading #FedWatch
Don't catch a falling knife — short the weakness and manage your risk. 📉
Click here to trade now 👉 $PEPE
#PEPE #AlphabetSharesSlide10%InLateTrading #FedWatch
7

·
--
Bullish
$WIF
🚀 WIF: Short Liquidations Spark Attention — Can Bulls Extend the Move?
WIF registered a short liquidation of $3.7198K at $0.18101, suggesting leveraged short positions were forced out around this level. Short liquidations can accompany upward momentum, but sustained continuation depends on buyers holding key support and overcoming nearby resistance.
🎯 Support: $0.1760 – $0.1790
🚧 Resistance: $0.1840 – $0.1880
🚀 Next Target: $0.1920 – $0.2000
🛡️ Invalidation: A confirmed breakdown below $0.1760.
If WIF reclaims resistance with strong volume, another bullish extension may develop. Failure to hold support could lead to consolidation or a pullback.
Watch the breakout, respect the risk, and trade the confirmation.
$WIF
{future}(WIFUSDT)
#FedWatch #AlphabetSharesSlide10%InLateTrading #Nasdaq100FuturesFall0.9% #BitcoinCore32.1RaisesPeerConnectionLimit #WestpacToCapCryptoPaymentsAtAUD10KPerMonth
$WIF
🚀 WIF: Short Liquidations Spark Attention — Can Bulls Extend the Move?
WIF registered a short liquidation of $3.7198K at $0.18101, suggesting leveraged short positions were forced out around this level. Short liquidations can accompany upward momentum, but sustained continuation depends on buyers holding key support and overcoming nearby resistance.
🎯 Support: $0.1760 – $0.1790
🚧 Resistance: $0.1840 – $0.1880
🚀 Next Target: $0.1920 – $0.2000
🛡️ Invalidation: A confirmed breakdown below $0.1760.
If WIF reclaims resistance with strong volume, another bullish extension may develop. Failure to hold support could lead to consolidation or a pullback.
Watch the breakout, respect the risk, and trade the confirmation.
$WIF
#FedWatch #AlphabetSharesSlide10%InLateTrading #Nasdaq100FuturesFall0.9% #BitcoinCore32.1RaisesPeerConnectionLimit #WestpacToCapCryptoPaymentsAtAUD10KPerMonth
17


·
--
$BEAT supports Web3 gaming rewards, AI-powered music creation, digital entertainment, creator incentives, and community participation. Its ecosystem may benefit from growing interest in blockchain gaming and AI technology. Token buybacks and burns may also help reduce the circulating supply. In my opinion, $BEAT is one of the best coins because of its potential in Web3 gaming, AI-powered music, and digital entertainment. 🚀📈
{alpha}(560xcf3232b85b43bca90e51d38cc06cc8bb8c8a3e36)
#FedWatch #VisaStablecoinSettlementTops$25BAnnualized #WestpacToCapCryptoPaymentsAtAUD10KPerMonth #BitcoinCore32.1RaisesPeerConnectionLimit #AlphabetSharesSlide10%InLateTrading
$BEAT supports Web3 gaming rewards, AI-powered music creation, digital entertainment, creator incentives, and community participation. Its ecosystem may benefit from growing interest in blockchain gaming and AI technology. Token buybacks and burns may also help reduce the circulating supply. In my opinion, $BEAT is one of the best coins because of its potential in Web3 gaming, AI-powered music, and digital entertainment. 🚀📈
#FedWatch #VisaStablecoinSettlementTops$25BAnnualized #WestpacToCapCryptoPaymentsAtAUD10KPerMonth #BitcoinCore32.1RaisesPeerConnectionLimit #AlphabetSharesSlide10%InLateTrading
#FedWatch #VisaStablecoinSettlementTops$25BAnnualized #WestpacToCapCryptoPaymentsAtAUD10KPerMonth #BitcoinCore32.1RaisesPeerConnectionLimit #AlphabetSharesSlide10%InLateTrading

73

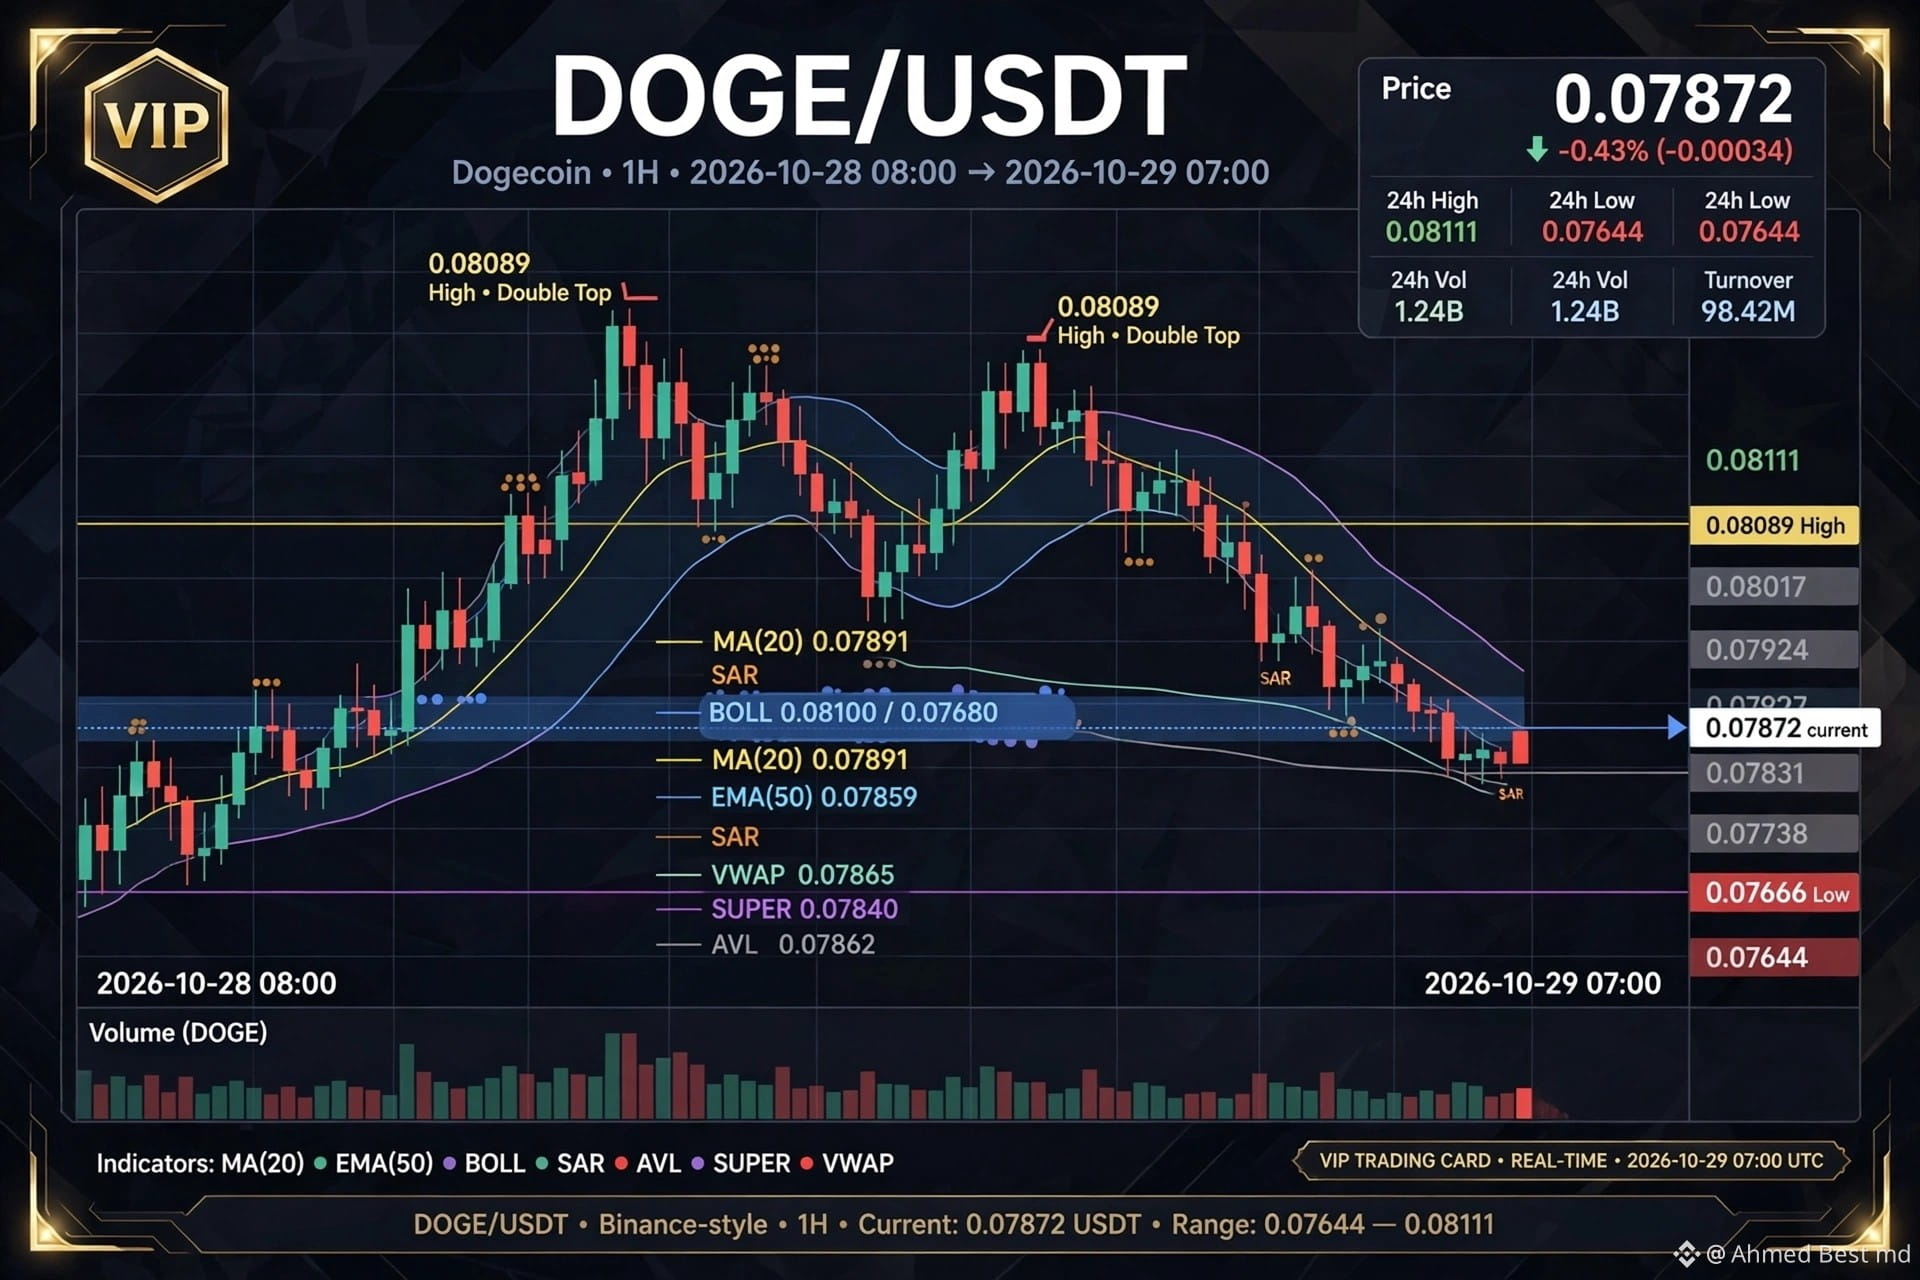
$DOGE stock latest analyse
*0.07872 Rs21.75 -1.24%*
24h High 0.08089 / Low 0.07742 / Vol 327.29M DOGE / 25.84M USDT
*1h Double Top Dump:*
0.07666 low Oct 28 08:00 → 0.08089 High double top = +5.5% pump, then dump to 0.07738 low = -4.33% crash
Now 0.07872 recovering
*Performance:* Today -1.08% / 7D -5.11% / 30D -17.10% / 90D *+11.25% green* / 180D -27.78% / 1Y -60.80% - Only 90D green, long term bear
*Sentiment:* 55.21% Buy vs 44.79% Sell = Bulls still holding MEME
*Indicators on Trading Card:* MA20 0.07891 / EMA50 0.07859 / BOLL 0.08100 / 0.07680 / SAR flip / VWAP 0.07865 / SUPER 0.07840 / AVL 0.07862 - Price just below MA20, testing VWAP
*Strategy:* Double top at 0.08089 confirmed resistance. Support at 0.07738 held. Buy bounce 0.07831-0.07872 with target 0.07924 then 0.08017. Stop below 0.07738. If breaks 0.08089 double top, moon to 0.08111. DOGE MEME volatile - 327M volume strong.
#EarningsSeason #WestpacToCapCryptoPaymentsAtAUD10KPerMonth #AlphabetSharesSlide10%InLateTrading
-🤫
{spot}(DOGEUSDT)
$DOGE stock latest analyse
*0.07872 Rs21.75 -1.24%*
24h High 0.08089 / Low 0.07742 / Vol 327.29M DOGE / 25.84M USDT
*1h Double Top Dump:*
0.07666 low Oct 28 08:00 → 0.08089 High double top = +5.5% pump, then dump to 0.07738 low = -4.33% crash
Now 0.07872 recovering
*Performance:* Today -1.08% / 7D -5.11% / 30D -17.10% / 90D *+11.25% green* / 180D -27.78% / 1Y -60.80% - Only 90D green, long term bear
*Sentiment:* 55.21% Buy vs 44.79% Sell = Bulls still holding MEME
*Indicators on Trading Card:* MA20 0.07891 / EMA50 0.07859 / BOLL 0.08100 / 0.07680 / SAR flip / VWAP 0.07865 / SUPER 0.07840 / AVL 0.07862 - Price just below MA20, testing VWAP
*Strategy:* Double top at 0.08089 confirmed resistance. Support at 0.07738 held. Buy bounce 0.07831-0.07872 with target 0.07924 then 0.08017. Stop below 0.07738. If breaks 0.08089 double top, moon to 0.08111. DOGE MEME volatile - 327M volume strong.
#EarningsSeason #WestpacToCapCryptoPaymentsAtAUD10KPerMonth #AlphabetSharesSlide10%InLateTrading
-🤫

1
2

·
--
Bullish
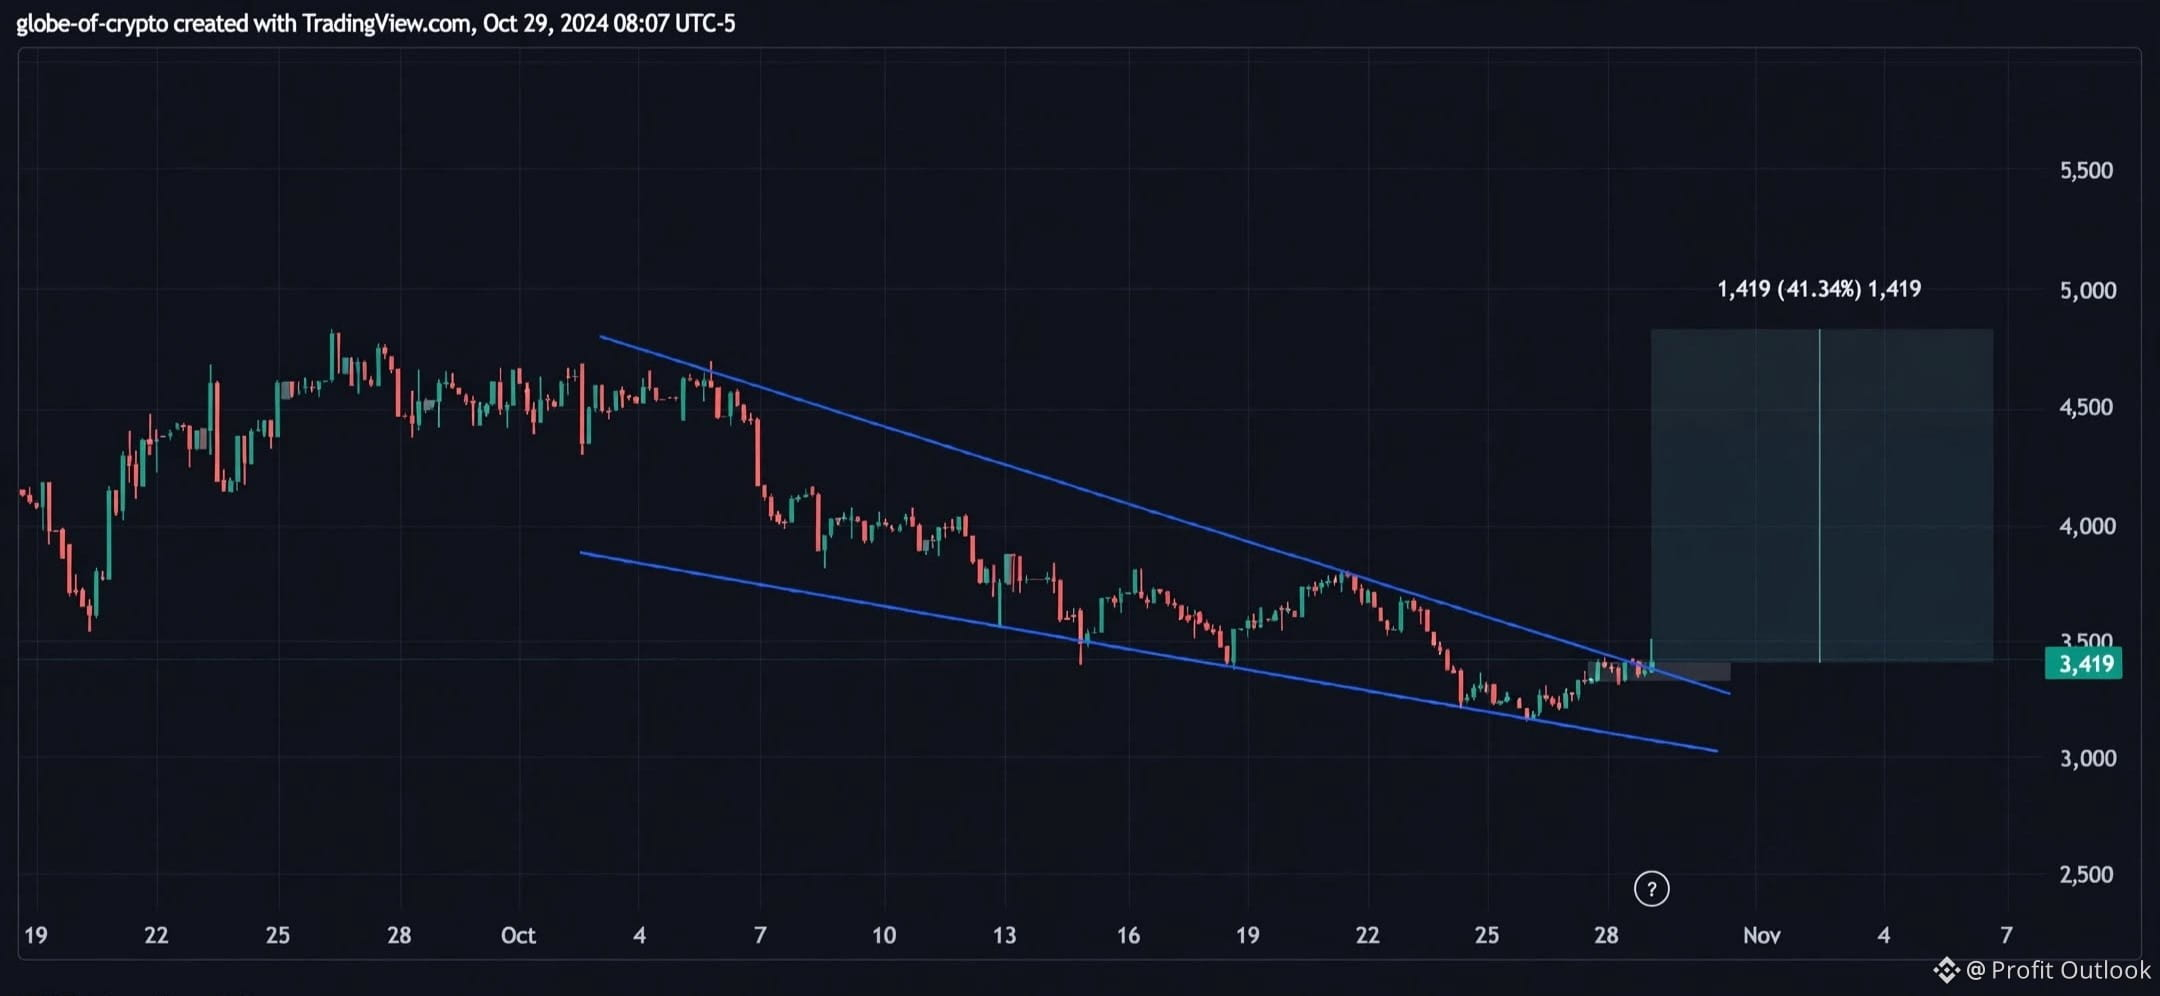
$GENIUS is attempting to break out of a Symmetrical Triangle Pattern.
If the price breaks above the upper resistance with strong trading volume and holds the breakout, it could trigger a powerful bullish rally toward $0.65. 🎯
Keep an eye on breakout confirmation, trading volume, and a possible retest before the next move. $TWT
#FedWatch
#AlphabetSharesSlide10%InLateTrading
1
9
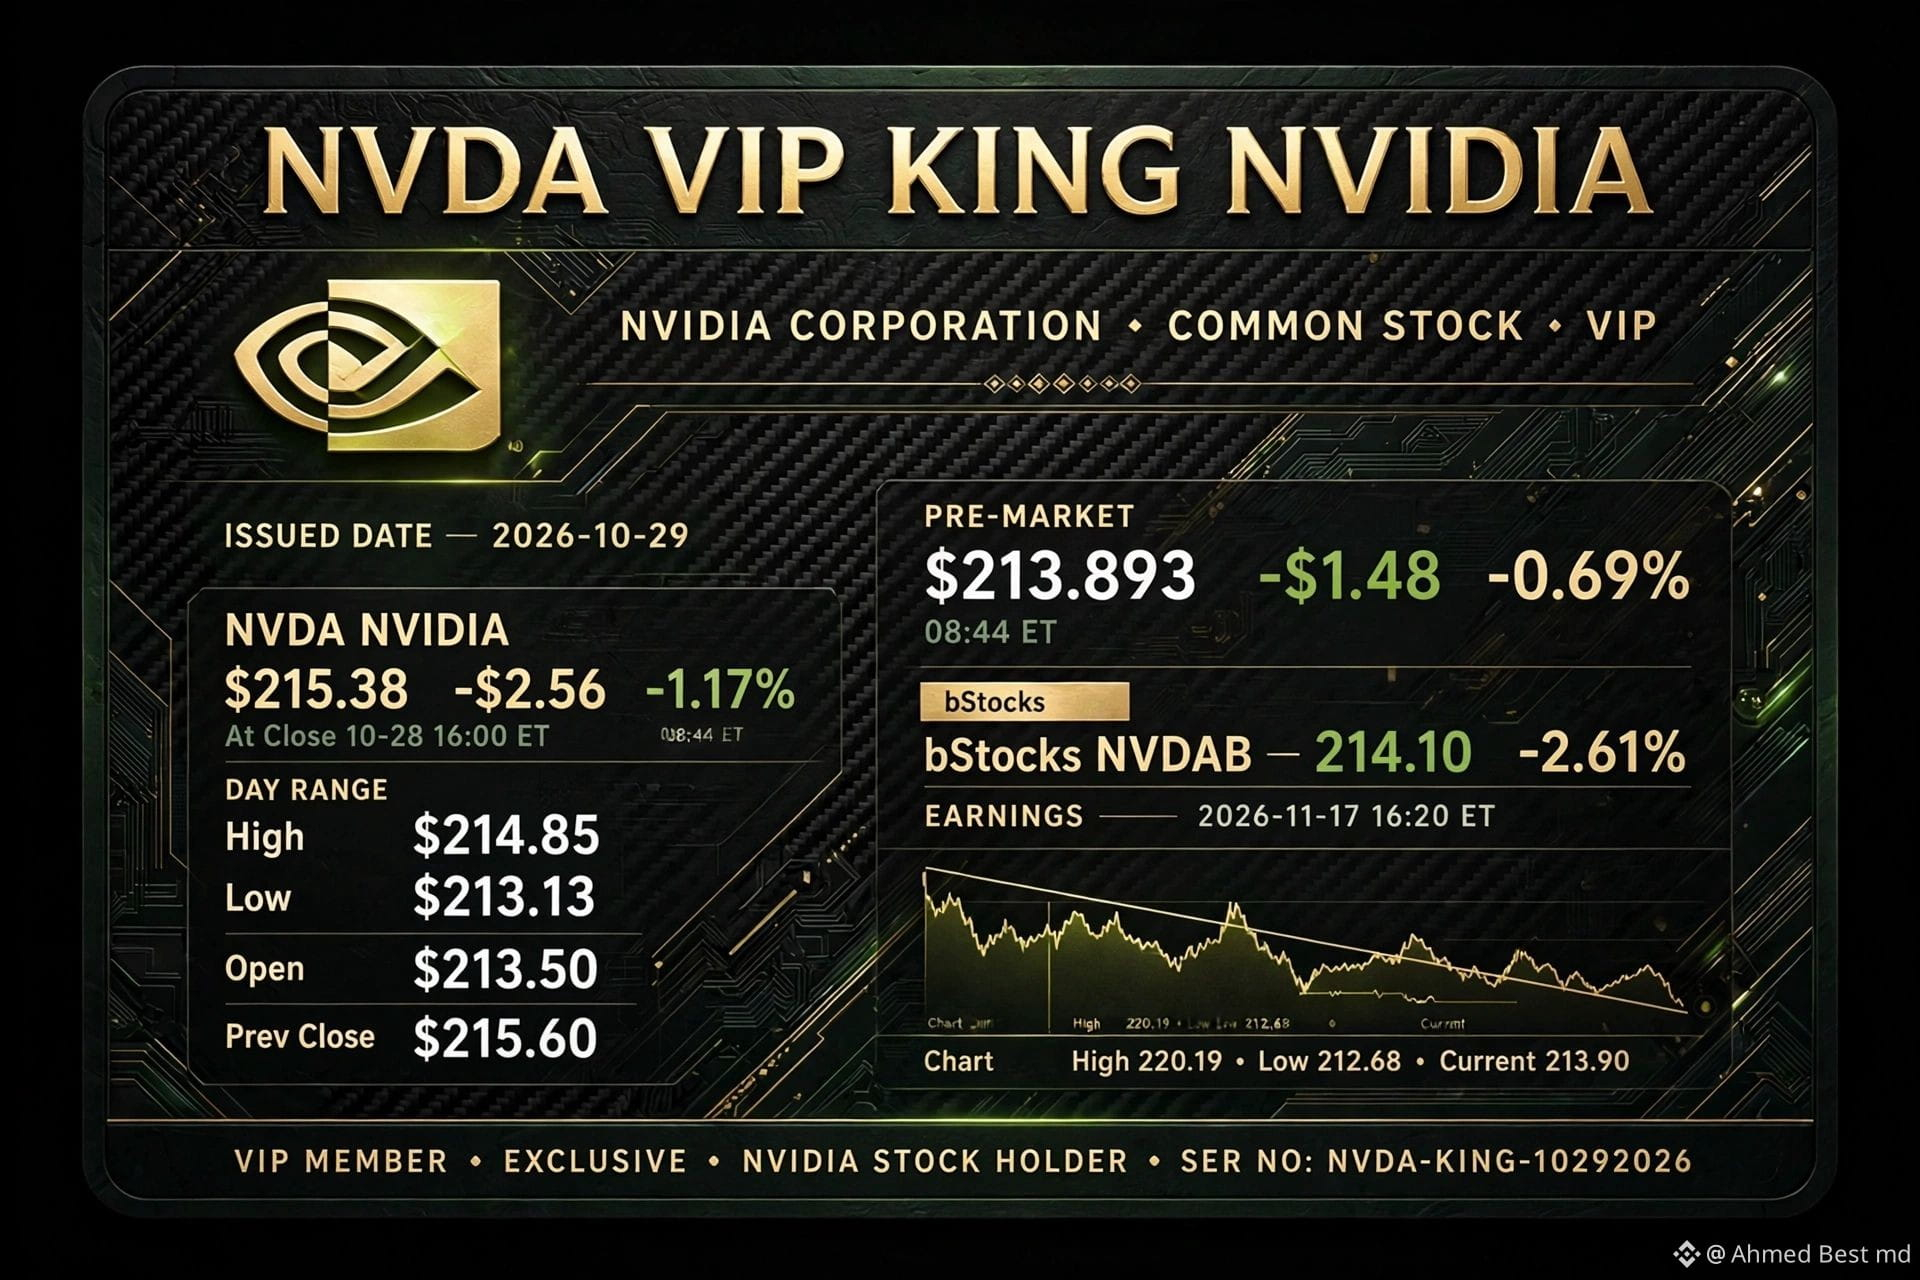
$NVDA stock latest analyse
*$215.38 -$2.56 -1.17% At Close Oct 28 16:00 ET*
High $214.85 / Low $213.13 / Open $213.50 / Prev $215.60
Pre-Mkt $213.893 -$1.48 -0.69% 08:44 ET
bStocks NVDAB 214.10 -2.61%
Earnings: Nov 17 16:20 ET
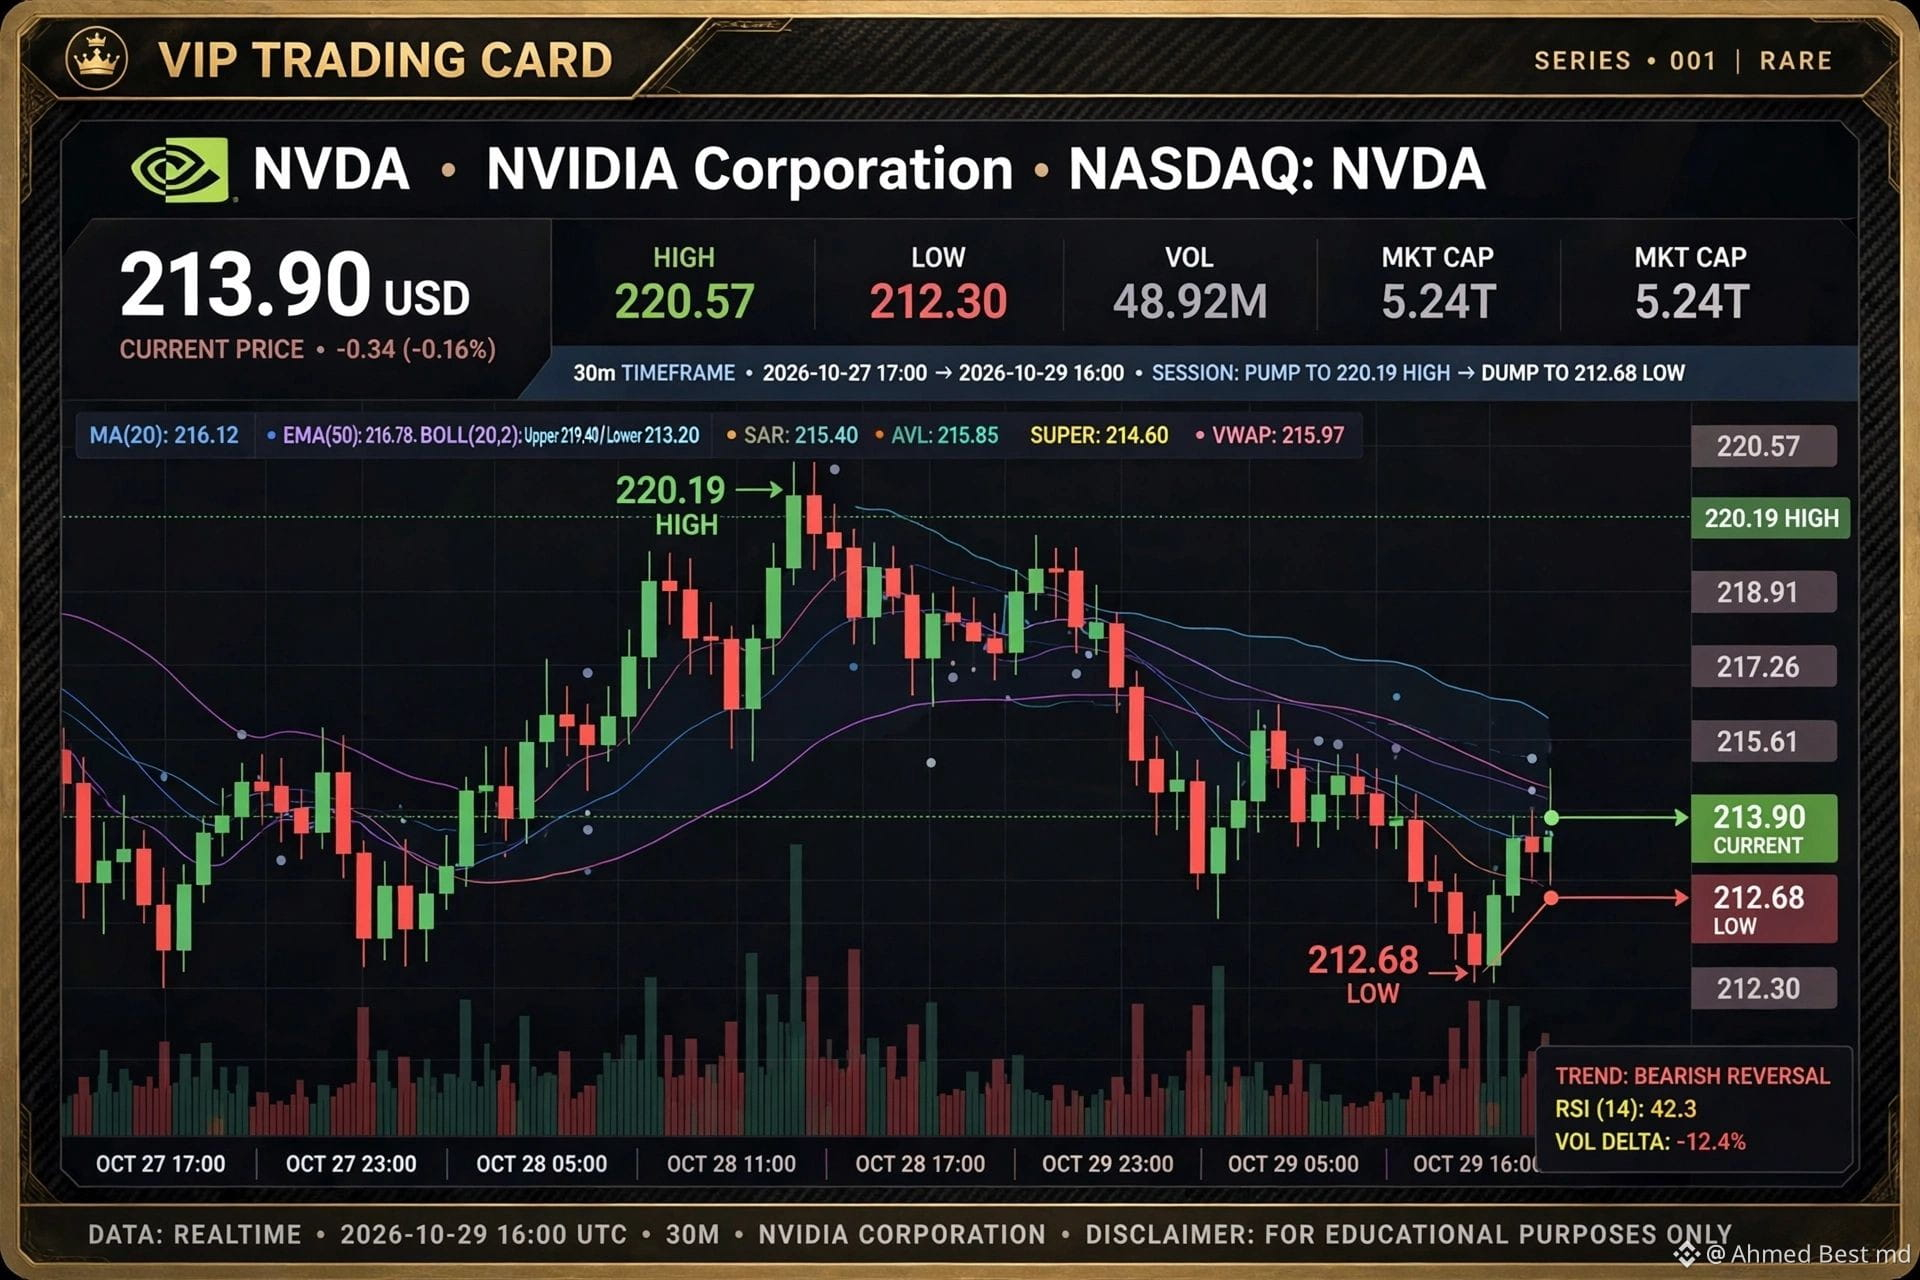
*30m MASSIVE DUMP:*
220.19 High Oct 28 16:30 → 212.68 Low Oct 29 = *-7.51$ (-3.41%) crash*
Current 213.90 bouncing +1.22 from bottom
*Indicators:* MA20 216.12 / EMA50 216.78 / BOLL Upper 219.40 Lower 213.20 / SAR 215.40 / SUPER 214.60 / VWAP 215.97 / AVL 215.85 - Price below all MAs, VWAP = bearish reversal, RSI 42.3
*Strategy:* Double top at 220.19 rejection, huge red volume dump. Capitulation at 212.68 with spike volume. Oversold bounce now. Buy zone 213.50-213.90 with stop below 212.68. Target 215.61 then 217.26 then 218.91. Pre-earnings volatility, wait for hold above 213.90 to confirm bottom.
NVDA AI king correcting before earnings - dip opportunity.
#EarningsSeason #WestpacToCapCryptoPaymentsAtAUD10KPerMonth #AlphabetSharesSlide10%InLateTrading
-🤫
{future}(NVDAUSDT)
$NVDA stock latest analyse
*$215.38 -$2.56 -1.17% At Close Oct 28 16:00 ET*
High $214.85 / Low $213.13 / Open $213.50 / Prev $215.60
Pre-Mkt $213.893 -$1.48 -0.69% 08:44 ET
bStocks NVDAB 214.10 -2.61%
Earnings: Nov 17 16:20 ET
*30m MASSIVE DUMP:*
220.19 High Oct 28 16:30 → 212.68 Low Oct 29 = *-7.51$ (-3.41%) crash*
Current 213.90 bouncing +1.22 from bottom
*Indicators:* MA20 216.12 / EMA50 216.78 / BOLL Upper 219.40 Lower 213.20 / SAR 215.40 / SUPER 214.60 / VWAP 215.97 / AVL 215.85 - Price below all MAs, VWAP = bearish reversal, RSI 42.3
*Strategy:* Double top at 220.19 rejection, huge red volume dump. Capitulation at 212.68 with spike volume. Oversold bounce now. Buy zone 213.50-213.90 with stop below 212.68. Target 215.61 then 217.26 then 218.91. Pre-earnings volatility, wait for hold above 213.90 to confirm bottom.
NVDA AI king correcting before earnings - dip opportunity.
#EarningsSeason #WestpacToCapCryptoPaymentsAtAUD10KPerMonth #AlphabetSharesSlide10%InLateTrading
-🤫
1
3
·
--
Bullish
$IDOL
🔥 IDOL: Liquidation Pressure Builds — Watch the Next Breakout!
IDOL recorded a long liquidation of $1.8152K at $0.01357, putting this price area on the radar. The key question is whether buyers can absorb the selling pressure and establish a stronger base. A recovery above nearby resistance could improve short-term momentum, while a support breakdown may invite further downside.
🎯 Support: $0.0132 – $0.0135
🚧 Resistance: $0.0139 – $0.0143
🚀 Next Target: $0.0146 – $0.0150
🛡️ Risk Level: Watch for a sustained break below $0.0132.
A clean breakout supported by rising volume would strengthen the bullish case. Avoid premature entries and monitor confirmation.
Patience first. Execution second.
$IDOL
{future}(IDOLUSDT)
#FedWatch
#AlphabetSharesSlide10%InLateTrading #Nasdaq100FuturesFall0.9% #BitcoinCore32.1RaisesPeerConnectionLimit #WestpacToCapCryptoPaymentsAtAUD10KPerMonth
$IDOL
🔥 IDOL: Liquidation Pressure Builds — Watch the Next Breakout!
IDOL recorded a long liquidation of $1.8152K at $0.01357, putting this price area on the radar. The key question is whether buyers can absorb the selling pressure and establish a stronger base. A recovery above nearby resistance could improve short-term momentum, while a support breakdown may invite further downside.
🎯 Support: $0.0132 – $0.0135
🚧 Resistance: $0.0139 – $0.0143
🚀 Next Target: $0.0146 – $0.0150
🛡️ Risk Level: Watch for a sustained break below $0.0132.
A clean breakout supported by rising volume would strengthen the bullish case. Avoid premature entries and monitor confirmation.
Patience first. Execution second.
$IDOL
#FedWatch
#AlphabetSharesSlide10%InLateTrading #Nasdaq100FuturesFall0.9% #BitcoinCore32.1RaisesPeerConnectionLimit #WestpacToCapCryptoPaymentsAtAUD10KPerMonth
89
·
--
Bullish
$BABY
🚀 BABY: Critical Support Test — Bulls Preparing for a Comeback?
BABY is drawing attention after a long liquidation of $1.0168K at $0.01339. This indicates leveraged long exposure was liquidated at that price, highlighting an important area to monitor. Bulls need to defend nearby support and build momentum before another upward move becomes convincing.
🎯 Support: $0.0130 – $0.0133
🚧 Resistance: $0.0138 – $0.0142
🚀 Next Target: $0.0145 – $0.0150
🛡️ Invalidation: Sustained weakness below $0.0130.
A confirmed reclaim of resistance could open the door to a stronger recovery. Watch volume and price confirmation before entering.
Stay disciplined. Let the market confirm the setup.
$BABY
{future}(BABYUSDT)
#FedWatch #AlphabetSharesSlide10%InLateTrading #Nasdaq100FuturesFall0.9% #BitcoinCore32.1RaisesPeerConnectionLimit #WestpacToCapCryptoPaymentsAtAUD10KPerMonth
$BABY
🚀 BABY: Critical Support Test — Bulls Preparing for a Comeback?
BABY is drawing attention after a long liquidation of $1.0168K at $0.01339. This indicates leveraged long exposure was liquidated at that price, highlighting an important area to monitor. Bulls need to defend nearby support and build momentum before another upward move becomes convincing.
🎯 Support: $0.0130 – $0.0133
🚧 Resistance: $0.0138 – $0.0142
🚀 Next Target: $0.0145 – $0.0150
🛡️ Invalidation: Sustained weakness below $0.0130.
A confirmed reclaim of resistance could open the door to a stronger recovery. Watch volume and price confirmation before entering.
Stay disciplined. Let the market confirm the setup.
$BABY
#FedWatch #AlphabetSharesSlide10%InLateTrading #Nasdaq100FuturesFall0.9% #BitcoinCore32.1RaisesPeerConnectionLimit #WestpacToCapCryptoPaymentsAtAUD10KPerMonth
19

·
--
Follow-for-follow campaign! Whoever follows me, I'll follow back within 10 seconds so we can all reach 1,000 followers. It's a journey for all of us—let's go! 🫡🫡
$AAPLB #FedWatch #Nasdaq100FuturesFall0.9% #AlphabetSharesSlide10%InLateTrading #EarningsSeason #AlphabetSharesSlide10%InLateTrading
Follow-for-follow campaign! Whoever follows me, I'll follow back within 10 seconds so we can all reach 1,000 followers. It's a journey for all of us—let's go! 🫡🫡
$AAPLB #FedWatch #Nasdaq100FuturesFall0.9% #AlphabetSharesSlide10%InLateTrading #EarningsSeason #AlphabetSharesSlide10%InLateTrading
$AAPLB #FedWatch #Nasdaq100FuturesFall0.9% #AlphabetSharesSlide10%InLateTrading #EarningsSeason #AlphabetSharesSlide10%InLateTrading
1
4
Log in to explore more content
Join global crypto users on Binance Square
⚡️ Get latest and useful information about crypto.
💬 Trusted by the world’s largest crypto exchange.
👍 Discover real insights from verified creators.
Email / Phone number
Trending Topics
1
#FedWatch
16.1M views
37,888 Discussing
2
#RussiaProposedNonCustodialWalletLimitsExcludeIntlSettlements
5 views
12 Discussing
3
#AlphabetSharesSlide10%InLateTrading
195 views
35 Discussing
4
#Nasdaq100FuturesFall0.9%
2,650 views
112 Discussing
5
#BitcoinCore32.1RaisesPeerConnectionLimit
19,402 views
451 Discussing
6
#VisaStablecoinSettlementTops$25BAnnualized
313 views
18 Discussing
7
#WestpacToCapCryptoPaymentsAtAUD10KPerMonth
5,620 views
143 Discussing
8
#RussiaPlansStandardizedTestForCryptoInvestors
7,338 views
166 Discussing
9
#EarningsSeason
6.2M views
30,799 Discussing
10
#BitcoinCoreIdentifiesThreeVulnerabilities
24,132 views
433 Discussing