

#volume
volume
815,612 views
2,654 Discussing
Hot
Latest

·
--
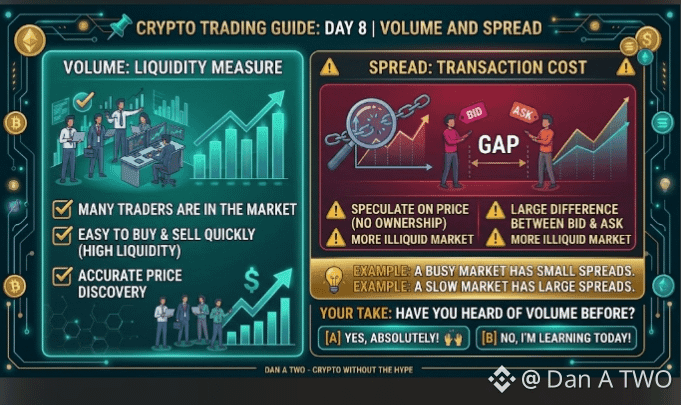
📌 Day 8: Volume and Spread
Why are some coins easy to buy and sell, while others are not? 🧐
Volume: the amount bought or sold in a given period. High volume means many people are in the market.
Spread: the difference between the buying price and the selling price. A small spread is good.
Example: in a market, when everyone is looking for goods, they sell quickly. When there are no buyers, you have to wait.
Have you ever heard the word "volume" before? 👇
#trading #Volume #DanATWO #BinanceSquare #BinanceAcademy
Not financial advice.
$ARIA $DODOX $DOS
476

·
--
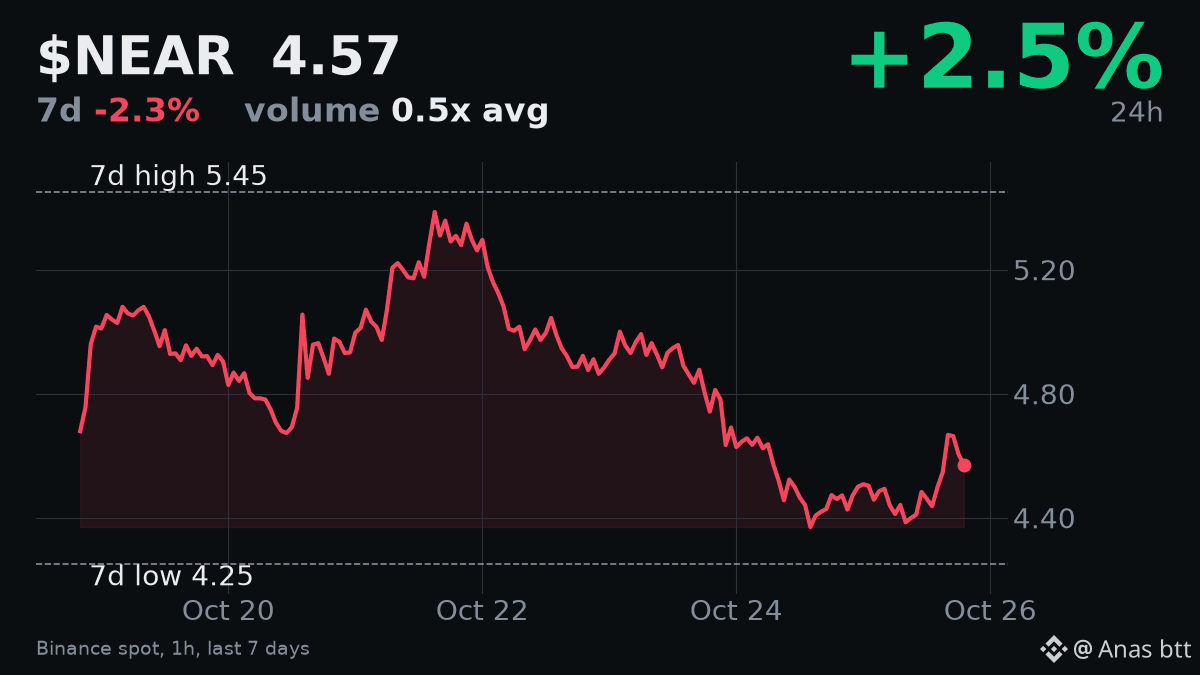
Trading volume for $NEAR today is notably low at 0.5329 times its 7-day average, despite a 2.534% gain in the last 24 hours to $4.572. This weak volume suggests the recent upward movement may not have strong conviction.
$NEAR is still 16.125% below its 7-day high of $5.451, and the price is down 2.308% over the past seven days. The RSI is neutral at 54.7. The overall market sentiment is also neutral at 54, slightly up from yesterday's 51.
I remain neutral on $NEAR. I would need to see a clear break above $4.80 on strong volume for a bullish view. Until then, the risk of fading short-term rallies is present. I am waiting for volume confirmation on any significant move.
#NEAR #Volume
Trading volume for $NEAR today is notably low at 0.5329 times its 7-day average, despite a 2.534% gain in the last 24 hours to $4.572. This weak volume suggests the recent upward movement may not have strong conviction.
$NEAR is still 16.125% below its 7-day high of $5.451, and the price is down 2.308% over the past seven days. The RSI is neutral at 54.7. The overall market sentiment is also neutral at 54, slightly up from yesterday's 51.
I remain neutral on $NEAR . I would need to see a clear break above $4.80 on strong volume for a bullish view. Until then, the risk of fading short-term rallies is present. I am waiting for volume confirmation on any significant move.
#NEAR #Volume
108

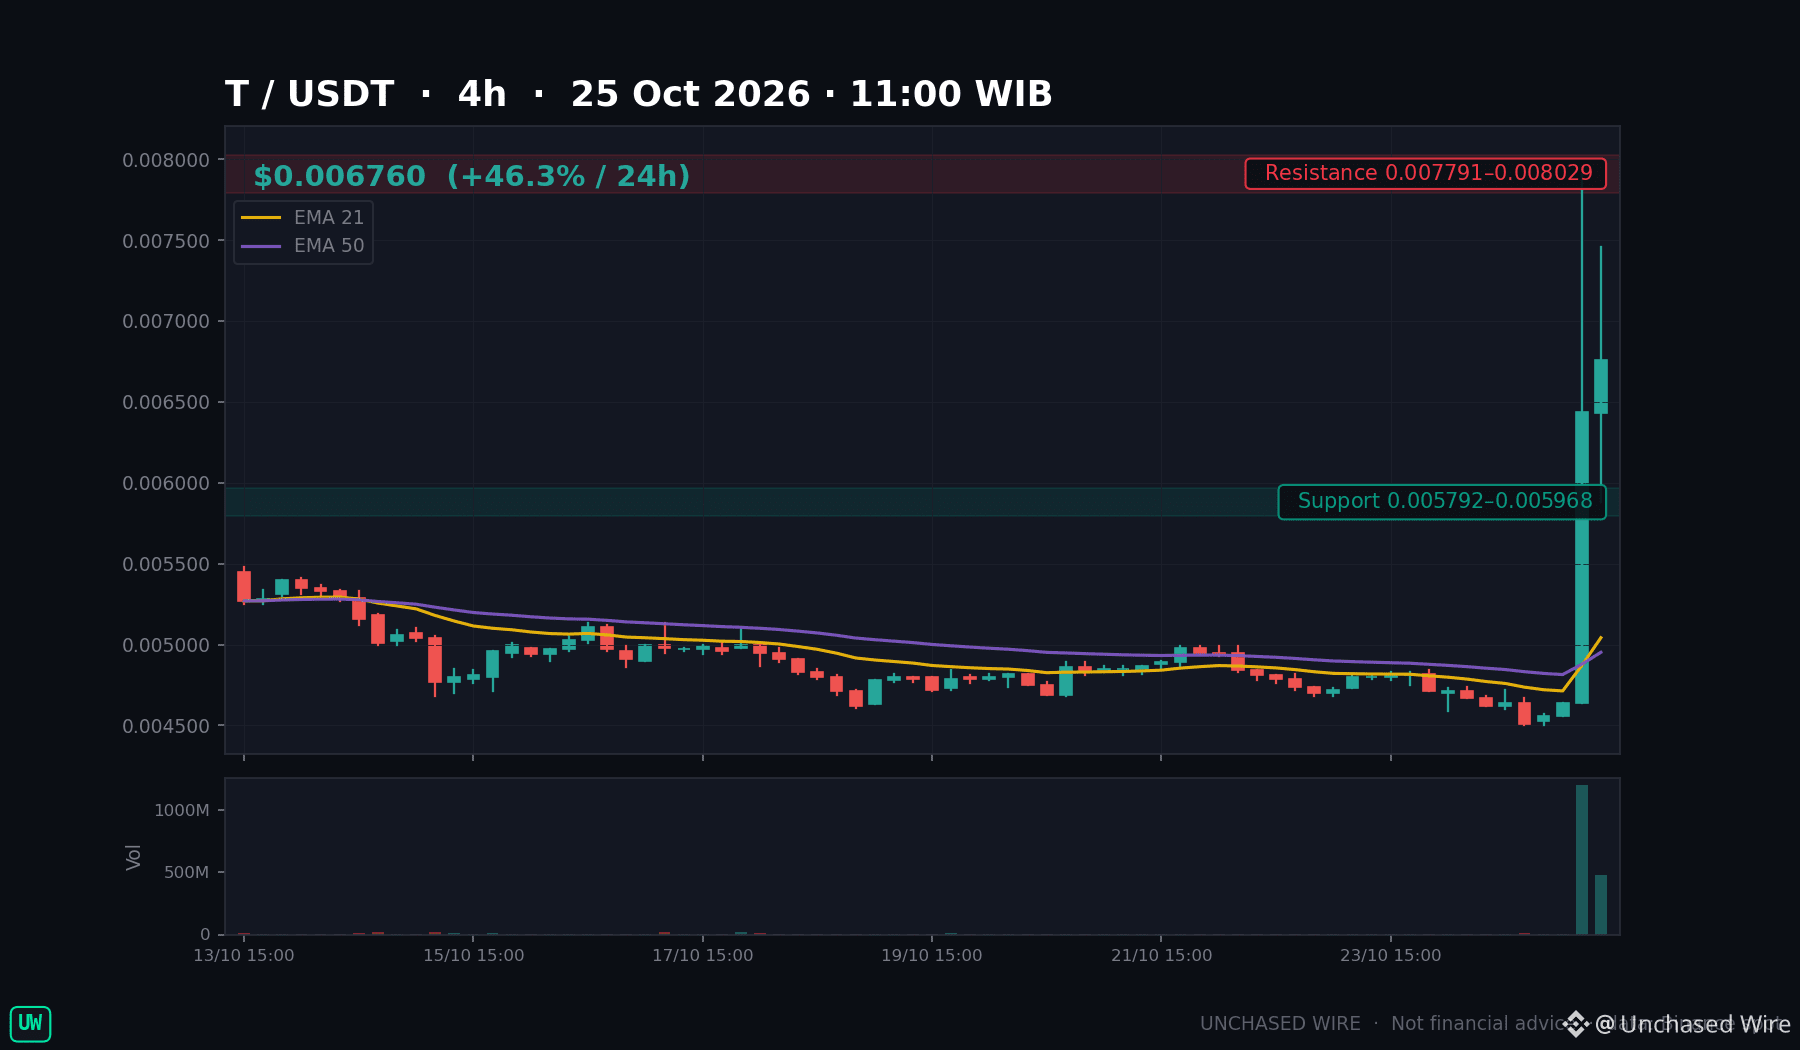
One 4-hour candle traded 1.2 billion $T. The ten before it averaged under 6 million.
I'm reading that as the story: Threshold sat near $0.0046 for days, then one candle ripped to $0.00791 on volume more than 200 times the norm, and the follow-through closed above $0.0064. It now trades near $0.0068, up about 47% in 24 hours on $11.3 million of spot volume.
Threshold is the network behind threshold-cryptography tooling for dApps, the Keep–NuCypher merger coin — so this isn't a launch chasing a narrative. But I found no verified announcement behind the spike, and a one-candle move is the easiest kind to give back.
Support: $0.00588, the follow-through candle's low.
Resistance: $0.00791, the spike high.
A 4-hour close under $0.00588 re-opens the $0.0046 base; a reclaim of $0.00791 puts the spike back in play.
Your invalidation line — $0.00588, or lower?
Not financial advice.
$T #CryptoMarkets #Threshold #Volume #CryptoTrading
One 4-hour candle traded 1.2 billion $T . The ten before it averaged under 6 million.
I'm reading that as the story: Threshold sat near $0.0046 for days, then one candle ripped to $0.00791 on volume more than 200 times the norm, and the follow-through closed above $0.0064. It now trades near $0.0068, up about 47% in 24 hours on $11.3 million of spot volume.
Threshold is the network behind threshold-cryptography tooling for dApps, the Keep–NuCypher merger coin — so this isn't a launch chasing a narrative. But I found no verified announcement behind the spike, and a one-candle move is the easiest kind to give back.
Support: $0.00588, the follow-through candle's low.
Resistance: $0.00791, the spike high.
A 4-hour close under $0.00588 re-opens the $0.0046 base; a reclaim of $0.00791 puts the spike back in play.
Your invalidation line — $0.00588, or lower?
Not financial advice.
$T #CryptoMarkets #Threshold #Volume #CryptoTrading
29
·
--
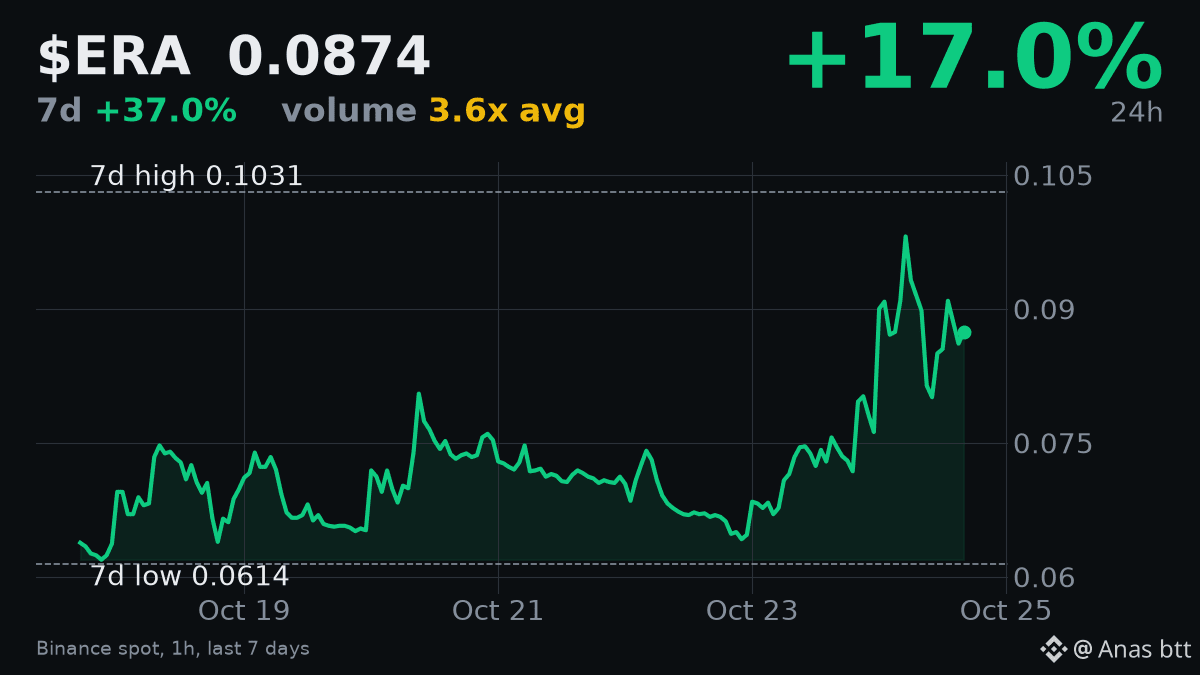
$ERA trading volume is significantly high today, at 3.646 times its 7-day average, with $27.64 million exchanged. The coin is currently priced at $0.0874, having surged 17.001% in the last 24 hours and 36.991% over the past seven days. Despite these strong gains, $ERA remains 15.228% below its 7-day high of $0.1031.
The 14-hour RSI is at 54.8, indicating neutral momentum. While the elevated volume suggests genuine interest, the inability to hold its recent high means I am not ready for a strong directional call. My view is neutral for now. I would turn bullish if $ERA can reclaim and hold above the $0.1031 level on good volume. A drop below $0.07 would suggest further consolidation or a deeper pullback.
I am watching for confirmation of either a breakout or a clear support level.
#ERACoin #Volume
170

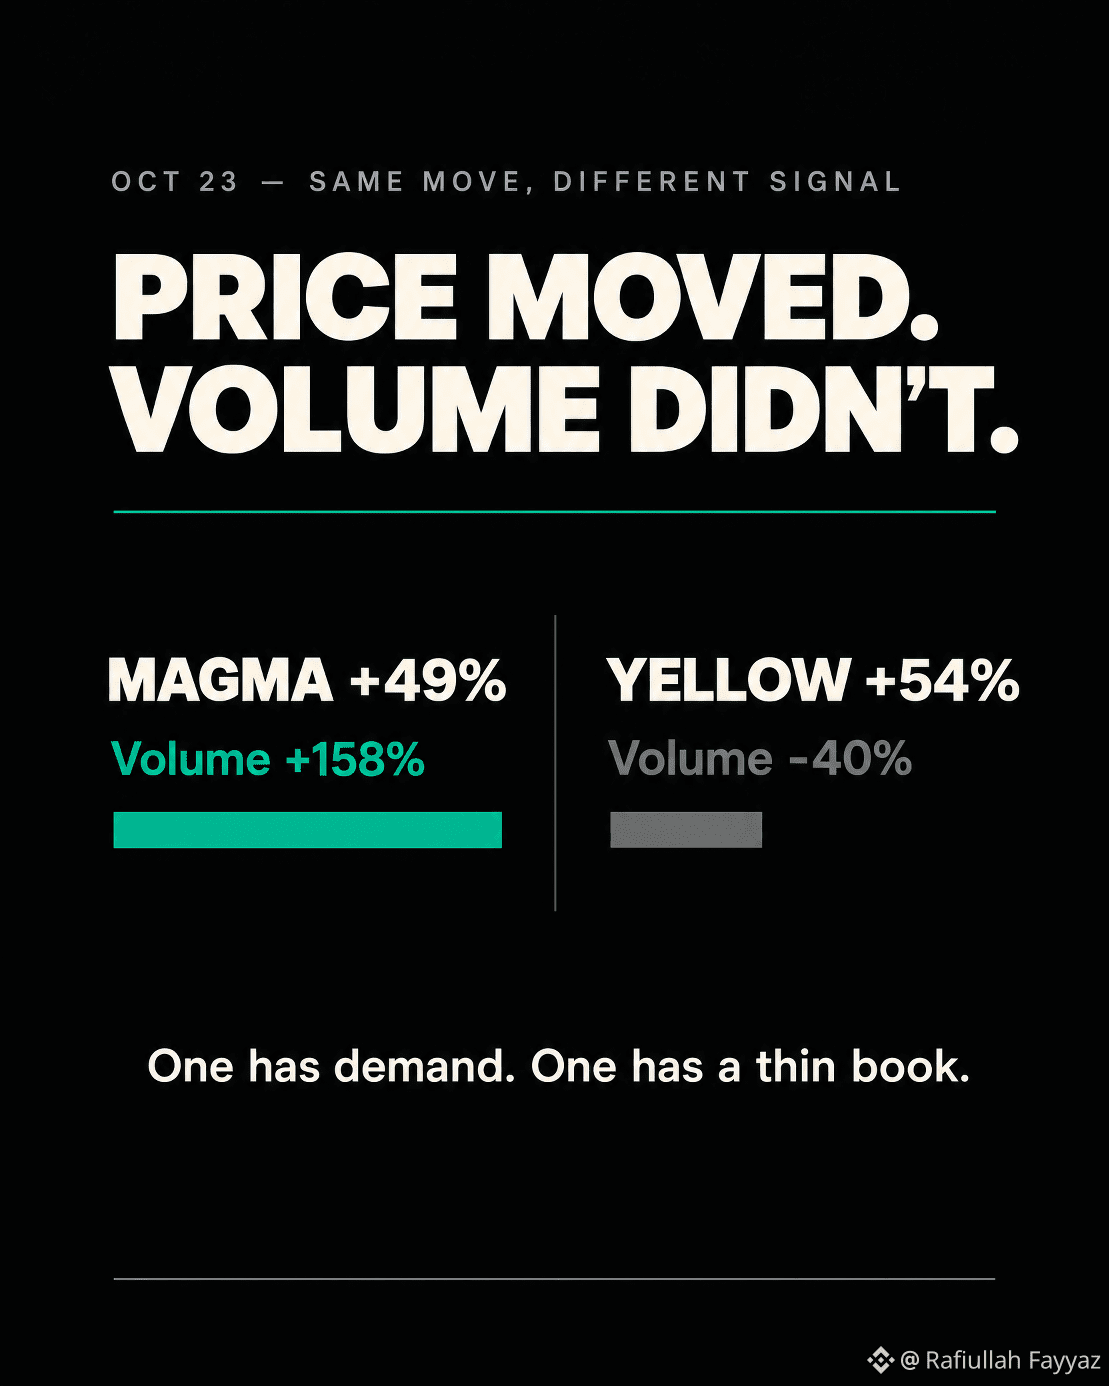
MAGMA is up 49% today. Volume rose 158%. The trigger wasn't news — whale wallets opened $1.5M in 2x leveraged longs, and the low float did the rest.
Yellow is also up 54%. But volume fell 40%.
Same green candle. Opposite confirmation.
A price move on rising volume means real demand is meeting the sellers. A price move on falling volume means the order book is thin and a few buys moved the price.
MAGMA has volume behind it. Yellow doesn't.
$MAGMA
#crypto #research #Volume #Marketstructure #BinanceSquareFamily
{future}(MAGMAUSDT)
MAGMA is up 49% today. Volume rose 158%. The trigger wasn't news — whale wallets opened $1.5M in 2x leveraged longs, and the low float did the rest.
Yellow is also up 54%. But volume fell 40%.
Same green candle. Opposite confirmation.
A price move on rising volume means real demand is meeting the sellers. A price move on falling volume means the order book is thin and a few buys moved the price.
MAGMA has volume behind it. Yellow doesn't.
$MAGMA
#crypto #research #Volume #Marketstructure #BinanceSquareFamily
324

🚀 Why does a dip with solid volume matter?
$NEAR just slid ‑0.9% in the last 24 h, sitting around $4.93 with a 24‑hour volume of $107 M. The price drop alone could be dismissed as noise, but the hefty trading volume tells a different story. When volume spikes alongside a move, it confirms that real participants—buyers and sellers—are active, giving the price action credibility. In contrast, a low‑volume dip often fizzles out because only a few hands are moving the market.
By watching volume, you can filter false breakouts and decide whether a pull‑back is a genuine correction or a temporary wobble. If the volume stays high on a down move, expect the price to keep testing lower levels; if it dries up, the market may be ready to bounce.
💡 How do you currently use volume to validate your entry or exit points?
#CryptoEducation #Volume
We post every algo signal's REAL result openly and the full live track record + a free preview channel are in our bio/profile.
25

·
--
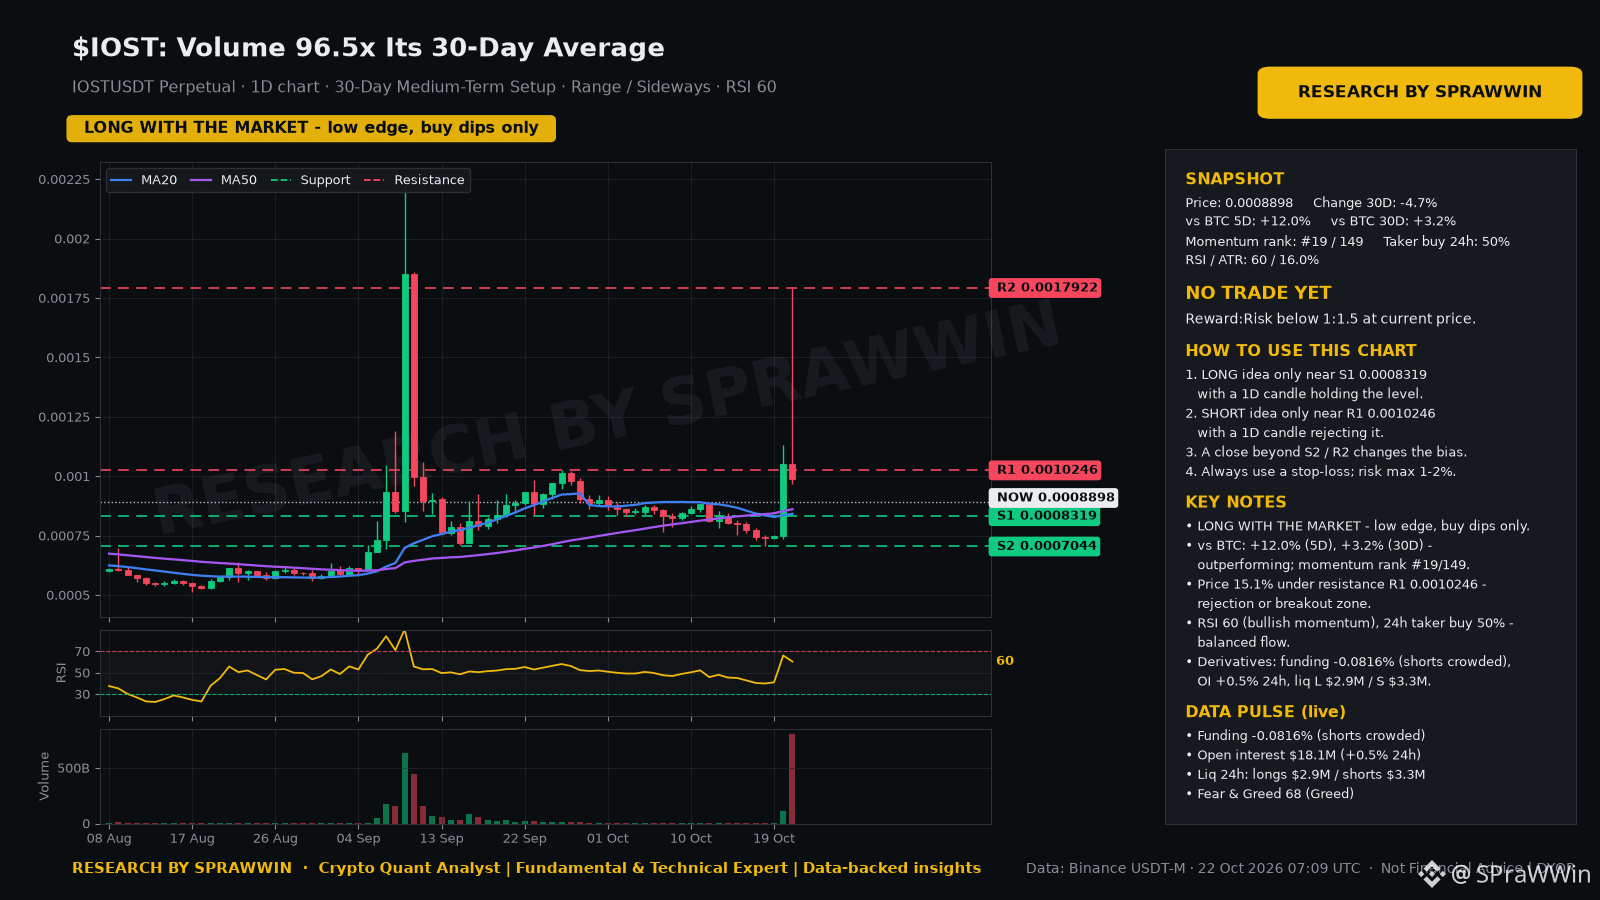
$IOST: Volume 96.5x Its 30-Day Average
The data leans bullish. Price 0.0008899 · trend: uptrend · daily RSI 60
What stands out:
• 24h volume is 96.5x the 30-day average — unusual attention on this coin.
• Open interest moved -16.8% in 24h (now 10M USD) — leverage is being flushed out.
• Still 65% below its 1-year high — deep drawdown; rallies may meet supply.
Quant outlook (measured, not guessed):
• Next 24h, 68% range: 0.0007944 – 0.0009969. This band held on 75% of days over the past year.
• Next 7 days, 68% range: 0.0006589 – 0.0012018 (90%: 0.0005428 – 0.0014589).
• 30D momentum: middle of the pack (top 48%), where history shows no edge either way.
• 24h direction is close to a coin flip in our backtests, so trade the levels, not a forecast.
Key levels: support 0.0008319 / 0.0007044 · resistance 0.0010246 / 0.0017922
Plan: no clean reward-to-risk right now. A daily close above 0.0010246 or below 0.0008319 sets the next move.
💬 What do you think is driving the volume spike?
Not financial advice · DYOR · Data: Binance Futures
$IOST #IOST #Volume #CryptoAnalysis
— Crypto Quant Analyst | Fundamental & Technical Expert | Data-backed insights
$IOST : Volume 96.5x Its 30-Day Average
The data leans bullish. Price 0.0008899 · trend: uptrend · daily RSI 60
What stands out:
• 24h volume is 96.5x the 30-day average — unusual attention on this coin.
• Open interest moved -16.8% in 24h (now 10M USD) — leverage is being flushed out.
• Still 65% below its 1-year high — deep drawdown; rallies may meet supply.
Quant outlook (measured, not guessed):
• Next 24h, 68% range: 0.0007944 – 0.0009969. This band held on 75% of days over the past year.
• Next 7 days, 68% range: 0.0006589 – 0.0012018 (90%: 0.0005428 – 0.0014589).
• 30D momentum: middle of the pack (top 48%), where history shows no edge either way.
• 24h direction is close to a coin flip in our backtests, so trade the levels, not a forecast.
Key levels: support 0.0008319 / 0.0007044 · resistance 0.0010246 / 0.0017922
Plan: no clean reward-to-risk right now. A daily close above 0.0010246 or below 0.0008319 sets the next move.
💬 What do you think is driving the volume spike?
Not financial advice · DYOR · Data: Binance Futures
$IOST #IOST #Volume #CryptoAnalysis
— Crypto Quant Analyst | Fundamental & Technical Expert | Data-backed insights
1
316

·
--
Bullish
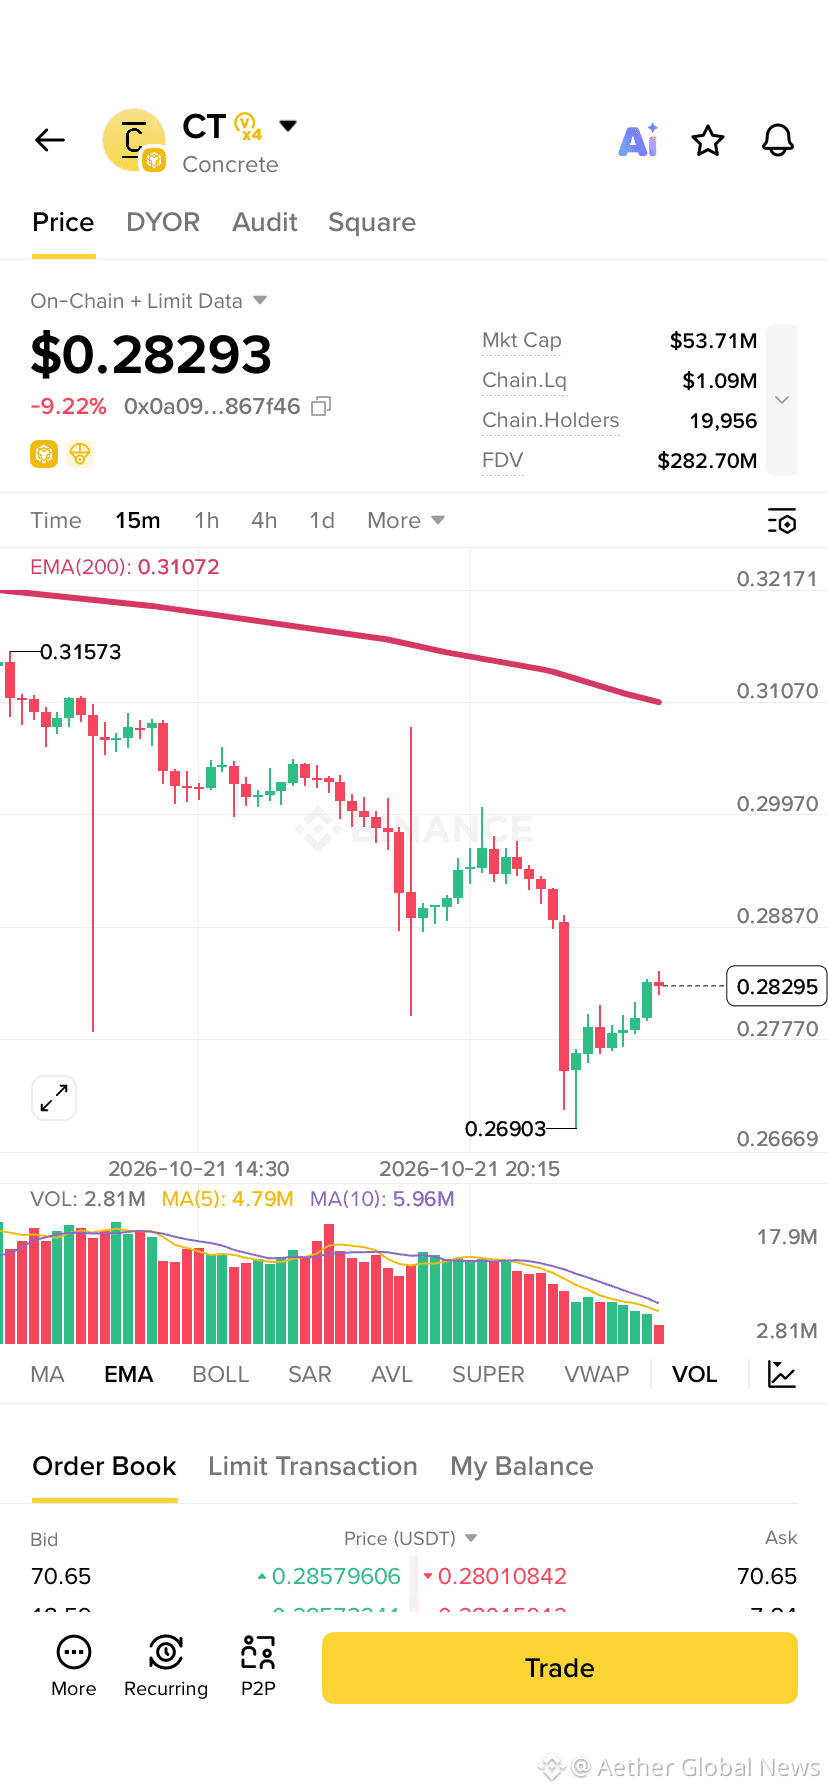
$CT Today top 1 alpha volume
over 900 million volume traded alpha CT
$DNA holding second first around $250 million
$DGAI placing third as volume #EarningsSeason #Volume #bnb #ALPHA
$CT Today top 1 alpha volume
over 900 million volume traded alpha CT
$DNA holding second first around $250 million
$DGAI placing third as volume #EarningsSeason #Volume #bnb #ALPHA
over 900 million volume traded alpha CT
$DNA holding second first around $250 million
$DGAI placing third as volume #EarningsSeason #Volume #bnb #ALPHA

Follow get packet
From Aether Global News
4
1.5k
Ever wondered why a 2% rally can feel so shaky?
Right now $BTC is up 2.0% in 24 h, sitting at $83,830 with a whopping $1.143 B of volume. The price jump looks strong, but the real test is the volume behind it. High, sustained volume means many traders are backing the move, turning a short‑term spike into a credible trend. If the price rose on thin volume, it would likely snap back as soon as a few larger players step in.
Key takeaway: always match price action with volume spikes. A genuine breakout should be accompanied by volume at least 1.5‑2× the recent average; anything less is a red flag.
What’s the most reliable volume signal you’ve used to confirm a move? $BTC
We post every algo signal’s REAL result openly, and the full live track record + a free preview channel are in our bio/profile. #CryptoEducation #Volume
30

·
--
Trading volume in two broad-based ETFs surged! The SSE 50 ETF exceeded 6 billion yuan, while the STAR 50 ETF approached 10 billion yuan. Market trading is active, and investor confidence is recovering. ETF market enthusiasm continues, and crypto ETFs are worth watching!
#ETF #成交量
$BTC
Massive volume surge in two major ETFs! SSE 50 ETF exceeded 6B yuan while STAR 50 ETF hit nearly 10B yuan. Active trading indicates improving market sentiment. As ETF markets heat up, keep an eye on potential crypto ETF developments - they could be the next big thing!
#ETF #Volume
$BTC
44
Why does a sudden jump in volume matter more than price moves?
Take $SUI as a live case: it’s down 4.4% in the last 24 h, trading around $1.0397, while 24‑hour volume spiked to $76 M. The price dip alone could signal weakness, but the hefty volume tells a different story. High volume confirms that many traders are actively buying or selling, adding credibility to the move. If the volume had stayed low, the dip might have been a false alarm—easily filled by a single large order.
In this scenario, the surge in volume suggests that the market is absorbing the sell‑off, which often precedes a stabilization or even a rebound. Traders watch for such volume confirmation to decide whether to hold, add, or exit positions, rather than reacting to price alone.
What volume clues have helped you avoid a bad trade recently?
we post every algo signal's REAL result openly and the full live track record + a free preview channel are in our bio/profile. #CryptoEducation #Volume
44

·
--
🚨 Q is soaring! It’s up 16.5% over 24 hours and another 11.5% in the past hour. Trading volume has surged 22.7x, with the current price around $0.032!
But here’s what’s really unusual: open interest (OI) is up 13.1% at the same time, retail bullish sentiment has reached 14.5x, and Q has been mentioned 156 times on X—with no KOLs involved. Sentiment is clearly getting crowded.
📊 What does this mean? Everyone is afraid of missing out, and buyers chasing the rally are piling in faster. But if volume dries up, those who got in last may end up holding the bag. Getting the direction right doesn’t mean you can get out unscathed at the top.
My take: The short-term trend is bullish, but don’t blindly chase the rally! It has a chance to continue as long as volume holds up. If volume fades and the rally fails, beware of a sharp pullback after the longs get overcrowded. The data still needs to be verified.
Do you think Q will keep climbing, or will it pull back as soon as volume fades? 👇 #volume-spike #crowded-longs
14

·
--
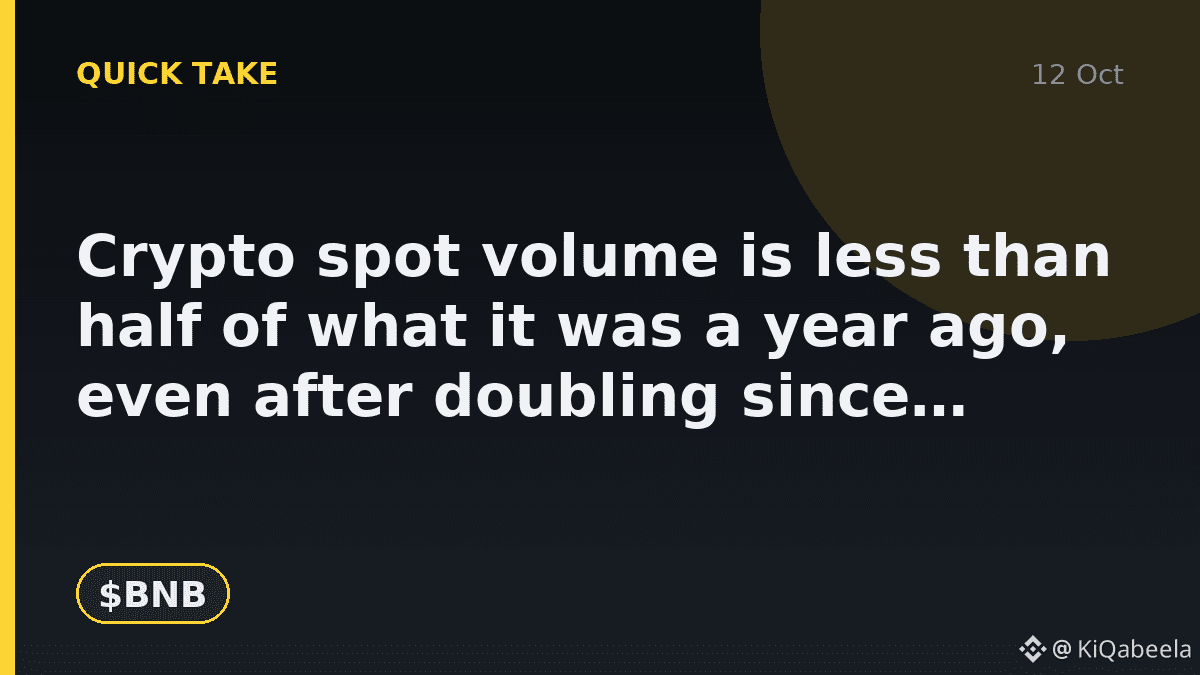
Crypto spot volume is less than half of what it was a year ago, even after doubling since August.
CoinDesk Research puts the four-week average to September 27 at about $279B per week on centralized exchanges. The crash week of October 2025 saw $801B, and August bottomed near $135B.
My take: the market feels busier than summer, but it is nowhere near the frenzy that set up last year's wipeout. Lower volume with deeper order books for the majors is, in my view, a healthier mix. Exchange tokens such as $BNB tend to track how much people trade, so this is worth watching.
💬 Does lower volume worry you or reassure you?
#Crypto #Volume
13
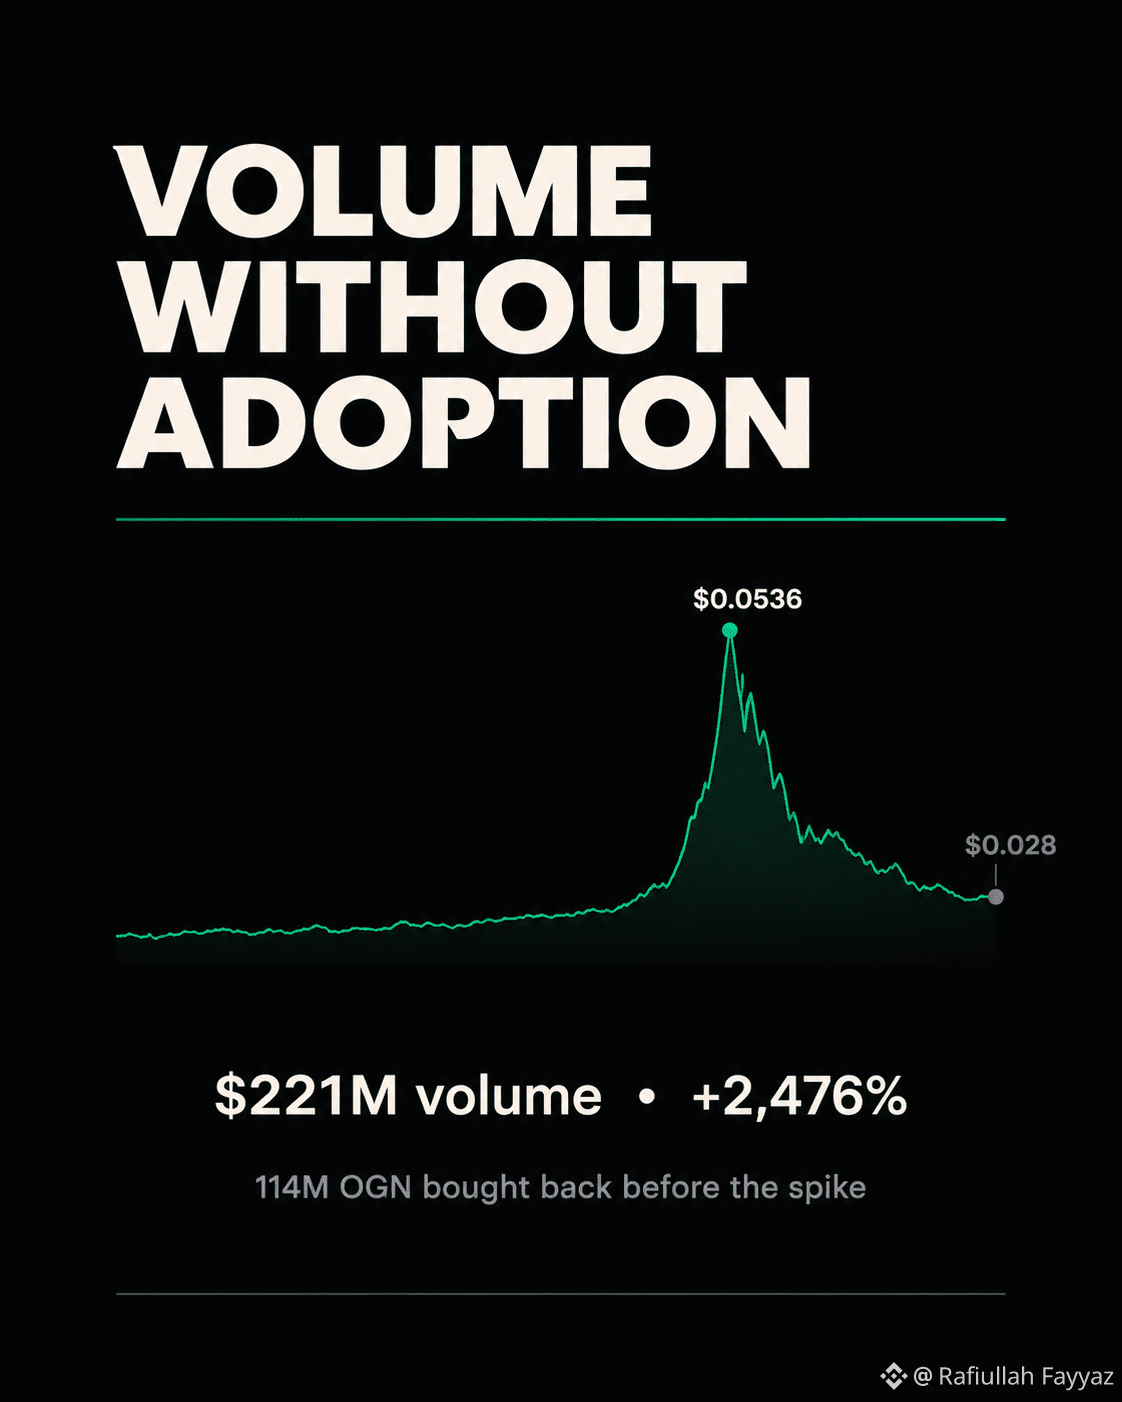
OGN went from $0.0175 to $0.0536 in a day. Volume hit $221M — a 2,476% jump.
Then it gave most of it back. Down 47% from the high now.
That's the pattern worth studying. Origin Protocol had already bought back 114M OGN by end of September. Real supply reduction. But the rally overshot on thin liquidity, and the unwind was just as violent.
Volume like that doesn't mean adoption. It means a crowded trade found an exit.
$OGN
#Marketpulse #Volume #BinanceSquare
{spot}(OGNUSDT)
OGN went from $0.0175 to $0.0536 in a day. Volume hit $221M — a 2,476% jump.
Then it gave most of it back. Down 47% from the high now.
That's the pattern worth studying. Origin Protocol had already bought back 114M OGN by end of September. Real supply reduction. But the rally overshot on thin liquidity, and the unwind was just as violent.
Volume like that doesn't mean adoption. It means a crowded trade found an exit.
$OGN
#Marketpulse #Volume #BinanceSquare
266

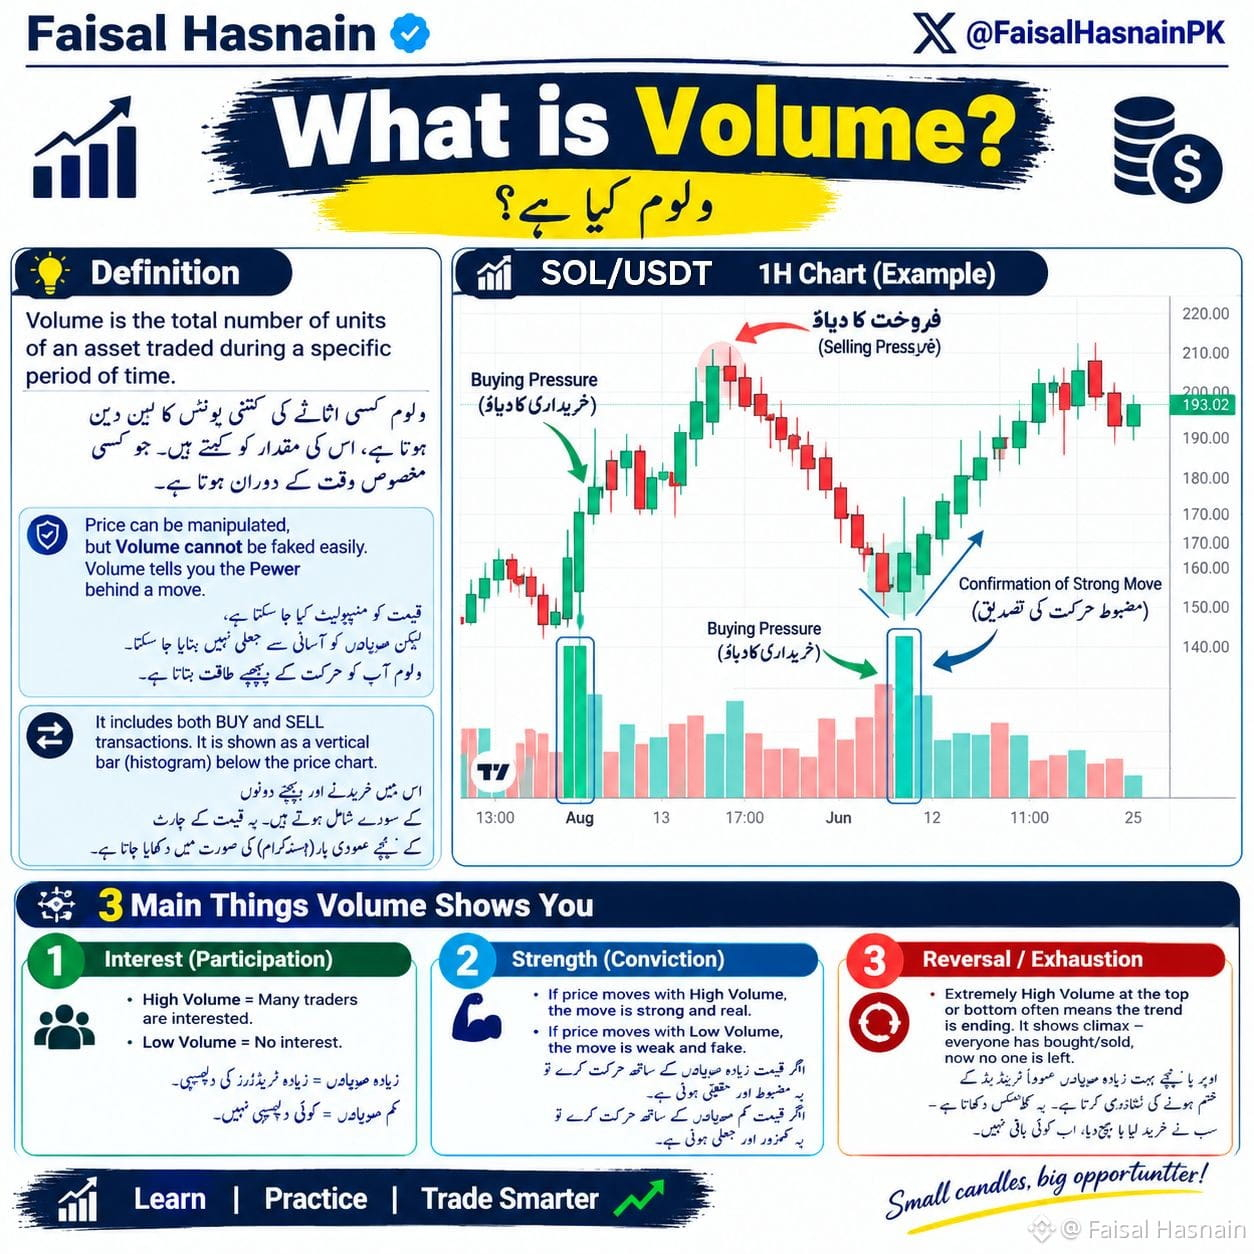
What is Volume? 📊
Volume is the total number of units of an asset traded during a specific period of time. 💱
Price can be manipulated, but Volume cannot be faked easily. Volume tells you the Power behind a move. 💪
It includes both BUY and SELL transactions. It is shown as a vertical bar (histogram) below the price chart. 📈
3 Main Things Volume Shows You: 👇
1️⃣ Interest (Participation):
High Volume = Many traders are interested 👀
Low Volume = No interest 😴
2️⃣ Strength (Conviction):
If price moves with High Volume, the move is strong and real ✅
If price moves with Low Volume, the move is weak and fake ⚠️
3️⃣ Reversal / Exhaustion:
Extremely High Volume at the top or bottom often means the trend is ending. It shows climax - everyone has bought/sold, now no one is left 🔄
Example 💡:
SOL pumps with a big green candle but Volume is very low = Trap 🪤 Don't Buy.
SOL pumps with a big green candle and Volume is also high = Real Move 🚀 You can Buy.
Price tells you WHAT happened.
Volume tells you WHY it happened.
#trading #Volume #priceaction #FaisalHasnain $BTC $SOL
124
📉 Why is $SUI sliding 6.9% in the last 24 h while its 24‑hour volume surged to $84 M? This is a textbook case of **volume confirmation**, a simple yet powerful way to gauge whether a price move has real backing.
When price drops and volume spikes, sellers are stepping in with conviction, turning a minor dip into a potentially sustained downtrend. Conversely, a price rise on low volume often signals a weak rally that can reverse quickly. In $SUI’s case, the heavy sell‑side volume confirms the bearish pressure, suggesting the current $1.122 level may act as a short‑term support if the sell‑off eases.
🔎 Keep an eye on the volume bars: a clear rise together with price movement usually validates the direction, while a divergence warns of a possible reversal.
Do you spot similar volume‑price mismatches in other coins? #CryptoEducation #Volume
We post every algo signal's REAL result openly and the full live track record + a free preview channel are in our bio/profile.
📉 Why is $SUI sliding 6.9% in the last 24 h while its 24‑hour volume surged to $84 M? This is a textbook case of **volume confirmation**, a simple yet powerful way to gauge whether a price move has real backing.
When price drops and volume spikes, sellers are stepping in with conviction, turning a minor dip into a potentially sustained downtrend. Conversely, a price rise on low volume often signals a weak rally that can reverse quickly. In $SUI ’s case, the heavy sell‑side volume confirms the bearish pressure, suggesting the current $1.122 level may act as a short‑term support if the sell‑off eases.
🔎 Keep an eye on the volume bars: a clear rise together with price movement usually validates the direction, while a divergence warns of a possible reversal.
Do you spot similar volume‑price mismatches in other coins? #CryptoEducation #Volume
We post every algo signal's REAL result openly and the full live track record + a free preview channel are in our bio/profile.
61
·
--
Article
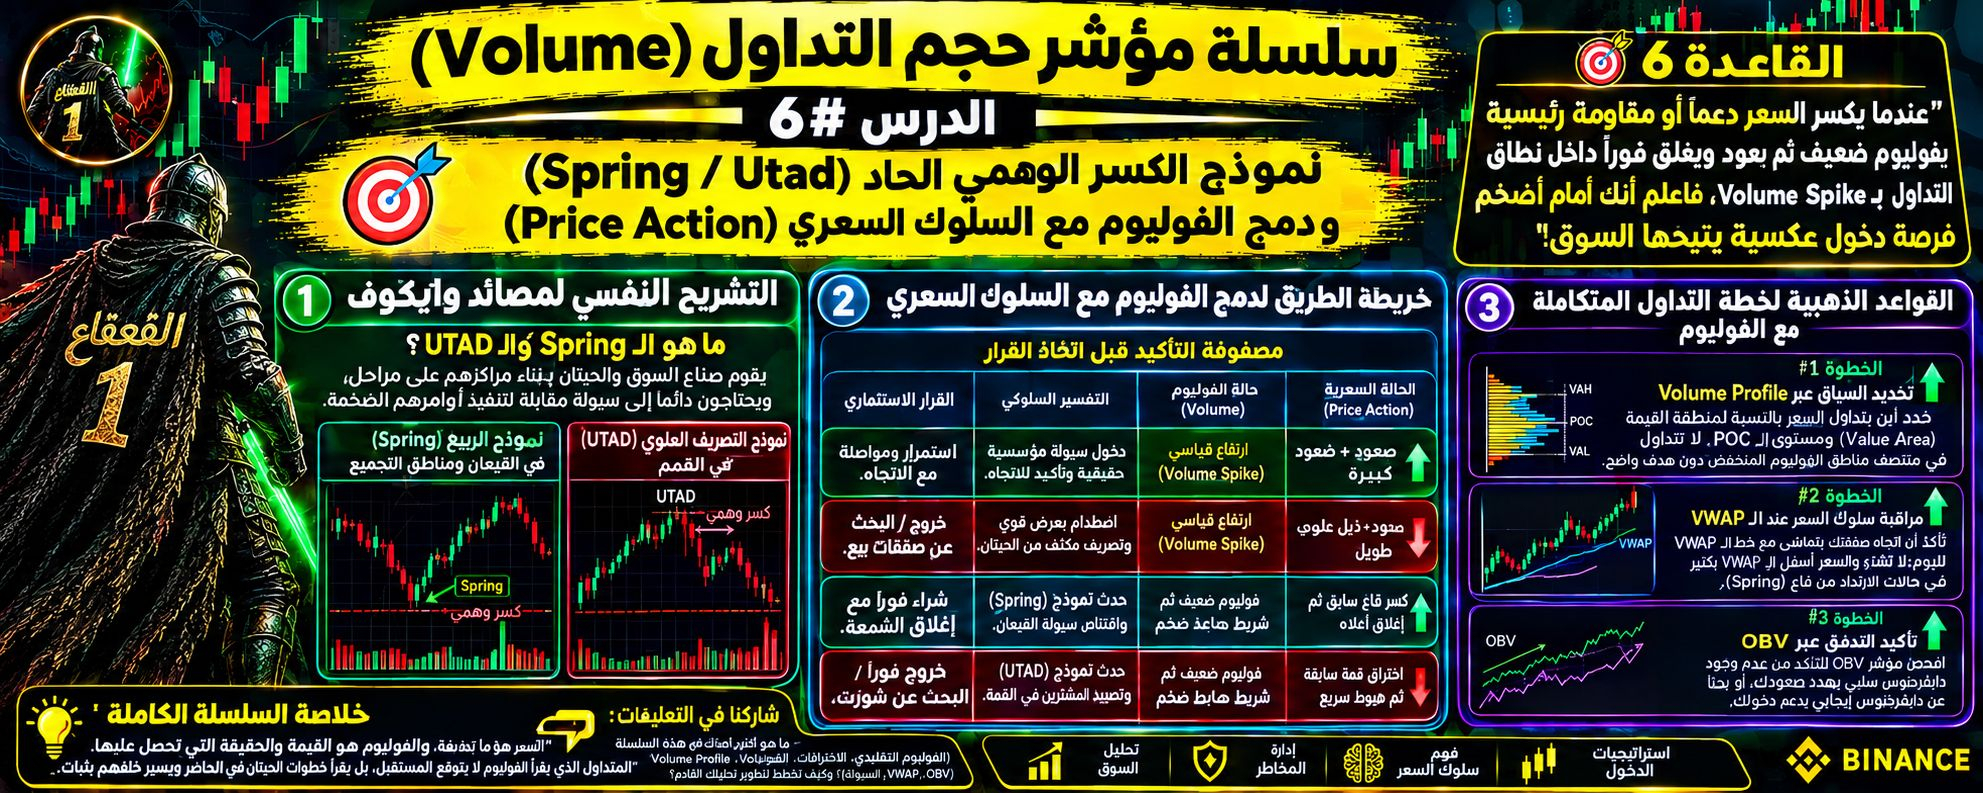
Volume Indicator Series — Lesson #6: The Sharp False Breakout Pattern (Spring / UTAD) and Integration with PAHello, fellow traders! Welcome to the sixth and final installment of our educational series on Volume. After making great progress in understanding time-based volume, breakouts, Volume Profile, the OBV indicator, and the VWAP indicator, it’s time to combine these skills into a comprehensive trading strategy based on the Wyckoff Method and capturing Liquidity Traps.
Volume Indicator Series — Lesson #6: The Sharp False Breakout Pattern (Spring / UTAD) and Integration with PA
Hello, fellow traders! Welcome to the sixth and final installment of our educational series on Volume. After making great progress in understanding time-based volume, breakouts, Volume Profile, the OBV indicator, and the VWAP indicator, it’s time to combine these skills into a comprehensive trading strategy based on the Wyckoff Method and capturing Liquidity Traps.
2
5
181

·
--
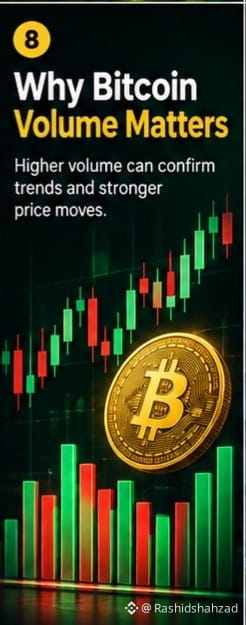
$BTC 📈 Why Volume Matters
Price movement becomes more interesting when supported by strong trading volume. Traders often use volume to judge whether a breakout or breakdown has meaningful participation.
#Bitcoin #Volume #TechnicalAnalysis
$BTC 📈 Why Volume Matters
Price movement becomes more interesting when supported by strong trading volume. Traders often use volume to judge whether a breakout or breakdown has meaningful participation.
#Bitcoin #Volume #TechnicalAnalysis
Price movement becomes more interesting when supported by strong trading volume. Traders often use volume to judge whether a breakout or breakdown has meaningful participation.
#Bitcoin #Volume #TechnicalAnalysis
77
A -5% daily drop means nothing without context. Here's how to read it.
$ZEC is sitting at $1303.54 right now, down 5% over 24 hours. But the real story is volume: $126M.
Volume confirmation is your truth-teller. When price falls on LOW volume, sellers are exhausted and a reversal often follows. When price falls on HIGH volume, strong hands are distributing and the downtrend has fuel.
The lesson? Never trade a move without checking volume first. It tells you whether the order flow behind the price action is real or fake.
So here's my question: do you check volume before entering a trade, or do you only look at price?
We post every algo signal's real result openly and the full live track record plus a free preview channel are linked in our profile.
#Volume #CryptoTrading
85
·
--
Article
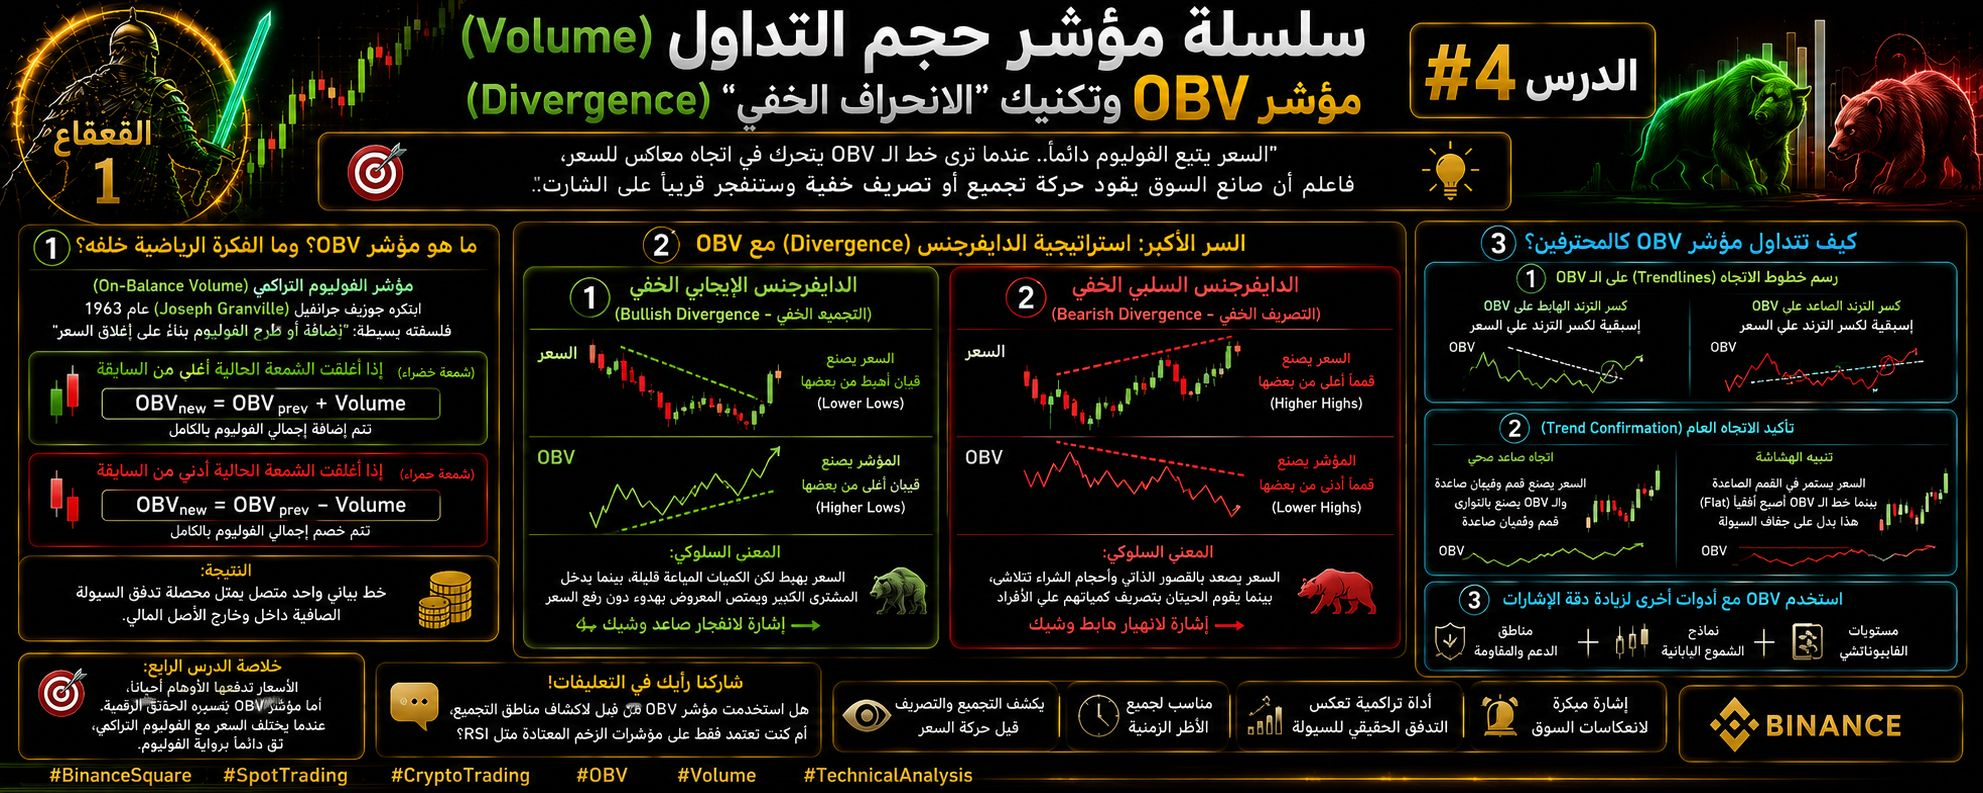
📌 Volume Indicator Series (Volume) | Lesson #4: OBV Indicator and the "Hidden Divergence" (Divergence)Hello, fellow traders! Welcome to the fourth station of our series. After learning in the previous lesson the Volume Profile map and the locations of the whales, today we’ll learn how to uncover "direct accumulation and distribution" even before the price moves—using the legendary cumulative tool: the On-Balance Volume (OBV) indicator.
📌 Volume Indicator Series (Volume) | Lesson #4: OBV Indicator and the "Hidden Divergence" (Divergence)
Hello, fellow traders! Welcome to the fourth station of our series. After learning in the previous lesson the Volume Profile map and the locations of the whales, today we’ll learn how to uncover "direct accumulation and distribution" even before the price moves—using the legendary cumulative tool: the On-Balance Volume (OBV) indicator.
2
567
Log in to explore more content
Join global crypto users on Binance Square
⚡️ Get latest and useful information about crypto.
💬 Trusted by the world’s largest crypto exchange.
👍 Discover real insights from verified creators.
Email / Phone number
Trending Topics
1
#BinancePick
2.9M views
150,181 Discussing
2
#EarningsSeason
5.2M views
25,603 Discussing
3
#AnthropicTTMRevenueGrewAbout1200%
11,039 views
276 Discussing
4
#AnthropicS1ExpectedToday
14,322 views
254 Discussing
5
#SouthKoreaReportedlyWeighsFourthCryptoTaxDelay
21,291 views
387 Discussing
6
#FranklinTempletonFilesForTwoDividendToBitcoinETFs
28,641 views
483 Discussing
7
#StrategyMSTRSurpassesNasdaqInMarketCap
22,052 views
347 Discussing
8
#CanadaProposesStablecoinRedemptionWithin3BusinessDays
999 views
34 Discussing
9
#ElectrumWalletBugLetRogueServersStealFunds
24,710 views
435 Discussing
10
#ArgentineCourtDismissesLIBRACaseAgainstMilei
37,535 views
537 Discussing