
#orcl
orcl
49,897 views
932 Discussing
Hot
Latest

·
--
Oracle says the money for its OpenAI contract is secured, but the project is still a long way from generating enough cash to fund itself.
A November 20 statement said that arrangements, including supplier financing, are in place and that fulfilling the contract does not depend on further negotiations with suppliers. Free cash flow is still expected to turn positive only in the second half of fiscal 2028.
I think this response shifts the question from “Can it secure financing?” to “Can it deliver on time and collect payment?” The specific test will be the handover of Vera Rubin racks at the Shackelford campus over the next few weeks, followed by whether deliveries translate into cash flow. Don’t read having financing lined up as meaning that cash flow pressure is already behind it.
#ORCL Not investment advice.
Oracle says the money for its OpenAI contract is secured, but the project is still a long way from generating enough cash to fund itself.
A November 20 statement said that arrangements, including supplier financing, are in place and that fulfilling the contract does not depend on further negotiations with suppliers. Free cash flow is still expected to turn positive only in the second half of fiscal 2028.
I think this response shifts the question from “Can it secure financing?” to “Can it deliver on time and collect payment?” The specific test will be the handover of Vera Rubin racks at the Shackelford campus over the next few weeks, followed by whether deliveries translate into cash flow. Don’t read having financing lined up as meaning that cash flow pressure is already behind it.
#ORCL Not investment advice.
A November 20 statement said that arrangements, including supplier financing, are in place and that fulfilling the contract does not depend on further negotiations with suppliers. Free cash flow is still expected to turn positive only in the second half of fiscal 2028.
I think this response shifts the question from “Can it secure financing?” to “Can it deliver on time and collect payment?” The specific test will be the handover of Vera Rubin racks at the Shackelford campus over the next few weeks, followed by whether deliveries translate into cash flow. Don’t read having financing lined up as meaning that cash flow pressure is already behind it.
#ORCL Not investment advice.
95

·
--
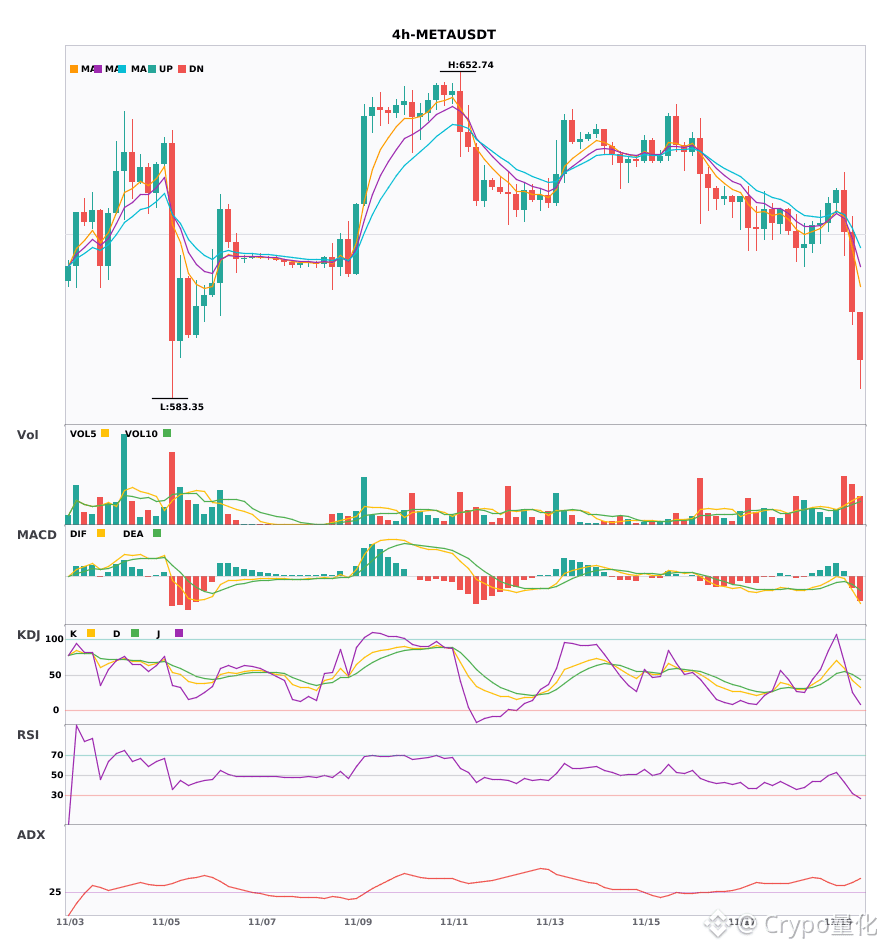
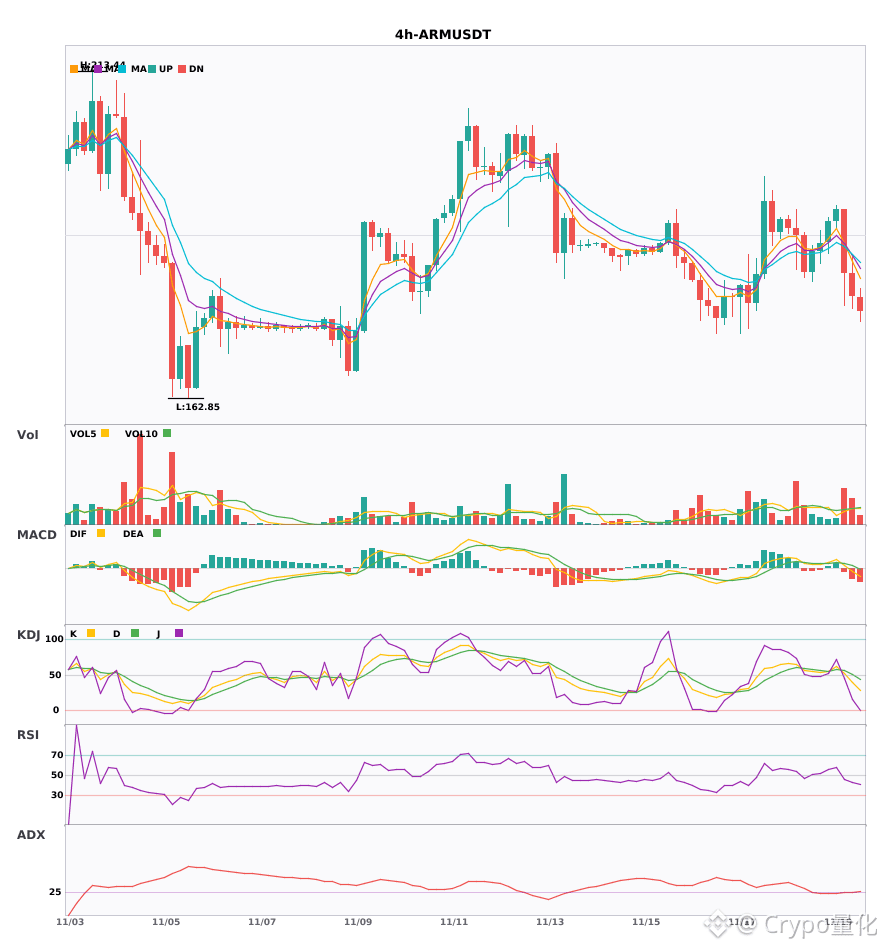
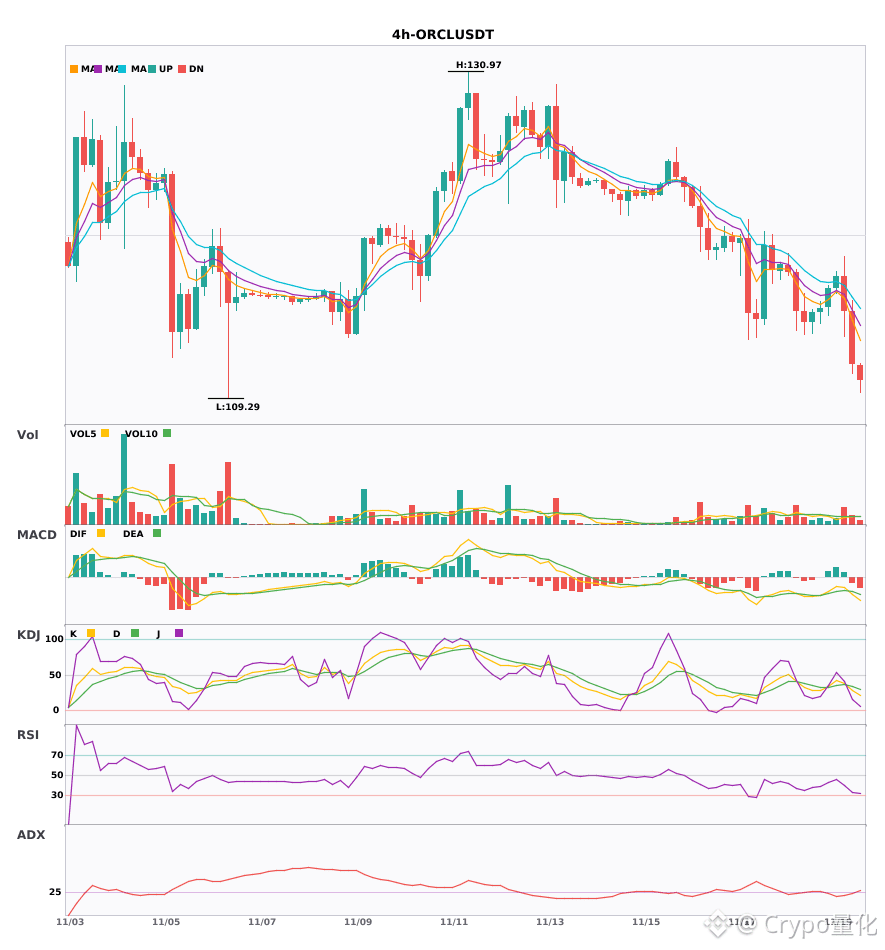
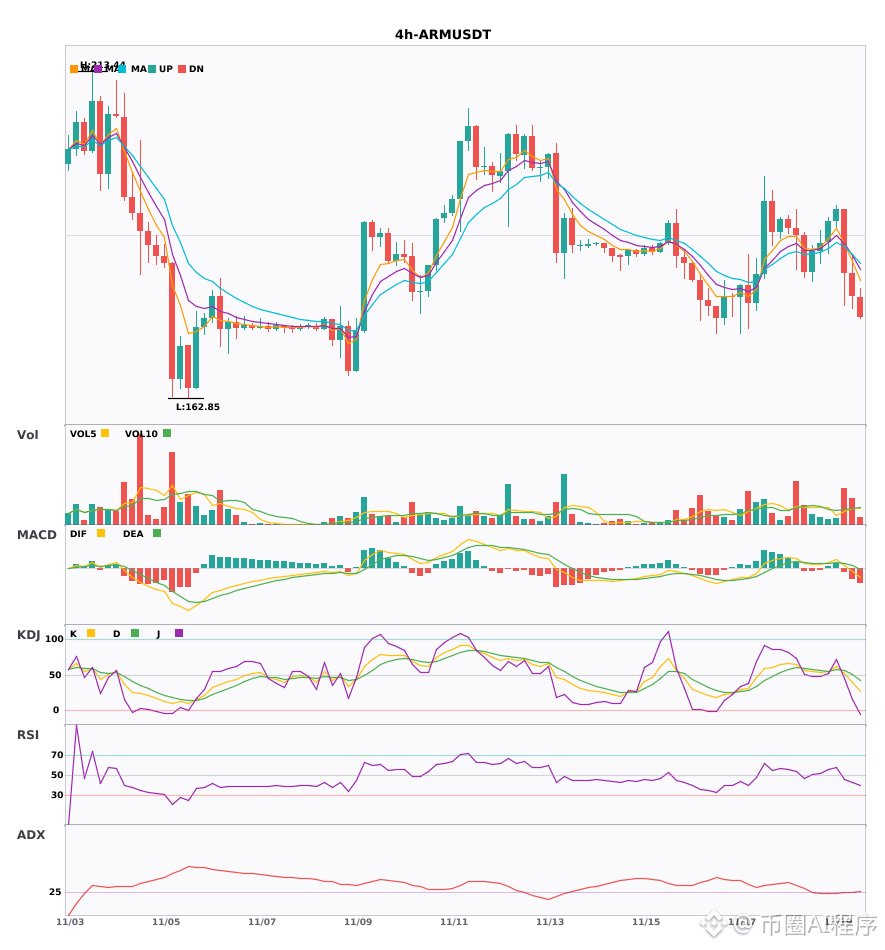
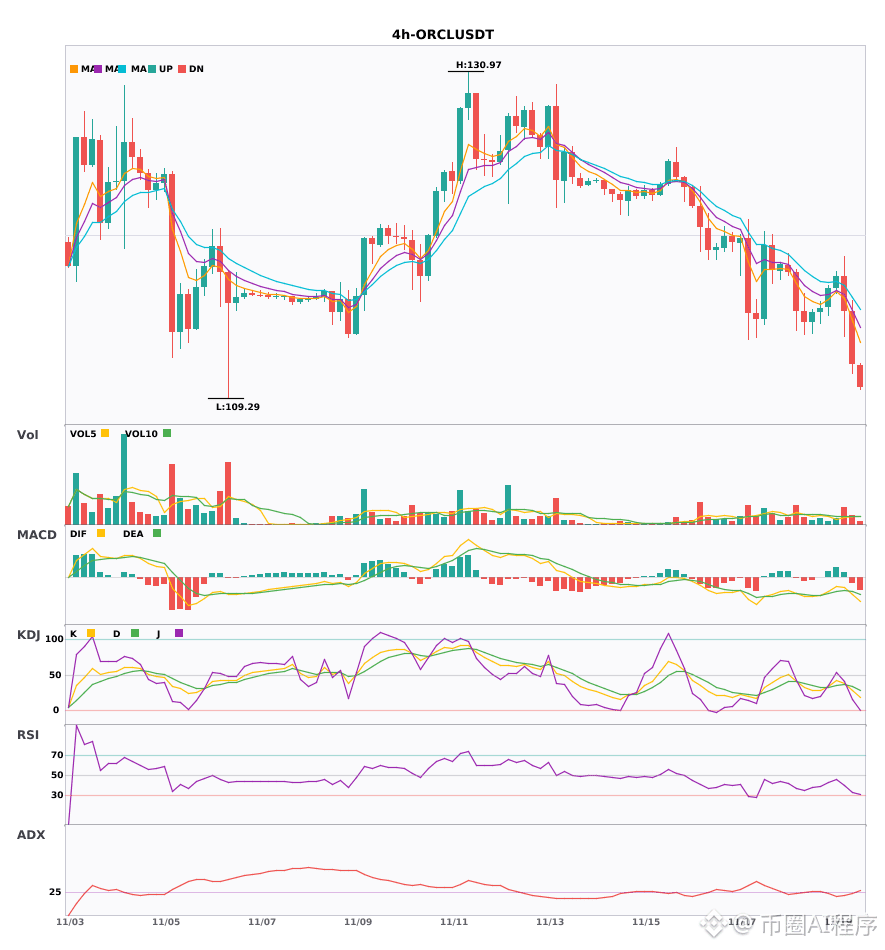
$META/$ARM/$ORCL 4-hour moving average death cross turning downward; bearish signals all firing 🔥
════════════════════
🟢 $META 4-hour bearish signal
⚠️Technical analysis: ADX is rising, showing a clear trend; the MACD death cross is accelerating the bearish momentum; the moving-average death cross signals a bearish turn; the KDJ death cross is bearish but not yet oversold; trading volume is 2.7 times higher, suggesting a short-term bearish bias.
📢Market update: Meta aims to sell 10 million Muse Charm wearable devices. Pricing has not yet been determined. The devices could reshape the consumer tech market and highlight AI integration.
════════════════════
🟢 $ARM 4-hour bearish signal
⚠️Technical analysis: ADX suggests the trend is just forming and can be traded; MACD has fallen below the zero line and turned bearish; the 5-day moving average has crossed below the 8-day moving average, weakening in the short term; volume is also 2.4 times higher.
════════════════════
🟢 $ORCL 4-hour bearish signal
⚠️Technical analysis: ADX trend is just starting and can be followed | MACD death cross below zero is accelerating bearish momentum | Moving averages are in a bearish alignment and pointing downward | KDJ death cross, with K crossing below D, is bearish | Trading volume is 2 times higher
════════════════════
🔔 Follow for first-hand market movement alerts 🔔
#技术分析 #META #ARM #ORCL
📌 When trading, watch for whether the candlestick pattern confirms the signal
$META /$ARM /$ORCL 4-hour moving average death cross turning downward; bearish signals all firing 🔥
════════════════════
🟢 $META 4-hour bearish signal
⚠️Technical analysis: ADX is rising, showing a clear trend; the MACD death cross is accelerating the bearish momentum; the moving-average death cross signals a bearish turn; the KDJ death cross is bearish but not yet oversold; trading volume is 2.7 times higher, suggesting a short-term bearish bias.
📢Market update: Meta aims to sell 10 million Muse Charm wearable devices. Pricing has not yet been determined. The devices could reshape the consumer tech market and highlight AI integration.
════════════════════
🟢 $ARM 4-hour bearish signal
⚠️Technical analysis: ADX suggests the trend is just forming and can be traded; MACD has fallen below the zero line and turned bearish; the 5-day moving average has crossed below the 8-day moving average, weakening in the short term; volume is also 2.4 times higher.
════════════════════
🟢 $ORCL 4-hour bearish signal
⚠️Technical analysis: ADX trend is just starting and can be followed | MACD death cross below zero is accelerating bearish momentum | Moving averages are in a bearish alignment and pointing downward | KDJ death cross, with K crossing below D, is bearish | Trading volume is 2 times higher
════════════════════
🔔 Follow for first-hand market movement alerts 🔔
#技术分析 #META #ARM #ORCL
📌 When trading, watch for whether the candlestick pattern confirms the signal
════════════════════
🟢 $META 4-hour bearish signal
⚠️Technical analysis: ADX is rising, showing a clear trend; the MACD death cross is accelerating the bearish momentum; the moving-average death cross signals a bearish turn; the KDJ death cross is bearish but not yet oversold; trading volume is 2.7 times higher, suggesting a short-term bearish bias.
📢Market update: Meta aims to sell 10 million Muse Charm wearable devices. Pricing has not yet been determined. The devices could reshape the consumer tech market and highlight AI integration.
════════════════════
🟢 $ARM 4-hour bearish signal
⚠️Technical analysis: ADX suggests the trend is just forming and can be traded; MACD has fallen below the zero line and turned bearish; the 5-day moving average has crossed below the 8-day moving average, weakening in the short term; volume is also 2.4 times higher.
════════════════════
🟢 $ORCL 4-hour bearish signal
⚠️Technical analysis: ADX trend is just starting and can be followed | MACD death cross below zero is accelerating bearish momentum | Moving averages are in a bearish alignment and pointing downward | KDJ death cross, with K crossing below D, is bearish | Trading volume is 2 times higher
════════════════════
🔔 Follow for first-hand market movement alerts 🔔
#技术分析 #META #ARM #ORCL
📌 When trading, watch for whether the candlestick pattern confirms the signal
2

·
--
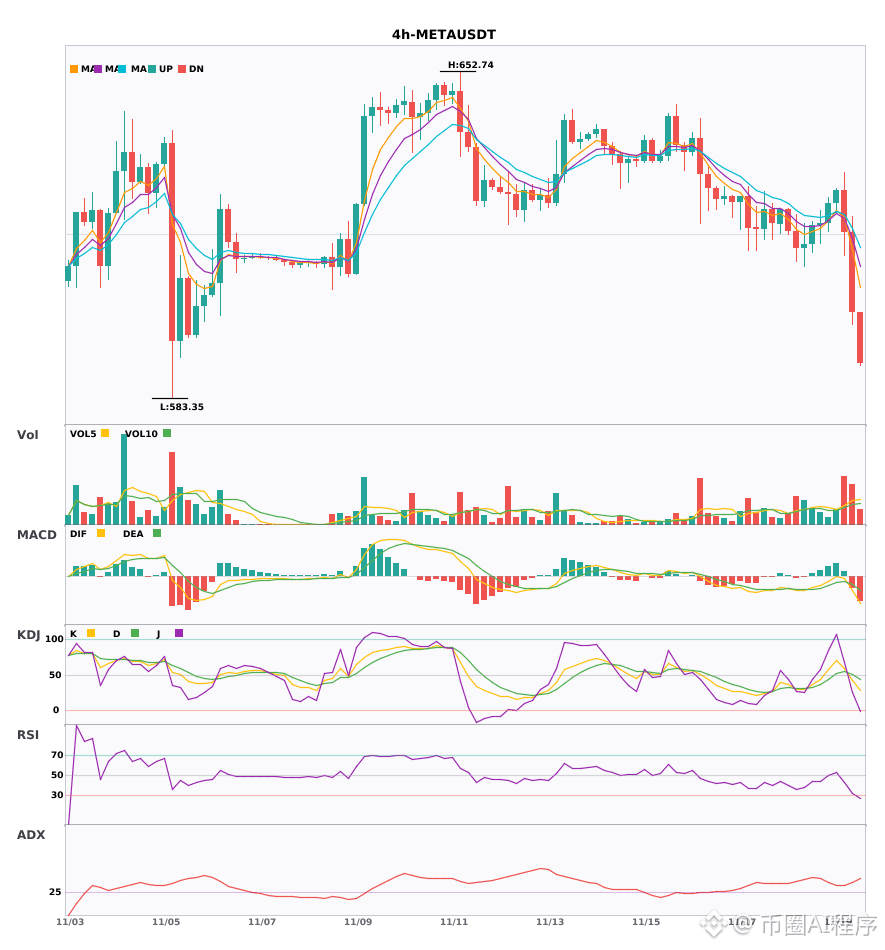
$META/$ARM/$ORCL 4h: Daily and 4-hour bearish confluence, an ideal short opportunity 🔥
════════════════════
🟢 $META 4-hour bearish signal
⚠️Technical analysis: Daily and 4-hour bearish signals confirmed in confluence! The 4-hour MACD has formed a high-volume death cross below zero, accelerating bearish momentum; EMA5 has crossed below EMA8, turning bearish; KDJ death cross, not yet oversold; volume surged 2.7x.
📢Market update: Meta is targeting 10 million sales of its Muse Charm wearable device. Pricing has not been announced. It could reshape the consumer tech landscape, highlighting AI integration.
════════════════════
🟢 $ARM 4-hour bearish signal
⚠️Technical analysis: Entry signal from the 4-hour bearish setup, confirmed by daily alignment! MACD DIF has fallen below the zero line with rising bearish volume; EMA5 has just crossed below EMA8; volume is up 2.4x.
════════════════════
🟢 $ORCL 4-hour bearish signal
⚠️Technical analysis: Short on the daily and 4-hour confluence! The 4-hour MACD has formed a high-volume death cross below zero; moving averages are bearishly aligned and diverging; KDJ death cross, not yet oversold; bearish momentum is accelerating.
════════════════════
🔔 Follow for first-hand market alerts 🔔
#多周期共振 #META #ARM #ORCL
📌 When trading, check whether the candlestick pattern confirms the setup
$META /$ARM /$ORCL 4h: Daily and 4-hour bearish confluence, an ideal short opportunity 🔥
════════════════════
🟢 $META 4-hour bearish signal
⚠️Technical analysis: Daily and 4-hour bearish signals confirmed in confluence! The 4-hour MACD has formed a high-volume death cross below zero, accelerating bearish momentum; EMA5 has crossed below EMA8, turning bearish; KDJ death cross, not yet oversold; volume surged 2.7x.
📢Market update: Meta is targeting 10 million sales of its Muse Charm wearable device. Pricing has not been announced. It could reshape the consumer tech landscape, highlighting AI integration.
════════════════════
🟢 $ARM 4-hour bearish signal
⚠️Technical analysis: Entry signal from the 4-hour bearish setup, confirmed by daily alignment! MACD DIF has fallen below the zero line with rising bearish volume; EMA5 has just crossed below EMA8; volume is up 2.4x.
════════════════════
🟢 $ORCL 4-hour bearish signal
⚠️Technical analysis: Short on the daily and 4-hour confluence! The 4-hour MACD has formed a high-volume death cross below zero; moving averages are bearishly aligned and diverging; KDJ death cross, not yet oversold; bearish momentum is accelerating.
════════════════════
🔔 Follow for first-hand market alerts 🔔
#多周期共振 #META #ARM #ORCL
📌 When trading, check whether the candlestick pattern confirms the setup
════════════════════
🟢 $META 4-hour bearish signal
⚠️Technical analysis: Daily and 4-hour bearish signals confirmed in confluence! The 4-hour MACD has formed a high-volume death cross below zero, accelerating bearish momentum; EMA5 has crossed below EMA8, turning bearish; KDJ death cross, not yet oversold; volume surged 2.7x.
📢Market update: Meta is targeting 10 million sales of its Muse Charm wearable device. Pricing has not been announced. It could reshape the consumer tech landscape, highlighting AI integration.
════════════════════
🟢 $ARM 4-hour bearish signal
⚠️Technical analysis: Entry signal from the 4-hour bearish setup, confirmed by daily alignment! MACD DIF has fallen below the zero line with rising bearish volume; EMA5 has just crossed below EMA8; volume is up 2.4x.
════════════════════
🟢 $ORCL 4-hour bearish signal
⚠️Technical analysis: Short on the daily and 4-hour confluence! The 4-hour MACD has formed a high-volume death cross below zero; moving averages are bearishly aligned and diverging; KDJ death cross, not yet oversold; bearish momentum is accelerating.
════════════════════
🔔 Follow for first-hand market alerts 🔔
#多周期共振 #META #ARM #ORCL
📌 When trading, check whether the candlestick pattern confirms the setup
·
--
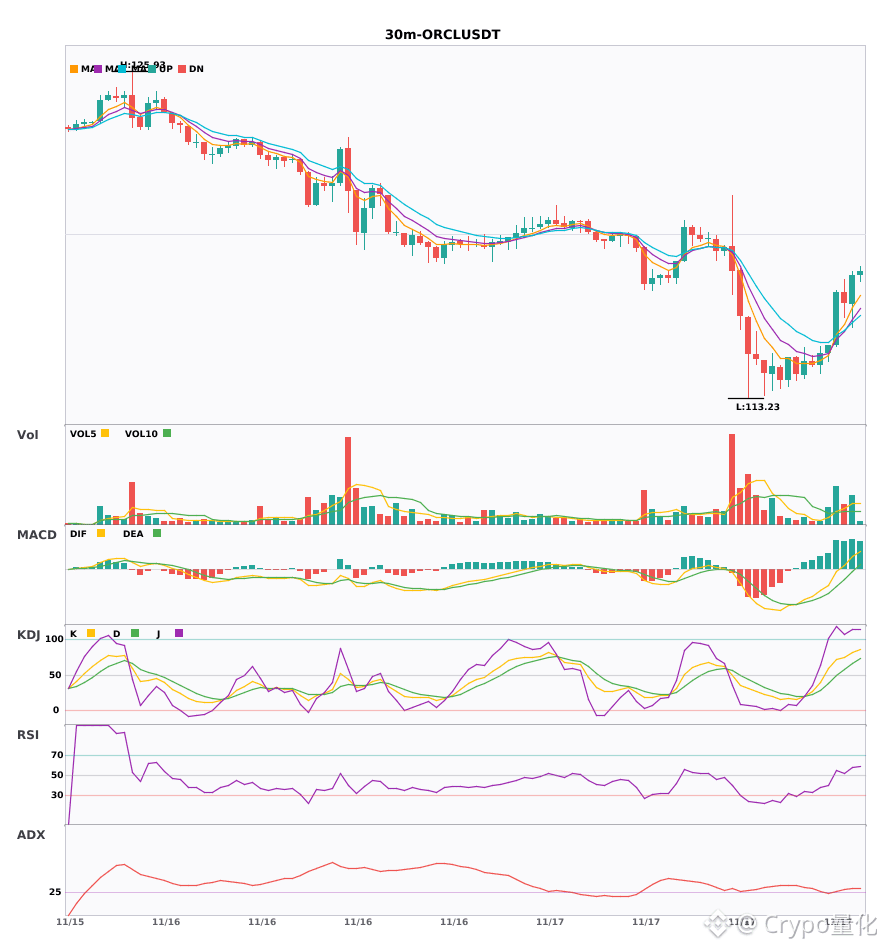
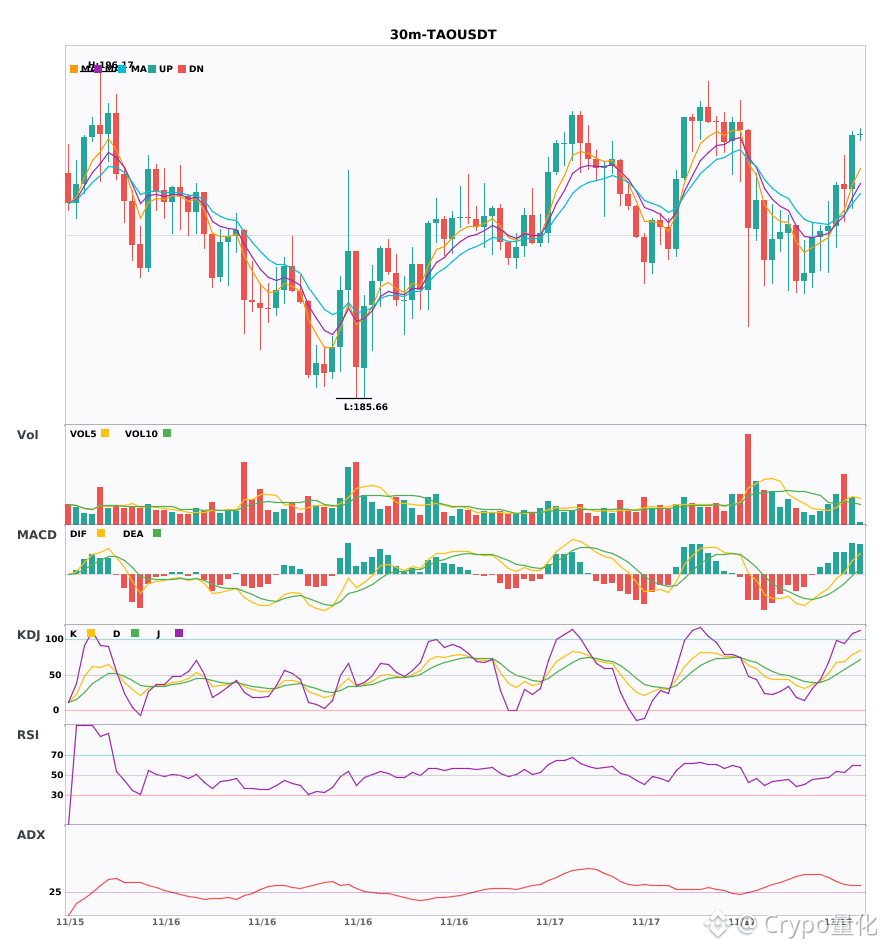
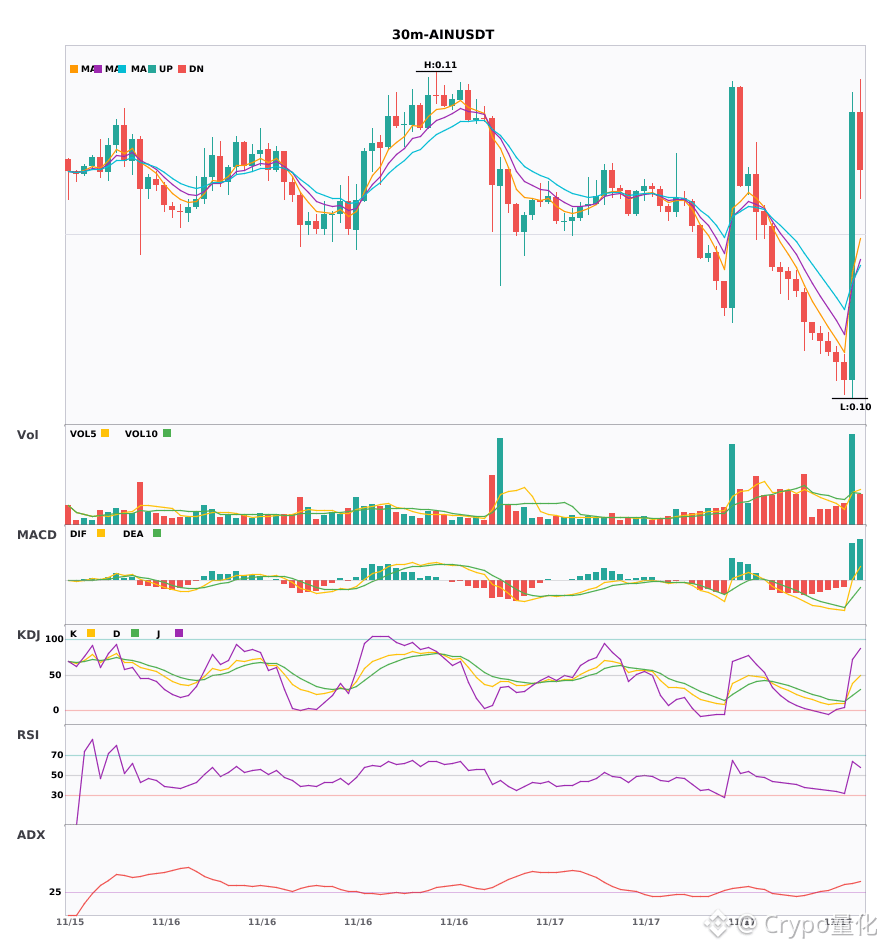
$ORCL/$TAO/$AIN 30-minute rally together—which has the strongest explosive potential? 🔥
════════════════════
🔴 $ORCL 30-minute bullish signal
⚠️ Technical analysis: ADX 31 indicates a clear trend. After the MACD golden cross, the red bars continue to grow. The moving averages are in bullish alignment and spreading upward. K has crossed above D, but is at a relatively high level. Volume has increased 2x, favoring the bulls.
════════════════════
🔴 $TAO 30-minute bullish signal
⚠️ Technical analysis: ADX 35 indicates a clear trend. After the MACD golden cross, volume has increased and the red bars continue to grow. The moving averages are in bullish alignment and spreading upward. K has crossed above D without entering the overbought zone. Volume has increased 2.2x, with bulls in control.
════════════════════
🔴 $AIN 30-minute bullish signal
⚠️ Technical analysis: The trend is quite strong. The MACD golden cross is accompanied by increased volume, and the moving averages are in bullish alignment. KDJ has formed a golden cross, with K crossing above D without entering the overbought zone. Volume has surged 2.8x.
════════════════════
🔔 Follow for the latest market movements 🔔
#技术分析 #ORCL #TAO #AIN
📌 When trading, pay attention to whether the candlestick pattern confirms the signal.
$ORCL /$TAO /$AIN 30-minute rally together—which has the strongest explosive potential? 🔥
════════════════════
🔴 $ORCL 30-minute bullish signal
⚠️ Technical analysis: ADX 31 indicates a clear trend. After the MACD golden cross, the red bars continue to grow. The moving averages are in bullish alignment and spreading upward. K has crossed above D, but is at a relatively high level. Volume has increased 2x, favoring the bulls.
════════════════════
🔴 $TAO 30-minute bullish signal
⚠️ Technical analysis: ADX 35 indicates a clear trend. After the MACD golden cross, volume has increased and the red bars continue to grow. The moving averages are in bullish alignment and spreading upward. K has crossed above D without entering the overbought zone. Volume has increased 2.2x, with bulls in control.
════════════════════
🔴 $AIN 30-minute bullish signal
⚠️ Technical analysis: The trend is quite strong. The MACD golden cross is accompanied by increased volume, and the moving averages are in bullish alignment. KDJ has formed a golden cross, with K crossing above D without entering the overbought zone. Volume has surged 2.8x.
════════════════════
🔔 Follow for the latest market movements 🔔
#技术分析 #ORCL #TAO #AIN
📌 When trading, pay attention to whether the candlestick pattern confirms the signal.
════════════════════
🔴 $ORCL 30-minute bullish signal
⚠️ Technical analysis: ADX 31 indicates a clear trend. After the MACD golden cross, the red bars continue to grow. The moving averages are in bullish alignment and spreading upward. K has crossed above D, but is at a relatively high level. Volume has increased 2x, favoring the bulls.
════════════════════
🔴 $TAO 30-minute bullish signal
⚠️ Technical analysis: ADX 35 indicates a clear trend. After the MACD golden cross, volume has increased and the red bars continue to grow. The moving averages are in bullish alignment and spreading upward. K has crossed above D without entering the overbought zone. Volume has increased 2.2x, with bulls in control.
════════════════════
🔴 $AIN 30-minute bullish signal
⚠️ Technical analysis: The trend is quite strong. The MACD golden cross is accompanied by increased volume, and the moving averages are in bullish alignment. KDJ has formed a golden cross, with K crossing above D without entering the overbought zone. Volume has surged 2.8x.
════════════════════
🔔 Follow for the latest market movements 🔔
#技术分析 #ORCL #TAO #AIN
📌 When trading, pay attention to whether the candlestick pattern confirms the signal.
7
·
--
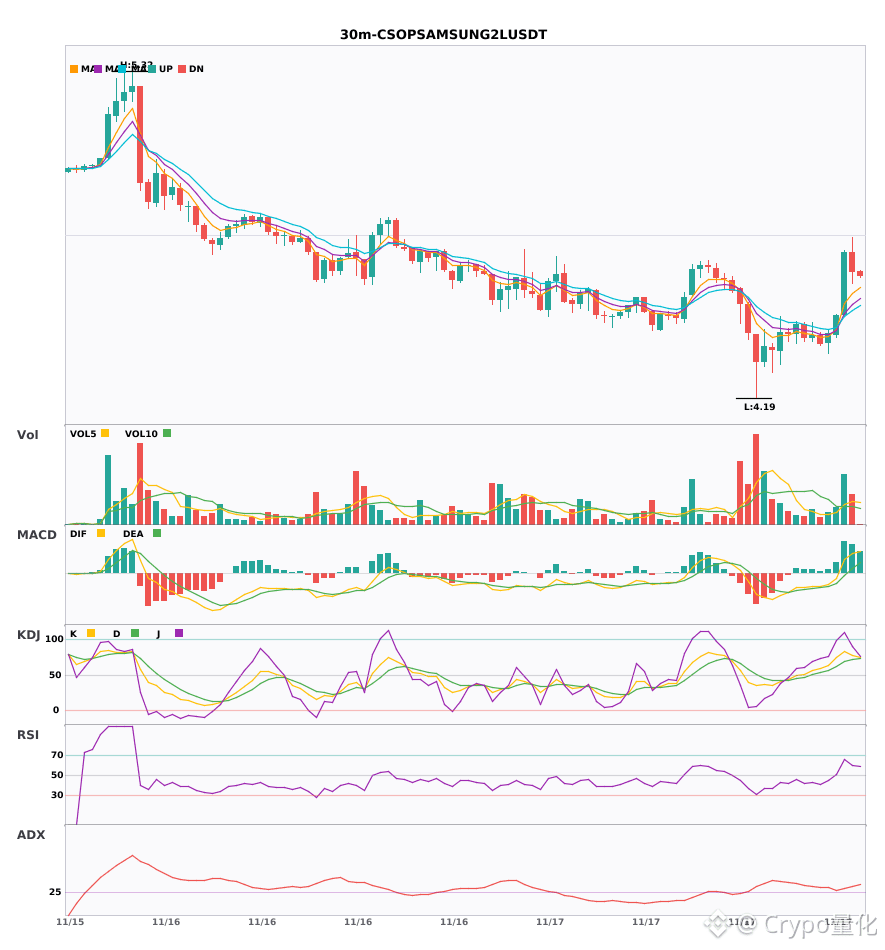
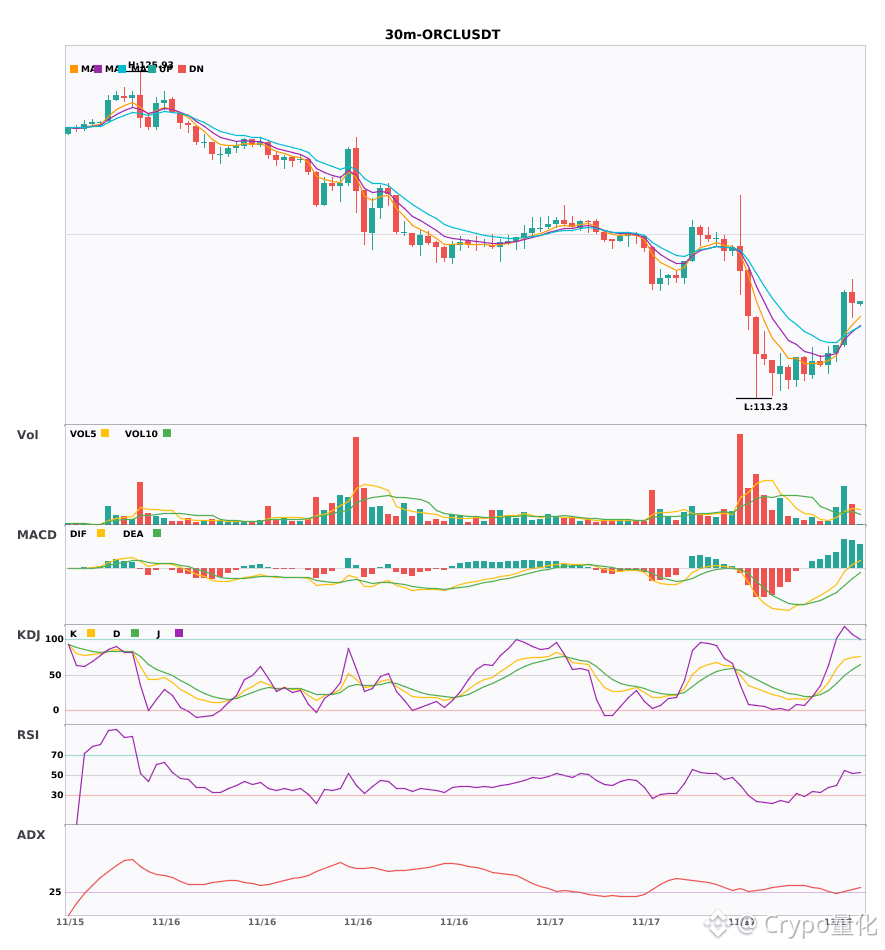
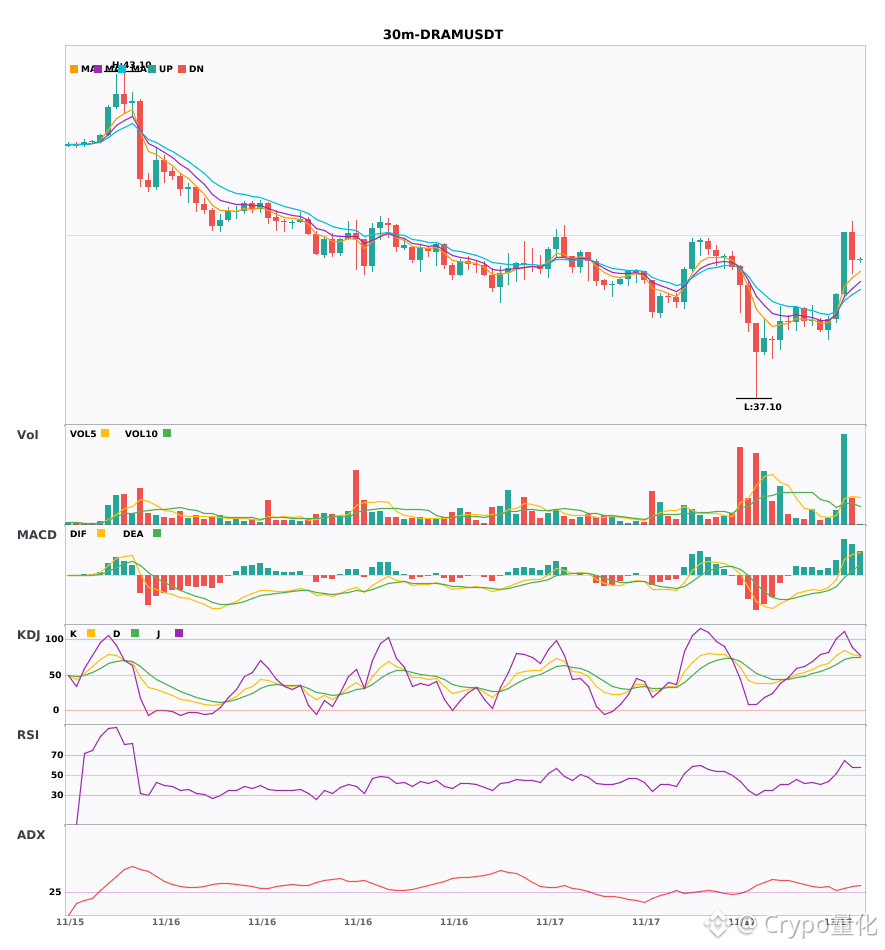
$CSOPSAMSUNG2L $ORCL $DRAM 30-minute bullish confluence; short-term outlook leans bullish 🔥
════════════════════
🔴 $CSOPSAMSUNG2L 30-minute bullish signal
⚠️ Technicals: The ADX trend is just emerging—entry is possible. A bullish MACD crossover with increased volume breaks above the zero line, turning bullish. Moving averages are aligned upward. KDJ is strong but not overbought. Volume has expanded 2.8x.
════════════════════
🔴 $ORCL 30-minute bullish signal
⚠️ Technicals: ADX 30—the trend is just emerging, so participation is possible | Volume picked up after the MACD bullish crossover; DIF broke above the zero line, signaling a bullish outlook | Moving averages have just begun spreading upward | K crossed above D and is not overbought; bulls have the upper hand | Volume has expanded 3x
════════════════════
🔴 $DRAM 30-minute bullish signal
⚠️ Technicals: ADX shows the trend is starting to emerge, so you can enter; the MACD DIF line has moved above the zero line, indicating a bullish bias; EMA5, 8, and 13 have just formed a bullish alignment and are spreading upward; K in KDJ crossed above D and remains in the strong zone, not overbought; trading volume surged to 4.2x, with bulls in control.
════════════════════
🔔 Follow for first-hand market updates 🔔
#技术分析 #CSOPSAMSUNG2L #ORCL #DRAM
📌 When trading, pay attention to whether the candlestick patterns confirm the setup
$CSOPSAMSUNG2L $ORCL $DRAM 30-minute bullish confluence; short-term outlook leans bullish 🔥
════════════════════
🔴 $CSOPSAMSUNG2L 30-minute bullish signal
⚠️ Technicals: The ADX trend is just emerging—entry is possible. A bullish MACD crossover with increased volume breaks above the zero line, turning bullish. Moving averages are aligned upward. KDJ is strong but not overbought. Volume has expanded 2.8x.
════════════════════
🔴 $ORCL 30-minute bullish signal
⚠️ Technicals: ADX 30—the trend is just emerging, so participation is possible | Volume picked up after the MACD bullish crossover; DIF broke above the zero line, signaling a bullish outlook | Moving averages have just begun spreading upward | K crossed above D and is not overbought; bulls have the upper hand | Volume has expanded 3x
════════════════════
🔴 $DRAM 30-minute bullish signal
⚠️ Technicals: ADX shows the trend is starting to emerge, so you can enter; the MACD DIF line has moved above the zero line, indicating a bullish bias; EMA5, 8, and 13 have just formed a bullish alignment and are spreading upward; K in KDJ crossed above D and remains in the strong zone, not overbought; trading volume surged to 4.2x, with bulls in control.
════════════════════
🔔 Follow for first-hand market updates 🔔
#技术分析 #CSOPSAMSUNG2L #ORCL #DRAM
📌 When trading, pay attention to whether the candlestick patterns confirm the setup
════════════════════
🔴 $CSOPSAMSUNG2L 30-minute bullish signal
⚠️ Technicals: The ADX trend is just emerging—entry is possible. A bullish MACD crossover with increased volume breaks above the zero line, turning bullish. Moving averages are aligned upward. KDJ is strong but not overbought. Volume has expanded 2.8x.
════════════════════
🔴 $ORCL 30-minute bullish signal
⚠️ Technicals: ADX 30—the trend is just emerging, so participation is possible | Volume picked up after the MACD bullish crossover; DIF broke above the zero line, signaling a bullish outlook | Moving averages have just begun spreading upward | K crossed above D and is not overbought; bulls have the upper hand | Volume has expanded 3x
════════════════════
🔴 $DRAM 30-minute bullish signal
⚠️ Technicals: ADX shows the trend is starting to emerge, so you can enter; the MACD DIF line has moved above the zero line, indicating a bullish bias; EMA5, 8, and 13 have just formed a bullish alignment and are spreading upward; K in KDJ crossed above D and remains in the strong zone, not overbought; trading volume surged to 4.2x, with bulls in control.
════════════════════
🔔 Follow for first-hand market updates 🔔
#技术分析 #CSOPSAMSUNG2L #ORCL #DRAM
📌 When trading, pay attention to whether the candlestick patterns confirm the setup
7

·
--
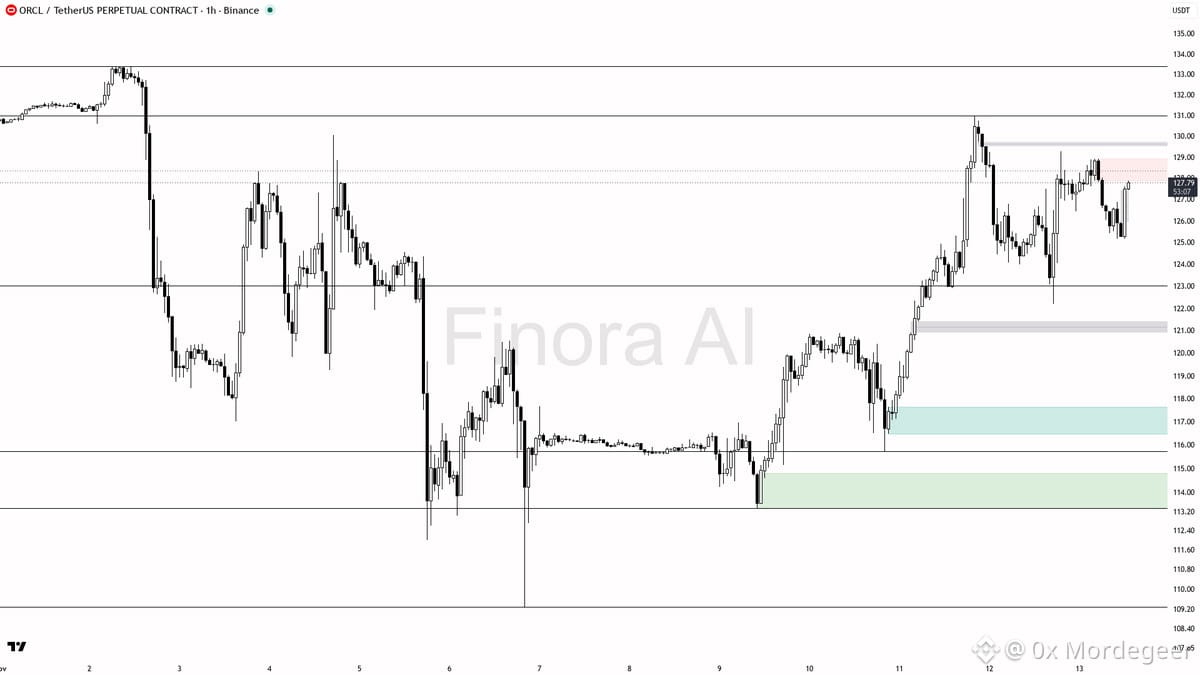
📊 $ORCL Technical Analysis & Setup
A sweep below 127.4 feeds the bearish continuation within this market structure, as 1h, daily, and broader trends align. This sweep fuels downward momentum rather than a reversal.
• Key Support / Demand: 126.06 followed by 122.20
• Resistance / Supply Targets: 128.90 and 129.27
• Trigger / Confirmation: Short entries after rejection at 129.27 with an engulfing candle or 15m MSS
• Risk / Invalidation: A daily close above 128.90 flips the bearish bias; place protection beyond the structure flip
• Market Execution: OI at $13.6M (-1.1% 24h) with funding at +0.0163% and taker at 0.96x. Wait for strict confirmation before entry.
DYOR — Educational setup, not financial advice.
#BinanceSquare #Crypto #ORCL #Trading
📊 $ORCL Technical Analysis & Setup
A sweep below 127.4 feeds the bearish continuation within this market structure, as 1h, daily, and broader trends align. This sweep fuels downward momentum rather than a reversal.
• Key Support / Demand: 126.06 followed by 122.20
• Resistance / Supply Targets: 128.90 and 129.27
• Trigger / Confirmation: Short entries after rejection at 129.27 with an engulfing candle or 15m MSS
• Risk / Invalidation: A daily close above 128.90 flips the bearish bias; place protection beyond the structure flip
• Market Execution: OI at $13.6M (-1.1% 24h) with funding at +0.0163% and taker at 0.96x. Wait for strict confirmation before entry.
DYOR — Educational setup, not financial advice.
#BinanceSquare #Crypto #ORCL #Trading
A sweep below 127.4 feeds the bearish continuation within this market structure, as 1h, daily, and broader trends align. This sweep fuels downward momentum rather than a reversal.
• Key Support / Demand: 126.06 followed by 122.20
• Resistance / Supply Targets: 128.90 and 129.27
• Trigger / Confirmation: Short entries after rejection at 129.27 with an engulfing candle or 15m MSS
• Risk / Invalidation: A daily close above 128.90 flips the bearish bias; place protection beyond the structure flip
• Market Execution: OI at $13.6M (-1.1% 24h) with funding at +0.0163% and taker at 0.96x. Wait for strict confirmation before entry.
DYOR — Educational setup, not financial advice.
#BinanceSquare #Crypto #ORCL #Trading
·
--
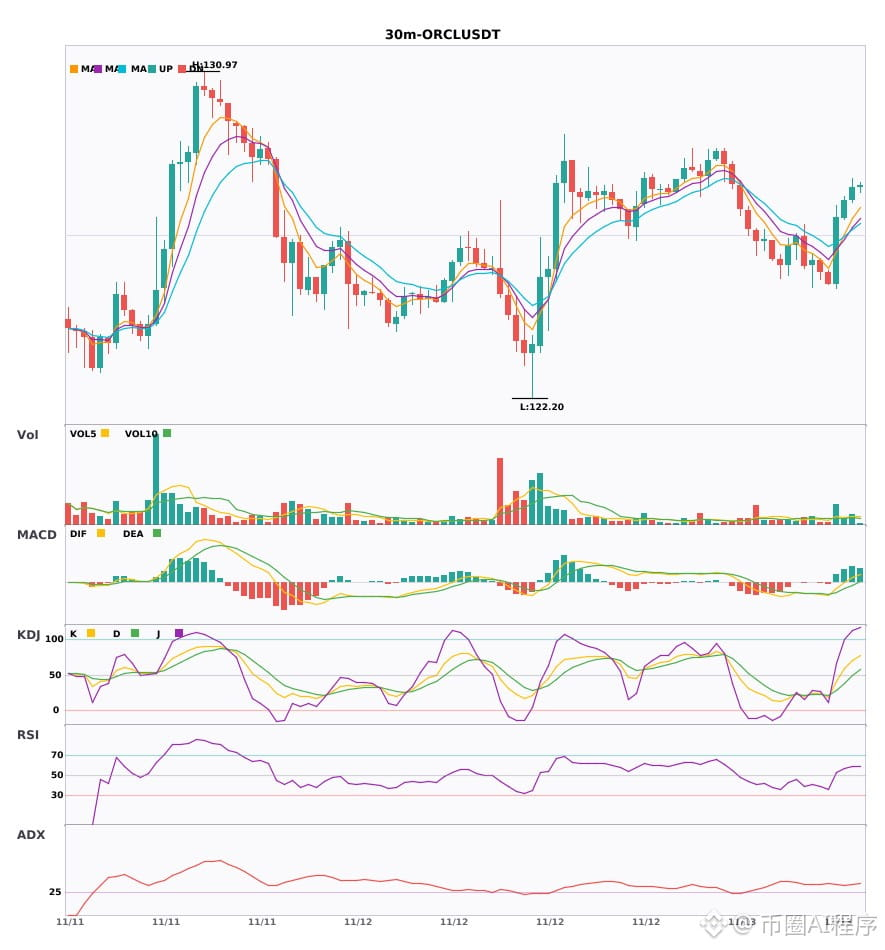
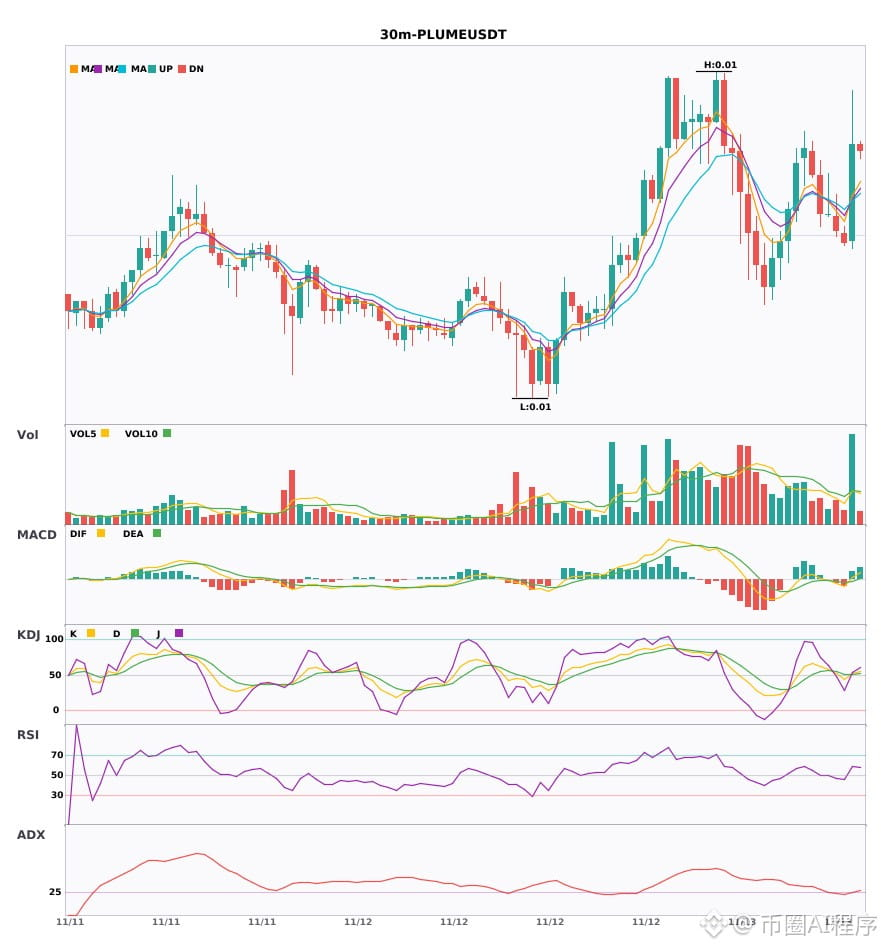
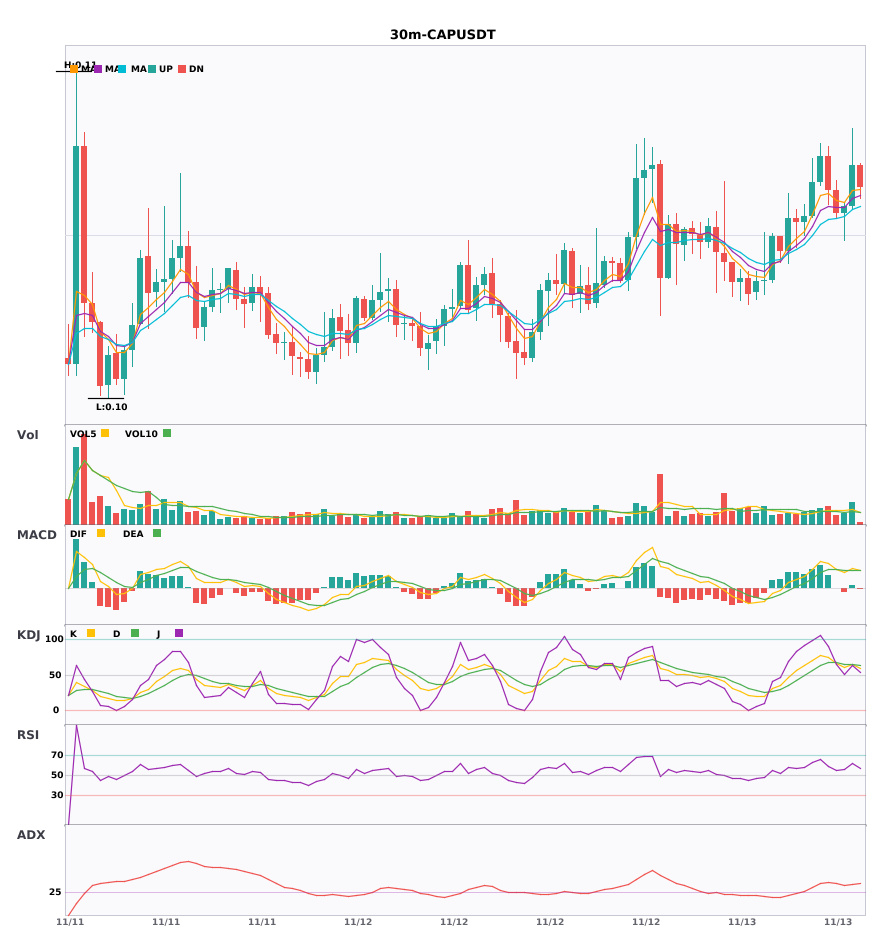
$ORCL/$PLUME/$CAP 30-minute golden cross with rising volume; bullish alignment taking shape on the 4-hour chart 🔥
════════════════════
🔴 $ORCL 30-minute bullish signal
⚠️Technical analysis: 30-minute entry + 4-hour bullish confluence confirmed! MACD golden cross breaks above the zero line, signaling a bullish trend. Moving averages are aligned and diverging upward; volume is 1.5x normal.
════════════════════
🔴 $PLUME 30-minute bullish signal
⚠️Technical analysis: 4-hour bullish confluence + 30-minute entry confluence confirmed: volume increases after the MACD golden cross, with the red bars continuing to grow; moving averages have just formed a bullish alignment and are turning upward; KDJ's K line crosses above D without entering overbought territory; trading volume surges to 2.6x, suggesting a short-term bullish outlook.
════════════════════
🔴 $CAP 30-minute bullish signal
⚠️Technical analysis: Multi-timeframe bullish confluence on the 4-hour and 30-minute charts! Red bars grow after the MACD golden cross, moving averages are aligned and diverging upward, KDJ K crosses above D without becoming overbought, and volume increases 1.6x.
════════════════════
🔔 Follow for first-hand market updates 🔔
#多周期共振 #ORCL #PLUME #CAP
📌 When trading, pay attention to whether the candlestick pattern matches.
$ORCL /$PLUME /$CAP 30-minute golden cross with rising volume; bullish alignment taking shape on the 4-hour chart 🔥
════════════════════
🔴 $ORCL 30-minute bullish signal
⚠️Technical analysis: 30-minute entry + 4-hour bullish confluence confirmed! MACD golden cross breaks above the zero line, signaling a bullish trend. Moving averages are aligned and diverging upward; volume is 1.5x normal.
════════════════════
🔴 $PLUME 30-minute bullish signal
⚠️Technical analysis: 4-hour bullish confluence + 30-minute entry confluence confirmed: volume increases after the MACD golden cross, with the red bars continuing to grow; moving averages have just formed a bullish alignment and are turning upward; KDJ's K line crosses above D without entering overbought territory; trading volume surges to 2.6x, suggesting a short-term bullish outlook.
════════════════════
🔴 $CAP 30-minute bullish signal
⚠️Technical analysis: Multi-timeframe bullish confluence on the 4-hour and 30-minute charts! Red bars grow after the MACD golden cross, moving averages are aligned and diverging upward, KDJ K crosses above D without becoming overbought, and volume increases 1.6x.
════════════════════
🔔 Follow for first-hand market updates 🔔
#多周期共振 #ORCL #PLUME #CAP
📌 When trading, pay attention to whether the candlestick pattern matches.
════════════════════
🔴 $ORCL 30-minute bullish signal
⚠️Technical analysis: 30-minute entry + 4-hour bullish confluence confirmed! MACD golden cross breaks above the zero line, signaling a bullish trend. Moving averages are aligned and diverging upward; volume is 1.5x normal.
════════════════════
🔴 $PLUME 30-minute bullish signal
⚠️Technical analysis: 4-hour bullish confluence + 30-minute entry confluence confirmed: volume increases after the MACD golden cross, with the red bars continuing to grow; moving averages have just formed a bullish alignment and are turning upward; KDJ's K line crosses above D without entering overbought territory; trading volume surges to 2.6x, suggesting a short-term bullish outlook.
════════════════════
🔴 $CAP 30-minute bullish signal
⚠️Technical analysis: Multi-timeframe bullish confluence on the 4-hour and 30-minute charts! Red bars grow after the MACD golden cross, moving averages are aligned and diverging upward, KDJ K crosses above D without becoming overbought, and volume increases 1.6x.
════════════════════
🔔 Follow for first-hand market updates 🔔
#多周期共振 #ORCL #PLUME #CAP
📌 When trading, pay attention to whether the candlestick pattern matches.
5

·
--
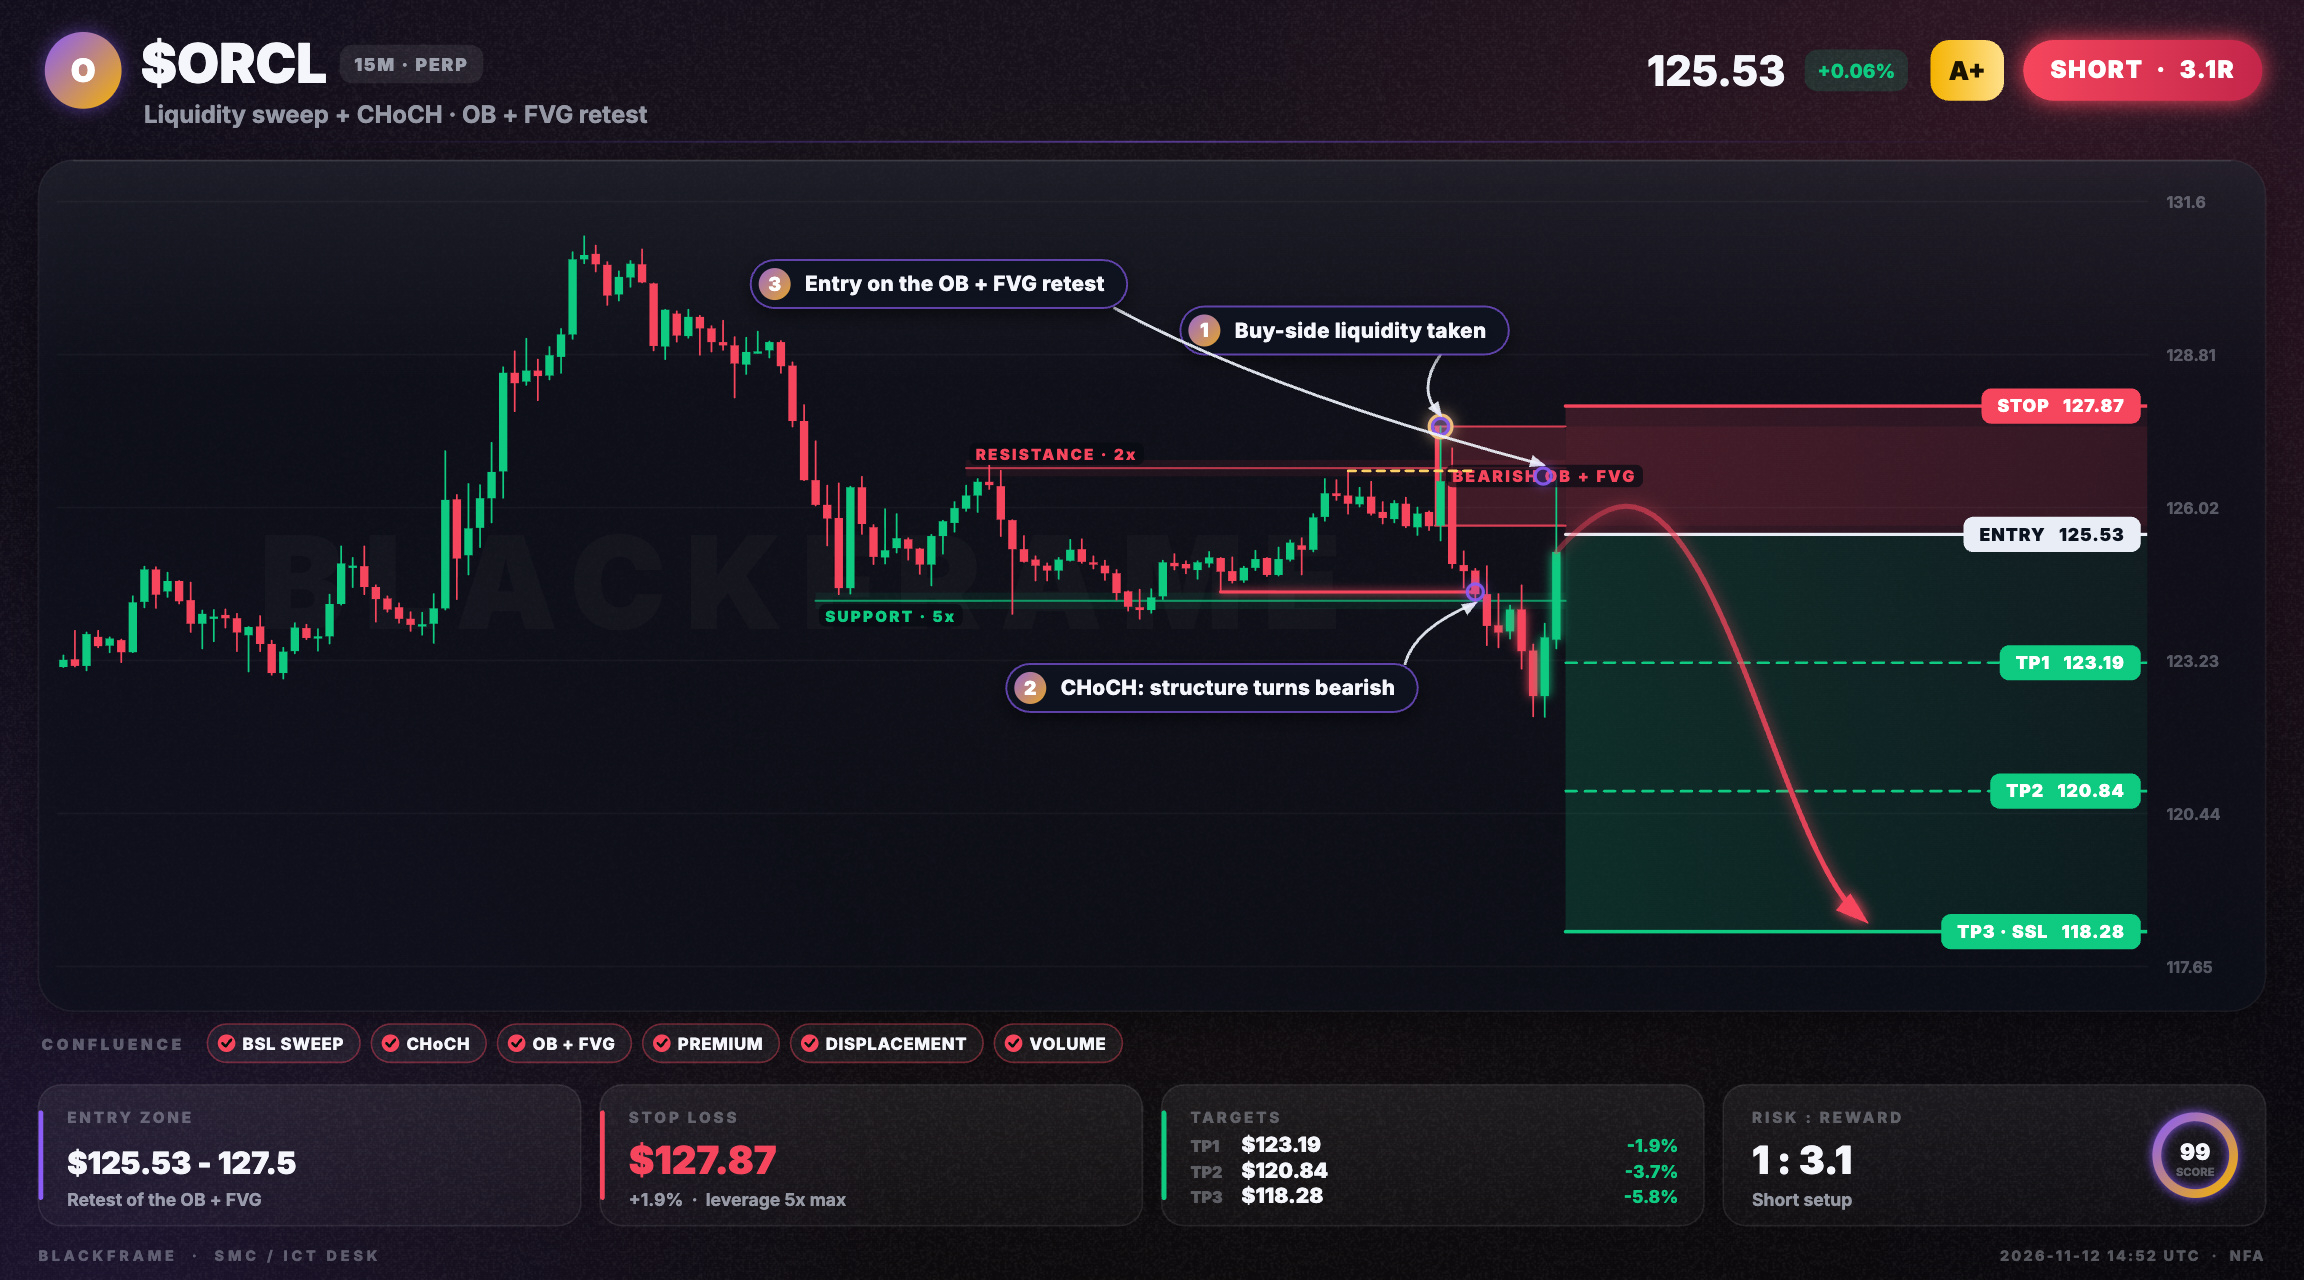
⚡ $ORCL swept buy liquidity, short signal
SHORT · 15M
Entry: $125.53 - $125.69
TP1: $123.19
TP2: $120.84
TP3: $118.28
SL: $127.87
Buy-side liquidity was swept and CHoCH confirmed on the 15M. The OB + FVG stacked at $125.69-127.5 creates a premium sell zone. Target is $118.28; stop at $127.87 if price reclaims the zone.
#ORCL #ICT · NFA
⚡ $ORCL swept buy liquidity, short signal
SHORT · 15M
Entry: $125.53 - $125.69
TP1: $123.19
TP2: $120.84
TP3: $118.28
SL: $127.87
Buy-side liquidity was swept and CHoCH confirmed on the 15M. The OB + FVG stacked at $125.69-127.5 creates a premium sell zone. Target is $118.28; stop at $127.87 if price reclaims the zone.
#ORCL #ICT · NFA
SHORT · 15M
Entry: $125.53 - $125.69
TP1: $123.19
TP2: $120.84
TP3: $118.28
SL: $127.87
Buy-side liquidity was swept and CHoCH confirmed on the 15M. The OB + FVG stacked at $125.69-127.5 creates a premium sell zone. Target is $118.28; stop at $127.87 if price reclaims the zone.
#ORCL #ICT · NFA
1
59
·
--
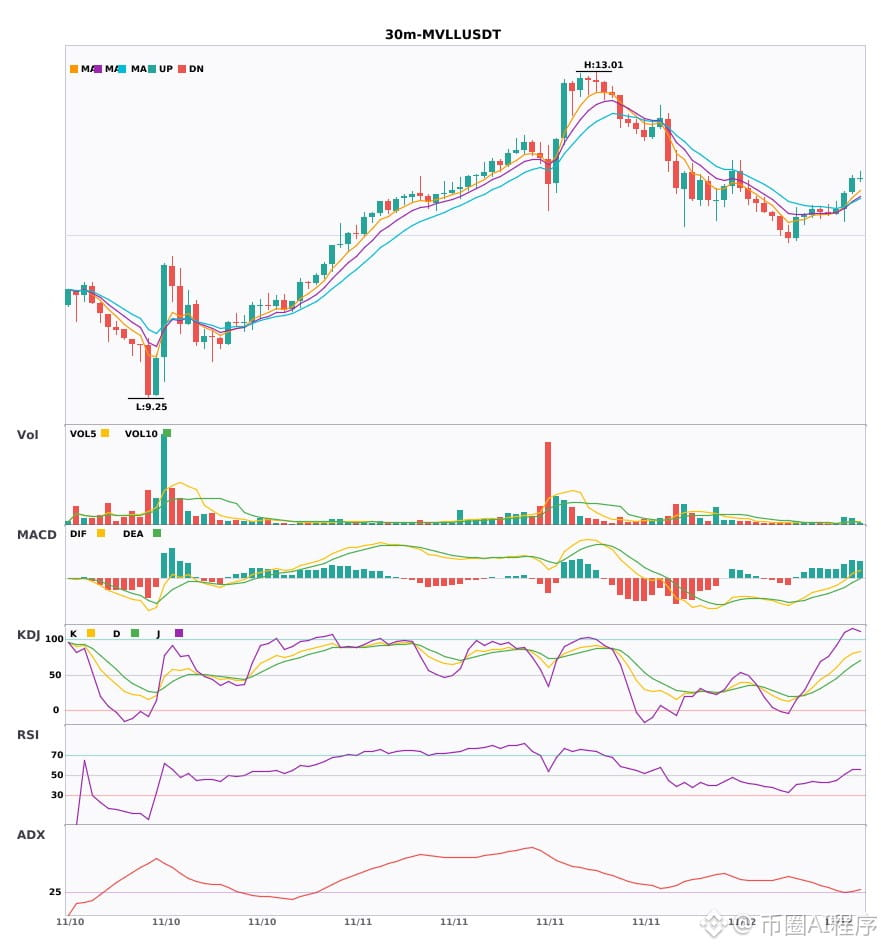
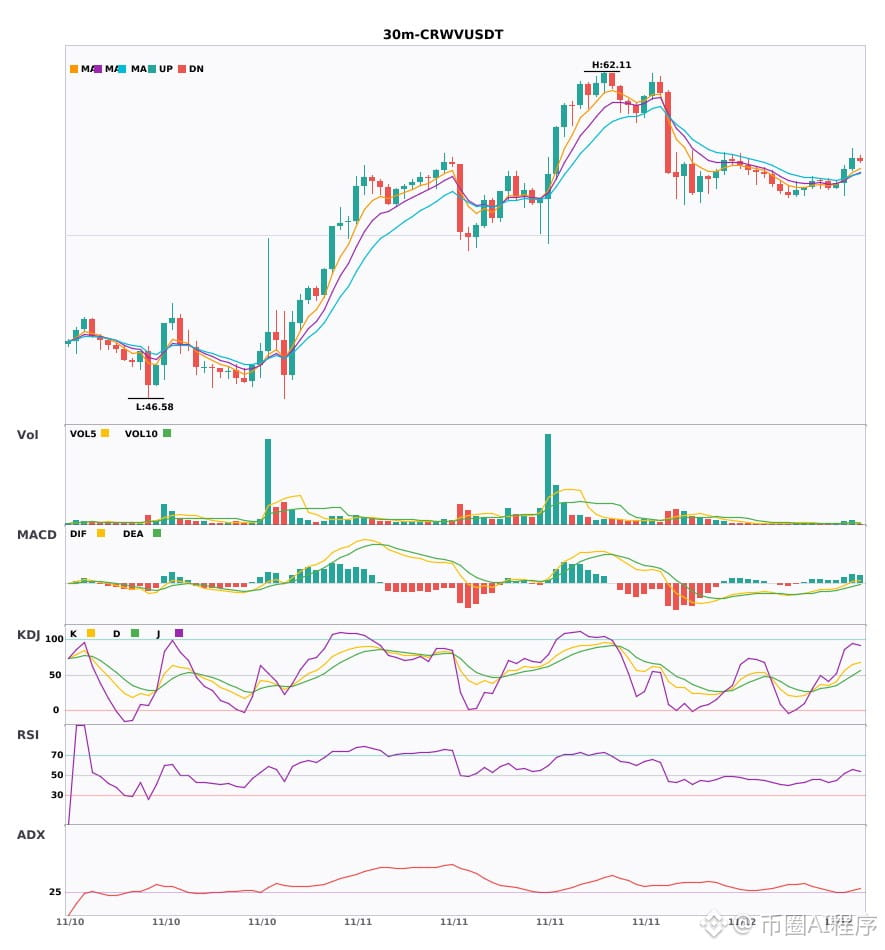
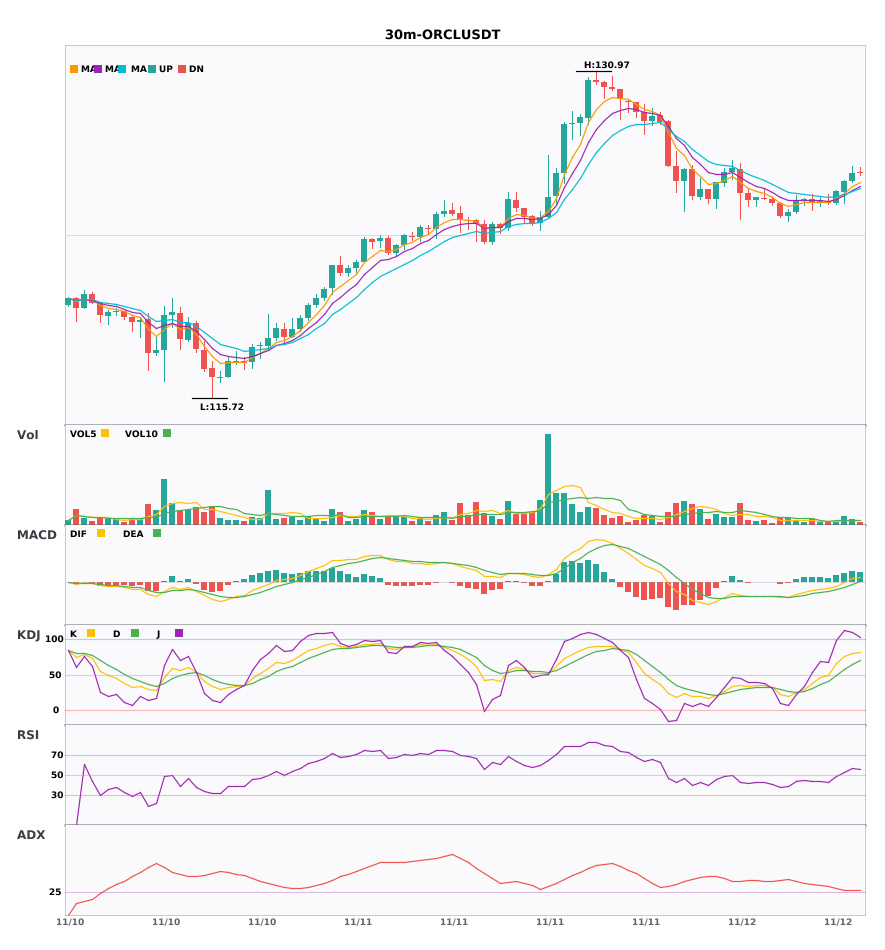
$MVLL / $CRWV / $ORCL 30-minute bullish + 4-hour bullish alignment, multi-timeframe resonance turns bullish 🔥
════════════════════
🔴 $MVLL 30-minute bullish signal
⚠️Technical analysis: 4-hour bullish resonance confirmed | 30-minute entry: MACD DIF breaks above the zero line, trend turns bullish | EMA5 > EMA8 > EMA13 bullish alignment | KDJ running strongly, bulls in control (K: 80.5, D: 63.2) | Volume explosion (2.9x)
════════════════════
🔴 $CRWV 30-minute bullish signal
⚠️Technical analysis: 4-hour bullish resonance confirmed | 30-minute entry: MACD DIF breaks above the zero line, trend turns bullish | EMA5 > EMA8 > EMA13 bullish alignment | Volume increases (2.2x)
════════════════════
🔴 $ORCL 30-minute bullish signal
⚠️Technical analysis: 4-hour bullish resonance confirmed | 30-minute entry: MACD is bullish, trend is strong, momentum is increasing | EMA5 > EMA8 > EMA13 bullish alignment | KDJ running strongly, bulls in control (K: 79.9, D: 65.3) | Volume increases (2.0x)
════════════════════
🔔 Follow for the latest market movements 🔔
#多周期共振 #MVLL #CRWV #ORCL
📌 When trading, pay attention to whether the candlestick pattern confirms the setup
$MVLL / $CRWV / $ORCL 30-minute bullish + 4-hour bullish alignment, multi-timeframe resonance turns bullish 🔥
════════════════════
🔴 $MVLL 30-minute bullish signal
⚠️Technical analysis: 4-hour bullish resonance confirmed | 30-minute entry: MACD DIF breaks above the zero line, trend turns bullish | EMA5 > EMA8 > EMA13 bullish alignment | KDJ running strongly, bulls in control (K: 80.5, D: 63.2) | Volume explosion (2.9x)
════════════════════
🔴 $CRWV 30-minute bullish signal
⚠️Technical analysis: 4-hour bullish resonance confirmed | 30-minute entry: MACD DIF breaks above the zero line, trend turns bullish | EMA5 > EMA8 > EMA13 bullish alignment | Volume increases (2.2x)
════════════════════
🔴 $ORCL 30-minute bullish signal
⚠️Technical analysis: 4-hour bullish resonance confirmed | 30-minute entry: MACD is bullish, trend is strong, momentum is increasing | EMA5 > EMA8 > EMA13 bullish alignment | KDJ running strongly, bulls in control (K: 79.9, D: 65.3) | Volume increases (2.0x)
════════════════════
🔔 Follow for the latest market movements 🔔
#多周期共振 #MVLL #CRWV #ORCL
📌 When trading, pay attention to whether the candlestick pattern confirms the setup
════════════════════
🔴 $MVLL 30-minute bullish signal
⚠️Technical analysis: 4-hour bullish resonance confirmed | 30-minute entry: MACD DIF breaks above the zero line, trend turns bullish | EMA5 > EMA8 > EMA13 bullish alignment | KDJ running strongly, bulls in control (K: 80.5, D: 63.2) | Volume explosion (2.9x)
════════════════════
🔴 $CRWV 30-minute bullish signal
⚠️Technical analysis: 4-hour bullish resonance confirmed | 30-minute entry: MACD DIF breaks above the zero line, trend turns bullish | EMA5 > EMA8 > EMA13 bullish alignment | Volume increases (2.2x)
════════════════════
🔴 $ORCL 30-minute bullish signal
⚠️Technical analysis: 4-hour bullish resonance confirmed | 30-minute entry: MACD is bullish, trend is strong, momentum is increasing | EMA5 > EMA8 > EMA13 bullish alignment | KDJ running strongly, bulls in control (K: 79.9, D: 65.3) | Volume increases (2.0x)
════════════════════
🔔 Follow for the latest market movements 🔔
#多周期共振 #MVLL #CRWV #ORCL
📌 When trading, pay attention to whether the candlestick pattern confirms the setup
6
·
--
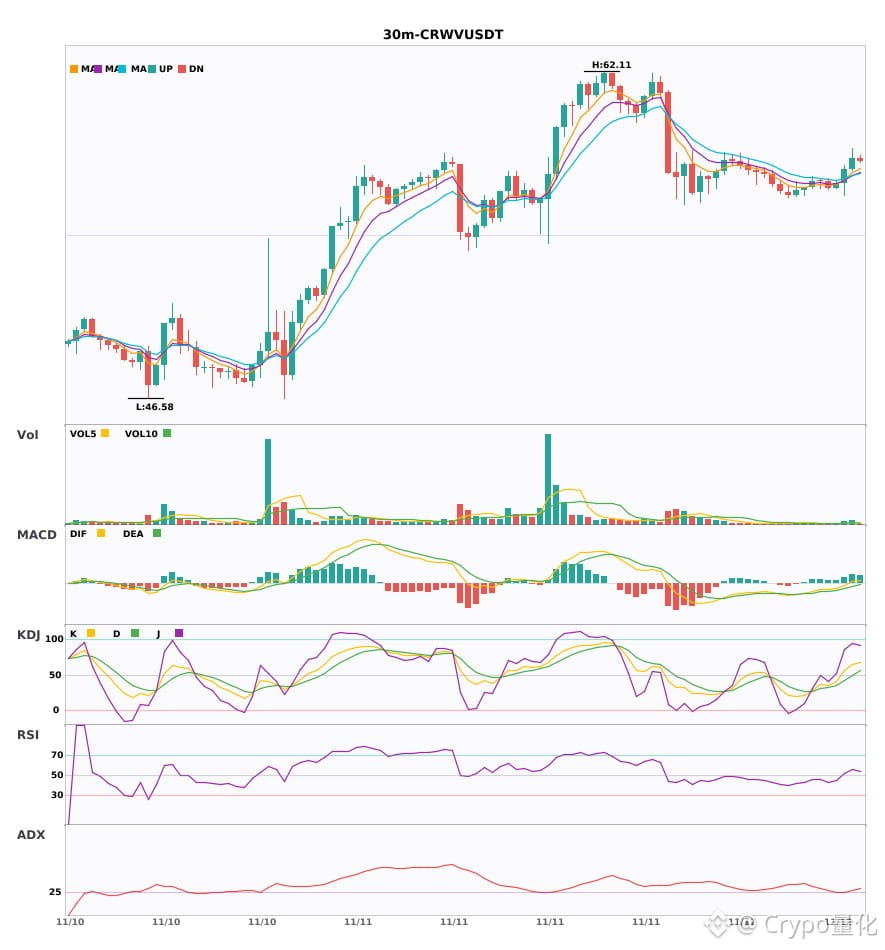
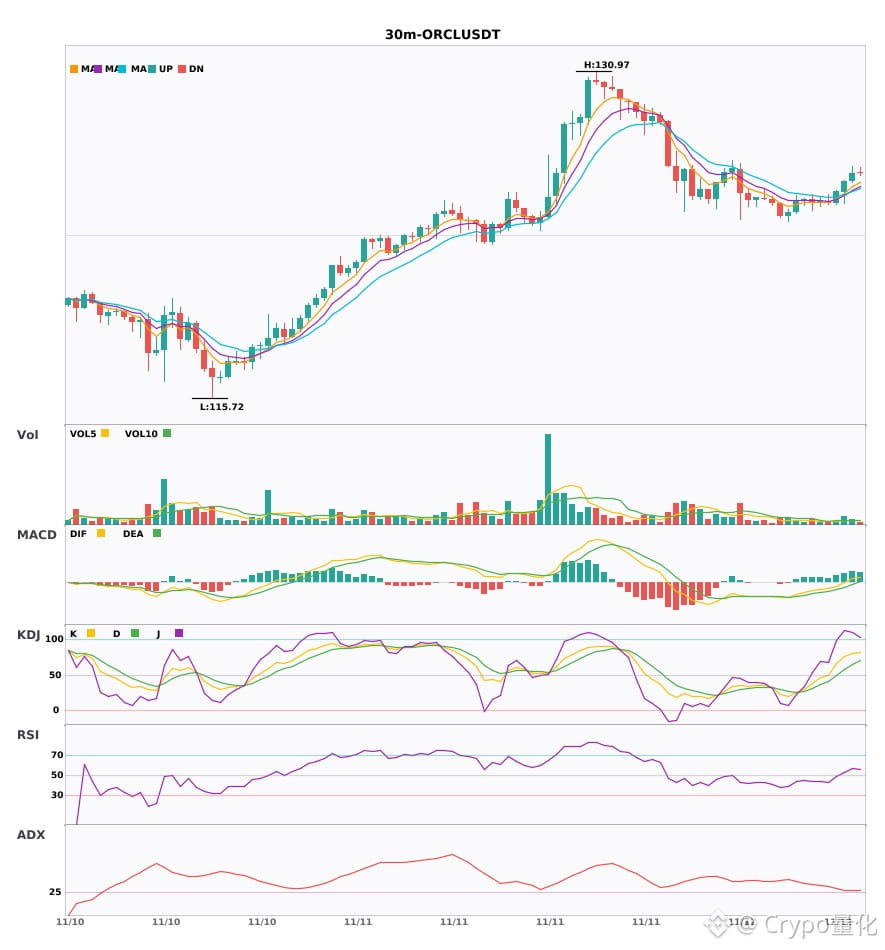
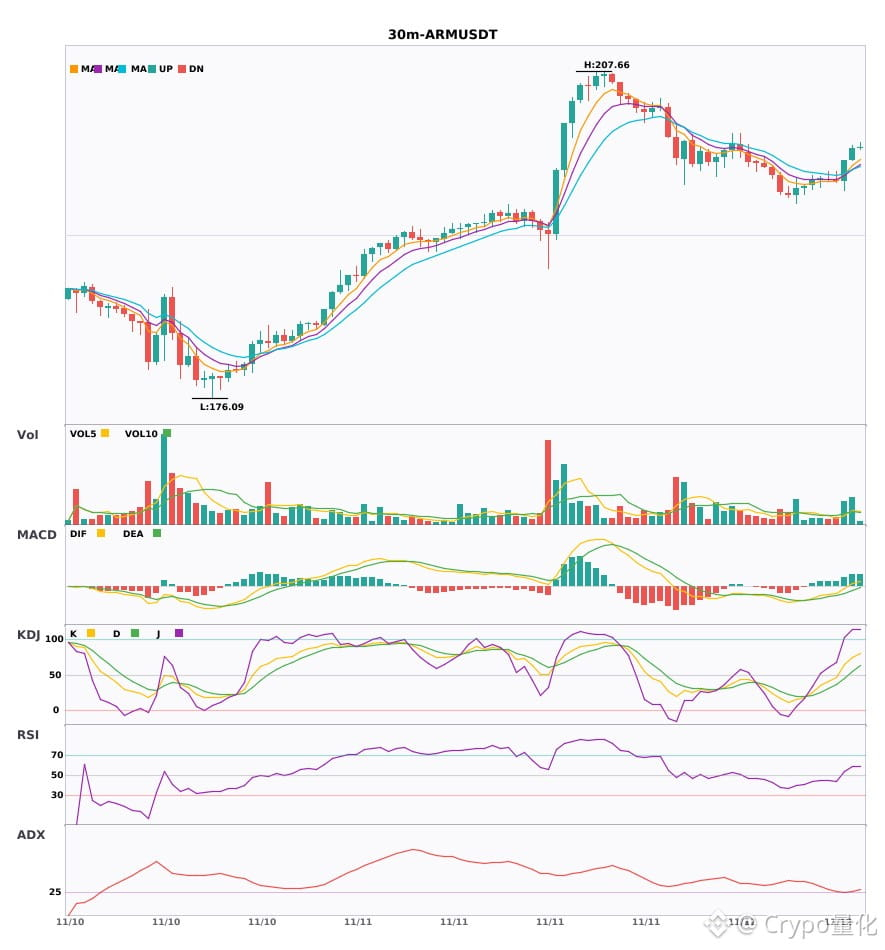
$CRWV / $ORCL / $ARM 30-minute confluence turns bullish, with bullish signals appearing simultaneously🔥
════════════════════
🔴 $CRWV 30-minute bullish signal
⚠️Technical analysis: ADX(29) Trend is forming; participation is possible | MACD DIF breaks above the zero line, turning the trend bullish | EMA5 > EMA8 > EMA13, bullish alignment | Volume increases (2.2x)
════════════════════
🔴 $ORCL 30-minute bullish signal
⚠️Technical analysis: ADX(28) Trend is forming; participation is possible | MACD is bullish, with a strong trend and increasing momentum | EMA5 > EMA8 > EMA13, bullish alignment | KDJ is running strongly, with bulls in control (K: 79.9, D: 65.3) | Volume increases (2.0x)
════════════════════
🔴 $ARM 30-minute bullish signal
⚠️Technical analysis: ADX(27) Trend is forming; participation is possible | MACD DIF breaks above the zero line, turning the trend bullish | EMA5 > EMA8 > EMA13, bullish alignment | KDJ is running strongly, with bulls in control (K: 74.7, D: 55.2) | Volume increases (2.1x)
════════════════════
🔔 Follow for first-hand market updates and unusual movements 🔔
#技术分析 #CRWV #ORCL #ARM
📌 When trading, pay attention to whether the candlestick pattern meets expectations
$CRWV / $ORCL / $ARM 30-minute confluence turns bullish, with bullish signals appearing simultaneously🔥
════════════════════
🔴 $CRWV 30-minute bullish signal
⚠️Technical analysis: ADX(29) Trend is forming; participation is possible | MACD DIF breaks above the zero line, turning the trend bullish | EMA5 > EMA8 > EMA13, bullish alignment | Volume increases (2.2x)
════════════════════
🔴 $ORCL 30-minute bullish signal
⚠️Technical analysis: ADX(28) Trend is forming; participation is possible | MACD is bullish, with a strong trend and increasing momentum | EMA5 > EMA8 > EMA13, bullish alignment | KDJ is running strongly, with bulls in control (K: 79.9, D: 65.3) | Volume increases (2.0x)
════════════════════
🔴 $ARM 30-minute bullish signal
⚠️Technical analysis: ADX(27) Trend is forming; participation is possible | MACD DIF breaks above the zero line, turning the trend bullish | EMA5 > EMA8 > EMA13, bullish alignment | KDJ is running strongly, with bulls in control (K: 74.7, D: 55.2) | Volume increases (2.1x)
════════════════════
🔔 Follow for first-hand market updates and unusual movements 🔔
#技术分析 #CRWV #ORCL #ARM
📌 When trading, pay attention to whether the candlestick pattern meets expectations
════════════════════
🔴 $CRWV 30-minute bullish signal
⚠️Technical analysis: ADX(29) Trend is forming; participation is possible | MACD DIF breaks above the zero line, turning the trend bullish | EMA5 > EMA8 > EMA13, bullish alignment | Volume increases (2.2x)
════════════════════
🔴 $ORCL 30-minute bullish signal
⚠️Technical analysis: ADX(28) Trend is forming; participation is possible | MACD is bullish, with a strong trend and increasing momentum | EMA5 > EMA8 > EMA13, bullish alignment | KDJ is running strongly, with bulls in control (K: 79.9, D: 65.3) | Volume increases (2.0x)
════════════════════
🔴 $ARM 30-minute bullish signal
⚠️Technical analysis: ADX(27) Trend is forming; participation is possible | MACD DIF breaks above the zero line, turning the trend bullish | EMA5 > EMA8 > EMA13, bullish alignment | KDJ is running strongly, with bulls in control (K: 74.7, D: 55.2) | Volume increases (2.1x)
════════════════════
🔔 Follow for first-hand market updates and unusual movements 🔔
#技术分析 #CRWV #ORCL #ARM
📌 When trading, pay attention to whether the candlestick pattern meets expectations
4
·
--
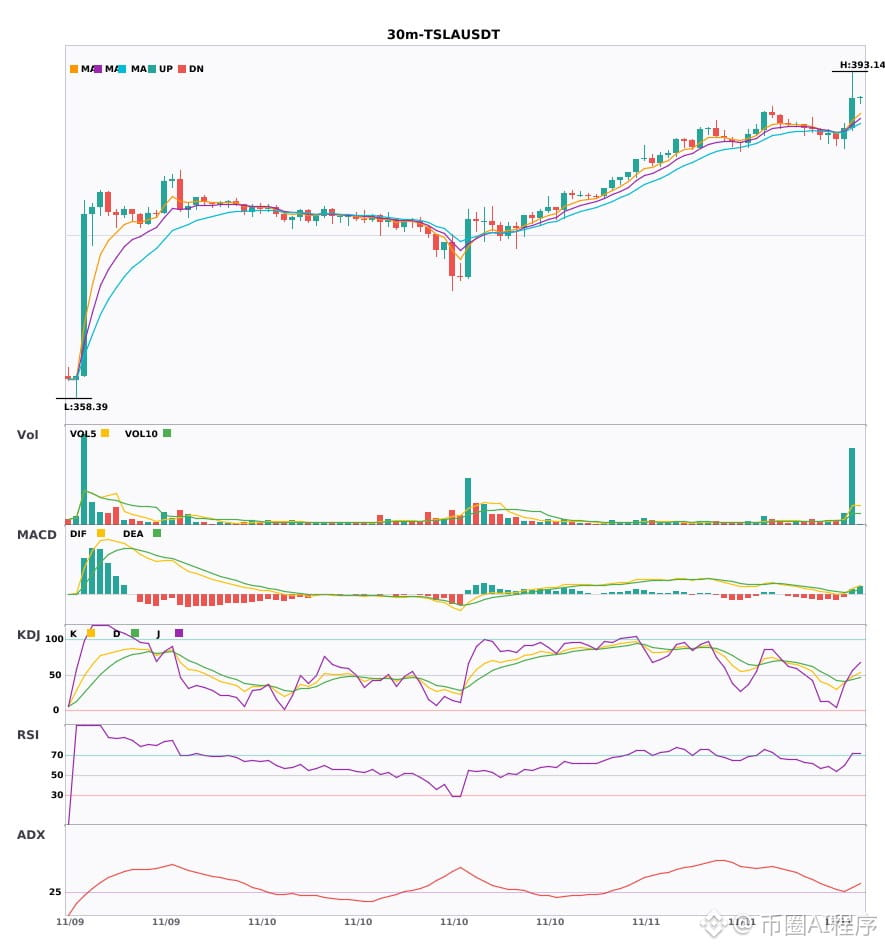
Multi-timeframe resonance: $TSLA / $AGT / $ORCL strengthening on the 30-minute chart, with the 4-hour bullish trend confirmed🔥
════════════════════
🔴 $TSLA 30-minute bullish signal
⚠️Technical analysis: 4-hour bullish confluence confirmed | 30-minute entry: MACD bullish crossover above zero, bullish momentum released | EMA5 crosses above EMA8, short-term trend turns bullish | KDJ bullish crossover, short-term outlook bullish (K: 47.9, D: 43.6) | Volume surge (6.5x)
════════════════════
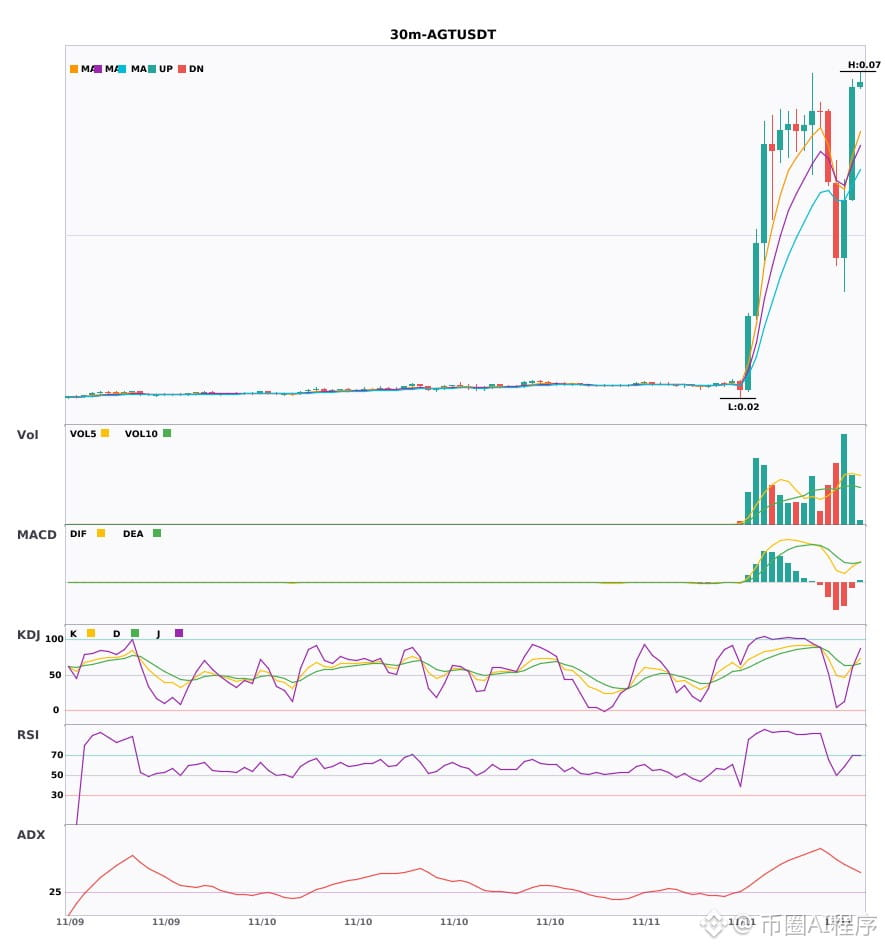
🔴 $AGT 30-minute bullish signal
⚠️Technical analysis: 4-hour bullish confluence confirmed | 30-minute entry: EMA5 crosses above EMA8, short-term trend turns bullish | KDJ running strong, bulls have the upper hand (K: 62.6, D: 63.4) | Volume increases (2.3x)
════════════════════
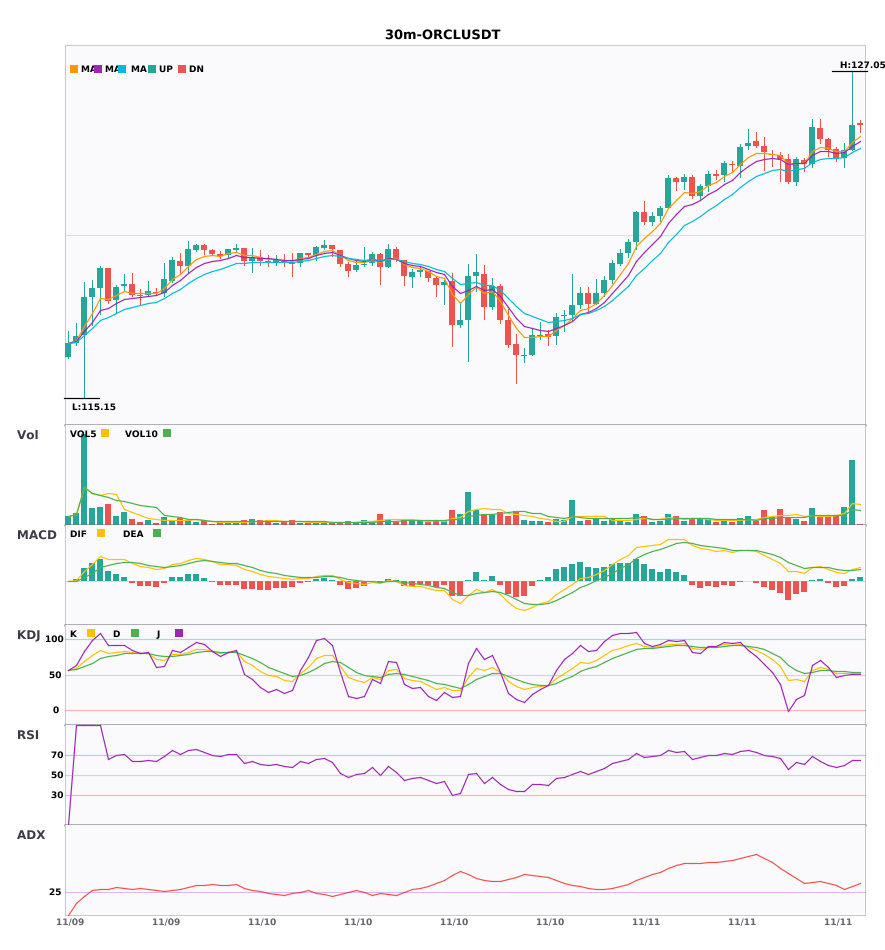
🔴 $ORCL 30-minute bullish signal
⚠️Technical analysis: 4-hour bullish confluence confirmed | 30-minute entry: MACD bullish crossover above zero, bullish momentum released | EMA5 > EMA8 > EMA13, bullish alignment | KDJ running strong, bulls have the upper hand (K: 52.6, D: 53.7) | Volume surge (4.1x)
════════════════════
🔔 Follow for real-time market alerts 🔔
#多周期共振 #TSLA #AGT #ORCL
📌 When trading, pay attention to whether the candlestick pattern confirms the setup
Multi-timeframe resonance: $TSLA / $AGT / $ORCL strengthening on the 30-minute chart, with the 4-hour bullish trend confirmed🔥
════════════════════
🔴 $TSLA 30-minute bullish signal
⚠️Technical analysis: 4-hour bullish confluence confirmed | 30-minute entry: MACD bullish crossover above zero, bullish momentum released | EMA5 crosses above EMA8, short-term trend turns bullish | KDJ bullish crossover, short-term outlook bullish (K: 47.9, D: 43.6) | Volume surge (6.5x)
════════════════════
🔴 $AGT 30-minute bullish signal
⚠️Technical analysis: 4-hour bullish confluence confirmed | 30-minute entry: EMA5 crosses above EMA8, short-term trend turns bullish | KDJ running strong, bulls have the upper hand (K: 62.6, D: 63.4) | Volume increases (2.3x)
════════════════════
🔴 $ORCL 30-minute bullish signal
⚠️Technical analysis: 4-hour bullish confluence confirmed | 30-minute entry: MACD bullish crossover above zero, bullish momentum released | EMA5 > EMA8 > EMA13, bullish alignment | KDJ running strong, bulls have the upper hand (K: 52.6, D: 53.7) | Volume surge (4.1x)
════════════════════
🔔 Follow for real-time market alerts 🔔
#多周期共振 #TSLA #AGT #ORCL
📌 When trading, pay attention to whether the candlestick pattern confirms the setup
════════════════════
🔴 $TSLA 30-minute bullish signal
⚠️Technical analysis: 4-hour bullish confluence confirmed | 30-minute entry: MACD bullish crossover above zero, bullish momentum released | EMA5 crosses above EMA8, short-term trend turns bullish | KDJ bullish crossover, short-term outlook bullish (K: 47.9, D: 43.6) | Volume surge (6.5x)
════════════════════
🔴 $AGT 30-minute bullish signal
⚠️Technical analysis: 4-hour bullish confluence confirmed | 30-minute entry: EMA5 crosses above EMA8, short-term trend turns bullish | KDJ running strong, bulls have the upper hand (K: 62.6, D: 63.4) | Volume increases (2.3x)
════════════════════
🔴 $ORCL 30-minute bullish signal
⚠️Technical analysis: 4-hour bullish confluence confirmed | 30-minute entry: MACD bullish crossover above zero, bullish momentum released | EMA5 > EMA8 > EMA13, bullish alignment | KDJ running strong, bulls have the upper hand (K: 52.6, D: 53.7) | Volume surge (4.1x)
════════════════════
🔔 Follow for real-time market alerts 🔔
#多周期共振 #TSLA #AGT #ORCL
📌 When trading, pay attention to whether the candlestick pattern confirms the setup
8
·
--
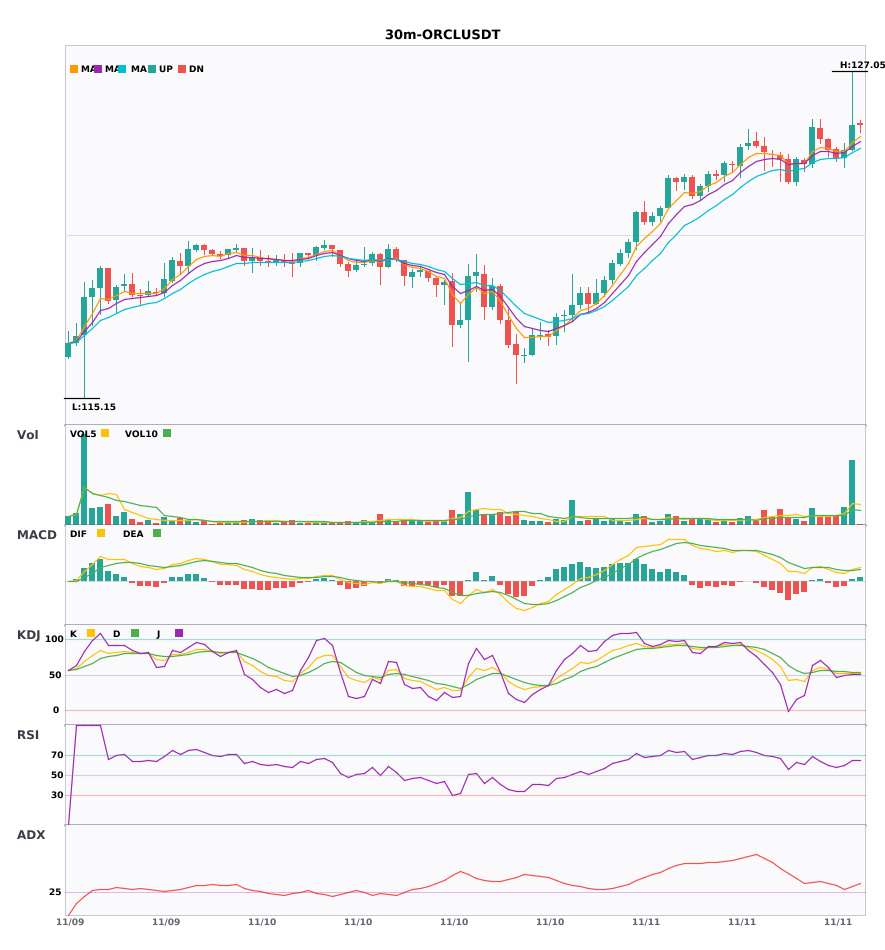
3 simultaneous 30-minute bullish signals: $TSLA / $BMNR / $ORCL🔥
════════════════════
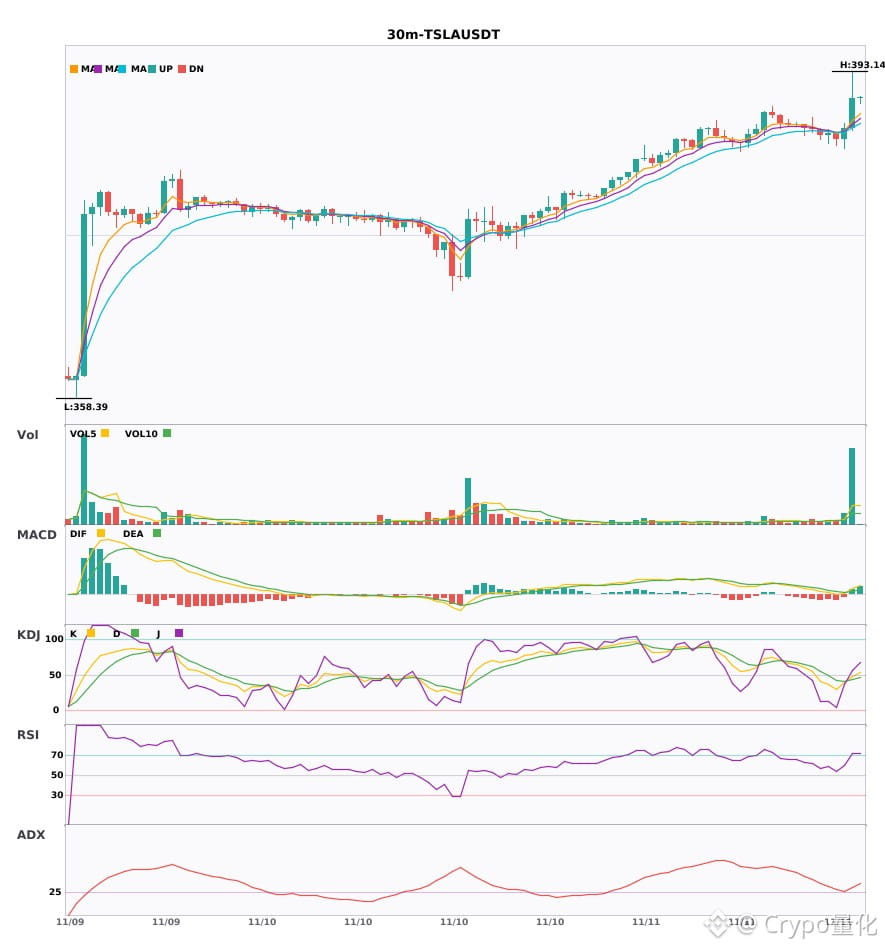
🔴 $TSLA 30-minute bullish signal
⚠️Technical analysis: ADX(30) Trend is forming; opportunity to participate | MACD bullish crossover above zero, bullish momentum released | EMA5 crossed above EMA8, short-term trend turns bullish | KDJ bullish crossover, short-term outlook bullish (K: 47.9, D: 43.6) | Volume surge (6.5x)
════════════════════
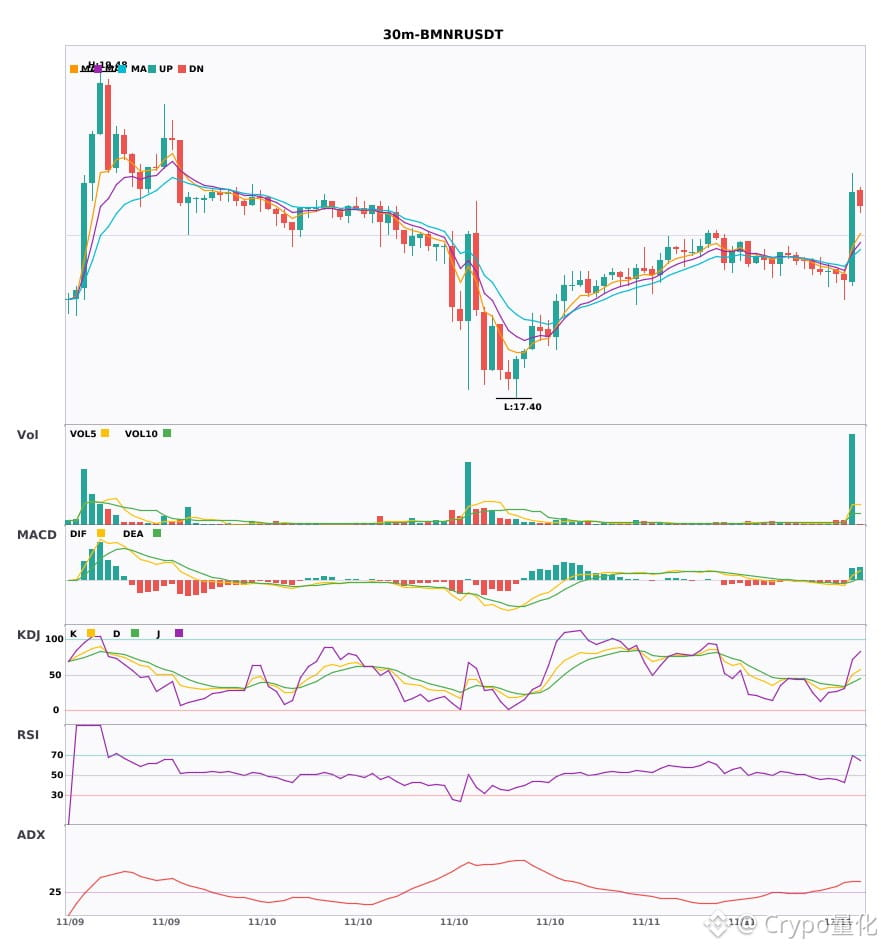
🔴 $BMNR 30-minute bullish signal
⚠️Technical analysis: ADX(41) Clear trending market | MACD bullish crossover above zero, bullish momentum released | EMA5 crossed above EMA8, short-term trend turns bullish | KDJ bullish crossover, short-term outlook bullish (K: 50.4, D: 39.5) | Volume surge (8.2x)
════════════════════
🔴 $ORCL 30-minute bullish signal
⚠️Technical analysis: ADX(31) Clear trending market | MACD bullish crossover above zero, bullish momentum released | EMA5 > EMA8 > EMA13, bullish alignment | KDJ trending strongly, bulls in control (K: 52.6, D: 53.7) | Volume surge (4.1x)
════════════════════
🔔 Follow for first-hand market alerts 🔔
#技术分析 #TSLA #BMNR #ORCL
📌 When trading, watch whether the candlestick pattern confirms the signal
3 simultaneous 30-minute bullish signals: $TSLA / $BMNR / $ORCL 🔥
════════════════════
🔴 $TSLA 30-minute bullish signal
⚠️Technical analysis: ADX(30) Trend is forming; opportunity to participate | MACD bullish crossover above zero, bullish momentum released | EMA5 crossed above EMA8, short-term trend turns bullish | KDJ bullish crossover, short-term outlook bullish (K: 47.9, D: 43.6) | Volume surge (6.5x)
════════════════════
🔴 $BMNR 30-minute bullish signal
⚠️Technical analysis: ADX(41) Clear trending market | MACD bullish crossover above zero, bullish momentum released | EMA5 crossed above EMA8, short-term trend turns bullish | KDJ bullish crossover, short-term outlook bullish (K: 50.4, D: 39.5) | Volume surge (8.2x)
════════════════════
🔴 $ORCL 30-minute bullish signal
⚠️Technical analysis: ADX(31) Clear trending market | MACD bullish crossover above zero, bullish momentum released | EMA5 > EMA8 > EMA13, bullish alignment | KDJ trending strongly, bulls in control (K: 52.6, D: 53.7) | Volume surge (4.1x)
════════════════════
🔔 Follow for first-hand market alerts 🔔
#技术分析 #TSLA #BMNR #ORCL
📌 When trading, watch whether the candlestick pattern confirms the signal
════════════════════
🔴 $TSLA 30-minute bullish signal
⚠️Technical analysis: ADX(30) Trend is forming; opportunity to participate | MACD bullish crossover above zero, bullish momentum released | EMA5 crossed above EMA8, short-term trend turns bullish | KDJ bullish crossover, short-term outlook bullish (K: 47.9, D: 43.6) | Volume surge (6.5x)
════════════════════
🔴 $BMNR 30-minute bullish signal
⚠️Technical analysis: ADX(41) Clear trending market | MACD bullish crossover above zero, bullish momentum released | EMA5 crossed above EMA8, short-term trend turns bullish | KDJ bullish crossover, short-term outlook bullish (K: 50.4, D: 39.5) | Volume surge (8.2x)
════════════════════
🔴 $ORCL 30-minute bullish signal
⚠️Technical analysis: ADX(31) Clear trending market | MACD bullish crossover above zero, bullish momentum released | EMA5 > EMA8 > EMA13, bullish alignment | KDJ trending strongly, bulls in control (K: 52.6, D: 53.7) | Volume surge (4.1x)
════════════════════
🔔 Follow for first-hand market alerts 🔔
#技术分析 #TSLA #BMNR #ORCL
📌 When trading, watch whether the candlestick pattern confirms the signal
2

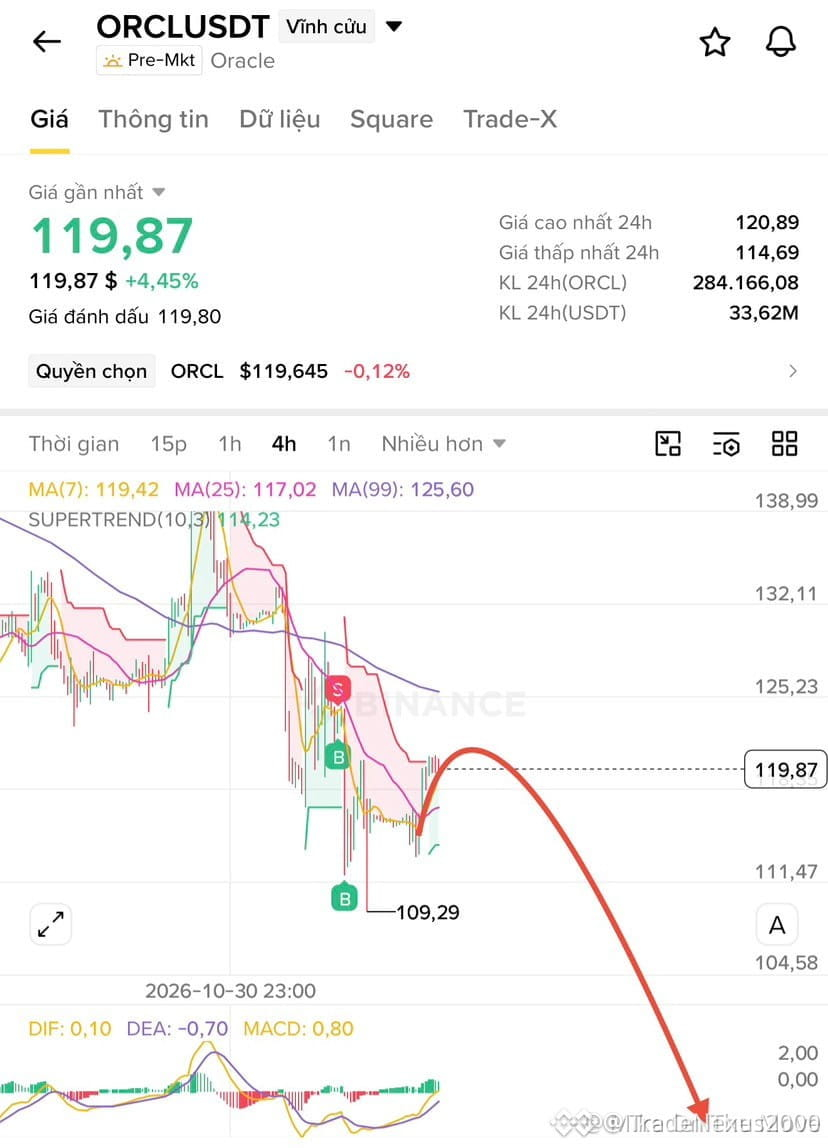
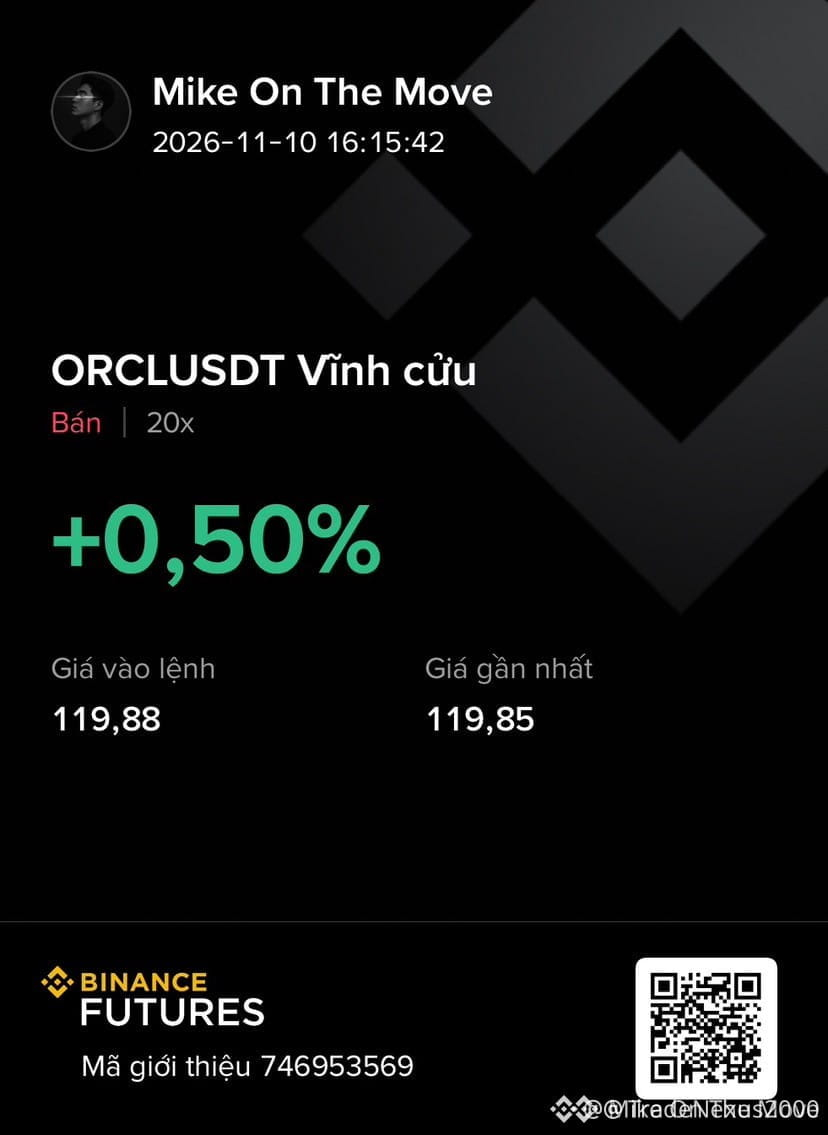
🚨 SMART MONEY DISTRIBUTION AT KEY RESISTANCE UNLOCKS A HIGH-PROBABILITY SHORT ON $ORCL ! 📉
Entry: 118.8 - 121.2 ⚡
Target: 116 🚀
Target: 112 🎯
Target: 110 💥
Stop Loss: 130.0 🛑
Institutional order flow is showing clear signs of absorption inside this premium supply zone as sellers step in to cap upside momentum. 📊 The rejection from the upper boundary confirms heavy overhead distribution and a lack of sustained buyer participation at elevated prices. 💡
As price rotates back toward internal liquidity pools below, expect accelerated downside velocity once local range support gives way. 🌊 Are you positioning for this impulsive markdown or waiting for confirmation? 👇
⚠️ Not financial advice. Always manage your risk. 🛡️
🏷️ #ORCL #ShortSetup #SmartMoney #OrderBlock #Trading
🦈 ⚖️
🚨 SMART MONEY DISTRIBUTION AT KEY RESISTANCE UNLOCKS A HIGH-PROBABILITY SHORT ON $ORCL ! 📉
Entry: 118.8 - 121.2 ⚡
Target: 116 🚀
Target: 112 🎯
Target: 110 💥
Stop Loss: 130.0 🛑
Institutional order flow is showing clear signs of absorption inside this premium supply zone as sellers step in to cap upside momentum. 📊 The rejection from the upper boundary confirms heavy overhead distribution and a lack of sustained buyer participation at elevated prices. 💡
As price rotates back toward internal liquidity pools below, expect accelerated downside velocity once local range support gives way. 🌊 Are you positioning for this impulsive markdown or waiting for confirmation? 👇
⚠️ Not financial advice. Always manage your risk. 🛡️
🏷️ #ORCL #ShortSetup #SmartMoney #OrderBlock #Trading
🦈 ⚖️
Entry: 118.8 - 121.2 ⚡
Target: 116 🚀
Target: 112 🎯
Target: 110 💥
Stop Loss: 130.0 🛑
Institutional order flow is showing clear signs of absorption inside this premium supply zone as sellers step in to cap upside momentum. 📊 The rejection from the upper boundary confirms heavy overhead distribution and a lack of sustained buyer participation at elevated prices. 💡
As price rotates back toward internal liquidity pools below, expect accelerated downside velocity once local range support gives way. 🌊 Are you positioning for this impulsive markdown or waiting for confirmation? 👇
⚠️ Not financial advice. Always manage your risk. 🛡️
🏷️ #ORCL #ShortSetup #SmartMoney #OrderBlock #Trading
🦈 ⚖️
5

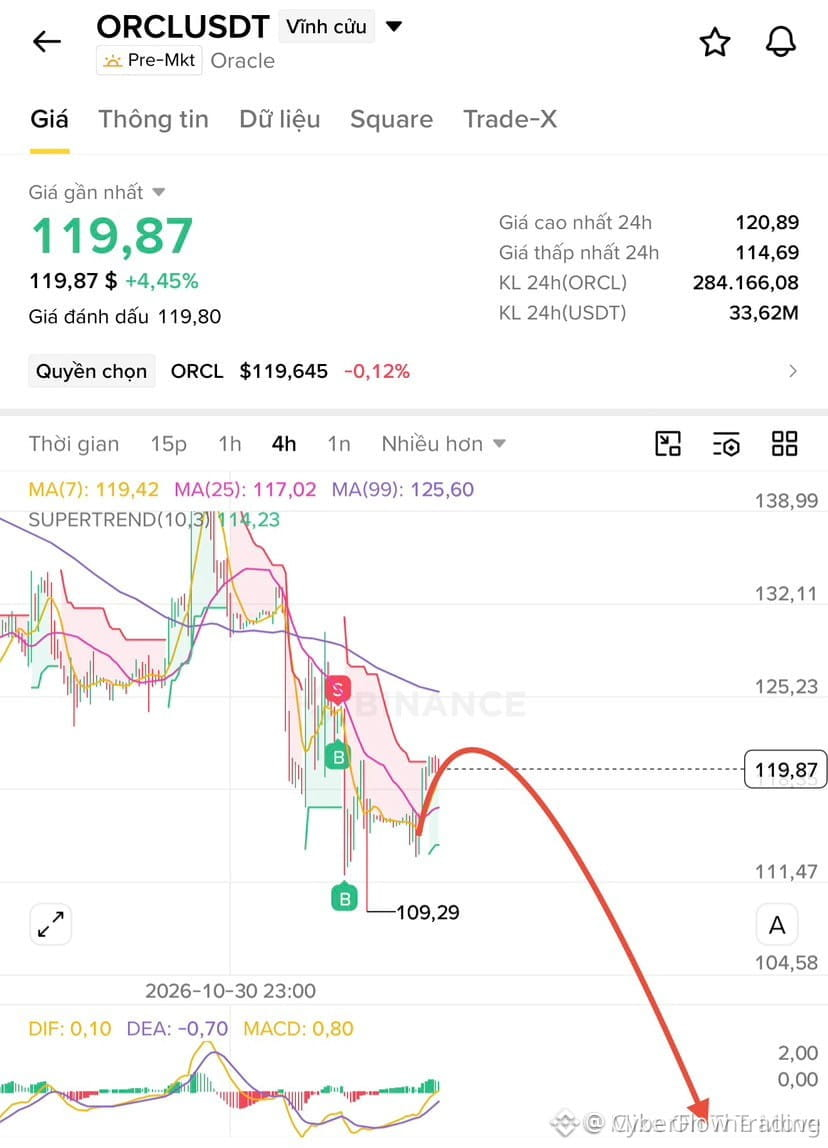
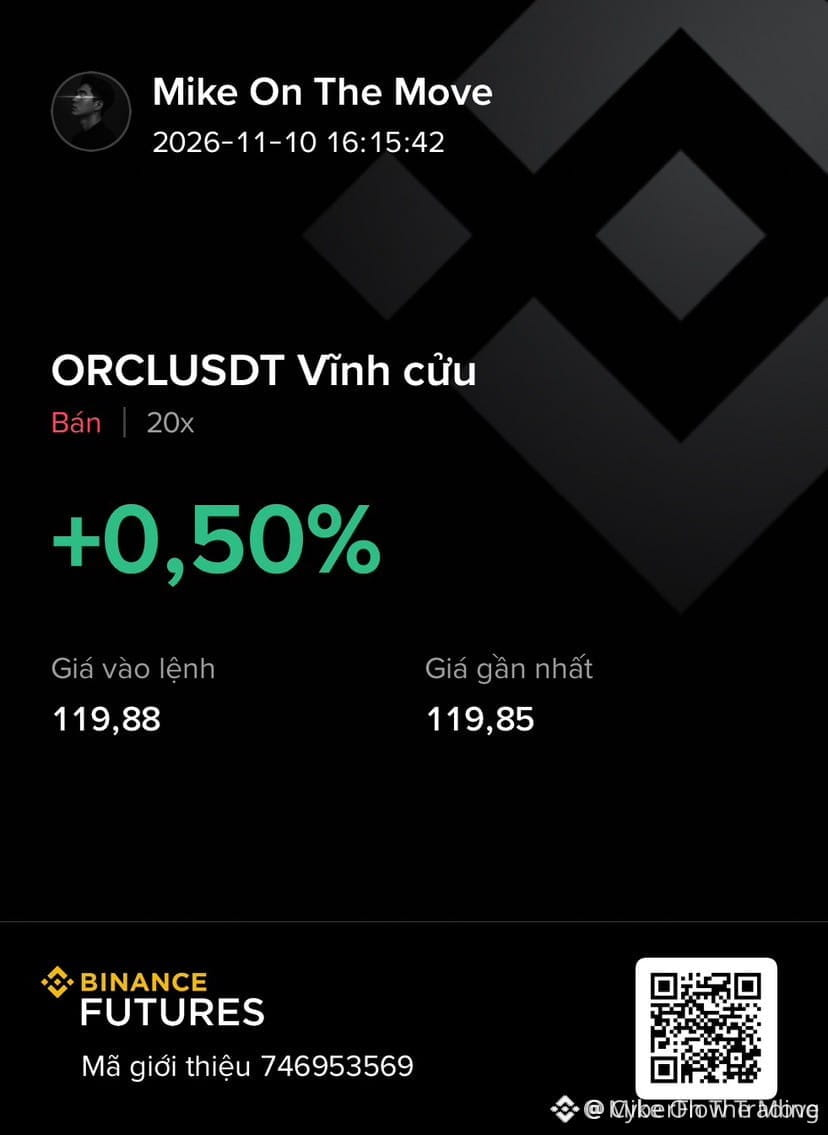
📉 $ORCL IS TAPPED OUT AT RESISTANCE AS SELLERS STEP IN FOR A PULLBACK! 🛑
Entry: 118.8 - 121.2 ⚡
Target: 110.0 - 116.0 🚀
Stop Loss: 130.0 ⚠️
Momentum is fading fast right into heavy overhead supply, leaving aggressive buyers stranded as sellers take total control of the order book. 📊
Order flow reveals a thick wall of limit asks stacking up near the upper boundary, setting the stage for an aggressive downward slide toward major liquidity pockets. ⚡ Are you fading this resistance test right now or waiting for a confirmed breakdown? 🤔
⚠️ Not financial advice. Always manage your risk. 🛡️
🏷️ #ORCL #ShortSetup #Trading #MarketPullback
🔥 📉
📉 $ORCL IS TAPPED OUT AT RESISTANCE AS SELLERS STEP IN FOR A PULLBACK! 🛑
Entry: 118.8 - 121.2 ⚡
Target: 110.0 - 116.0 🚀
Stop Loss: 130.0 ⚠️
Momentum is fading fast right into heavy overhead supply, leaving aggressive buyers stranded as sellers take total control of the order book. 📊
Order flow reveals a thick wall of limit asks stacking up near the upper boundary, setting the stage for an aggressive downward slide toward major liquidity pockets. ⚡ Are you fading this resistance test right now or waiting for a confirmed breakdown? 🤔
⚠️ Not financial advice. Always manage your risk. 🛡️
🏷️ #ORCL #ShortSetup #Trading #MarketPullback
🔥 📉
Entry: 118.8 - 121.2 ⚡
Target: 110.0 - 116.0 🚀
Stop Loss: 130.0 ⚠️
Momentum is fading fast right into heavy overhead supply, leaving aggressive buyers stranded as sellers take total control of the order book. 📊
Order flow reveals a thick wall of limit asks stacking up near the upper boundary, setting the stage for an aggressive downward slide toward major liquidity pockets. ⚡ Are you fading this resistance test right now or waiting for a confirmed breakdown? 🤔
⚠️ Not financial advice. Always manage your risk. 🛡️
🏷️ #ORCL #ShortSetup #Trading #MarketPullback
🔥 📉
8
·
--
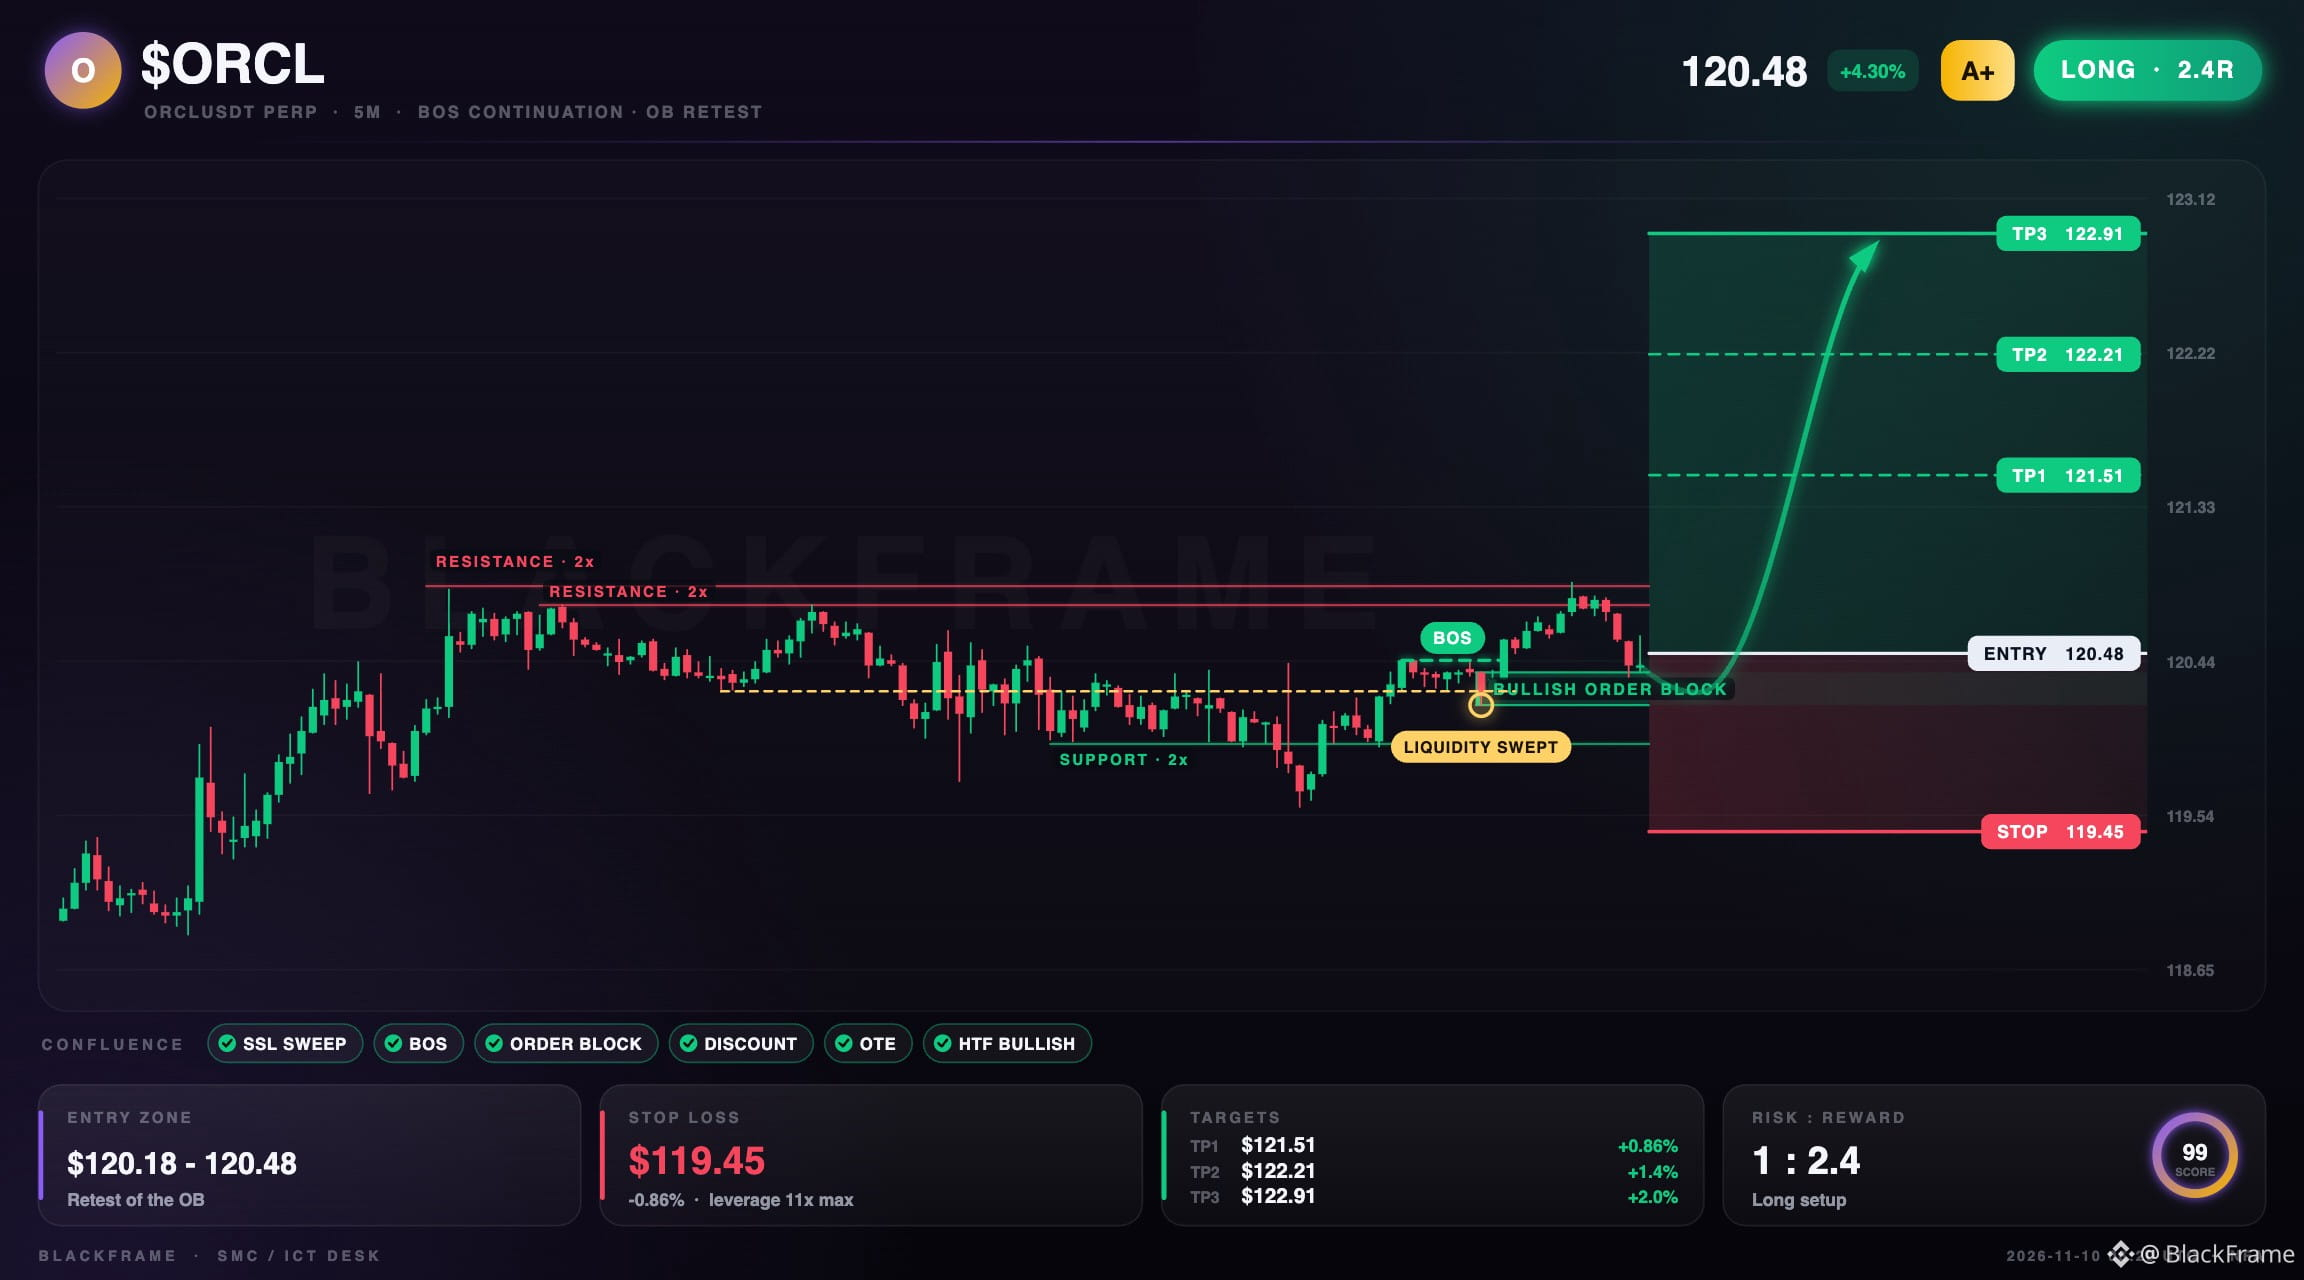
🚀 $ORCL bullish order flow intact
LONG · 5M
Entry: $120.37 - $120.48
TP1: $121.51
TP2: $122.21
TP3: $122.91
SL: $119.45
Sell-side liquidity below the last swing low was swept and price closed back inside. Structure continues higher with a fresh BOS on the 5M. Entry is the first retest of the fresh bullish order block in discount, targeting buy-side liquidity above.
#ORCL #ICT · NFA
🚀 $ORCL bullish order flow intact
LONG · 5M
Entry: $120.37 - $120.48
TP1: $121.51
TP2: $122.21
TP3: $122.91
SL: $119.45
Sell-side liquidity below the last swing low was swept and price closed back inside. Structure continues higher with a fresh BOS on the 5M. Entry is the first retest of the fresh bullish order block in discount, targeting buy-side liquidity above.
#ORCL #ICT · NFA
LONG · 5M
Entry: $120.37 - $120.48
TP1: $121.51
TP2: $122.21
TP3: $122.91
SL: $119.45
Sell-side liquidity below the last swing low was swept and price closed back inside. Structure continues higher with a fresh BOS on the 5M. Entry is the first retest of the fresh bullish order block in discount, targeting buy-side liquidity above.
#ORCL #ICT · NFA
91
·
--
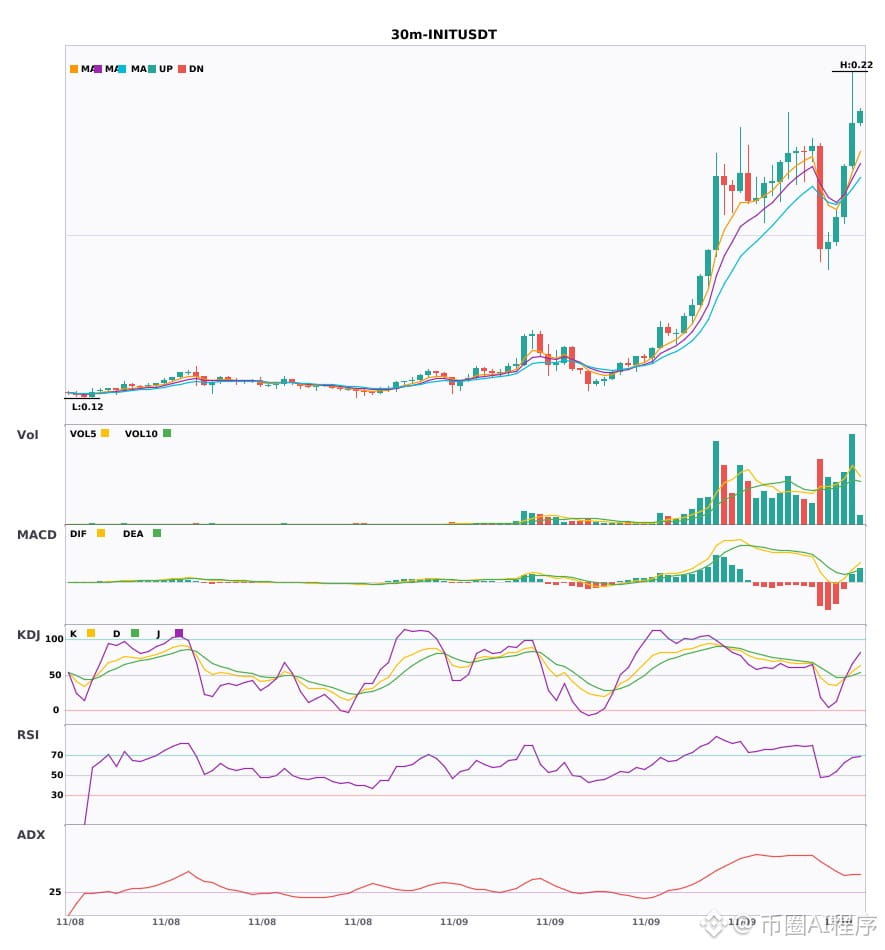
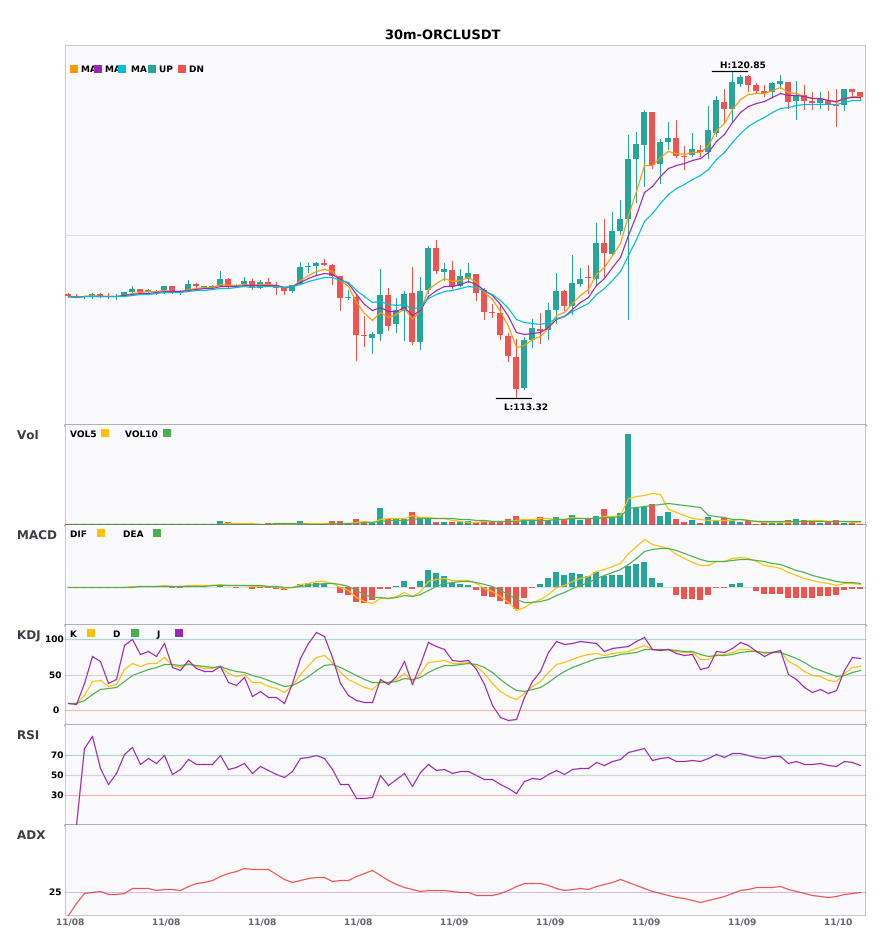
Multi-timeframe confluence: $INIT / $ORCL strengthening on the 30-minute chart; 4-hour bullish trend confirmed 🔥
════════════════════
🔴 $INIT 30-minute bullish signal
⚠️ Technical analysis: 4-hour bullish confluence confirmed | 30-minute entry: MACD golden cross above zero, releasing bullish momentum | EMA5 crosses above EMA8, signaling a short-term bullish turn | KDJ golden cross, short-term outlook bullish (K: 54.9, D: 49.4) | Volume increased (2.0x)
════════════════════
🔴 $ORCL 30-minute bullish signal
⚠️ Technical analysis: 4-hour bullish confluence confirmed | 30-minute entry: EMA5 crosses above EMA8, signaling a short-term bullish turn | KDJ golden cross, short-term outlook bullish (K: 51.9, D: 49.6) | Volume normal (1.3x)
════════════════════
🔔 Follow for first-hand market alerts 🔔
#多周期共振 #INIT #ORCL
📌 When trading, pay attention to whether the candlestick pattern aligns
Multi-timeframe confluence: $INIT / $ORCL strengthening on the 30-minute chart; 4-hour bullish trend confirmed 🔥
════════════════════
🔴 $INIT 30-minute bullish signal
⚠️ Technical analysis: 4-hour bullish confluence confirmed | 30-minute entry: MACD golden cross above zero, releasing bullish momentum | EMA5 crosses above EMA8, signaling a short-term bullish turn | KDJ golden cross, short-term outlook bullish (K: 54.9, D: 49.4) | Volume increased (2.0x)
════════════════════
🔴 $ORCL 30-minute bullish signal
⚠️ Technical analysis: 4-hour bullish confluence confirmed | 30-minute entry: EMA5 crosses above EMA8, signaling a short-term bullish turn | KDJ golden cross, short-term outlook bullish (K: 51.9, D: 49.6) | Volume normal (1.3x)
════════════════════
🔔 Follow for first-hand market alerts 🔔
#多周期共振 #INIT #ORCL
📌 When trading, pay attention to whether the candlestick pattern aligns
════════════════════
🔴 $INIT 30-minute bullish signal
⚠️ Technical analysis: 4-hour bullish confluence confirmed | 30-minute entry: MACD golden cross above zero, releasing bullish momentum | EMA5 crosses above EMA8, signaling a short-term bullish turn | KDJ golden cross, short-term outlook bullish (K: 54.9, D: 49.4) | Volume increased (2.0x)
════════════════════
🔴 $ORCL 30-minute bullish signal
⚠️ Technical analysis: 4-hour bullish confluence confirmed | 30-minute entry: EMA5 crosses above EMA8, signaling a short-term bullish turn | KDJ golden cross, short-term outlook bullish (K: 51.9, D: 49.6) | Volume normal (1.3x)
════════════════════
🔔 Follow for first-hand market alerts 🔔
#多周期共振 #INIT #ORCL
📌 When trading, pay attention to whether the candlestick pattern aligns
9

⚠️ $ORCL ALERT — SELLING PRESSURE HITS THE TECH GIANT!
Oracle bulls have taken a hit! A fresh liquidation event has wiped out $60.8K in leveraged long positions at $110.23, raising questions about the stock's immediate direction.
This suggests that some bullish traders were caught on the wrong side of the move. The important question is whether sellers will continue pushing lower or buyers will step in to defend the current zone.
📊 LIQUIDATION WATCH
- Asset: ORCL (Oracle)
- Liquidation Direction: Long
- Liquidated Value: $60.8K
- Liquidation Price: $110.23
- Key Pivot Area: $110.00–$110.25
📍 LEVELS ON MY RADAR
Price Zone| Level
First Resistance| $111.50
Major Resistance| $113.00
Upside Objective| $115.00
Initial Support| $109.00
Lower Support| $107.50
🔍 MY MARKET EXPECTATION
<badge color="danger">CAUTIOUSLY BEARISH</badge>
🔴 If selling continues: A decisive move below $109.00 could expose $107.50.
🟢 If buyers step in: Reclaiming $111.50 with convincing volume could trigger a recovery toward $113.00–$115.00.
🎯 PROFESSIONAL TRADING PLAN
I would avoid aggressive dip-buying until Oracle demonstrates a solid recovery. The $109.00 area is worth monitoring closely, while $111.50 is the first upside confirmation level.
One liquidation event, two possible directions — ORCL must now prove where real market demand stands!
⚠️ These are illustrative trading scenarios, not verified live technical levels. ORCL is a stock, not a cryptocurrency. Always check current market data and manage risk.
#ORCL
#TradingSetup
#MarketAnalysis
#WillAnthropicListOnTime #TradFiForBeginners
{stock_us}(ORCL.US)
⚠️ $ORCL ALERT — SELLING PRESSURE HITS THE TECH GIANT!
Oracle bulls have taken a hit! A fresh liquidation event has wiped out $60.8K in leveraged long positions at $110.23, raising questions about the stock's immediate direction.
This suggests that some bullish traders were caught on the wrong side of the move. The important question is whether sellers will continue pushing lower or buyers will step in to defend the current zone.
📊 LIQUIDATION WATCH
- Asset: ORCL (Oracle)
- Liquidation Direction: Long
- Liquidated Value: $60.8K
- Liquidation Price: $110.23
- Key Pivot Area: $110.00–$110.25
📍 LEVELS ON MY RADAR
Price Zone| Level
First Resistance| $111.50
Major Resistance| $113.00
Upside Objective| $115.00
Initial Support| $109.00
Lower Support| $107.50
🔍 MY MARKET EXPECTATION
<badge color="danger">CAUTIOUSLY BEARISH</badge>
🔴 If selling continues: A decisive move below $109.00 could expose $107.50.
🟢 If buyers step in: Reclaiming $111.50 with convincing volume could trigger a recovery toward $113.00–$115.00.
🎯 PROFESSIONAL TRADING PLAN
I would avoid aggressive dip-buying until Oracle demonstrates a solid recovery. The $109.00 area is worth monitoring closely, while $111.50 is the first upside confirmation level.
One liquidation event, two possible directions — ORCL must now prove where real market demand stands!
⚠️ These are illustrative trading scenarios, not verified live technical levels. ORCL is a stock, not a cryptocurrency. Always check current market data and manage risk.
#ORCL
#TradingSetup
#MarketAnalysis
#WillAnthropicListOnTime #TradFiForBeginners
Oracle bulls have taken a hit! A fresh liquidation event has wiped out $60.8K in leveraged long positions at $110.23, raising questions about the stock's immediate direction.
This suggests that some bullish traders were caught on the wrong side of the move. The important question is whether sellers will continue pushing lower or buyers will step in to defend the current zone.
📊 LIQUIDATION WATCH
- Asset: ORCL (Oracle)
- Liquidation Direction: Long
- Liquidated Value: $60.8K
- Liquidation Price: $110.23
- Key Pivot Area: $110.00–$110.25
📍 LEVELS ON MY RADAR
Price Zone| Level
First Resistance| $111.50
Major Resistance| $113.00
Upside Objective| $115.00
Initial Support| $109.00
Lower Support| $107.50
🔍 MY MARKET EXPECTATION
<badge color="danger">CAUTIOUSLY BEARISH</badge>
🔴 If selling continues: A decisive move below $109.00 could expose $107.50.
🟢 If buyers step in: Reclaiming $111.50 with convincing volume could trigger a recovery toward $113.00–$115.00.
🎯 PROFESSIONAL TRADING PLAN
I would avoid aggressive dip-buying until Oracle demonstrates a solid recovery. The $109.00 area is worth monitoring closely, while $111.50 is the first upside confirmation level.
One liquidation event, two possible directions — ORCL must now prove where real market demand stands!
⚠️ These are illustrative trading scenarios, not verified live technical levels. ORCL is a stock, not a cryptocurrency. Always check current market data and manage risk.
#ORCL
#TradingSetup
#MarketAnalysis
#WillAnthropicListOnTime #TradFiForBeginners
ORCL-4,35%
ORCLUS-6,53%
10

·
--
Partly True
🚨 $ORCL BEARS STRIKE! $60.8K IN LONG POSITIONS WIPED OUT! 🔴
Oracle ($ORCL) just recorded a $60,800 long liquidation at $110.23, exposing the pressure building against bullish traders.
⚠️ What This Signals:
- Leveraged buyers are facing increased downside pressure.
- The $110.23 liquidation level is now an important area to monitor.
- Further selling could trigger additional liquidations if buyers fail to regain control.
📉 My Next Move Outlook:
ORCL could remain under bearish pressure in the short term. If price struggles to reclaim $110.23, another downward leg may develop. However, a strong recovery above this level could signal that buyers are stepping back in.
🎯 Key Strategy: Watch the $110.23 zone for confirmation. Avoid chasing entries until price action reveals its next direction.
Stay alert — liquidation clusters can create sudden volatility!
#ORCL
#StockMarket
#TradingSignals
#TradFiForBeginners
#WillAnthropicListOnTime
{stock_us}(ORCL.US)
🚨 $ORCL BEARS STRIKE! $60.8K IN LONG POSITIONS WIPED OUT! 🔴
Oracle ($ORCL) just recorded a $60,800 long liquidation at $110.23, exposing the pressure building against bullish traders.
⚠️ What This Signals:
- Leveraged buyers are facing increased downside pressure.
- The $110.23 liquidation level is now an important area to monitor.
- Further selling could trigger additional liquidations if buyers fail to regain control.
📉 My Next Move Outlook:
ORCL could remain under bearish pressure in the short term. If price struggles to reclaim $110.23, another downward leg may develop. However, a strong recovery above this level could signal that buyers are stepping back in.
🎯 Key Strategy: Watch the $110.23 zone for confirmation. Avoid chasing entries until price action reveals its next direction.
Stay alert — liquidation clusters can create sudden volatility!
#ORCL
#StockMarket
#TradingSignals
#TradFiForBeginners
#WillAnthropicListOnTime
Oracle ($ORCL) just recorded a $60,800 long liquidation at $110.23, exposing the pressure building against bullish traders.
⚠️ What This Signals:
- Leveraged buyers are facing increased downside pressure.
- The $110.23 liquidation level is now an important area to monitor.
- Further selling could trigger additional liquidations if buyers fail to regain control.
📉 My Next Move Outlook:
ORCL could remain under bearish pressure in the short term. If price struggles to reclaim $110.23, another downward leg may develop. However, a strong recovery above this level could signal that buyers are stepping back in.
🎯 Key Strategy: Watch the $110.23 zone for confirmation. Avoid chasing entries until price action reveals its next direction.
Stay alert — liquidation clusters can create sudden volatility!
#ORCL
#StockMarket
#TradingSignals
#TradFiForBeginners
#WillAnthropicListOnTime
ORCL-4,35%
ORCLUS-6,53%
255
·
--
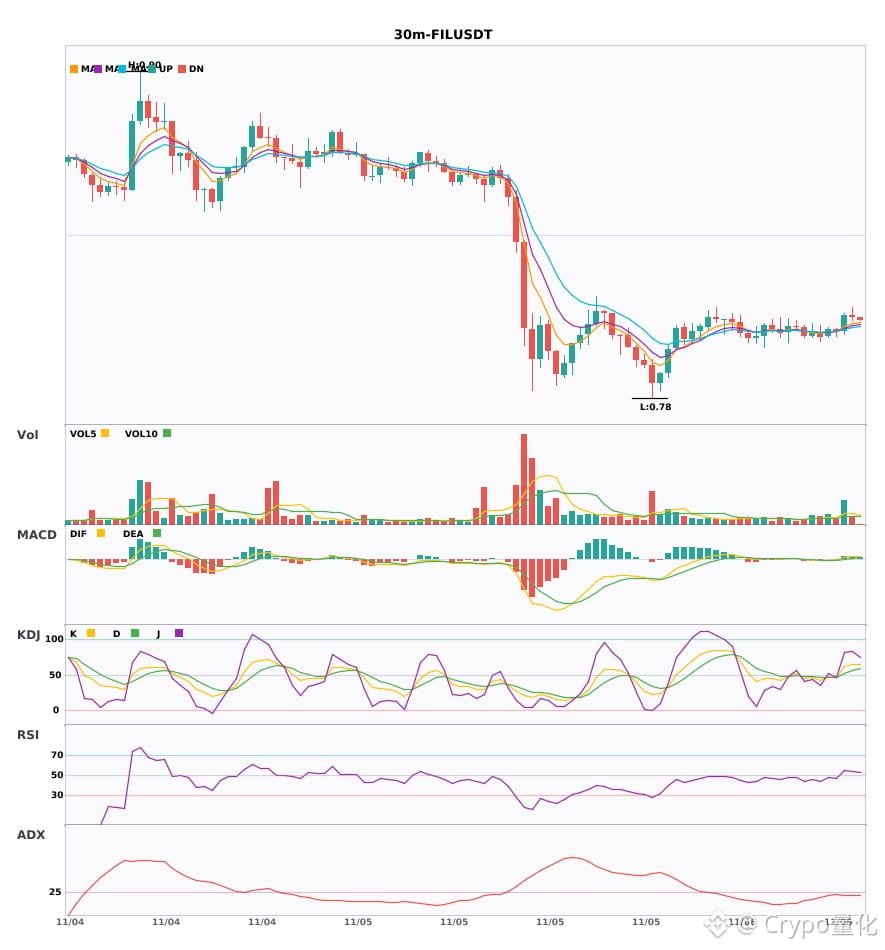
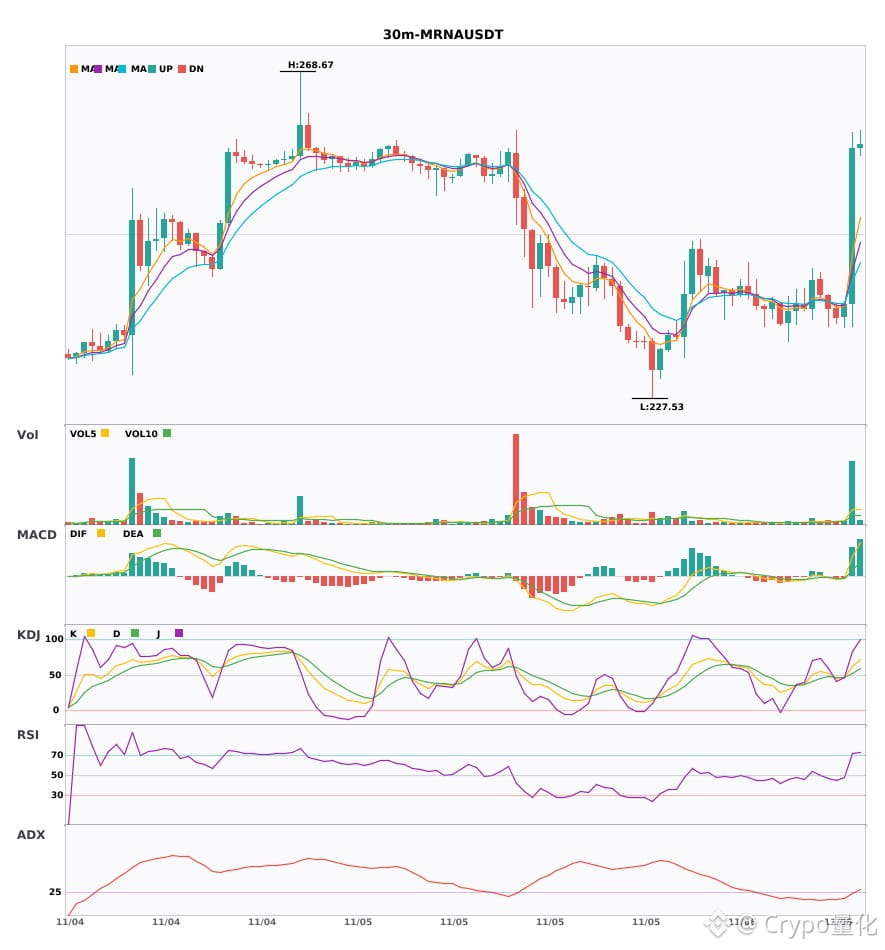
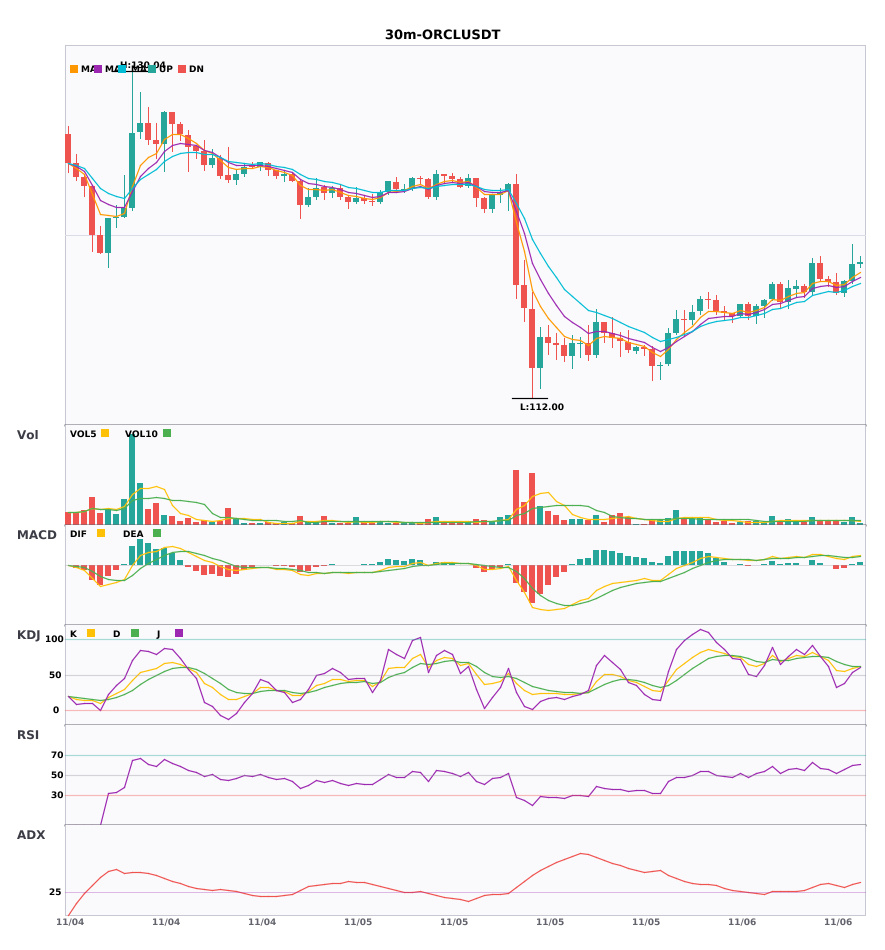
$FIL / $MRNA / $ORCL 30-minute bullish reversal in unison, with bullish signals appearing simultaneously 🔥
════════════════════
🔴 $FIL 30-minute bullish signal
⚠️Technical analysis: ADX(25) Trend is forming; entry is possible | MACD DIF breaks above the zero line, signaling a bullish trend | EMA5 crosses above EMA8, turning bullish in the short term | KDJ is running strong, with bulls in control (K: 61.8, D: 51.8) | Volume surge (2.9x)
📢Market update: Binance Will Support the Filecoin (FIL) Network Upgrade & Hard Fork - 2026-10-19
════════════════════
🔴 $MRNA 30-minute bullish signal
⚠️Technical analysis: ADX(26) Trend is forming; entry is possible | MACD bullish crossover above zero, releasing bullish momentum | EMA5 crosses above EMA8, turning bullish in the short term | KDJ is running strong, with bulls in control (K: 62.1, D: 51.9) | Volume surge (6.8x)
════════════════════
🔴 $ORCL 30-minute bullish signal
⚠️Technical analysis: ADX(36) Clear trending market | MACD bullish crossover above zero, releasing bullish momentum | EMA5 > EMA8 > EMA13, bullish alignment | KDJ is running strong, with bulls in control (K: 59.7, D: 62.6) | Increased volume (1.6x)
════════════════════
🔔 Follow for first-hand market updates 🔔
#技术分析 #FIL #MRNA #ORCL
📌 When trading, pay attention to whether the candlestick pattern confirms the signal
$FIL / $MRNA / $ORCL 30-minute bullish reversal in unison, with bullish signals appearing simultaneously 🔥
════════════════════
🔴 $FIL 30-minute bullish signal
⚠️Technical analysis: ADX(25) Trend is forming; entry is possible | MACD DIF breaks above the zero line, signaling a bullish trend | EMA5 crosses above EMA8, turning bullish in the short term | KDJ is running strong, with bulls in control (K: 61.8, D: 51.8) | Volume surge (2.9x)
📢Market update: Binance Will Support the Filecoin (FIL) Network Upgrade & Hard Fork - 2026-10-19
════════════════════
🔴 $MRNA 30-minute bullish signal
⚠️Technical analysis: ADX(26) Trend is forming; entry is possible | MACD bullish crossover above zero, releasing bullish momentum | EMA5 crosses above EMA8, turning bullish in the short term | KDJ is running strong, with bulls in control (K: 62.1, D: 51.9) | Volume surge (6.8x)
════════════════════
🔴 $ORCL 30-minute bullish signal
⚠️Technical analysis: ADX(36) Clear trending market | MACD bullish crossover above zero, releasing bullish momentum | EMA5 > EMA8 > EMA13, bullish alignment | KDJ is running strong, with bulls in control (K: 59.7, D: 62.6) | Increased volume (1.6x)
════════════════════
🔔 Follow for first-hand market updates 🔔
#技术分析 #FIL #MRNA #ORCL
📌 When trading, pay attention to whether the candlestick pattern confirms the signal
════════════════════
🔴 $FIL 30-minute bullish signal
⚠️Technical analysis: ADX(25) Trend is forming; entry is possible | MACD DIF breaks above the zero line, signaling a bullish trend | EMA5 crosses above EMA8, turning bullish in the short term | KDJ is running strong, with bulls in control (K: 61.8, D: 51.8) | Volume surge (2.9x)
📢Market update: Binance Will Support the Filecoin (FIL) Network Upgrade & Hard Fork - 2026-10-19
════════════════════
🔴 $MRNA 30-minute bullish signal
⚠️Technical analysis: ADX(26) Trend is forming; entry is possible | MACD bullish crossover above zero, releasing bullish momentum | EMA5 crosses above EMA8, turning bullish in the short term | KDJ is running strong, with bulls in control (K: 62.1, D: 51.9) | Volume surge (6.8x)
════════════════════
🔴 $ORCL 30-minute bullish signal
⚠️Technical analysis: ADX(36) Clear trending market | MACD bullish crossover above zero, releasing bullish momentum | EMA5 > EMA8 > EMA13, bullish alignment | KDJ is running strong, with bulls in control (K: 59.7, D: 62.6) | Increased volume (1.6x)
════════════════════
🔔 Follow for first-hand market updates 🔔
#技术分析 #FIL #MRNA #ORCL
📌 When trading, pay attention to whether the candlestick pattern confirms the signal
30
·
--
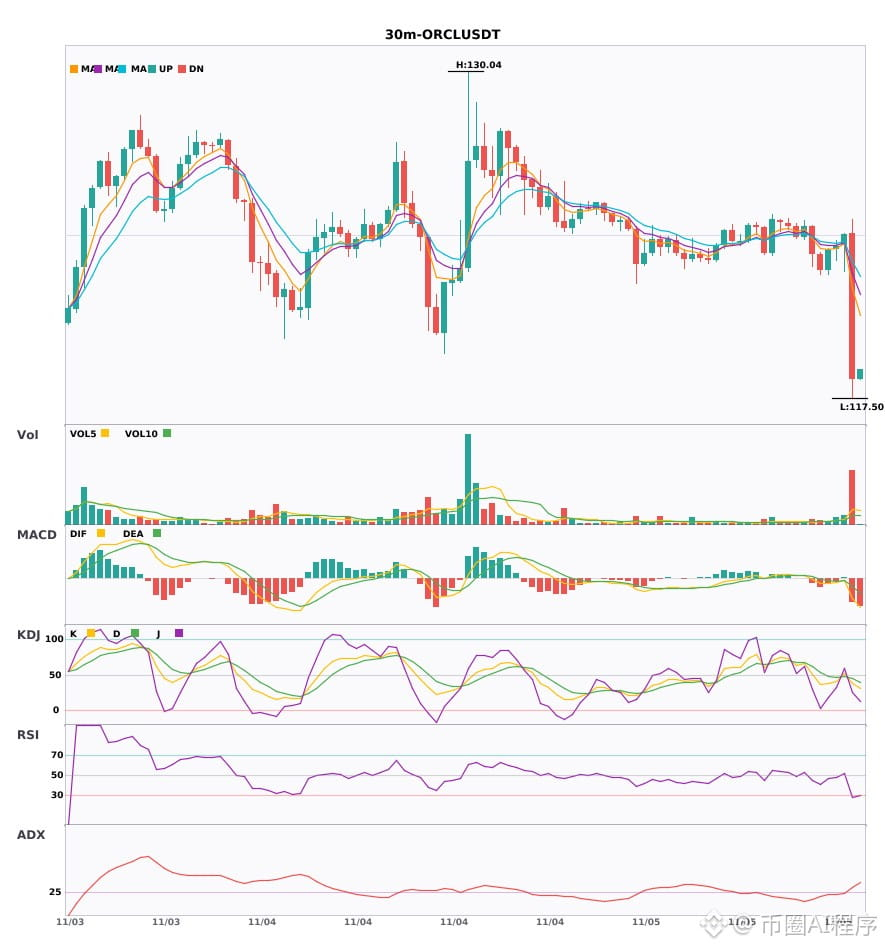
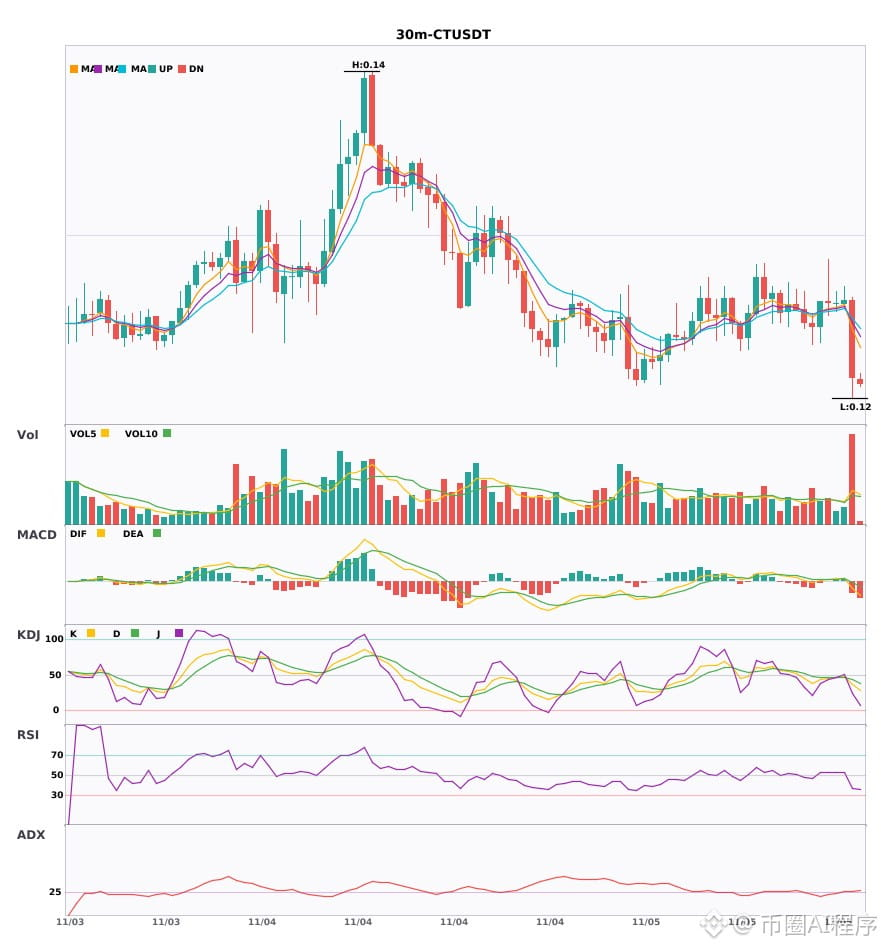
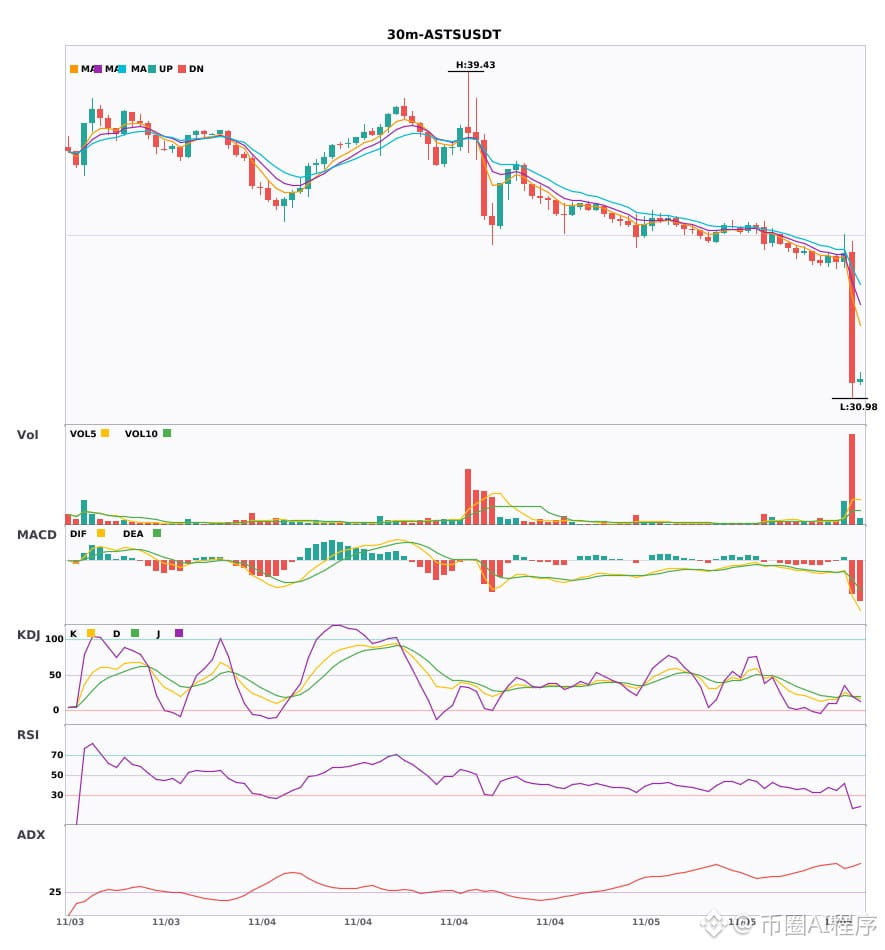
$ORCL / $CT / $ASTS 30-minute bearish + 4-hour bearish alignment; multi-timeframe confluence turns bearish 🔥
════════════════════
🟢 $ORCL 30-minute bearish signal
⚠️Technical analysis: 4-hour bearish confluence confirmed | 30-minute entry: MACD bearish cross below zero, bearish momentum accelerating | EMA5 < EMA8 < EMA13, bearish alignment | KDJ bearish cross, short-term outlook bearish (K = 38.0, D = 44.7) | Volume surge (5.8x)
════════════════════
🟢 $CT 30-minute bearish signal
⚠️Technical analysis: 4-hour bearish confluence confirmed | 30-minute entry: MACD bearish cross below zero, bearish momentum accelerating | EMA5 crosses below EMA8, short-term outlook turns bearish | KDJ bearish cross, short-term outlook bearish (K = 37.1, D = 43.5) | Volume surge (3.1x)
════════════════════
🟢 $ASTS 30-minute bearish signal
⚠️Technical analysis: 4-hour bearish confluence confirmed | 30-minute entry: MACD bearish cross below zero, bearish momentum accelerating | EMA5 < EMA8 < EMA13, bearish alignment | KDJ bearish cross, short-term outlook bearish (K = 20.1, D = 20.5) | Volume surge (6.4x)
════════════════════
🔔 Follow to get first-hand market alerts 🔔
#多周期共振 #ORCL #CT #ASTS
📌 When trading, watch for whether the candlestick pattern confirms the signal
$ORCL / $CT / $ASTS 30-minute bearish + 4-hour bearish alignment; multi-timeframe confluence turns bearish 🔥
════════════════════
🟢 $ORCL 30-minute bearish signal
⚠️Technical analysis: 4-hour bearish confluence confirmed | 30-minute entry: MACD bearish cross below zero, bearish momentum accelerating | EMA5 < EMA8 < EMA13, bearish alignment | KDJ bearish cross, short-term outlook bearish (K = 38.0, D = 44.7) | Volume surge (5.8x)
════════════════════
🟢 $CT 30-minute bearish signal
⚠️Technical analysis: 4-hour bearish confluence confirmed | 30-minute entry: MACD bearish cross below zero, bearish momentum accelerating | EMA5 crosses below EMA8, short-term outlook turns bearish | KDJ bearish cross, short-term outlook bearish (K = 37.1, D = 43.5) | Volume surge (3.1x)
════════════════════
🟢 $ASTS 30-minute bearish signal
⚠️Technical analysis: 4-hour bearish confluence confirmed | 30-minute entry: MACD bearish cross below zero, bearish momentum accelerating | EMA5 < EMA8 < EMA13, bearish alignment | KDJ bearish cross, short-term outlook bearish (K = 20.1, D = 20.5) | Volume surge (6.4x)
════════════════════
🔔 Follow to get first-hand market alerts 🔔
#多周期共振 #ORCL #CT #ASTS
📌 When trading, watch for whether the candlestick pattern confirms the signal
════════════════════
🟢 $ORCL 30-minute bearish signal
⚠️Technical analysis: 4-hour bearish confluence confirmed | 30-minute entry: MACD bearish cross below zero, bearish momentum accelerating | EMA5 < EMA8 < EMA13, bearish alignment | KDJ bearish cross, short-term outlook bearish (K = 38.0, D = 44.7) | Volume surge (5.8x)
════════════════════
🟢 $CT 30-minute bearish signal
⚠️Technical analysis: 4-hour bearish confluence confirmed | 30-minute entry: MACD bearish cross below zero, bearish momentum accelerating | EMA5 crosses below EMA8, short-term outlook turns bearish | KDJ bearish cross, short-term outlook bearish (K = 37.1, D = 43.5) | Volume surge (3.1x)
════════════════════
🟢 $ASTS 30-minute bearish signal
⚠️Technical analysis: 4-hour bearish confluence confirmed | 30-minute entry: MACD bearish cross below zero, bearish momentum accelerating | EMA5 < EMA8 < EMA13, bearish alignment | KDJ bearish cross, short-term outlook bearish (K = 20.1, D = 20.5) | Volume surge (6.4x)
════════════════════
🔔 Follow to get first-hand market alerts 🔔
#多周期共振 #ORCL #CT #ASTS
📌 When trading, watch for whether the candlestick pattern confirms the signal
13
Log in to explore more content
Join global crypto users on Binance Square
⚡️ Get latest and useful information about crypto.
💬 Trusted by the world’s largest crypto exchange.
👍 Discover real insights from verified creators.
Email / Phone number
Trending Topics
1
#CanBTCReboundAfterFallingBelow60K?
355,715 views
1,492 Discussing
2
#GlobalStocksFaceLongestLosingStreakSince2023
117,251 views
1,060 Discussing
3
#BlackRockIBITPostsRecord$541MSingleDayOutflow
588 views
15 Discussing
4
#AnthropicPlungesTowardIPOPriceonDay2
56,610 views
572 Discussing
5
#TwentyOneCapitalAdds172.25BTC
9,276 views
143 Discussing
6
#HKBillWouldExcludeTokenizedDepositsFromVirtualAssets
819 views
14 Discussing
7
#BNBDropsBelow540USDTWith8.46%DailyDecline
30,205 views
254 Discussing
8
#HKBillProposesHK$100KFineForUnauthorizedCryptoTitles
999 views
14 Discussing
9
#BitMineFaces$10.1BUnrealizedETHLoss
1,955 views
18 Discussing
10
#StrategyReports$35BNetReserves
1,814 views
17 Discussing