

#23
23
48,901 views
208 Discussing
Hot
Latest

·
--
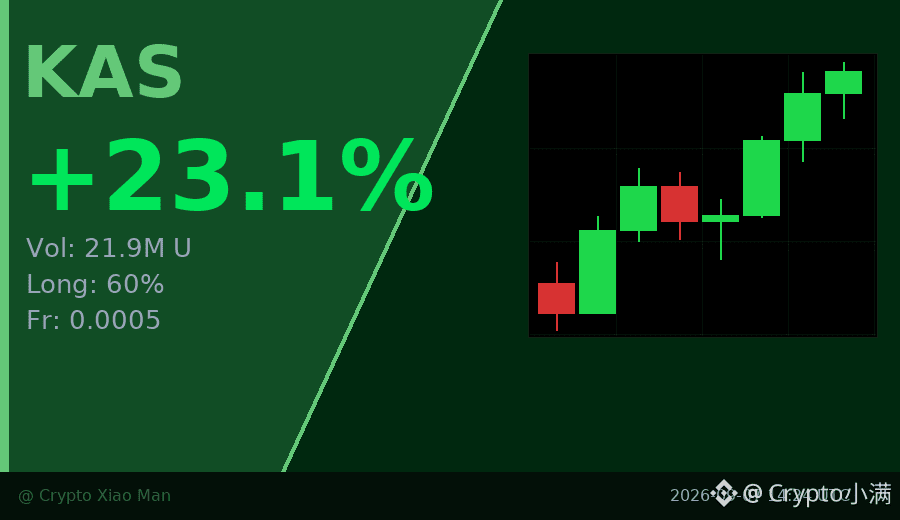
23% rise in percentage, trading volume surged to 21.90 million U, and this rally in KAS is kind of interesting.
More importantly, the funding rate is only 0.0005. The long side makes up 60%, but it’s not extremely crowded. Compared with coins whose funding rates jump above 0.01, KAS’s upward resistance is actually smaller.
The hourly chart has already seen three consecutive bullish candles—pushing steadily from around 0.03 up to 0.037. The buying momentum is very stable. This kind of volume-price alignment paired with a moderate funding rate is often more durable than a pull-up driven by overheated sentiment.
$KAS #KAS #23.09
Click the small card below to quickly check the market trend👇
23% rise in percentage, trading volume surged to 21.90 million U, and this rally in KAS is kind of interesting.
More importantly, the funding rate is only 0.0005. The long side makes up 60%, but it’s not extremely crowded. Compared with coins whose funding rates jump above 0.01, KAS’s upward resistance is actually smaller.
The hourly chart has already seen three consecutive bullish candles—pushing steadily from around 0.03 up to 0.037. The buying momentum is very stable. This kind of volume-price alignment paired with a moderate funding rate is often more durable than a pull-up driven by overheated sentiment.
$KAS #KAS #23.09
Click the small card below to quickly check the market trend👇
More importantly, the funding rate is only 0.0005. The long side makes up 60%, but it’s not extremely crowded. Compared with coins whose funding rates jump above 0.01, KAS’s upward resistance is actually smaller.
The hourly chart has already seen three consecutive bullish candles—pushing steadily from around 0.03 up to 0.037. The buying momentum is very stable. This kind of volume-price alignment paired with a moderate funding rate is often more durable than a pull-up driven by overheated sentiment.
$KAS #KAS #23.09
Click the small card below to quickly check the market trend👇
53

·
--
🎯 $CHIP live short trade closed! Captured a -5.8% drop with 50X leverage—ROE took off🚀
Average entry: 0.05163 → Current price: 0.0486353
Direction: SHORT · 50X leverage
Holding window: 15~30 minutes ⏱️
🧠 This wasn’t a guess. The LLM strategy #23 identified this target 14 minutes in advance:
【Initial screening】Up +18.76% in 24h, then surged another +6.93% in 1h. The 5m/15m RSI hit 82.3/79.6, deeply overbought—but I didn’t chase; I waited for confirmation.
【Five confirmation signals】Down -2.46% from the high of 0.05262 (above the dynamic threshold of 2.10%)|5m Pinbar with a long upper wick, wick ratio 1.9x|Bullish alignment, but shrinking MACD histogram bars signaled fading momentum|5m RSI pulled back to 61.7|Aggressive buying waned, with selling taking the lead at 43.5%|Funding rate +0.0050%, with no short-squeeze pressure.
【Key detail】After a sharp drop of over 2.25%, the system automatically switched to a LIMIT order at the rebound level of 0.051632, preventing a short entry from getting caught in a bounce—this is the difference between discipline and itchy fingers😤
🛡️ Risk management: TP1 0.0486353 / TP2 0.0466187 / SL 0.0530045, risk-reward ratio 2.8:1. If after 30 minutes ROE is below +18%, a timeout circuit breaker is triggered; large winning positions are exempt.
Don’t overstay in a countertrend trade. Act only after confirmation, and use limit orders on rebounds—don’t chase.
Did you catch this wave of five converging signals? Check in in the comments and tell us about a recent trade where you profited from waiting for confirmation👇
#币安合约 #实盘战报 #量化交易 #CHIP
🎯 $CHIP live short trade closed! Captured a -5.8% drop with 50X leverage—ROE took off🚀
Average entry: 0.05163 → Current price: 0.0486353
Direction: SHORT · 50X leverage
Holding window: 15~30 minutes ⏱️
🧠 This wasn’t a guess. The LLM strategy #23 identified this target 14 minutes in advance:
【Initial screening】Up +18.76% in 24h, then surged another +6.93% in 1h. The 5m/15m RSI hit 82.3/79.6, deeply overbought—but I didn’t chase; I waited for confirmation.
【Five confirmation signals】Down -2.46% from the high of 0.05262 (above the dynamic threshold of 2.10%)|5m Pinbar with a long upper wick, wick ratio 1.9x|Bullish alignment, but shrinking MACD histogram bars signaled fading momentum|5m RSI pulled back to 61.7|Aggressive buying waned, with selling taking the lead at 43.5%|Funding rate +0.0050%, with no short-squeeze pressure.
【Key detail】After a sharp drop of over 2.25%, the system automatically switched to a LIMIT order at the rebound level of 0.051632, preventing a short entry from getting caught in a bounce—this is the difference between discipline and itchy fingers😤
🛡️ Risk management: TP1 0.0486353 / TP2 0.0466187 / SL 0.0530045, risk-reward ratio 2.8:1. If after 30 minutes ROE is below +18%, a timeout circuit breaker is triggered; large winning positions are exempt.
Don’t overstay in a countertrend trade. Act only after confirmation, and use limit orders on rebounds—don’t chase.
Did you catch this wave of five converging signals? Check in in the comments and tell us about a recent trade where you profited from waiting for confirmation👇
#币安合约 #实盘战报 #量化交易 #CHIP
Average entry: 0.05163 → Current price: 0.0486353
Direction: SHORT · 50X leverage
Holding window: 15~30 minutes ⏱️
🧠 This wasn’t a guess. The LLM strategy #23 identified this target 14 minutes in advance:
【Initial screening】Up +18.76% in 24h, then surged another +6.93% in 1h. The 5m/15m RSI hit 82.3/79.6, deeply overbought—but I didn’t chase; I waited for confirmation.
【Five confirmation signals】Down -2.46% from the high of 0.05262 (above the dynamic threshold of 2.10%)|5m Pinbar with a long upper wick, wick ratio 1.9x|Bullish alignment, but shrinking MACD histogram bars signaled fading momentum|5m RSI pulled back to 61.7|Aggressive buying waned, with selling taking the lead at 43.5%|Funding rate +0.0050%, with no short-squeeze pressure.
【Key detail】After a sharp drop of over 2.25%, the system automatically switched to a LIMIT order at the rebound level of 0.051632, preventing a short entry from getting caught in a bounce—this is the difference between discipline and itchy fingers😤
🛡️ Risk management: TP1 0.0486353 / TP2 0.0466187 / SL 0.0530045, risk-reward ratio 2.8:1. If after 30 minutes ROE is below +18%, a timeout circuit breaker is triggered; large winning positions are exempt.
Don’t overstay in a countertrend trade. Act only after confirmation, and use limit orders on rebounds—don’t chase.
Did you catch this wave of five converging signals? Check in in the comments and tell us about a recent trade where you profited from waiting for confirmation👇
#币安合约 #实盘战报 #量化交易 #CHIP
72

·
--
$HBAR This move has something to it: 15m volume is up 2.9x, pushing straight above the highs of the last 20 5m candles. The aggressive buy/sell ratio is 2.17, showing a clear bias toward buyers taking liquidity. OI has edged up too; price rising alongside open interest looks more like leveraged new longs entering than shorts covering. Anomaly percentile: 78.6%; ranked #23 across the whole pool—not the most eye-catching, but confirmed by depth. Daily volume of 22.5M is enough to support a breakout of this magnitude. First, watch whether it can hold above the top of this range; if it can't, this was a false move.
$HBAR This move has something to it: 15m volume is up 2.9x, pushing straight above the highs of the last 20 5m candles. The aggressive buy/sell ratio is 2.17, showing a clear bias toward buyers taking liquidity. OI has edged up too; price rising alongside open interest looks more like leveraged new longs entering than shorts covering. Anomaly percentile: 78.6%; ranked #23 across the whole pool—not the most eye-catching, but confirmed by depth. Daily volume of 22.5M is enough to support a breakout of this magnitude. First, watch whether it can hold above the top of this range; if it can't, this was a false move.
2

·
--
$DOS made a pretty decisive 15m move, surging 3.27% to break above the highs of the previous 20 5m candles. Volume came in at 2.86x, with a buy/sell ratio of 1.71 and an aggressive trade imbalance of 26.3%—buyers are clearly pushing it higher.
OI is interesting: +1.19% on the 15m, but still -1.74% on the 1h. New leveraged longs are entering in the short term, but the hourly trend hasn’t fully turned around yet. It ranks #24 for anomalies across the pool and #23 for notional change—not the most eye-catching, but still near the top.
With $33M in 24h trading volume, liquidity is decent. First, let’s see if it can hold above the top of this range. If it can’t, this could just be a classic false breakout.
$DOS made a pretty decisive 15m move, surging 3.27% to break above the highs of the previous 20 5m candles. Volume came in at 2.86x, with a buy/sell ratio of 1.71 and an aggressive trade imbalance of 26.3%—buyers are clearly pushing it higher.
OI is interesting: +1.19% on the 15m, but still -1.74% on the 1h. New leveraged longs are entering in the short term, but the hourly trend hasn’t fully turned around yet. It ranks #24 for anomalies across the pool and #23 for notional change—not the most eye-catching, but still near the top.
With $33M in 24h trading volume, liquidity is decent. First, let’s see if it can hold above the top of this range. If it can’t, this could just be a classic false breakout.
OI is interesting: +1.19% on the 15m, but still -1.74% on the 1h. New leveraged longs are entering in the short term, but the hourly trend hasn’t fully turned around yet. It ranks #24 for anomalies across the pool and #23 for notional change—not the most eye-catching, but still near the top.
With $33M in 24h trading volume, liquidity is decent. First, let’s see if it can hold above the top of this range. If it can’t, this could just be a classic false breakout.
3

·
--
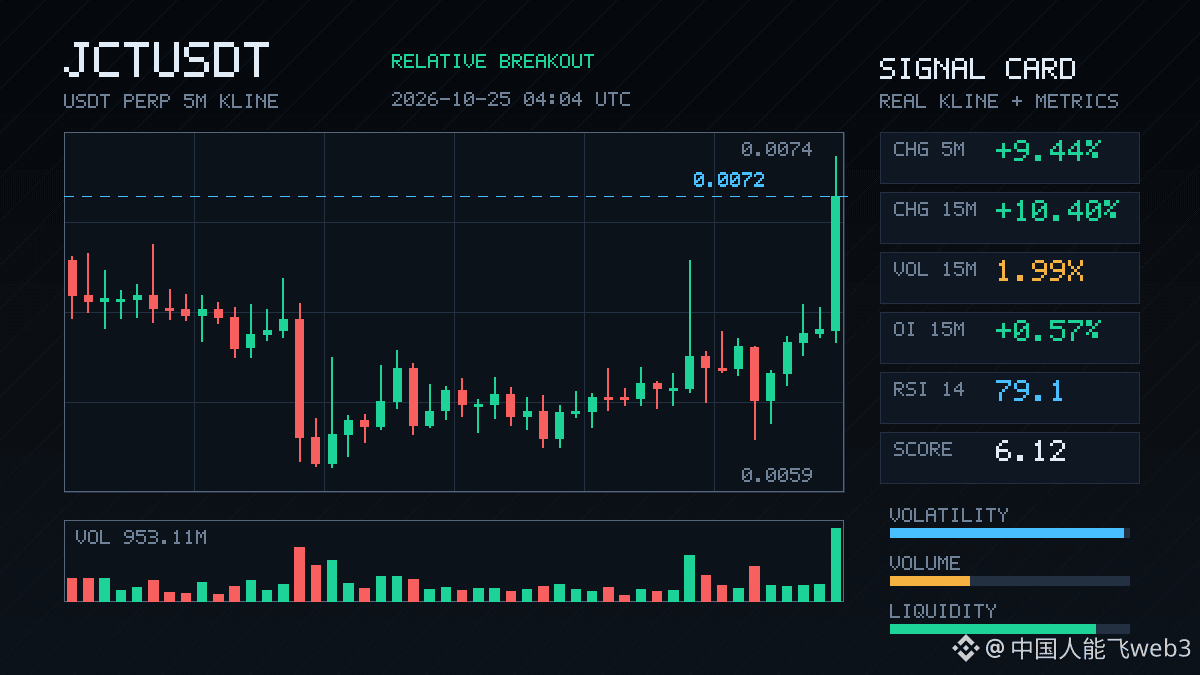
This 15-minute move in $JCT is pretty aggressive: up 10.4%, straight to the top of the range of nearly 20 recent 5-minute candles. Volume is 1.99x and the Z-score is 3.9, so this isn’t a low-volume fake breakout. OI is up 0.57% over 15 minutes, or +1.07M in notional value. Combined with the price rise, this looks more like new leveraged longs entering than a move driven purely by spot buying. However, 1-hour OI is still down 1.02%, suggesting some traders are closing positions into the rally as longs and shorts rotate. The taker buy-sell delta is 4.3%, and the buy/sell ratio is 1.09—bullish, but not extreme. It ranks #23 for anomalies across the pool and #6 for notional change, so attention is definitely picking up. The 24-hour trading volume is 366 million, with enough depth. Whether to chase is up to you; I’d lean toward waiting for a pullback and confirmation rather than buying the top of a wick.
This 15-minute move in $JCT is pretty aggressive: up 10.4%, straight to the top of the range of nearly 20 recent 5-minute candles. Volume is 1.99x and the Z-score is 3.9, so this isn’t a low-volume fake breakout. OI is up 0.57% over 15 minutes, or +1.07M in notional value. Combined with the price rise, this looks more like new leveraged longs entering than a move driven purely by spot buying. However, 1-hour OI is still down 1.02%, suggesting some traders are closing positions into the rally as longs and shorts rotate. The taker buy-sell delta is 4.3%, and the buy/sell ratio is 1.09—bullish, but not extreme. It ranks #23 for anomalies across the pool and #6 for notional change, so attention is definitely picking up. The 24-hour trading volume is 366 million, with enough depth. Whether to chase is up to you; I’d lean toward waiting for a pullback and confirmation rather than buying the top of a wick.
6

·
--
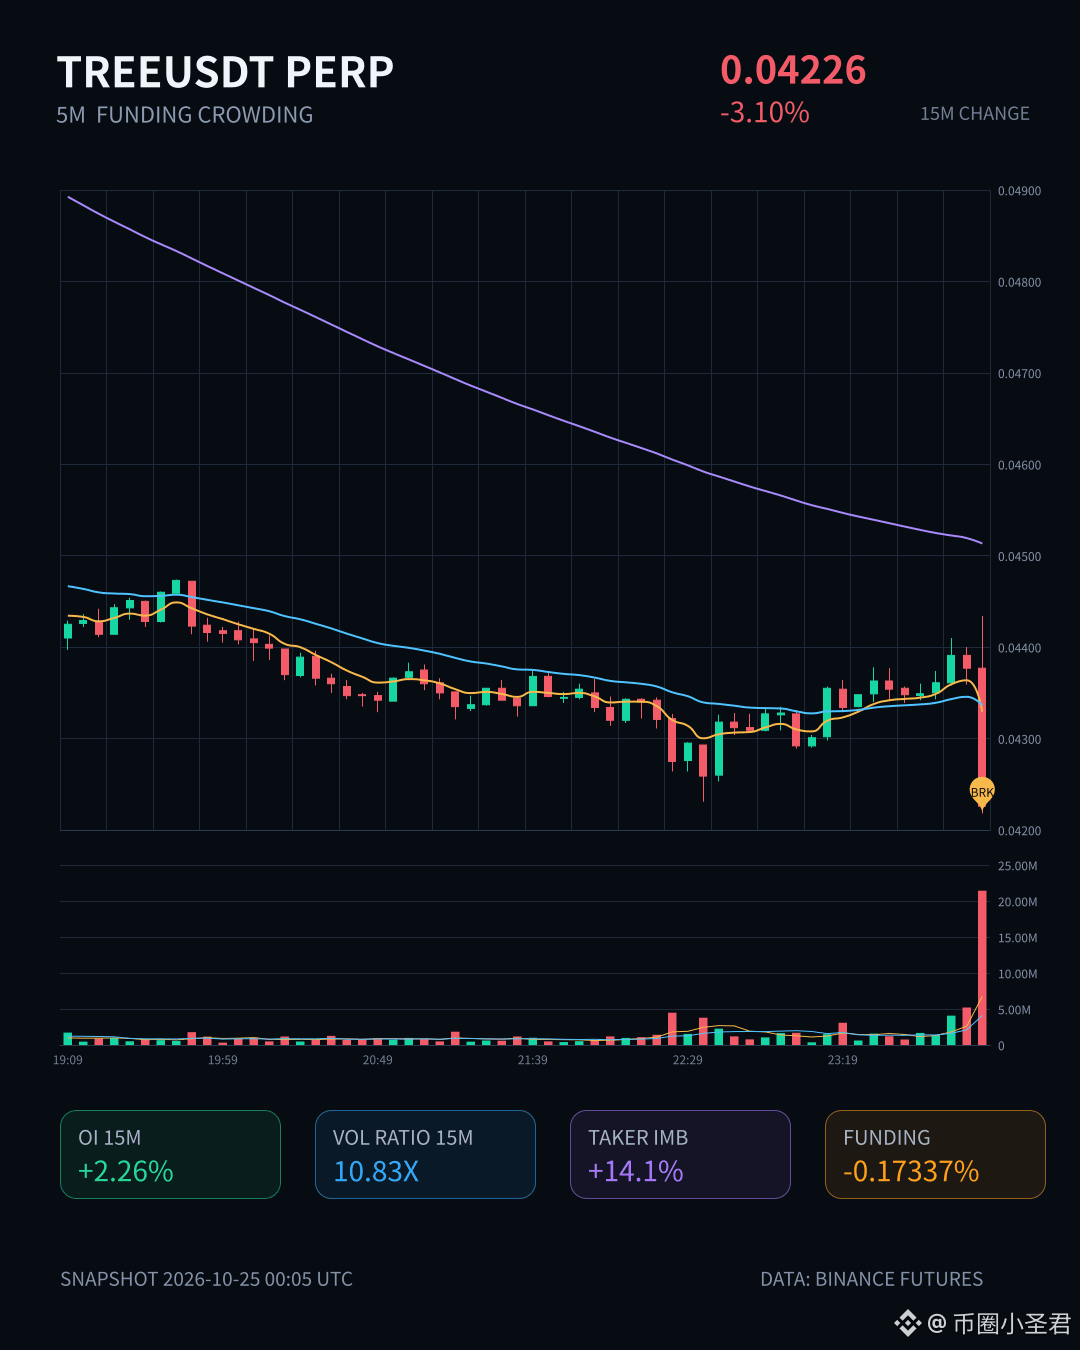
$TREE This chart has something going on. It dumped 3.1% in 15 minutes, with volume surging to over 10 times normal. OI rose 3.7% in an hour as the price fell—a classic sign of bears piling in with leverage.
But the most interesting part is the funding rate: -0.1734%, at the 97th percentile for the recent period. Shorts are this crowded, yet the taker flow delta is still positive at 14.1%, with a buy/sell ratio of 1.33. One side is aggressively shorting while active buyers are stepping in to absorb the sell orders. That kind of divergence is unsettling.
24-hour trading volume is 90M, so liquidity is fine. The anomaly percentile is 83.1%, ranking #23 across the whole pool. There’s enough depth, volume has picked up, and the price is right at the edge of its recent range.
My feeling is that shorts are far too crowded here. Funding is at an extreme percentile, and OI is still piling up. If support holds and active buyers keep absorbing the selling, a rebound could really hurt. I’m not telling anyone to buy the dip; it’s just that chasing shorts in this setup really doesn’t offer much upside for the risk. Let’s see who blinks first.
$TREE This chart has something going on. It dumped 3.1% in 15 minutes, with volume surging to over 10 times normal. OI rose 3.7% in an hour as the price fell—a classic sign of bears piling in with leverage.
But the most interesting part is the funding rate: -0.1734%, at the 97th percentile for the recent period. Shorts are this crowded, yet the taker flow delta is still positive at 14.1%, with a buy/sell ratio of 1.33. One side is aggressively shorting while active buyers are stepping in to absorb the sell orders. That kind of divergence is unsettling.
24-hour trading volume is 90M, so liquidity is fine. The anomaly percentile is 83.1%, ranking #23 across the whole pool. There’s enough depth, volume has picked up, and the price is right at the edge of its recent range.
My feeling is that shorts are far too crowded here. Funding is at an extreme percentile, and OI is still piling up. If support holds and active buyers keep absorbing the selling, a rebound could really hurt. I’m not telling anyone to buy the dip; it’s just that chasing shorts in this setup really doesn’t offer much upside for the risk. Let’s see who blinks first.
But the most interesting part is the funding rate: -0.1734%, at the 97th percentile for the recent period. Shorts are this crowded, yet the taker flow delta is still positive at 14.1%, with a buy/sell ratio of 1.33. One side is aggressively shorting while active buyers are stepping in to absorb the sell orders. That kind of divergence is unsettling.
24-hour trading volume is 90M, so liquidity is fine. The anomaly percentile is 83.1%, ranking #23 across the whole pool. There’s enough depth, volume has picked up, and the price is right at the edge of its recent range.
My feeling is that shorts are far too crowded here. Funding is at an extreme percentile, and OI is still piling up. If support holds and active buyers keep absorbing the selling, a rebound could really hurt. I’m not telling anyone to buy the dip; it’s just that chasing shorts in this setup really doesn’t offer much upside for the risk. Let’s see who blinks first.
59

·
--
$BMT dropped 8.66% in just 15 minutes, with volume nearly doubling and the Z-score surging to 3.56. Interestingly, OI is rising while price is falling—1-hour contract OI is up 0.67%, but notional change is down 613K, a classic sign of new leveraged shorts entering. The funding rate is still at a recent high percentile, suggesting longs had indeed become somewhat crowded. Price has already broken below the lows of the past 20 five-minute candles; aggressive trade imbalance is -0.6%, and the buy/sell ratio is 0.99. Selling pressure isn't extreme, but the direction is clear. Notional change across the full pool ranks #23, and 24-hour trading volume is over 180 million, so liquidity isn't an issue. Given this setup, don't rush to buy the dip—wait and see which way OI and price resolve first.
$BMT dropped 8.66% in just 15 minutes, with volume nearly doubling and the Z-score surging to 3.56. Interestingly, OI is rising while price is falling—1-hour contract OI is up 0.67%, but notional change is down 613K, a classic sign of new leveraged shorts entering. The funding rate is still at a recent high percentile, suggesting longs had indeed become somewhat crowded. Price has already broken below the lows of the past 20 five-minute candles; aggressive trade imbalance is -0.6%, and the buy/sell ratio is 0.99. Selling pressure isn't extreme, but the direction is clear. Notional change across the full pool ranks #23, and 24-hour trading volume is over 180 million, so liquidity isn't an issue. Given this setup, don't rush to buy the dip—wait and see which way OI and price resolve first.
1
·
--
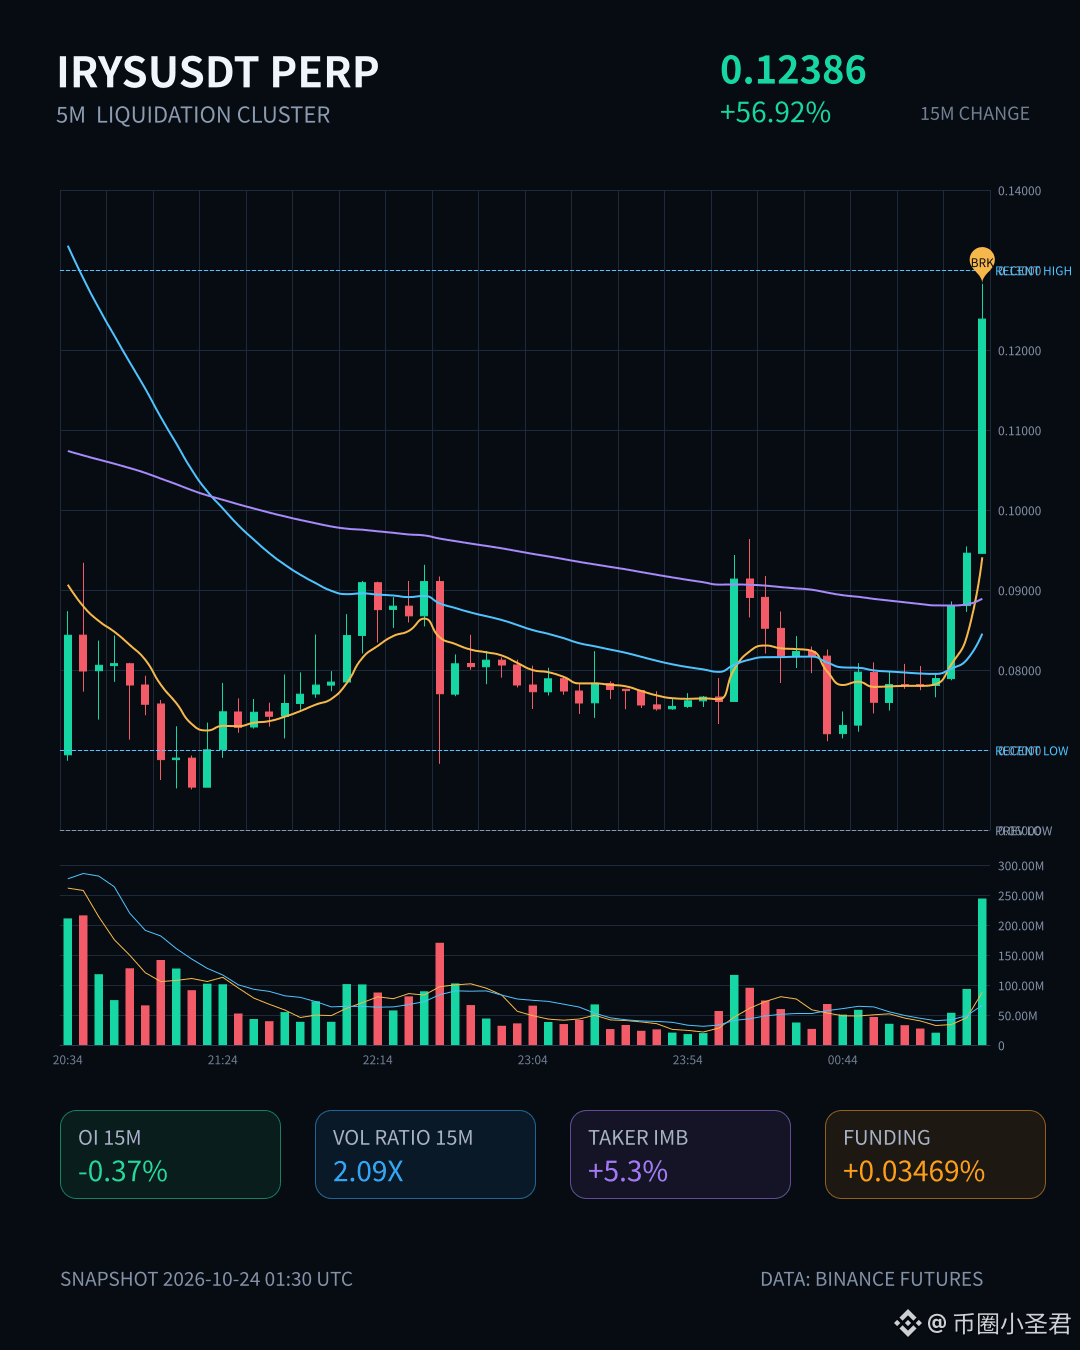
$IRYS surged 56.92% in a single 15-minute candle, with volume more than 2x the norm and a Z-score of 7.32. This isn't an ordinary rally—shorts are being forced out.
What's interesting is the OI: 15-minute futures OI is down 0.37%, while the 1-hour figure is only up 0.85%. The price has taken off, but positions haven't kept pace. This structure looks more like a short-covering-driven move, with new longs not being the main driver. The 5-minute Binance liquidation proxy shows 285K, concentrated on the buy side—that's the same batch of shorts getting swept repeatedly.
The funding rate is already at a recent high percentile, and OI's abnormality percentile is 93.1%. It ranks #23 for abnormality across the entire pool and #2 for notional change. The aggressive buy/sell ratio is 1.11—the risk-reward of chasing longs is deteriorating. At this level, the move looks more like it's being pushed up by liquidations.
My view: first see whether it can hold a pullback. No need to jump in at an emotional peak.
$IRYS surged 56.92% in a single 15-minute candle, with volume more than 2x the norm and a Z-score of 7.32. This isn't an ordinary rally—shorts are being forced out.
What's interesting is the OI: 15-minute futures OI is down 0.37%, while the 1-hour figure is only up 0.85%. The price has taken off, but positions haven't kept pace. This structure looks more like a short-covering-driven move, with new longs not being the main driver. The 5-minute Binance liquidation proxy shows 285K, concentrated on the buy side—that's the same batch of shorts getting swept repeatedly.
The funding rate is already at a recent high percentile, and OI's abnormality percentile is 93.1%. It ranks #23 for abnormality across the entire pool and #2 for notional change. The aggressive buy/sell ratio is 1.11—the risk-reward of chasing longs is deteriorating. At this level, the move looks more like it's being pushed up by liquidations.
My view: first see whether it can hold a pullback. No need to jump in at an emotional peak.
What's interesting is the OI: 15-minute futures OI is down 0.37%, while the 1-hour figure is only up 0.85%. The price has taken off, but positions haven't kept pace. This structure looks more like a short-covering-driven move, with new longs not being the main driver. The 5-minute Binance liquidation proxy shows 285K, concentrated on the buy side—that's the same batch of shorts getting swept repeatedly.
The funding rate is already at a recent high percentile, and OI's abnormality percentile is 93.1%. It ranks #23 for abnormality across the entire pool and #2 for notional change. The aggressive buy/sell ratio is 1.11—the risk-reward of chasing longs is deteriorating. At this level, the move looks more like it's being pushed up by liquidations.
My view: first see whether it can hold a pullback. No need to jump in at an emotional peak.
40
·
--
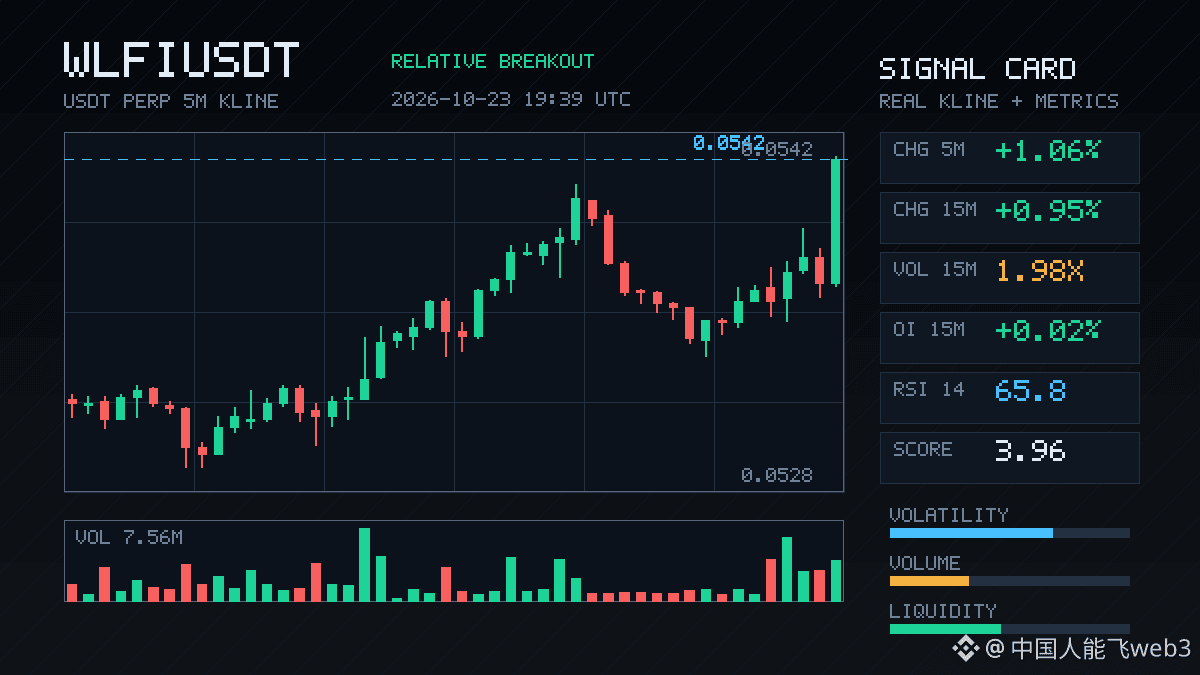
$WLFI 5-minute volume surged to 1.98x, with volatility Z at 2.71. Price rose 0.95%, closing near the top of the range of the latest 20 five-minute candles. OI also edged up; notional change ranked #23 across the full pool, aggressive trade imbalance was 5.1%, and the buy/sell ratio was 1.11. Volume-price action plus newly added leveraged longs, with the funding rate in a recent high percentile—wait for confirmation.
$WLFI 5-minute volume surged to 1.98x, with volatility Z at 2.71. Price rose 0.95%, closing near the top of the range of the latest 20 five-minute candles. OI also edged up; notional change ranked #23 across the full pool, aggressive trade imbalance was 5.1%, and the buy/sell ratio was 1.11. Volume-price action plus newly added leveraged longs, with the funding rate in a recent high percentile—wait for confirmation.
29
·
--
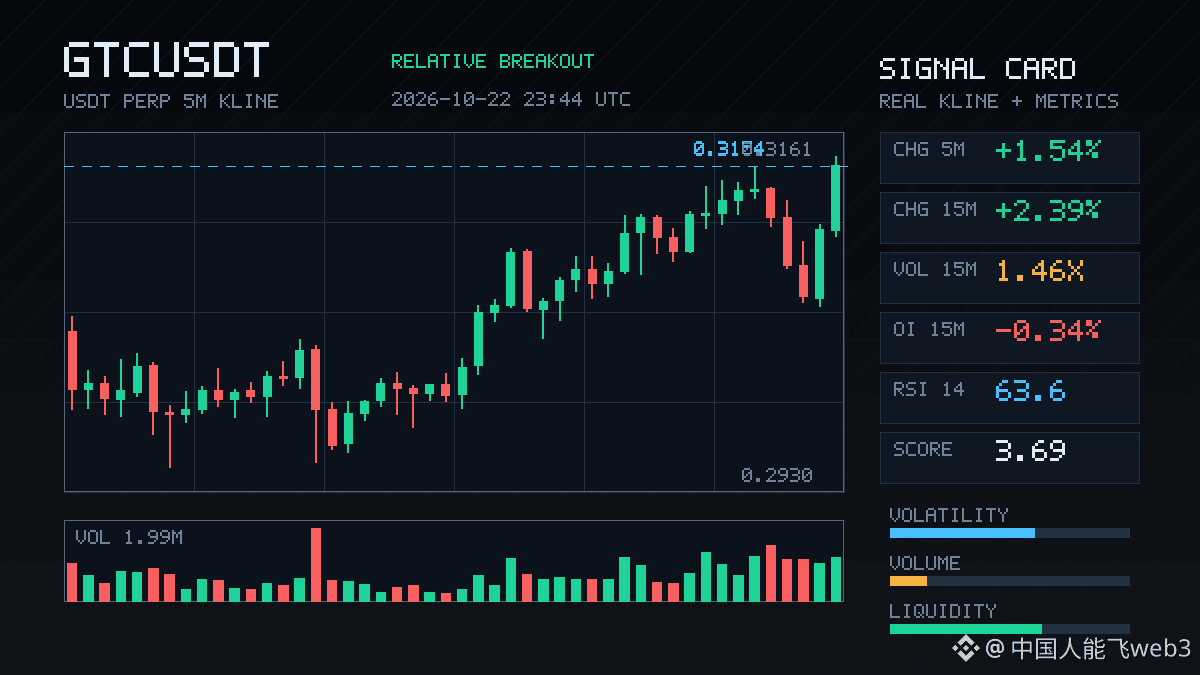
GTC jumped 2.39% over 15m, pushing straight above the highs of nearly 20 recent 5m candles. But look at OI: 15m contract OI actually fell 0.34%, or 63K notional, while 1h OI was up 1.75%. Price up, OI down—that’s the classic smell of short covering, not fresh longs entering. Volume at 1.46x with a Z-score of 2.41, but the taker buy/sell ratio is only 1.01, a mere 0.5% difference. That means the buying pressure behind the move is actually pretty modest; it’s mostly shorts closing out and lifting the price. Be careful chasing longs in this kind of setup. If OI doesn’t pick up after the covering is done, the price could easily spike and then pull back. 24h volume is 78M, and the pool’s anomaly ranking is #23—not especially eye-catching. For now, let’s see if it can hold above the range highs.
GTC jumped 2.39% over 15m, pushing straight above the highs of nearly 20 recent 5m candles. But look at OI: 15m contract OI actually fell 0.34%, or 63K notional, while 1h OI was up 1.75%. Price up, OI down—that’s the classic smell of short covering, not fresh longs entering. Volume at 1.46x with a Z-score of 2.41, but the taker buy/sell ratio is only 1.01, a mere 0.5% difference. That means the buying pressure behind the move is actually pretty modest; it’s mostly shorts closing out and lifting the price. Be careful chasing longs in this kind of setup. If OI doesn’t pick up after the covering is done, the price could easily spike and then pull back. 24h volume is 78M, and the pool’s anomaly ranking is #23—not especially eye-catching. For now, let’s see if it can hold above the range highs.
·
--
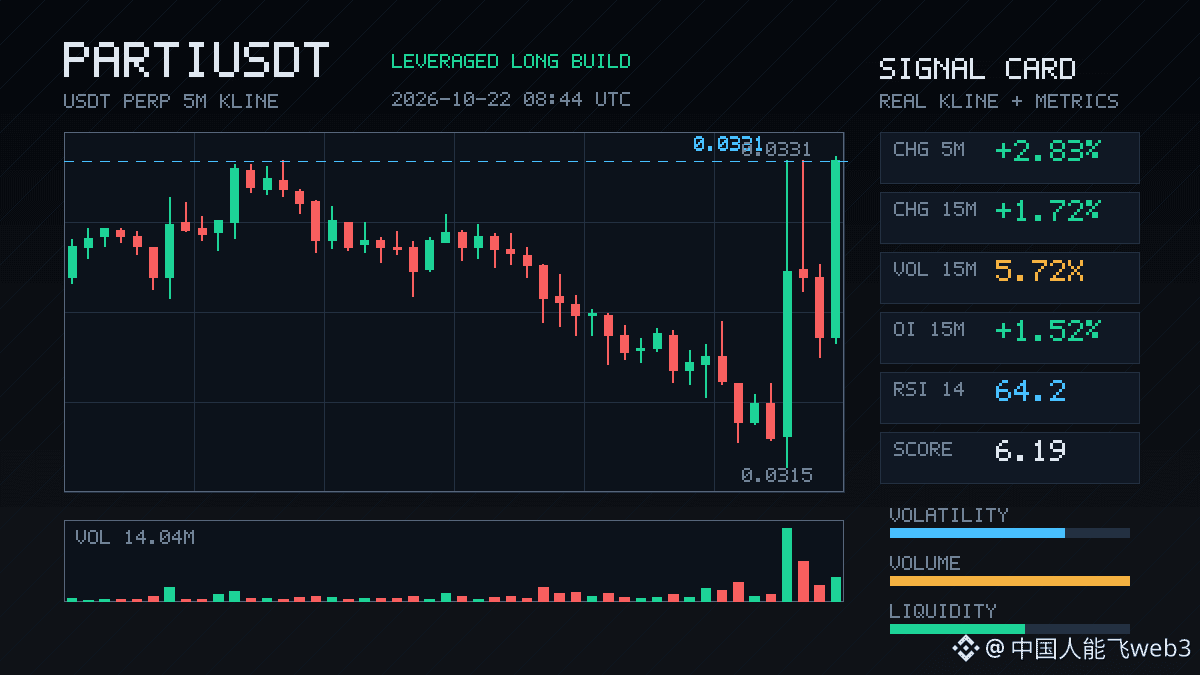
$PARTI This 15-minute move is notable: price is up 1.72%, volume has surged to 5.72x, and OI is rising in sync on both the 15m and 1h timeframes. Longs are entering with leverage—not just a short-covering squeeze. The OI anomaly percentile has reached 90.7%, ranking #23 across the entire pool. Funding rates are also near recent highs, with a 5.7% aggressive buy-sell imbalance and a 1.12 buy-sell ratio; the order book still favors buyers.
The biggest risk with this setup is longs crowding each other out. Leverage is piling up quickly, and if price starts moving sideways, it could trigger a cascade of position reductions. Volume and price are still moving together, but be cautious about chasing the rally—don't be the last one holding the bag.
$PARTI This 15-minute move is notable: price is up 1.72%, volume has surged to 5.72x, and OI is rising in sync on both the 15m and 1h timeframes. Longs are entering with leverage—not just a short-covering squeeze. The OI anomaly percentile has reached 90.7%, ranking #23 across the entire pool. Funding rates are also near recent highs, with a 5.7% aggressive buy-sell imbalance and a 1.12 buy-sell ratio; the order book still favors buyers.
The biggest risk with this setup is longs crowding each other out. Leverage is piling up quickly, and if price starts moving sideways, it could trigger a cascade of position reductions. Volume and price are still moving together, but be cautious about chasing the rally—don't be the last one holding the bag.
The biggest risk with this setup is longs crowding each other out. Leverage is piling up quickly, and if price starts moving sideways, it could trigger a cascade of position reductions. Volume and price are still moving together, but be cautious about chasing the rally—don't be the last one holding the bag.
3
·
--
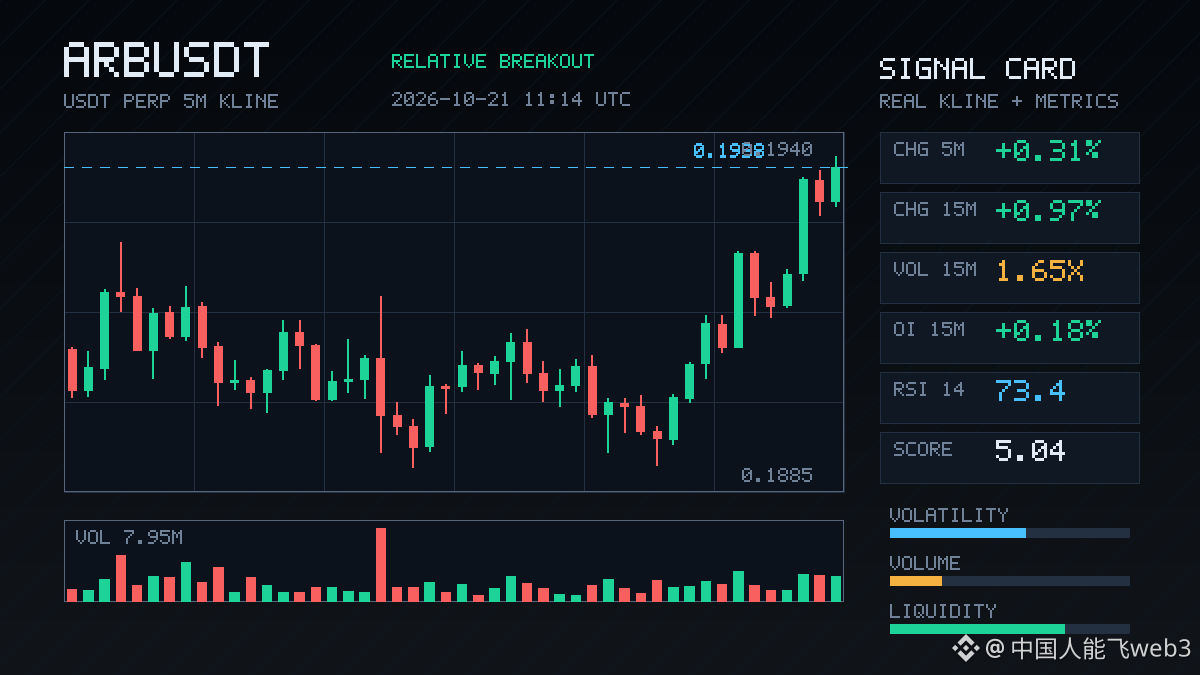
$ARB has shown some activity over the past 15 minutes. Price rose by less than 1 point, but volume climbed to 1.65x, with an 8.8% imbalance in aggressive buying versus selling and a ratio of 1.19—buyers are pushing. The key is OI: 15-minute contracts are up 0.18%, notional is up 661K, and 1-hour notional is also up 1.34M. The anomaly percentile is 90.3%, ranking #23 across the full pool and #13 for notional change. This has held up for several consecutive periods, so it’s not just a spot-driven move; it looks more like new leveraged longs are entering. The close has just pushed above the upper end of the past 20 five-minute candles, with 150 million in 24-hour trading volume behind it. Whether the breakout can hold remains to be seen, but the alignment of OI, volume, and price is worth watching to see if it continues.
$ARB has shown some activity over the past 15 minutes. Price rose by less than 1 point, but volume climbed to 1.65x, with an 8.8% imbalance in aggressive buying versus selling and a ratio of 1.19—buyers are pushing. The key is OI: 15-minute contracts are up 0.18%, notional is up 661K, and 1-hour notional is also up 1.34M. The anomaly percentile is 90.3%, ranking #23 across the full pool and #13 for notional change. This has held up for several consecutive periods, so it’s not just a spot-driven move; it looks more like new leveraged longs are entering. The close has just pushed above the upper end of the past 20 five-minute candles, with 150 million in 24-hour trading volume behind it. Whether the breakout can hold remains to be seen, but the alignment of OI, volume, and price is worth watching to see if it continues.
2
·
--
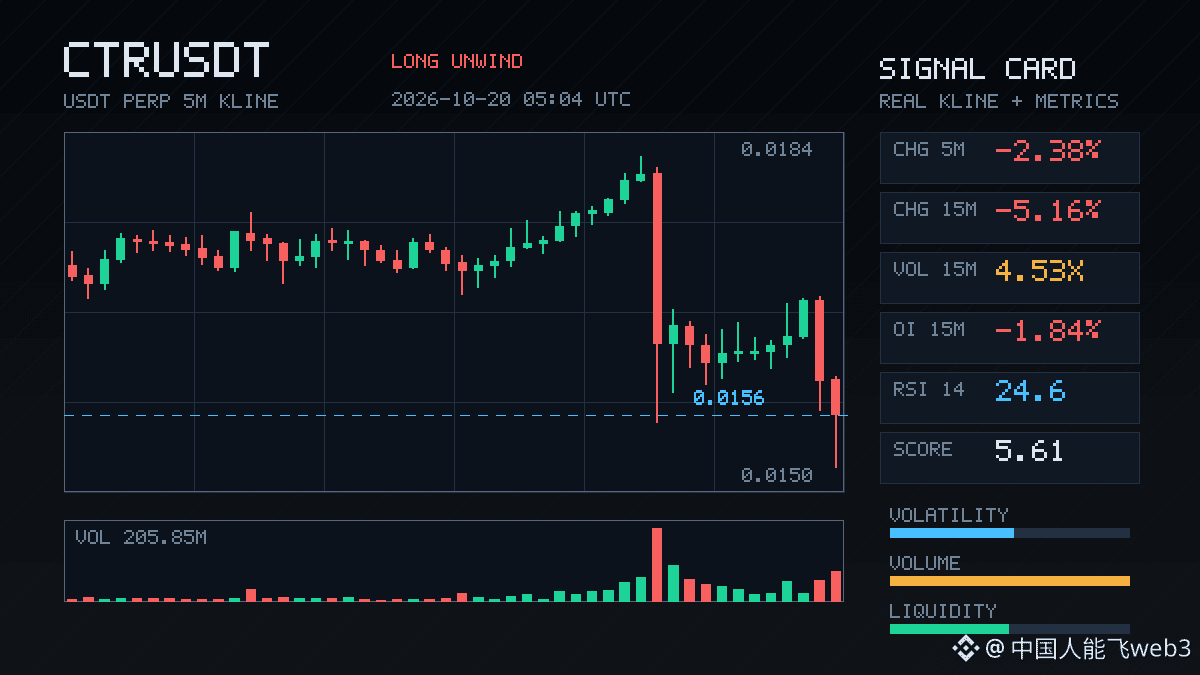
$CTR fell sharply in this move: down 5.16% in 15 minutes, with volume reaching 4.53 times its usual level. OI fell 7.77% in an hour, and notional value dropped by 1.18M. Price and open interest are moving down together—a classic case of longs deleveraging, with clear signs of stop-loss cascades.
The OI anomaly percentile is already at 94.6%, ranking #6 across the entire pool, while notional change ranks #23. 24-hour trading volume is just over 30M, suggesting this is no minor move—positions are genuinely being pulled out.
The taker buy/sell imbalance is -3.3%, and the buy/sell ratio is 0.94. Selling pressure isn’t extreme, but it’s persistent. In this kind of setup, I wouldn’t rush to buy the dip. I’d wait for OI to stabilize and volume to contract before reassessing. Until the longs have been fully flushed out, any bounce is just handing liquidity to the shorts.
$CTR fell sharply in this move: down 5.16% in 15 minutes, with volume reaching 4.53 times its usual level. OI fell 7.77% in an hour, and notional value dropped by 1.18M. Price and open interest are moving down together—a classic case of longs deleveraging, with clear signs of stop-loss cascades.
The OI anomaly percentile is already at 94.6%, ranking #6 across the entire pool, while notional change ranks #23. 24-hour trading volume is just over 30M, suggesting this is no minor move—positions are genuinely being pulled out.
The taker buy/sell imbalance is -3.3%, and the buy/sell ratio is 0.94. Selling pressure isn’t extreme, but it’s persistent. In this kind of setup, I wouldn’t rush to buy the dip. I’d wait for OI to stabilize and volume to contract before reassessing. Until the longs have been fully flushed out, any bounce is just handing liquidity to the shorts.
The OI anomaly percentile is already at 94.6%, ranking #6 across the entire pool, while notional change ranks #23. 24-hour trading volume is just over 30M, suggesting this is no minor move—positions are genuinely being pulled out.
The taker buy/sell imbalance is -3.3%, and the buy/sell ratio is 0.94. Selling pressure isn’t extreme, but it’s persistent. In this kind of setup, I wouldn’t rush to buy the dip. I’d wait for OI to stabilize and volume to contract before reassessing. Until the longs have been fully flushed out, any bounce is just handing liquidity to the shorts.
2

·
--
This week, the ledger has 14 calls: 9 right and 5 wrong. Let me get the uncomfortable truth out of the way first.
I started the week on a 7-win streak and got a little overconfident. Then CPI came out: the overall figure was 3.7%, beating expectations across the board, and rate-hike pricing briefly shot up to 50%. That fake breakout at 84,362 on $BTC got hammered all the way back down. $ETH broke 2,400 and shot to the top of the Plaza trending list. The funding rate on $SOL turned negative, so shorts got paid. Starting the evening of 10-11, four of my calls in a row were proven wrong. There was no dodging it.
When I'm wrong, I own it—and lay out the ledger. The #14 call from the overnight session on 10-12 hit: a high-volume break below 82,567, with 81,600 in sight. Instead, it fell even further. Last night's overnight call on #23 was also on target: the 82,600 reversal-confirmation line wasn't touched all day, so “no reversal” was confirmed, and price held above 81,000 and kept grinding. At midday today, I posted a new call, #24: price is grinding in the 80,813–82,072 range; a break below 80,813 puts 80,000 in play. It's unfolding now.
Next week, there are only two big things to watch: China's Q3 GDP on Monday at 10:00—the only Tier 1 macro release this year—and Tesla and Meta earnings after the close on Wednesday. We'll find out whether all that AI spending can actually make money. The Fed is in its blackout period, so nobody's talking.
Which wrong call of mine this week do you think I deserved the most? Let's settle it in the comments.
#本周复盘 #Prediction Ledger
This week, the ledger has 14 calls: 9 right and 5 wrong. Let me get the uncomfortable truth out of the way first.
I started the week on a 7-win streak and got a little overconfident. Then CPI came out: the overall figure was 3.7%, beating expectations across the board, and rate-hike pricing briefly shot up to 50%. That fake breakout at 84,362 on $BTC got hammered all the way back down. $ETH broke 2,400 and shot to the top of the Plaza trending list. The funding rate on $SOL turned negative, so shorts got paid. Starting the evening of 10-11, four of my calls in a row were proven wrong. There was no dodging it.
When I'm wrong, I own it—and lay out the ledger. The #14 call from the overnight session on 10-12 hit: a high-volume break below 82,567, with 81,600 in sight. Instead, it fell even further. Last night's overnight call on #23 was also on target: the 82,600 reversal-confirmation line wasn't touched all day, so “no reversal” was confirmed, and price held above 81,000 and kept grinding. At midday today, I posted a new call, #24: price is grinding in the 80,813–82,072 range; a break below 80,813 puts 80,000 in play. It's unfolding now.
Next week, there are only two big things to watch: China's Q3 GDP on Monday at 10:00—the only Tier 1 macro release this year—and Tesla and Meta earnings after the close on Wednesday. We'll find out whether all that AI spending can actually make money. The Fed is in its blackout period, so nobody's talking.
Which wrong call of mine this week do you think I deserved the most? Let's settle it in the comments.
#本周复盘 #Prediction Ledger
I started the week on a 7-win streak and got a little overconfident. Then CPI came out: the overall figure was 3.7%, beating expectations across the board, and rate-hike pricing briefly shot up to 50%. That fake breakout at 84,362 on $BTC got hammered all the way back down. $ETH broke 2,400 and shot to the top of the Plaza trending list. The funding rate on $SOL turned negative, so shorts got paid. Starting the evening of 10-11, four of my calls in a row were proven wrong. There was no dodging it.
When I'm wrong, I own it—and lay out the ledger. The #14 call from the overnight session on 10-12 hit: a high-volume break below 82,567, with 81,600 in sight. Instead, it fell even further. Last night's overnight call on #23 was also on target: the 82,600 reversal-confirmation line wasn't touched all day, so “no reversal” was confirmed, and price held above 81,000 and kept grinding. At midday today, I posted a new call, #24: price is grinding in the 80,813–82,072 range; a break below 80,813 puts 80,000 in play. It's unfolding now.
Next week, there are only two big things to watch: China's Q3 GDP on Monday at 10:00—the only Tier 1 macro release this year—and Tesla and Meta earnings after the close on Wednesday. We'll find out whether all that AI spending can actually make money. The Fed is in its blackout period, so nobody's talking.
Which wrong call of mine this week do you think I deserved the most? Let's settle it in the comments.
#本周复盘 #Prediction Ledger
214
·
--
$AAVE saw 15m volume surge to 3.48x, breaking straight below the lower bound of the last 20 5m candles. Aggressive trade imbalance was -39.6%, and the buy/sell ratio was 0.43—selling pressure was overwhelmingly one-sided. But look at OI: 15m -0.03%, 1h notional -664K. Price down + OI down is typical of -Smith longs deleveraging or exiting via stop-losses, not new shorts piling in to drive the price down. Its abnormality percentile is 77.2% (#23 across the full pool), and notional change ranks #18, so liquidity is indeed showing unusual activity. This structure looks more like a leverage flush than a trend reversal. First, watch whether it can reclaim the lower end of the range; if it can't, reassess.
$AAVE saw 15m volume surge to 3.48x, breaking straight below the lower bound of the last 20 5m candles. Aggressive trade imbalance was -39.6%, and the buy/sell ratio was 0.43—selling pressure was overwhelmingly one-sided. But look at OI: 15m -0.03%, 1h notional -664K. Price down + OI down is typical of -Smith longs deleveraging or exiting via stop-losses, not new shorts piling in to drive the price down. Its abnormality percentile is 77.2% (#23 across the full pool), and notional change ranks #18, so liquidity is indeed showing unusual activity. This structure looks more like a leverage flush than a trend reversal. First, watch whether it can reclaim the lower end of the range; if it can't, reassess.
7
·
--
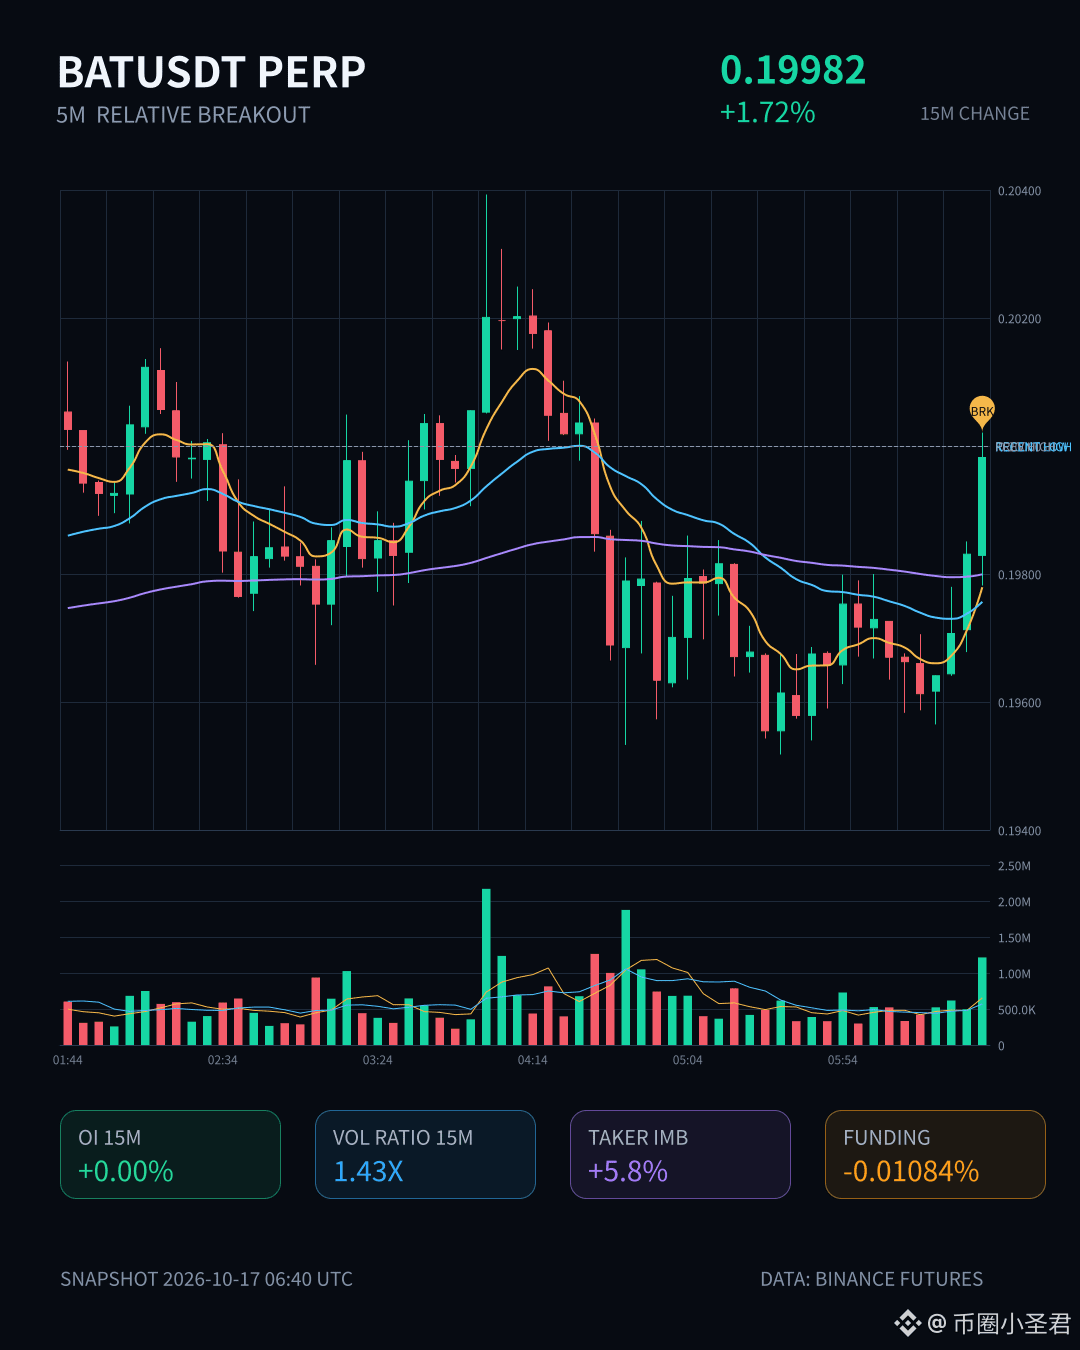
$BAT This move is getting interesting. It’s up 1.72% over 15m, which doesn’t look like much, but volume has risen to 1.43x and the volatility Z-score hit 2.57. It also closed above the upper bound of the last 20 or so 5m candles—breakouts at the edge of a range like this are often more informative than a single big green candle.
More importantly, OI is moving with it. Notional is up 1.09% over 15m and 1.42% over 1h. It ranks #31 for anomalies across the whole pool and #23 for notional change. The absolute increase isn’t huge, but rising prices alongside rising OI points to new leveraged longs entering, rather than shorts getting squeezed. The taker volume delta is 5.8% and the buy/sell ratio is 1.12, so buyers have a slight edge as well.
24h trading volume is just over 80M, so this isn’t a large pool. At this size, a 149K notional change is enough to push the anomaly percentile to 64.7%, suggesting thin liquidity. That can amplify a breakout, but it can also make a pullback turn into a rush for the exits. My take: the breakout is real, and so is the leveraged long positioning. But given the relative breakout in a small pool like this, be cautious about chasing the price. It would be safer to wait for a pullback and see if the boundary holds before considering an entry.
$BAT This move is getting interesting. It’s up 1.72% over 15m, which doesn’t look like much, but volume has risen to 1.43x and the volatility Z-score hit 2.57. It also closed above the upper bound of the last 20 or so 5m candles—breakouts at the edge of a range like this are often more informative than a single big green candle.
More importantly, OI is moving with it. Notional is up 1.09% over 15m and 1.42% over 1h. It ranks #31 for anomalies across the whole pool and #23 for notional change. The absolute increase isn’t huge, but rising prices alongside rising OI points to new leveraged longs entering, rather than shorts getting squeezed. The taker volume delta is 5.8% and the buy/sell ratio is 1.12, so buyers have a slight edge as well.
24h trading volume is just over 80M, so this isn’t a large pool. At this size, a 149K notional change is enough to push the anomaly percentile to 64.7%, suggesting thin liquidity. That can amplify a breakout, but it can also make a pullback turn into a rush for the exits. My take: the breakout is real, and so is the leveraged long positioning. But given the relative breakout in a small pool like this, be cautious about chasing the price. It would be safer to wait for a pullback and see if the boundary holds before considering an entry.
More importantly, OI is moving with it. Notional is up 1.09% over 15m and 1.42% over 1h. It ranks #31 for anomalies across the whole pool and #23 for notional change. The absolute increase isn’t huge, but rising prices alongside rising OI points to new leveraged longs entering, rather than shorts getting squeezed. The taker volume delta is 5.8% and the buy/sell ratio is 1.12, so buyers have a slight edge as well.
24h trading volume is just over 80M, so this isn’t a large pool. At this size, a 149K notional change is enough to push the anomaly percentile to 64.7%, suggesting thin liquidity. That can amplify a breakout, but it can also make a pullback turn into a rush for the exits. My take: the breakout is real, and so is the leveraged long positioning. But given the relative breakout in a small pool like this, be cautious about chasing the price. It would be safer to wait for a pullback and see if the boundary holds before considering an entry.
18

·
--
$USELESS This one is pretty interesting.
It surged 1.86% in 15 minutes, with volume reaching 2.3x and a Z-score above 5. It also closed above the upper boundary of the past 20 or so 5-minute candles. The aggressive buy/sell ratio was 1.42, with a difference of +17.4%, suggesting real money was actively pushing the price up—not just resting orders.
But the strange part is open interest: 15-minute futures OI was down 0.06%, while the 1-hour figure was only up 0.16%. Notional changes were 151K / 258K. Alongside the price surge, this setup looks more like short covering or existing positions shifting around than a major influx of new longs. The OI anomaly percentile is 87.9%, ranking #23 across the entire pool, and it has persisted for several consecutive periods, so this signal isn't just a one-candle blip.
24-hour trading volume is 34.69M, with enough depth—this isn't the kind of pool that dies after a quick pump. The question is: if this is just short covering, who's going to step in once it's done? Until the price-volume divergence is resolved, I wouldn't chase it. I'll wait for a pullback and see if there's support. It's called USELESS, but the price action is taking itself a lot more seriously.
$USELESS This one is pretty interesting.
It surged 1.86% in 15 minutes, with volume reaching 2.3x and a Z-score above 5. It also closed above the upper boundary of the past 20 or so 5-minute candles. The aggressive buy/sell ratio was 1.42, with a difference of +17.4%, suggesting real money was actively pushing the price up—not just resting orders.
But the strange part is open interest: 15-minute futures OI was down 0.06%, while the 1-hour figure was only up 0.16%. Notional changes were 151K / 258K. Alongside the price surge, this setup looks more like short covering or existing positions shifting around than a major influx of new longs. The OI anomaly percentile is 87.9%, ranking #23 across the entire pool, and it has persisted for several consecutive periods, so this signal isn't just a one-candle blip.
24-hour trading volume is 34.69M, with enough depth—this isn't the kind of pool that dies after a quick pump. The question is: if this is just short covering, who's going to step in once it's done? Until the price-volume divergence is resolved, I wouldn't chase it. I'll wait for a pullback and see if there's support. It's called USELESS, but the price action is taking itself a lot more seriously.
It surged 1.86% in 15 minutes, with volume reaching 2.3x and a Z-score above 5. It also closed above the upper boundary of the past 20 or so 5-minute candles. The aggressive buy/sell ratio was 1.42, with a difference of +17.4%, suggesting real money was actively pushing the price up—not just resting orders.
But the strange part is open interest: 15-minute futures OI was down 0.06%, while the 1-hour figure was only up 0.16%. Notional changes were 151K / 258K. Alongside the price surge, this setup looks more like short covering or existing positions shifting around than a major influx of new longs. The OI anomaly percentile is 87.9%, ranking #23 across the entire pool, and it has persisted for several consecutive periods, so this signal isn't just a one-candle blip.
24-hour trading volume is 34.69M, with enough depth—this isn't the kind of pool that dies after a quick pump. The question is: if this is just short covering, who's going to step in once it's done? Until the price-volume divergence is resolved, I wouldn't chase it. I'll wait for a pullback and see if there's support. It's called USELESS, but the price action is taking itself a lot more seriously.
60
·
--
$1000PEPE saw a sudden 3.39x surge in 15m volume. Price rose 0.8%, and the close broke above the highs of nearly 20 recent 5m candles. The taker buy/sell ratio was 1.75, with a 27.3% gap—clearly skewed toward buyers.
But OI is falling: -0.03% over 15m and -0.06% over 1h. The notional change is small; it's ranked #23 among anomalies across the entire pool.
Price is up, but positions are shrinking. This doesn't look like new longs entering; it's more likely shorts being squeezed into covering, or someone using the rally to close out.
With $255M in 24h trading volume, liquidity isn't bad. But when a breakout like this happens without OI confirming it, I generally wouldn't chase it as a trend.
First, watch whether price can hold above the top of this range. If it can't, this could turn out to be nothing more than a quick wick.
$1000PEPE saw a sudden 3.39x surge in 15m volume. Price rose 0.8%, and the close broke above the highs of nearly 20 recent 5m candles. The taker buy/sell ratio was 1.75, with a 27.3% gap—clearly skewed toward buyers.
But OI is falling: -0.03% over 15m and -0.06% over 1h. The notional change is small; it's ranked #23 among anomalies across the entire pool.
Price is up, but positions are shrinking. This doesn't look like new longs entering; it's more likely shorts being squeezed into covering, or someone using the rally to close out.
With $255M in 24h trading volume, liquidity isn't bad. But when a breakout like this happens without OI confirming it, I generally wouldn't chase it as a trend.
First, watch whether price can hold above the top of this range. If it can't, this could turn out to be nothing more than a quick wick.
But OI is falling: -0.03% over 15m and -0.06% over 1h. The notional change is small; it's ranked #23 among anomalies across the entire pool.
Price is up, but positions are shrinking. This doesn't look like new longs entering; it's more likely shorts being squeezed into covering, or someone using the rally to close out.
With $255M in 24h trading volume, liquidity isn't bad. But when a breakout like this happens without OI confirming it, I generally wouldn't chase it as a trend.
First, watch whether price can hold above the top of this range. If it can't, this could turn out to be nothing more than a quick wick.
82
·
--
FIL is making an interesting move late at night.
It suddenly surged 1.11% over 15m, with volume jumping to 2.19x, and the closing price broke above the high of nearly 20 recent 5m candles. But OI only rose 0.07% over 15m; it was up 0.48% over 1h, with a notional change of around 650K U—not a particularly large amount.
It ranks #76 for anomalies across the entire pool and #23 for notional change, putting it near the top but nowhere extreme. 24h trading volume is 222M, so liquidity is sufficient.
The odd part is that the aggressive trade delta is -19.6%, with a buy/sell ratio of 0.67—in other words, the price is moving up, but aggressive sell orders are outweighing buys. Together with rising OI, this could mean someone is passively absorbing supply, or that shorts are holding their ground.
There is a breakout, and the volume is real, but the bearish tilt in aggressive trading makes it hard to feel fully confident. First, watch whether price can hold above this range. If it can't, it's a false breakout. It's the middle of the night—don't get carried away.
FIL is making an interesting move late at night.
It suddenly surged 1.11% over 15m, with volume jumping to 2.19x, and the closing price broke above the high of nearly 20 recent 5m candles. But OI only rose 0.07% over 15m; it was up 0.48% over 1h, with a notional change of around 650K U—not a particularly large amount.
It ranks #76 for anomalies across the entire pool and #23 for notional change, putting it near the top but nowhere extreme. 24h trading volume is 222M, so liquidity is sufficient.
The odd part is that the aggressive trade delta is -19.6%, with a buy/sell ratio of 0.67—in other words, the price is moving up, but aggressive sell orders are outweighing buys. Together with rising OI, this could mean someone is passively absorbing supply, or that shorts are holding their ground.
There is a breakout, and the volume is real, but the bearish tilt in aggressive trading makes it hard to feel fully confident. First, watch whether price can hold above this range. If it can't, it's a false breakout. It's the middle of the night—don't get carried away.
It suddenly surged 1.11% over 15m, with volume jumping to 2.19x, and the closing price broke above the high of nearly 20 recent 5m candles. But OI only rose 0.07% over 15m; it was up 0.48% over 1h, with a notional change of around 650K U—not a particularly large amount.
It ranks #76 for anomalies across the entire pool and #23 for notional change, putting it near the top but nowhere extreme. 24h trading volume is 222M, so liquidity is sufficient.
The odd part is that the aggressive trade delta is -19.6%, with a buy/sell ratio of 0.67—in other words, the price is moving up, but aggressive sell orders are outweighing buys. Together with rising OI, this could mean someone is passively absorbing supply, or that shorts are holding their ground.
There is a breakout, and the volume is real, but the bearish tilt in aggressive trading makes it hard to feel fully confident. First, watch whether price can hold above this range. If it can't, it's a false breakout. It's the middle of the night—don't get carried away.
5
Log in to explore more content
Join global crypto users on Binance Square
⚡️ Get latest and useful information about crypto.
💬 Trusted by the world’s largest crypto exchange.
👍 Discover real insights from verified creators.
Email / Phone number
Trending Topics
1
#BinancePick
2.9M views
150,181 Discussing
2
#EarningsSeason
5.2M views
25,621 Discussing
3
#AnthropicTTMRevenueGrewAbout1200%
11,039 views
276 Discussing
4
#AnthropicS1ExpectedToday
14,322 views
254 Discussing
5
#SouthKoreaReportedlyWeighsFourthCryptoTaxDelay
21,291 views
387 Discussing
6
#FranklinTempletonFilesForTwoDividendToBitcoinETFs
28,641 views
483 Discussing
7
#StrategyMSTRSurpassesNasdaqInMarketCap
22,052 views
347 Discussing
8
#CanadaProposesStablecoinRedemptionWithin3BusinessDays
999 views
34 Discussing
9
#ElectrumWalletBugLetRogueServersStealFunds
24,710 views
435 Discussing
10
#ArgentineCourtDismissesLIBRACaseAgainstMilei
37,535 views
537 Discussing