

Conejo03
23.7k Posts

Conejo03
Report
Block User
Con ganas de aprender sobre este 🌍 gracias por sus ayudas
Open Trade
Occasional Trader
4.8 Years
2.3K+ Following
1.2K+ Followers
2.1K+ Liked
Posts
Portfolio
All
Quotes
Videos
Live
PINNED
·
--
Bullish
#EthereumValidatorExitQueueJumps392%
$USDC #WOTD🔥
{future}(USDCUSDT)
Participa 👉[AQUI](https://www.binance.com/activity/word-of-the-day/Proactive-Security-Wins?ref=CPA_001FM9SV6M) for a prize pool to be shared among the winners of10000$USDC
#EthereumValidatorExitQueueJumps392%
$USDC #WOTD🔥
Participa 👉AQUI for a prize pool to be shared among the winners of10000$USDC
$USDC #WOTD🔥
Participa 👉AQUI for a prize pool to be shared among the winners of10000$USDC

7
·
--
Bullish
#FedOctoberHoldOdds82.3%
Short-term outlook for $BNB .
{future}(BNBUSDT)
@BNB_Chain
The interaction between leverage in the derivatives market and demand in the spot market will be one of the main factors to watch for BNB in the coming sessions. Rising open interest and positive funding rates reflect a growing appetite for bullish positions, but they also make the market more vulnerable to potential liquidations if the price moves in the opposite direction.
$BNB
In any case, BNB's structure continues to show technical strength as long as the price remains above its main support levels. The $800 zone now appears to be an immediate reference point: sustained consolidation above this level would reinforce the bullish outlook, while further rejections could prolong the consolidation phase before the next move.$BNB
#FedOctoberHoldOdds82.3%
Short-term outlook for $BNB .
@BNB Chain
The interaction between leverage in the derivatives market and demand in the spot market will be one of the main factors to watch for BNB in the coming sessions. Rising open interest and positive funding rates reflect a growing appetite for bullish positions, but they also make the market more vulnerable to potential liquidations if the price moves in the opposite direction.
$BNB
In any case, BNB's structure continues to show technical strength as long as the price remains above its main support levels. The $800 zone now appears to be an immediate reference point: sustained consolidation above this level would reinforce the bullish outlook, while further rejections could prolong the consolidation phase before the next move.$BNB
Short-term outlook for $BNB .
@BNB Chain
The interaction between leverage in the derivatives market and demand in the spot market will be one of the main factors to watch for BNB in the coming sessions. Rising open interest and positive funding rates reflect a growing appetite for bullish positions, but they also make the market more vulnerable to potential liquidations if the price moves in the opposite direction.
$BNB
In any case, BNB's structure continues to show technical strength as long as the price remains above its main support levels. The $800 zone now appears to be an immediate reference point: sustained consolidation above this level would reinforce the bullish outlook, while further rejections could prolong the consolidation phase before the next move.$BNB

129
·
--
Bullish
#EthStakingExitQueueHits2026High
Technical analysis and key support and resistance levels for the price of $BNB .
{future}(BNBUSDT)
@BNB_Chain
From a technical perspective, BNB maintains a favorable structure, trading above its 50-, 100- and 200-day exponential moving averages. The averages at around $728, $689 and $679, respectively, serve as relevant reference points in the event of deeper corrections.$BNB
#BNBToken Meanwhile, the relative strength index (RSI) is near 60, showing favorable momentum for buyers without yet reaching the traditional overbought zone. The MACD, on the other hand, is slightly negative, indicating that short-term momentum has moderated even though the overall structure remains bullish.
$BNB
If a short-term pullback occurs, the first horizontal support level is near $758. A deeper correction could find support around the 50% Fibonacci retracement at $748, followed by the 50-day EMA near $728. Together, these levels define a broad zone that buyers may try to defend.
#BNB走势 To the upside, a sustained break above the $798–$800 region would strengthen the possibility of continued gains toward $826. If BNB subsequently manages to break above that area, the next major technical level is around $959. However, these targets will depend on the price consolidating above previous resistance levels and maintaining sufficient buying volume.
#EthStakingExitQueueHits2026High
Technical analysis and key support and resistance levels for the price of $BNB .
@BNB Chain
From a technical perspective, BNB maintains a favorable structure, trading above its 50-, 100- and 200-day exponential moving averages. The averages at around $728, $689 and $679, respectively, serve as relevant reference points in the event of deeper corrections.$BNB
#BNBToken Meanwhile, the relative strength index (RSI) is near 60, showing favorable momentum for buyers without yet reaching the traditional overbought zone. The MACD, on the other hand, is slightly negative, indicating that short-term momentum has moderated even though the overall structure remains bullish.
$BNB
If a short-term pullback occurs, the first horizontal support level is near $758. A deeper correction could find support around the 50% Fibonacci retracement at $748, followed by the 50-day EMA near $728. Together, these levels define a broad zone that buyers may try to defend.
#BNB走势 To the upside, a sustained break above the $798–$800 region would strengthen the possibility of continued gains toward $826. If BNB subsequently manages to break above that area, the next major technical level is around $959. However, these targets will depend on the price consolidating above previous resistance levels and maintaining sufficient buying volume.
Technical analysis and key support and resistance levels for the price of $BNB .
@BNB Chain
From a technical perspective, BNB maintains a favorable structure, trading above its 50-, 100- and 200-day exponential moving averages. The averages at around $728, $689 and $679, respectively, serve as relevant reference points in the event of deeper corrections.$BNB
#BNBToken Meanwhile, the relative strength index (RSI) is near 60, showing favorable momentum for buyers without yet reaching the traditional overbought zone. The MACD, on the other hand, is slightly negative, indicating that short-term momentum has moderated even though the overall structure remains bullish.
$BNB
If a short-term pullback occurs, the first horizontal support level is near $758. A deeper correction could find support around the 50% Fibonacci retracement at $748, followed by the 50-day EMA near $728. Together, these levels define a broad zone that buyers may try to defend.
#BNB走势 To the upside, a sustained break above the $798–$800 region would strengthen the possibility of continued gains toward $826. If BNB subsequently manages to break above that area, the next major technical level is around $959. However, these targets will depend on the price consolidating above previous resistance levels and maintaining sufficient buying volume.

188
·
--
Bullish
#ETHUp70%InQ3ButLiquidityFalls
The price of $BNB reached a local peak of $800. Will the rally continue in the short term?
{future}(BNBUSDT)
@BNB_Chain BNB's price edged lower this Monday, trading around $786 after posting gains for three consecutive weeks. During the day, the asset briefly rose above $800, while the derivatives market showed increased activity and a greater bias toward buyers.
In the derivatives market, BNB open interest reached around $1.81 billion this Monday, its highest level since early June, according to data cited by FXStreet.$BNB
The rise in open interest alongside the price increase reflects the entry of new leveraged positions. Meanwhile, the funding rate remains positive at around 0.0093%, indicating that traders holding long positions are more willing to pay those holding short positions.
Despite these metrics, flows into BNB spot exchange-traded funds (ETFs) have remained stagnant since May. The lack of significant inflows points to limited institutional interest in the asset in recent months. As a result, the recent price increase has been driven primarily by speculation in the derivatives market.
#BNBToken
In short, to consolidate a prolonged uptrend, the token will need a sustained shift in ETF flows that confirms institutional support. Long-term capital inflows would help cushion pullbacks like the current one, which are caused by derivatives liquidations.$BNB
#ETHUp70%InQ3ButLiquidityFalls
The price of $BNB reached a local peak of $800. Will the rally continue in the short term?
@BNB Chain BNB's price edged lower this Monday, trading around $786 after posting gains for three consecutive weeks. During the day, the asset briefly rose above $800, while the derivatives market showed increased activity and a greater bias toward buyers.
In the derivatives market, BNB open interest reached around $1.81 billion this Monday, its highest level since early June, according to data cited by FXStreet.$BNB
The rise in open interest alongside the price increase reflects the entry of new leveraged positions. Meanwhile, the funding rate remains positive at around 0.0093%, indicating that traders holding long positions are more willing to pay those holding short positions.
Despite these metrics, flows into BNB spot exchange-traded funds (ETFs) have remained stagnant since May. The lack of significant inflows points to limited institutional interest in the asset in recent months. As a result, the recent price increase has been driven primarily by speculation in the derivatives market.
#BNBToken
In short, to consolidate a prolonged uptrend, the token will need a sustained shift in ETF flows that confirms institutional support. Long-term capital inflows would help cushion pullbacks like the current one, which are caused by derivatives liquidations.$BNB
The price of $BNB reached a local peak of $800. Will the rally continue in the short term?
@BNB Chain BNB's price edged lower this Monday, trading around $786 after posting gains for three consecutive weeks. During the day, the asset briefly rose above $800, while the derivatives market showed increased activity and a greater bias toward buyers.
In the derivatives market, BNB open interest reached around $1.81 billion this Monday, its highest level since early June, according to data cited by FXStreet.$BNB
The rise in open interest alongside the price increase reflects the entry of new leveraged positions. Meanwhile, the funding rate remains positive at around 0.0093%, indicating that traders holding long positions are more willing to pay those holding short positions.
Despite these metrics, flows into BNB spot exchange-traded funds (ETFs) have remained stagnant since May. The lack of significant inflows points to limited institutional interest in the asset in recent months. As a result, the recent price increase has been driven primarily by speculation in the derivatives market.
#BNBToken
In short, to consolidate a prolonged uptrend, the token will need a sustained shift in ETF flows that confirms institutional support. Long-term capital inflows would help cushion pullbacks like the current one, which are caused by derivatives liquidations.$BNB

523
·
--
Bullish
#BitcoinFundingRateTriplesTo10%
$BNB recovers land and aims for a breakout over $771. #BNBToken
#binance BNB tries to regain traction after several sessions of consolidation, as the market evaluates a combination of technical signals and progress within BNB Chain. Activity related to stablecoins, new institutional initiatives, and infrastructure improvements provide support to the ecosystem, although the price still needs to break above nearby resistances to confirm a broader recovery.
$BNB
{future}(BNBUSDT)
▫️$BNB Chain strengthens its commitment to institutional adoption.
One of the most notable moves of the week was the appointment of Thomas Chen as the new Chief Business Officer of BNB Chain. His role will focus on revenue strategy, institutional partnerships, and creating long-term value for the ecosystem. Chen will also work with asset managers, banks, custodians, and real-world asset issuers, while boosting liquidity and trading volume across the network.
@BNB_Chain
The arrival comes as BNB Chain seeks to expand its presence in segments such as stablecoins, tokenization, and payments. This is accompanied by an extension until October 31 of its zero-fee transaction campaign for USDC, USD1, and U, which covers withdrawals, transfers, and operations via bridges. According to the network itself, the initiative has already covered more than $4.5 million in fees—an approach aimed at reducing friction to move liquidity toward BNB Chain.
#BitcoinFundingRateTriplesTo10%
$BNB recovers land and aims for a breakout over $771. #BNBToken
#binance BNB tries to regain traction after several sessions of consolidation, as the market evaluates a combination of technical signals and progress within BNB Chain. Activity related to stablecoins, new institutional initiatives, and infrastructure improvements provide support to the ecosystem, although the price still needs to break above nearby resistances to confirm a broader recovery.
$BNB
▫️$BNB Chain strengthens its commitment to institutional adoption.
One of the most notable moves of the week was the appointment of Thomas Chen as the new Chief Business Officer of BNB Chain. His role will focus on revenue strategy, institutional partnerships, and creating long-term value for the ecosystem. Chen will also work with asset managers, banks, custodians, and real-world asset issuers, while boosting liquidity and trading volume across the network.
@BNB Chain
The arrival comes as BNB Chain seeks to expand its presence in segments such as stablecoins, tokenization, and payments. This is accompanied by an extension until October 31 of its zero-fee transaction campaign for USDC, USD1, and U, which covers withdrawals, transfers, and operations via bridges. According to the network itself, the initiative has already covered more than $4.5 million in fees—an approach aimed at reducing friction to move liquidity toward BNB Chain.
$BNB recovers land and aims for a breakout over $771. #BNBToken
#binance BNB tries to regain traction after several sessions of consolidation, as the market evaluates a combination of technical signals and progress within BNB Chain. Activity related to stablecoins, new institutional initiatives, and infrastructure improvements provide support to the ecosystem, although the price still needs to break above nearby resistances to confirm a broader recovery.
$BNB
▫️$BNB Chain strengthens its commitment to institutional adoption.
One of the most notable moves of the week was the appointment of Thomas Chen as the new Chief Business Officer of BNB Chain. His role will focus on revenue strategy, institutional partnerships, and creating long-term value for the ecosystem. Chen will also work with asset managers, banks, custodians, and real-world asset issuers, while boosting liquidity and trading volume across the network.
@BNB Chain
The arrival comes as BNB Chain seeks to expand its presence in segments such as stablecoins, tokenization, and payments. This is accompanied by an extension until October 31 of its zero-fee transaction campaign for USDC, USD1, and U, which covers withdrawals, transfers, and operations via bridges. According to the network itself, the initiative has already covered more than $4.5 million in fees—an approach aimed at reducing friction to move liquidity toward BNB Chain.

1
168
·
--
Bullish
#NFPWatch
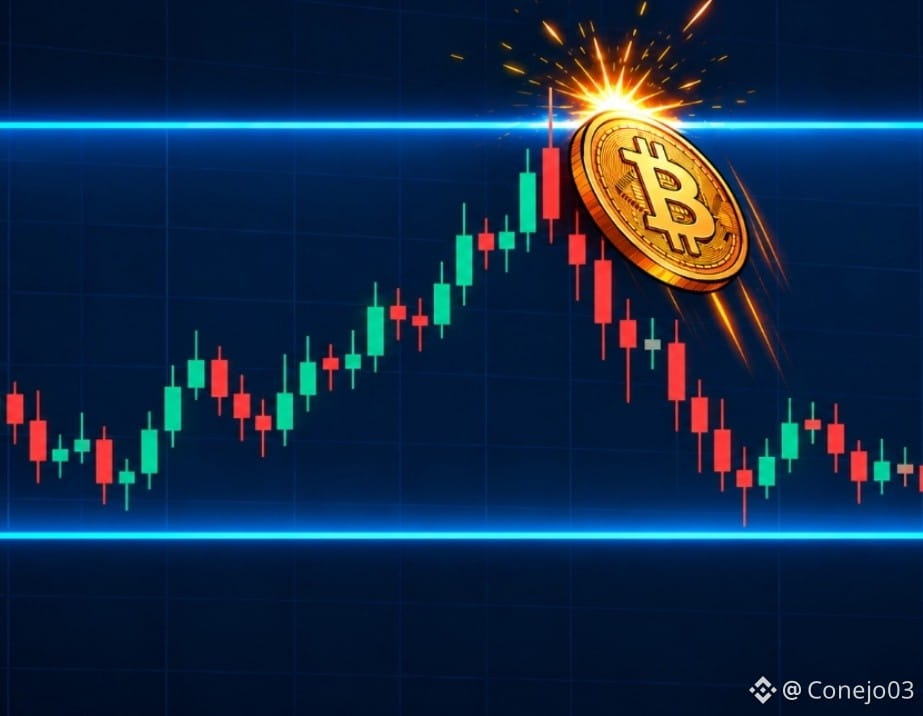
$BTC failure at the break and returns to the inside of the range.
{future}(BTCUSDT)
@bitcoin it reaches the end of the week, staying within the new balance we have been following over the last sessions. Although during today’s session there was an attempt to leave this structure on the upside, the move was not able to hold and price quickly returned to the value area.#BTC🔥🔥🔥🔥🔥
#Bitcoin❗ The advance again found difficulties within the daily FVG marked in purple, an area we pointed out for the first time in the analysis of September 21 and that we have been following since then as a possible reaction region. For now, this area continues to limit attempts at expanding toward higher prices.
$BTC From auction theory, the behavior is interesting. The market explored again above the balance, but it did not manage to develop acceptance at those prices. Instead of staying there and starting to build volume, it quickly returned back into the structure. This reinforces, at least for now, the idea of balance: the attempt to seek higher prices did not find enough interest to establish a new value zone.
The pullback led Bitcoin again toward the POC region of this balance, located around $84,000, where the drop began to lose intensity. This makes sense from auction logic, since the POC precisely represents the zone where the most trading has concentrated within this structure and where price can return when an exploration of the extremes fails.
Above price, we also continue to watch the 4-hour iFVG delimited by the white lines. This region has generated numerous reactions during the last sessions and continues to work as an important reference within the range. A sustained recovery from this zone would be necessary before attempting to test the upside again.$BTC
#NFPWatch
$BTC failure at the break and returns to the inside of the range.
@Bitcoin it reaches the end of the week, staying within the new balance we have been following over the last sessions. Although during today’s session there was an attempt to leave this structure on the upside, the move was not able to hold and price quickly returned to the value area.#BTC🔥🔥🔥🔥🔥
#Bitcoin❗ The advance again found difficulties within the daily FVG marked in purple, an area we pointed out for the first time in the analysis of September 21 and that we have been following since then as a possible reaction region. For now, this area continues to limit attempts at expanding toward higher prices.
$BTC From auction theory, the behavior is interesting. The market explored again above the balance, but it did not manage to develop acceptance at those prices. Instead of staying there and starting to build volume, it quickly returned back into the structure. This reinforces, at least for now, the idea of balance: the attempt to seek higher prices did not find enough interest to establish a new value zone.
The pullback led Bitcoin again toward the POC region of this balance, located around $84,000, where the drop began to lose intensity. This makes sense from auction logic, since the POC precisely represents the zone where the most trading has concentrated within this structure and where price can return when an exploration of the extremes fails.
Above price, we also continue to watch the 4-hour iFVG delimited by the white lines. This region has generated numerous reactions during the last sessions and continues to work as an important reference within the range. A sustained recovery from this zone would be necessary before attempting to test the upside again.$BTC
$BTC failure at the break and returns to the inside of the range.
@Bitcoin it reaches the end of the week, staying within the new balance we have been following over the last sessions. Although during today’s session there was an attempt to leave this structure on the upside, the move was not able to hold and price quickly returned to the value area.#BTC🔥🔥🔥🔥🔥
#Bitcoin❗ The advance again found difficulties within the daily FVG marked in purple, an area we pointed out for the first time in the analysis of September 21 and that we have been following since then as a possible reaction region. For now, this area continues to limit attempts at expanding toward higher prices.
$BTC From auction theory, the behavior is interesting. The market explored again above the balance, but it did not manage to develop acceptance at those prices. Instead of staying there and starting to build volume, it quickly returned back into the structure. This reinforces, at least for now, the idea of balance: the attempt to seek higher prices did not find enough interest to establish a new value zone.
The pullback led Bitcoin again toward the POC region of this balance, located around $84,000, where the drop began to lose intensity. This makes sense from auction logic, since the POC precisely represents the zone where the most trading has concentrated within this structure and where price can return when an exploration of the extremes fails.
Above price, we also continue to watch the 4-hour iFVG delimited by the white lines. This region has generated numerous reactions during the last sessions and continues to work as an important reference within the range. A sustained recovery from this zone would be necessary before attempting to test the upside again.$BTC
299
·
--
Bullish
#AltcoinSeasonIndexHoldsAbove60For5Days $BTC maintains the new balance and respects the lower zone.
{future}(BTCUSDT)
@bitcoin arrives at today’s session without major changes compared to what we’ve seen over the last few days. After the bullish breakout from the previous balance, the price lost momentum and began to develop a new trading zone above that structure.$BTC
#Bitcoin❗ In the daily chart, the new range we were anticipating is already quite clearly visible. Bitcoin stopped moving in a directional way and started trading repeatedly within the same region.
#BTC🔥🔥🔥🔥🔥
From auction theory, this behavior indicates that the market is trying to find a new equilibrium at higher prices. The area between the white lines—where there is a low-volume node (LVN)—continues to be an important reference: whenever price tests that region, rejection toward lower levels appears and it then reacts upward again.
More than considering it a traditional support, the key point is that, so far, the market is not showing acceptance below that LVN.
#BTC☀
As long as this dynamic continues, the new balance will remain valid. On the other hand, sustained presence and volume development below this zone would be the first sign that the auction begins to look for lower prices.
#AltcoinSeasonIndexHoldsAbove60For5Days $BTC maintains the new balance and respects the lower zone.
@Bitcoin arrives at today’s session without major changes compared to what we’ve seen over the last few days. After the bullish breakout from the previous balance, the price lost momentum and began to develop a new trading zone above that structure.$BTC
#Bitcoin❗ In the daily chart, the new range we were anticipating is already quite clearly visible. Bitcoin stopped moving in a directional way and started trading repeatedly within the same region.
#BTC🔥🔥🔥🔥🔥
From auction theory, this behavior indicates that the market is trying to find a new equilibrium at higher prices. The area between the white lines—where there is a low-volume node (LVN)—continues to be an important reference: whenever price tests that region, rejection toward lower levels appears and it then reacts upward again.
More than considering it a traditional support, the key point is that, so far, the market is not showing acceptance below that LVN.
#BTC☀
As long as this dynamic continues, the new balance will remain valid. On the other hand, sustained presence and volume development below this zone would be the first sign that the auction begins to look for lower prices.
@Bitcoin arrives at today’s session without major changes compared to what we’ve seen over the last few days. After the bullish breakout from the previous balance, the price lost momentum and began to develop a new trading zone above that structure.$BTC
#Bitcoin❗ In the daily chart, the new range we were anticipating is already quite clearly visible. Bitcoin stopped moving in a directional way and started trading repeatedly within the same region.
#BTC🔥🔥🔥🔥🔥
From auction theory, this behavior indicates that the market is trying to find a new equilibrium at higher prices. The area between the white lines—where there is a low-volume node (LVN)—continues to be an important reference: whenever price tests that region, rejection toward lower levels appears and it then reacts upward again.
More than considering it a traditional support, the key point is that, so far, the market is not showing acceptance below that LVN.
#BTC☀
As long as this dynamic continues, the new balance will remain valid. On the other hand, sustained presence and volume development below this zone would be the first sign that the auction begins to look for lower prices.

93
·
--
Bullish
#AltcoinSeasonIndexHoldsAbove60For5Days $HYPE exhausted short liquidity and now drops down the ladder of longs.
{future}(HYPEUSDT)
#Hyperliquid closed September as one of the strongest assets of the year, with more than a 260% cumulative gain so far this year. But the recent run had two very different halves, and the liquidation map allows you to read both using the same framework.$HYPE
#hype The first was a 70.71% rise in 35 days, which pushed the price to $98.05 on September 23, its all-time high and the day before its listing on Binance spot. The listing was finalized on the 24th at 11:00 UTC, with the HYPE/USDT, HYPE/USDC and HYPE/TRY pairs, under the Seed classification that the exchange reserves for highly volatile assets.
The second started from there. At the time of this analysis, the price is trading at $85.84.
#AltcoinSeasonIndexHoldsAbove60For5Days $HYPE exhausted short liquidity and now drops down the ladder of longs.
#Hyperliquid closed September as one of the strongest assets of the year, with more than a 260% cumulative gain so far this year. But the recent run had two very different halves, and the liquidation map allows you to read both using the same framework.$HYPE
#hype The first was a 70.71% rise in 35 days, which pushed the price to $98.05 on September 23, its all-time high and the day before its listing on Binance spot. The listing was finalized on the 24th at 11:00 UTC, with the HYPE/USDT, HYPE/USDC and HYPE/TRY pairs, under the Seed classification that the exchange reserves for highly volatile assets.
The second started from there. At the time of this analysis, the price is trading at $85.84.
#Hyperliquid closed September as one of the strongest assets of the year, with more than a 260% cumulative gain so far this year. But the recent run had two very different halves, and the liquidation map allows you to read both using the same framework.$HYPE
#hype The first was a 70.71% rise in 35 days, which pushed the price to $98.05 on September 23, its all-time high and the day before its listing on Binance spot. The listing was finalized on the 24th at 11:00 UTC, with the HYPE/USDT, HYPE/USDC and HYPE/TRY pairs, under the Seed classification that the exchange reserves for highly volatile assets.
The second started from there. At the time of this analysis, the price is trading at $85.84.

1
284
·
--
Bullish
#USADPAdds90000JobsInSeptember
@TRONDAO : the price of $TRX retreats strongly, and the market watches this support.
{future}(TRXUSDT)
#TRON✅ $TRX reaches the end of September with a still-solid bottom structure, backed by the growth of activity on TRON and its strong presence in the stablecoin market. However, the recent intraday push met resistance near $0.341 and gave way to a correction that once again puts a decisive technical area to the test over the next few hours.
In addition, several key fundamental developments continue to provide relevant signals for the ecosystem. Below is the analysis.
▫️#TRON. strengthens its activity while consolidating its dominance in stablecoins.
One of the main fundamental supports for TRX continues to be the activity of the network itself. On September 23, it was reported that the cumulative transaction volume processed by the blockchain exceeded $30 trillion, while the number of created accounts surpassed 405 million and the total number of operations exceeded 15 billion.
$TRX
Additionally, the network maintains more than $94 billion in USDT in circulation, one of the largest concentrations of this stablecoin on a single blockchain.
#USADPAdds90000JobsInSeptember
@TRON DAO : the price of $TRX retreats strongly, and the market watches this support.
#TRON✅ $TRX reaches the end of September with a still-solid bottom structure, backed by the growth of activity on TRON and its strong presence in the stablecoin market. However, the recent intraday push met resistance near $0.341 and gave way to a correction that once again puts a decisive technical area to the test over the next few hours.
In addition, several key fundamental developments continue to provide relevant signals for the ecosystem. Below is the analysis.
▫️#TRON. strengthens its activity while consolidating its dominance in stablecoins.
One of the main fundamental supports for TRX continues to be the activity of the network itself. On September 23, it was reported that the cumulative transaction volume processed by the blockchain exceeded $30 trillion, while the number of created accounts surpassed 405 million and the total number of operations exceeded 15 billion.
$TRX
Additionally, the network maintains more than $94 billion in USDT in circulation, one of the largest concentrations of this stablecoin on a single blockchain.
@TRON DAO : the price of $TRX retreats strongly, and the market watches this support.
#TRON✅ $TRX reaches the end of September with a still-solid bottom structure, backed by the growth of activity on TRON and its strong presence in the stablecoin market. However, the recent intraday push met resistance near $0.341 and gave way to a correction that once again puts a decisive technical area to the test over the next few hours.
In addition, several key fundamental developments continue to provide relevant signals for the ecosystem. Below is the analysis.
▫️#TRON. strengthens its activity while consolidating its dominance in stablecoins.
One of the main fundamental supports for TRX continues to be the activity of the network itself. On September 23, it was reported that the cumulative transaction volume processed by the blockchain exceeded $30 trillion, while the number of created accounts surpassed 405 million and the total number of operations exceeded 15 billion.
$TRX
Additionally, the network maintains more than $94 billion in USDT in circulation, one of the largest concentrations of this stablecoin on a single blockchain.

150
·
--
Bullish
#AltcoinSeasonIndexHoldsAbove60For5Days $BTC reacts to the PCE, but remains trapped in the range.
{spot}(BTCUSDT)
@bitcoin reaches the last day of September, staying within the new balance that began developing last week. After the strong bullish push that allowed it to break out of the previous range, the market continues trading in a higher zone, although it still hasn’t managed to achieve a new directional expansion.#BTC☀
#Bitcoin❗ During today’s session, there was an attempt to move toward the top of this structure, but again the purple-marked daily FVG produced rejection once more. At the time of writing this analysis, the daily candle shows a wide upper wick, indicating that the market explored higher prices but couldn’t hold them.$BTC
Below, the region defined by the white lines continues to work as an important reference. This zone lines up with a low volume node (LVN), and so far every approach has ended up finding buying response. From auction theory, the key point remains that the market is not showing acceptance below this region.
$BTC
The macro context also played a major role during the session. The United States PCE for August showed inflation lower than expected, easing some of the pressure on the Federal Reserve ahead of its next monetary policy decision. Bitcoin initially reacted to the upside after the data was released, but later it lost momentum and gave back the move, ultimately remaining within the same balance.#BTC🔥🔥🔥🔥🔥
#AltcoinSeasonIndexHoldsAbove60For5Days $BTC reacts to the PCE, but remains trapped in the range.
@Bitcoin reaches the last day of September, staying within the new balance that began developing last week. After the strong bullish push that allowed it to break out of the previous range, the market continues trading in a higher zone, although it still hasn’t managed to achieve a new directional expansion.#BTC☀
#Bitcoin❗ During today’s session, there was an attempt to move toward the top of this structure, but again the purple-marked daily FVG produced rejection once more. At the time of writing this analysis, the daily candle shows a wide upper wick, indicating that the market explored higher prices but couldn’t hold them.$BTC
Below, the region defined by the white lines continues to work as an important reference. This zone lines up with a low volume node (LVN), and so far every approach has ended up finding buying response. From auction theory, the key point remains that the market is not showing acceptance below this region.
$BTC
The macro context also played a major role during the session. The United States PCE for August showed inflation lower than expected, easing some of the pressure on the Federal Reserve ahead of its next monetary policy decision. Bitcoin initially reacted to the upside after the data was released, but later it lost momentum and gave back the move, ultimately remaining within the same balance.#BTC🔥🔥🔥🔥🔥
@Bitcoin reaches the last day of September, staying within the new balance that began developing last week. After the strong bullish push that allowed it to break out of the previous range, the market continues trading in a higher zone, although it still hasn’t managed to achieve a new directional expansion.#BTC☀
#Bitcoin❗ During today’s session, there was an attempt to move toward the top of this structure, but again the purple-marked daily FVG produced rejection once more. At the time of writing this analysis, the daily candle shows a wide upper wick, indicating that the market explored higher prices but couldn’t hold them.$BTC
Below, the region defined by the white lines continues to work as an important reference. This zone lines up with a low volume node (LVN), and so far every approach has ended up finding buying response. From auction theory, the key point remains that the market is not showing acceptance below this region.
$BTC
The macro context also played a major role during the session. The United States PCE for August showed inflation lower than expected, easing some of the pressure on the Federal Reserve ahead of its next monetary policy decision. Bitcoin initially reacted to the upside after the data was released, but later it lost momentum and gave back the move, ultimately remaining within the same balance.#BTC🔥🔥🔥🔥🔥
514
·
--
Bullish
Whales 🐋🐳🐋 of bitcoin resume accumulation at an accelerated pace.$BTC
{future}(BTCUSDT)
@bitcoin Large bitcoin wallets are again showing accumulation signals within the market. This new stage presents features distinct from the two previous phases recorded during the year. On this occasion, big investors are increasing their positions while the price stays near quarterly highs in the cryptocurrency.#BTC☀️
#Bitcoin❗ According to CryptoQuant, the group of addresses holding between 1,000 and 10,000 BTC recorded two major buying periods during 2026. The first wave took place between January and February, while the second occurred during June. In both cases, accumulation began amid significant price corrections.
$BTC
That behavior was not made up only of isolated inflows, but rather of extended periods of accumulation. The whales maintained purchases for several weeks as they progressively increased their positions. Now, the 30-day balance change metric has once again turned upward, as highlighted by the analysis.
#BTC🔥🔥🔥🔥🔥
In recent days, this group of whales accumulated more than 55,000 BTC in total. The main difference from the previous episodes lies in the current price zone, since bitcoin is not undergoing a strong correction, but instead trading near quarterly highs.$BTC
Whales 🐋🐳🐋 of bitcoin resume accumulation at an accelerated pace.$BTC
@Bitcoin Large bitcoin wallets are again showing accumulation signals within the market. This new stage presents features distinct from the two previous phases recorded during the year. On this occasion, big investors are increasing their positions while the price stays near quarterly highs in the cryptocurrency.#BTC☀️
#Bitcoin❗ According to CryptoQuant, the group of addresses holding between 1,000 and 10,000 BTC recorded two major buying periods during 2026. The first wave took place between January and February, while the second occurred during June. In both cases, accumulation began amid significant price corrections.
$BTC
That behavior was not made up only of isolated inflows, but rather of extended periods of accumulation. The whales maintained purchases for several weeks as they progressively increased their positions. Now, the 30-day balance change metric has once again turned upward, as highlighted by the analysis.
#BTC🔥🔥🔥🔥🔥
In recent days, this group of whales accumulated more than 55,000 BTC in total. The main difference from the previous episodes lies in the current price zone, since bitcoin is not undergoing a strong correction, but instead trading near quarterly highs.$BTC
@Bitcoin Large bitcoin wallets are again showing accumulation signals within the market. This new stage presents features distinct from the two previous phases recorded during the year. On this occasion, big investors are increasing their positions while the price stays near quarterly highs in the cryptocurrency.#BTC☀️
#Bitcoin❗ According to CryptoQuant, the group of addresses holding between 1,000 and 10,000 BTC recorded two major buying periods during 2026. The first wave took place between January and February, while the second occurred during June. In both cases, accumulation began amid significant price corrections.
$BTC
That behavior was not made up only of isolated inflows, but rather of extended periods of accumulation. The whales maintained purchases for several weeks as they progressively increased their positions. Now, the 30-day balance change metric has once again turned upward, as highlighted by the analysis.
#BTC🔥🔥🔥🔥🔥
In recent days, this group of whales accumulated more than 55,000 BTC in total. The main difference from the previous episodes lies in the current price zone, since bitcoin is not undergoing a strong correction, but instead trading near quarterly highs.$BTC

114
·
--
Bullish
#EarningsSeason
$LINK surpasses 2026 highs driven by major developments.
{future}(LINKUSDT)
#BitwiseLaunchesFirstSpotNEARETF
LINK's price, Chainlink's cryptocurrency, reached new 2026 highs after breaking above $14.40 and hitting as high as $15.80 during the session. Although the asset is still far from its all-time high, the recovery recorded over the past month has been significant.
At the time of writing this analysis, LINK is trading around $15.20, with daily gains of 11%, weekly gains of 17.9%, and monthly gains of 33.3%. Below, we analyze what's behind this strong surge and the main levels highlighted by the charts.
▫️Why is LINK's price rising strongly?
$LINK
The rally in LINK coincides with the launch of CCIP 2.0, the new version of its Cross-Chain Interoperability Protocol. This update gives institutions and token issuers the ability to define additional verifiers between chains, set certain rules for transactions, and configure settlement options.
The update includes new security tools, faster settlements, and compliance controls related to KYC and AML. This allows banks and issuers of tokenized assets to transfer value across different blockchains using more customizable security and control rules.
However, one of the main new features is the ability to add Cross-Chain Verifiers (CCV), which act as an additional security layer on top of the CCIP infrastructure responsible for validating messages between different networks. In this way, institutions can require additional verifications before accepting an operation between blockchains, even using their own systems or external providers.$LINK
#EarningsSeason
$LINK surpasses 2026 highs driven by major developments.
#BitwiseLaunchesFirstSpotNEARETF
LINK's price, Chainlink's cryptocurrency, reached new 2026 highs after breaking above $14.40 and hitting as high as $15.80 during the session. Although the asset is still far from its all-time high, the recovery recorded over the past month has been significant.
At the time of writing this analysis, LINK is trading around $15.20, with daily gains of 11%, weekly gains of 17.9%, and monthly gains of 33.3%. Below, we analyze what's behind this strong surge and the main levels highlighted by the charts.
▫️Why is LINK's price rising strongly?
$LINK
The rally in LINK coincides with the launch of CCIP 2.0, the new version of its Cross-Chain Interoperability Protocol. This update gives institutions and token issuers the ability to define additional verifiers between chains, set certain rules for transactions, and configure settlement options.
The update includes new security tools, faster settlements, and compliance controls related to KYC and AML. This allows banks and issuers of tokenized assets to transfer value across different blockchains using more customizable security and control rules.
However, one of the main new features is the ability to add Cross-Chain Verifiers (CCV), which act as an additional security layer on top of the CCIP infrastructure responsible for validating messages between different networks. In this way, institutions can require additional verifications before accepting an operation between blockchains, even using their own systems or external providers.$LINK
$LINK surpasses 2026 highs driven by major developments.
#BitwiseLaunchesFirstSpotNEARETF
LINK's price, Chainlink's cryptocurrency, reached new 2026 highs after breaking above $14.40 and hitting as high as $15.80 during the session. Although the asset is still far from its all-time high, the recovery recorded over the past month has been significant.
At the time of writing this analysis, LINK is trading around $15.20, with daily gains of 11%, weekly gains of 17.9%, and monthly gains of 33.3%. Below, we analyze what's behind this strong surge and the main levels highlighted by the charts.
▫️Why is LINK's price rising strongly?
$LINK
The rally in LINK coincides with the launch of CCIP 2.0, the new version of its Cross-Chain Interoperability Protocol. This update gives institutions and token issuers the ability to define additional verifiers between chains, set certain rules for transactions, and configure settlement options.
The update includes new security tools, faster settlements, and compliance controls related to KYC and AML. This allows banks and issuers of tokenized assets to transfer value across different blockchains using more customizable security and control rules.
However, one of the main new features is the ability to add Cross-Chain Verifiers (CCV), which act as an additional security layer on top of the CCIP infrastructure responsible for validating messages between different networks. In this way, institutions can require additional verifications before accepting an operation between blockchains, even using their own systems or external providers.$LINK

430
·
--
Bullish
#EarningsSeason
The Aave protocol enables deposits of $USDC and $USDT in its mobile app.$AAVE
{future}(AAVEUSDT)
The decentralized finance (DeFi) protocol Aave announced the integration of USDC and USDT deposits from Ethereum into its mobile app. The update represents a new step forward in the platform’s strategy to make it easier for users to access its financial ecosystem.
{future}(USDCUSDT)
The update was shared by Aave via the social network X. With this new feature, users can deposit both stablecoins from Ethereum directly through the mobile app, reducing some of the steps needed to interact with the protocol from a phone.
#AaveProtocol
The addition of stablecoin deposits is an important move toward the app’s expansion. USDC and USDT are among the most widely used assets within the DeFi ecosystem and play a key role in Aave’s lending and liquidity markets.
@USDC
Basically, the tool responds to the growing demand for simpler ways to trade with stablecoins from mobile devices. Its adoption over the coming weeks will help assess the extent to which a more accessible experience can increase user activity within the Aave ecosystem.
#EarningsSeason
The Aave protocol enables deposits of $USDC and $USDT in its mobile app.$AAVE
The decentralized finance (DeFi) protocol Aave announced the integration of USDC and USDT deposits from Ethereum into its mobile app. The update represents a new step forward in the platform’s strategy to make it easier for users to access its financial ecosystem.
The update was shared by Aave via the social network X. With this new feature, users can deposit both stablecoins from Ethereum directly through the mobile app, reducing some of the steps needed to interact with the protocol from a phone.
#AaveProtocol
The addition of stablecoin deposits is an important move toward the app’s expansion. USDC and USDT are among the most widely used assets within the DeFi ecosystem and play a key role in Aave’s lending and liquidity markets.
@USDC
Basically, the tool responds to the growing demand for simpler ways to trade with stablecoins from mobile devices. Its adoption over the coming weeks will help assess the extent to which a more accessible experience can increase user activity within the Aave ecosystem.
The Aave protocol enables deposits of $USDC and $USDT in its mobile app.$AAVE
The decentralized finance (DeFi) protocol Aave announced the integration of USDC and USDT deposits from Ethereum into its mobile app. The update represents a new step forward in the platform’s strategy to make it easier for users to access its financial ecosystem.
The update was shared by Aave via the social network X. With this new feature, users can deposit both stablecoins from Ethereum directly through the mobile app, reducing some of the steps needed to interact with the protocol from a phone.
#AaveProtocol
The addition of stablecoin deposits is an important move toward the app’s expansion. USDC and USDT are among the most widely used assets within the DeFi ecosystem and play a key role in Aave’s lending and liquidity markets.
@USDC
Basically, the tool responds to the growing demand for simpler ways to trade with stablecoins from mobile devices. Its adoption over the coming weeks will help assess the extent to which a more accessible experience can increase user activity within the Aave ecosystem.

161
·
--
Bullish
#UKFCAWinsCourtOrderToRecover851400Pounds What’s next for bitcoin amid its best ETF week of 2026?.$BTC
{future}(BTCUSDT)
@bitcoin left behind a large number of bearish positions over the past week after rising to the $87,000 zone. The strong move triggered a major wave of liquidations of short positions, especially during Monday, September 21, when the bullish acceleration caught a good part of the market off guard.#BTC☀
#Bitcoin❗ Now, the big question we’re trying to answer in this analysis is whether bitcoin can extend the gains over the coming week, or if the level it recently reached will end up acting as a short-term ceiling. For now, the asset is trading around $85,000, with daily gains of 1%, weekly gains of 5.7%, and monthly gains of 6.8%.
$BTC
The price is trying to hold onto the recovery as Michael Saylor hints again at a possible new bitcoin purchase by Strategy.
▫️What’s behind bitcoin’s current levels? Will there be more upside or will it correct?.$BTC
Bitcoin’s price surged last week with strong institutional demand. Spot bitcoin ETFs in the United States recorded net inflows of nearly $2.4 billion over the week—its best result of 2026 and the largest weekly flow since October 2025. This renewed interest helped the asset break through several resistances that had limited the price during the first weeks of September.
#BTC☀
On the other hand, the pullback in oil and U.S. Treasury yields during part of the week favored risk assets. A sharp rise in energy prices can fuel inflation expectations and increase pressure on interest rates. For this reason, the easing in crude contributed to temporarily improving appetite for assets like bitcoin.
#UKFCAWinsCourtOrderToRecover851400Pounds What’s next for bitcoin amid its best ETF week of 2026?.$BTC
@Bitcoin left behind a large number of bearish positions over the past week after rising to the $87,000 zone. The strong move triggered a major wave of liquidations of short positions, especially during Monday, September 21, when the bullish acceleration caught a good part of the market off guard.#BTC☀
#Bitcoin❗ Now, the big question we’re trying to answer in this analysis is whether bitcoin can extend the gains over the coming week, or if the level it recently reached will end up acting as a short-term ceiling. For now, the asset is trading around $85,000, with daily gains of 1%, weekly gains of 5.7%, and monthly gains of 6.8%.
$BTC
The price is trying to hold onto the recovery as Michael Saylor hints again at a possible new bitcoin purchase by Strategy.
▫️What’s behind bitcoin’s current levels? Will there be more upside or will it correct?.$BTC
Bitcoin’s price surged last week with strong institutional demand. Spot bitcoin ETFs in the United States recorded net inflows of nearly $2.4 billion over the week—its best result of 2026 and the largest weekly flow since October 2025. This renewed interest helped the asset break through several resistances that had limited the price during the first weeks of September.
#BTC☀
On the other hand, the pullback in oil and U.S. Treasury yields during part of the week favored risk assets. A sharp rise in energy prices can fuel inflation expectations and increase pressure on interest rates. For this reason, the easing in crude contributed to temporarily improving appetite for assets like bitcoin.
@Bitcoin left behind a large number of bearish positions over the past week after rising to the $87,000 zone. The strong move triggered a major wave of liquidations of short positions, especially during Monday, September 21, when the bullish acceleration caught a good part of the market off guard.#BTC☀
#Bitcoin❗ Now, the big question we’re trying to answer in this analysis is whether bitcoin can extend the gains over the coming week, or if the level it recently reached will end up acting as a short-term ceiling. For now, the asset is trading around $85,000, with daily gains of 1%, weekly gains of 5.7%, and monthly gains of 6.8%.
$BTC
The price is trying to hold onto the recovery as Michael Saylor hints again at a possible new bitcoin purchase by Strategy.
▫️What’s behind bitcoin’s current levels? Will there be more upside or will it correct?.$BTC
Bitcoin’s price surged last week with strong institutional demand. Spot bitcoin ETFs in the United States recorded net inflows of nearly $2.4 billion over the week—its best result of 2026 and the largest weekly flow since October 2025. This renewed interest helped the asset break through several resistances that had limited the price during the first weeks of September.
#BTC☀
On the other hand, the pullback in oil and U.S. Treasury yields during part of the week favored risk assets. A sharp rise in energy prices can fuel inflation expectations and increase pressure on interest rates. For this reason, the easing in crude contributed to temporarily improving appetite for assets like bitcoin.

300
·
--
Bullish
#UKFCAWinsCourtOrderToRecover851400Pounds Zcash retreats from all-time highs as institutional interest in the asset grows.$ZEC
{future}(ZECUSDT)
#zcash undergoes a correction after setting a new all-time high at $1.693. However, the pullback occurs while the project accumulates relevant progress in institutional adoption, privacy, and infrastructure development, leaving the price facing a technical zone that could determine its next move. Below is the analysis.
▫️Zcash gains institutional ground as its infrastructure advances.
$ZEC
Zcash received a new boost this week from the institutional front. On September 22, 21Shares launched a ZEC ETP on Euronext Paris and Amsterdam, expanding access to the asset through traditional markets. This was followed by a filing from Grayscale with the SEC for a ZCSH High Income ETF—a proposal that would use options on products tied to ZEC to generate income.
#UKFCAWinsCourtOrderToRecover851400Pounds Zcash retreats from all-time highs as institutional interest in the asset grows.$ZEC
#zcash undergoes a correction after setting a new all-time high at $1.693. However, the pullback occurs while the project accumulates relevant progress in institutional adoption, privacy, and infrastructure development, leaving the price facing a technical zone that could determine its next move. Below is the analysis.
▫️Zcash gains institutional ground as its infrastructure advances.
$ZEC
Zcash received a new boost this week from the institutional front. On September 22, 21Shares launched a ZEC ETP on Euronext Paris and Amsterdam, expanding access to the asset through traditional markets. This was followed by a filing from Grayscale with the SEC for a ZCSH High Income ETF—a proposal that would use options on products tied to ZEC to generate income.
#zcash undergoes a correction after setting a new all-time high at $1.693. However, the pullback occurs while the project accumulates relevant progress in institutional adoption, privacy, and infrastructure development, leaving the price facing a technical zone that could determine its next move. Below is the analysis.
▫️Zcash gains institutional ground as its infrastructure advances.
$ZEC
Zcash received a new boost this week from the institutional front. On September 22, 21Shares launched a ZEC ETP on Euronext Paris and Amsterdam, expanding access to the asset through traditional markets. This was followed by a filing from Grayscale with the SEC for a ZCSH High Income ETF—a proposal that would use options on products tied to ZEC to generate income.

375
·
--
Bullish
#BitwiseFilesFinalNEARSpotETFProspectus
#WOTD🔥 $USDC
{future}(USDCUSDT)
New week ... New topic... Come on, let's guess the daily words 👇
[Pulsa Aquí y Participa 👍](https://www.binance.com/activity/word-of-the-day/IPOs-Are-Moving-On-Chain?ref=CPA_001FM9SV6M) for the prize pool of 10.000 $USDC a to distribute 👍
#BitwiseFilesFinalNEARSpotETFProspectus
#WOTD🔥 $USDC
New week ... New topic... Come on, let's guess the daily words 👇
Pulsa Aquí y Participa 👍 for the prize pool of 10.000 $USDC a to distribute 👍
#WOTD🔥 $USDC
New week ... New topic... Come on, let's guess the daily words 👇
Pulsa Aquí y Participa 👍 for the prize pool of 10.000 $USDC a to distribute 👍

23
·
--
Bullish
#QNTRises39%
$BTC consolidate the break and form a new balance.
@bitcoin For today’s session, there are no major changes compared to the analysis of the past few days. Bitcoin continues trading above the balance that dominated the market for about a month, though after the strong bullish move it lost momentum upon reaching the daily iFVG marked in purple.
{future}(BTCUSDT)
#BTC🔥🔥🔥🔥🔥
If we look at the most recent daily candles, the behavior is starting to look different from the initial break. First, we saw a very aggressive expansion out of the old balance, but the following sessions have shown less displacement and more trading within the same price zones.
$BTC
From the auction theory standpoint, this can be interpreted as a transition from a phase of imbalance to another where buyers and sellers begin negotiating again in both directions.
That’s why, for the next few sessions, one possibility is that bitcoin starts building a new balance between the upper daily iFVG and the region defined by the white lines, where there is a low-volume node (LVN). For now, it’s still too early to consider that range fully established, but the latest sessions are starting to show characteristics consistent with a consolidation phase.
#Bitcoin❗
The most important thing is that the market continues to develop volume above the old balance. This is relevant from the auction theory perspective, because a break gains more validity when price not only explores higher levels, but also manages to stay there and begin building a new area of value. In other words, the market is trying to determine whether these higher prices can turn into a new region of acceptance.$BTC
#QNTRises39%
$BTC consolidate the break and form a new balance.
@Bitcoin For today’s session, there are no major changes compared to the analysis of the past few days. Bitcoin continues trading above the balance that dominated the market for about a month, though after the strong bullish move it lost momentum upon reaching the daily iFVG marked in purple.
#BTC🔥🔥🔥🔥🔥
If we look at the most recent daily candles, the behavior is starting to look different from the initial break. First, we saw a very aggressive expansion out of the old balance, but the following sessions have shown less displacement and more trading within the same price zones.
$BTC
From the auction theory standpoint, this can be interpreted as a transition from a phase of imbalance to another where buyers and sellers begin negotiating again in both directions.
That’s why, for the next few sessions, one possibility is that bitcoin starts building a new balance between the upper daily iFVG and the region defined by the white lines, where there is a low-volume node (LVN). For now, it’s still too early to consider that range fully established, but the latest sessions are starting to show characteristics consistent with a consolidation phase.
#Bitcoin❗
The most important thing is that the market continues to develop volume above the old balance. This is relevant from the auction theory perspective, because a break gains more validity when price not only explores higher levels, but also manages to stay there and begin building a new area of value. In other words, the market is trying to determine whether these higher prices can turn into a new region of acceptance.$BTC
$BTC consolidate the break and form a new balance.
@Bitcoin For today’s session, there are no major changes compared to the analysis of the past few days. Bitcoin continues trading above the balance that dominated the market for about a month, though after the strong bullish move it lost momentum upon reaching the daily iFVG marked in purple.
#BTC🔥🔥🔥🔥🔥
If we look at the most recent daily candles, the behavior is starting to look different from the initial break. First, we saw a very aggressive expansion out of the old balance, but the following sessions have shown less displacement and more trading within the same price zones.
$BTC
From the auction theory standpoint, this can be interpreted as a transition from a phase of imbalance to another where buyers and sellers begin negotiating again in both directions.
That’s why, for the next few sessions, one possibility is that bitcoin starts building a new balance between the upper daily iFVG and the region defined by the white lines, where there is a low-volume node (LVN). For now, it’s still too early to consider that range fully established, but the latest sessions are starting to show characteristics consistent with a consolidation phase.
#Bitcoin❗
The most important thing is that the market continues to develop volume above the old balance. This is relevant from the auction theory perspective, because a break gains more validity when price not only explores higher levels, but also manages to stay there and begin building a new area of value. In other words, the market is trying to determine whether these higher prices can turn into a new region of acceptance.$BTC

118
·
--
Bullish
#QNTRises39%
Bitcoin year-end projections split analysts between optimism and caution.$BTC
@bitcoin The debate over the price of Bitcoin for the close of 2026 takes on greater relevance following the release of new market projections. Starting from a reference quote near $84,000, various analysts assess the asset’s potential for growth over the coming months. The estimates range from increases of 13% to almost 49%.$BTC
{future}(BTCUSDT)
Globally recognized investment firms such as Bernstein project a markedly bullish scenario for the leading cryptocurrency. Entrepreneur Arthur Hayes shares this outlook, setting his target at $125,000. Together, these estimates would represent a 48.8% rise from current trading levels.
#BTC🔥🔥🔥🔥🔥
Meanwhile, Sean Farrell from Fundstrat maintains an intermediate projection placing the digital asset at $115,000. This move would imply a 36.9% advance from the price used as a reference. This outlook would require demand and capital inflows to remain strong during the final quarter of the year.
In a more moderate stance, Standard Chartered forecasts a price of $100,000—equivalent to a gain of roughly 19%. At the same time, the editorial projection from CriptoTendencia sets its target at $95,000, which would represent an advance of 13.1%. This figure is the most cautious forecast among those analyzed.$BTC
#QNTRises39%
Bitcoin year-end projections split analysts between optimism and caution.$BTC
@Bitcoin The debate over the price of Bitcoin for the close of 2026 takes on greater relevance following the release of new market projections. Starting from a reference quote near $84,000, various analysts assess the asset’s potential for growth over the coming months. The estimates range from increases of 13% to almost 49%.$BTC
Globally recognized investment firms such as Bernstein project a markedly bullish scenario for the leading cryptocurrency. Entrepreneur Arthur Hayes shares this outlook, setting his target at $125,000. Together, these estimates would represent a 48.8% rise from current trading levels.
#BTC🔥🔥🔥🔥🔥
Meanwhile, Sean Farrell from Fundstrat maintains an intermediate projection placing the digital asset at $115,000. This move would imply a 36.9% advance from the price used as a reference. This outlook would require demand and capital inflows to remain strong during the final quarter of the year.
In a more moderate stance, Standard Chartered forecasts a price of $100,000—equivalent to a gain of roughly 19%. At the same time, the editorial projection from CriptoTendencia sets its target at $95,000, which would represent an advance of 13.1%. This figure is the most cautious forecast among those analyzed.$BTC
Bitcoin year-end projections split analysts between optimism and caution.$BTC
@Bitcoin The debate over the price of Bitcoin for the close of 2026 takes on greater relevance following the release of new market projections. Starting from a reference quote near $84,000, various analysts assess the asset’s potential for growth over the coming months. The estimates range from increases of 13% to almost 49%.$BTC
Globally recognized investment firms such as Bernstein project a markedly bullish scenario for the leading cryptocurrency. Entrepreneur Arthur Hayes shares this outlook, setting his target at $125,000. Together, these estimates would represent a 48.8% rise from current trading levels.
#BTC🔥🔥🔥🔥🔥
Meanwhile, Sean Farrell from Fundstrat maintains an intermediate projection placing the digital asset at $115,000. This move would imply a 36.9% advance from the price used as a reference. This outlook would require demand and capital inflows to remain strong during the final quarter of the year.
In a more moderate stance, Standard Chartered forecasts a price of $100,000—equivalent to a gain of roughly 19%. At the same time, the editorial projection from CriptoTendencia sets its target at $95,000, which would represent an advance of 13.1%. This figure is the most cautious forecast among those analyzed.$BTC

476
·
--
Bullish
#QNTRises39% $BTC
{future}(BTCUSDT)
What is the dominance of @bitcoin ?
#BTC☀
Bitcoin has remained the largest cryptocurrency by market capitalization since its creation.
#Bitcoin❗
As the crypto market grew to include thousands of assets, market participants developed ways to measure the relative weight of #Bitcoin❗ .
The dominance of @bitcoin , or dominance of $BTC , is one such measure: it is the ratio between Bitcoin's market capitalization and the total market capitalization of all cryptocurrencies combined.
#QNTRises39% $BTC
What is the dominance of @Bitcoin ?
#BTC☀
Bitcoin has remained the largest cryptocurrency by market capitalization since its creation.
#Bitcoin❗
As the crypto market grew to include thousands of assets, market participants developed ways to measure the relative weight of #Bitcoin❗ .
The dominance of @Bitcoin , or dominance of $BTC , is one such measure: it is the ratio between Bitcoin's market capitalization and the total market capitalization of all cryptocurrencies combined.
What is the dominance of @Bitcoin ?
#BTC☀
Bitcoin has remained the largest cryptocurrency by market capitalization since its creation.
#Bitcoin❗
As the crypto market grew to include thousands of assets, market participants developed ways to measure the relative weight of #Bitcoin❗ .
The dominance of @Bitcoin , or dominance of $BTC , is one such measure: it is the ratio between Bitcoin's market capitalization and the total market capitalization of all cryptocurrencies combined.
2
557
·
--
Bullish
#BinanceWillListHyperliquid(HYPE)
@bitcoin hey: $BTC loses momentum after the rise and moves sideways
{spot}(BTCUSDT)
@bitcoin After breaking the balance that Bitcoin had developed over the course of several weeks, the price managed to push strongly toward higher levels. However, for the time being it has not managed to break through the purple zone, corresponding to the daily FVG created at the end of January, which is acting as an important reaction area.
#BTC🔥🔥🔥🔥🔥
From there, BTC started a correction and found a response approximately between the two white lines marked on the chart. This area coincides with an LVN low-volume node within the profile, which indicates that there was little acceptance at those prices previously.$BTC
Therefore, it will be especially interesting to see whether the market rejects lower levels again from this region, or whether, on the contrary, it starts accepting prices below it and crosses the LVN more easily.$BTC
#BinanceWillListHyperliquid(HYPE)
@Bitcoin hey: $BTC loses momentum after the rise and moves sideways
@Bitcoin After breaking the balance that Bitcoin had developed over the course of several weeks, the price managed to push strongly toward higher levels. However, for the time being it has not managed to break through the purple zone, corresponding to the daily FVG created at the end of January, which is acting as an important reaction area.
#BTC🔥🔥🔥🔥🔥
From there, BTC started a correction and found a response approximately between the two white lines marked on the chart. This area coincides with an LVN low-volume node within the profile, which indicates that there was little acceptance at those prices previously.$BTC
Therefore, it will be especially interesting to see whether the market rejects lower levels again from this region, or whether, on the contrary, it starts accepting prices below it and crosses the LVN more easily.$BTC
@Bitcoin hey: $BTC loses momentum after the rise and moves sideways
@Bitcoin After breaking the balance that Bitcoin had developed over the course of several weeks, the price managed to push strongly toward higher levels. However, for the time being it has not managed to break through the purple zone, corresponding to the daily FVG created at the end of January, which is acting as an important reaction area.
#BTC🔥🔥🔥🔥🔥
From there, BTC started a correction and found a response approximately between the two white lines marked on the chart. This area coincides with an LVN low-volume node within the profile, which indicates that there was little acceptance at those prices previously.$BTC
Therefore, it will be especially interesting to see whether the market rejects lower levels again from this region, or whether, on the contrary, it starts accepting prices below it and crosses the LVN more easily.$BTC

129
Log in to explore more content
Join global crypto users on Binance Square
⚡️ Get latest and useful information about crypto.
💬 Trusted by the world’s largest crypto exchange.
👍 Discover real insights from verified creators.
Email / Phone number
Trending Topics
BinanceLaunchesBinanceIntelligence
447,969 views
3,222 Discussing
#BinanceLaunchesBinanceIntelligence
⚡ AI Meets Crypto Trading: Binance Intelligence is Live! ⚡
Trading just got a massive upgrade with Binance's new AI suite:
1️⃣ Binance AI: Personalized market dashboards & 4-hour macro market audio briefings.
2️⃣ Binance AI Pro: Build and run automated strategies using simple natural language prompts.
3️⃣ Binance Agent OS: Developer framework for autonomous financial AI agents.
Describe your strategy ➔ Paper test ➔ Execute 24/7.
Are you building your next trading strategy with AI? Drop your thoughts below! 👇
#BinanceLaunchesBinanceIntelligence #BinanceSquare #CryptoAI #Trading $EDEN
Hazi BNB
·2 Likes
·1k views
BitcoinTargets2026OpenAt$87570
3,009 views
83 Discussing
BitcoinRejectedAt$87KThirdTime
2,730 views
68 Discussing