
mohamed Abaker 12
94 Posts

mohamed Abaker 12
Report
Block User
Open Trade
Frequent Trader
3.4 Years
14 Following
27 Followers
48 Liked
Posts
Portfolio
📊 DEXE/USDT | Is the price preparing to rebound or continue falling?
🔴 Current technical outlook:
DEXE continues to trade under clear selling pressure, with the price at around 1.190 USDT, down 5.56% on the day.
An analysis of the 4-hour chart shows the downtrend continuing, with lower highs and lower lows, reflecting sellers’ control so far.
📉 Moving Averages:
- MA7: at 1.225
- MA25: at 1.248
- MA99: at 1.389
The price is trading below all moving averages, confirming the current weakness in the upward trend and suggesting that any rebound may face strong resistance.
🎯 Support and resistance levels:
🟢 Support levels:
- 1.176: Near-term support.
- 1.161: Key support and a previous low.
- A break below 1.161 could open the door to further declines.
🔴 Resistance levels:
- 1.225: First resistance.
- 1.248: Important resistance and the MA25.
- 1.272: Additional resistance zone.
- 1.389: Strong resistance associated with the MA99.
📈 Bullish Scenario:
If the price manages to hold the 1.161 zone and move back above 1.225, we may see an attempt to rise toward 1.248 and then 1.272.
A breakout above 1.272 and holding above it could give buyers a chance to gradually regain control.
📉 Bearish Scenario:
Continued trading below 1.225, along with increased selling pressure, could lead to a retest of 1.176.
A clear 4-hour close below 1.161 could further strengthen the ongoing downtrend.
📊 DEXE/USDT | Is the price preparing to rebound or continue falling?
🔴 Current technical outlook:
DEXE continues to trade under clear selling pressure, with the price at around 1.190 USDT, down 5.56% on the day.
An analysis of the 4-hour chart shows the downtrend continuing, with lower highs and lower lows, reflecting sellers’ control so far.
📉 Moving Averages:
- MA7: at 1.225
- MA25: at 1.248
- MA99: at 1.389
The price is trading below all moving averages, confirming the current weakness in the upward trend and suggesting that any rebound may face strong resistance.
🎯 Support and resistance levels:
🟢 Support levels:
- 1.176: Near-term support.
- 1.161: Key support and a previous low.
- A break below 1.161 could open the door to further declines.
🔴 Resistance levels:
- 1.225: First resistance.
- 1.248: Important resistance and the MA25.
- 1.272: Additional resistance zone.
- 1.389: Strong resistance associated with the MA99.
📈 Bullish Scenario:
If the price manages to hold the 1.161 zone and move back above 1.225, we may see an attempt to rise toward 1.248 and then 1.272.
A breakout above 1.272 and holding above it could give buyers a chance to gradually regain control.
📉 Bearish Scenario:
Continued trading below 1.225, along with increased selling pressure, could lead to a retest of 1.176.
A clear 4-hour close below 1.161 could further strengthen the ongoing downtrend.
🔴 Current technical outlook:
DEXE continues to trade under clear selling pressure, with the price at around 1.190 USDT, down 5.56% on the day.
An analysis of the 4-hour chart shows the downtrend continuing, with lower highs and lower lows, reflecting sellers’ control so far.
📉 Moving Averages:
- MA7: at 1.225
- MA25: at 1.248
- MA99: at 1.389
The price is trading below all moving averages, confirming the current weakness in the upward trend and suggesting that any rebound may face strong resistance.
🎯 Support and resistance levels:
🟢 Support levels:
- 1.176: Near-term support.
- 1.161: Key support and a previous low.
- A break below 1.161 could open the door to further declines.
🔴 Resistance levels:
- 1.225: First resistance.
- 1.248: Important resistance and the MA25.
- 1.272: Additional resistance zone.
- 1.389: Strong resistance associated with the MA99.
📈 Bullish Scenario:
If the price manages to hold the 1.161 zone and move back above 1.225, we may see an attempt to rise toward 1.248 and then 1.272.
A breakout above 1.272 and holding above it could give buyers a chance to gradually regain control.
📉 Bearish Scenario:
Continued trading below 1.225, along with increased selling pressure, could lead to a retest of 1.176.
A clear 4-hour close below 1.161 could further strengthen the ongoing downtrend.

1
328
See translation
🚀 SOXLUSDT | Recovery or Another Breakdown?
SOXL is approaching a critical technical zone!
After a massive decline from $109.15 to $38.81, the price managed to recover toward $66.24 before facing renewed selling pressure.
📊 Key Support Levels:
- $59.86
- $54.94
- $50.77
🎯 Key Resistance Levels:
- $63.80
- $66.24
- $69.80
- $75.00
📈 Bullish Scenario:
A confirmed breakout above $63.80 could open the door toward $66.24 and $69.80.
📉 Bearish Scenario:
A breakdown below $59.86 could expose the $54.94 and $50.77 support zones.
💡 My Outlook:
The recovery remains interesting, but the price needs stronger buying momentum and confirmation above resistance before a new bullish trend can be confirmed.
#CryptoTrading
🚀 SOXLUSDT | Recovery or Another Breakdown?
SOXL is approaching a critical technical zone!
After a massive decline from $109.15 to $38.81, the price managed to recover toward $66.24 before facing renewed selling pressure.
📊 Key Support Levels:
- $59.86
- $54.94
- $50.77
🎯 Key Resistance Levels:
- $63.80
- $66.24
- $69.80
- $75.00
📈 Bullish Scenario:
A confirmed breakout above $63.80 could open the door toward $66.24 and $69.80.
📉 Bearish Scenario:
A breakdown below $59.86 could expose the $54.94 and $50.77 support zones.
💡 My Outlook:
The recovery remains interesting, but the price needs stronger buying momentum and confirmation above resistance before a new bullish trend can be confirmed.
#CryptoTrading
SOXL is approaching a critical technical zone!
After a massive decline from $109.15 to $38.81, the price managed to recover toward $66.24 before facing renewed selling pressure.
📊 Key Support Levels:
- $59.86
- $54.94
- $50.77
🎯 Key Resistance Levels:
- $63.80
- $66.24
- $69.80
- $75.00
📈 Bullish Scenario:
A confirmed breakout above $63.80 could open the door toward $66.24 and $69.80.
📉 Bearish Scenario:
A breakdown below $59.86 could expose the $54.94 and $50.77 support zones.
💡 My Outlook:
The recovery remains interesting, but the price needs stronger buying momentum and confirmation above resistance before a new bullish trend can be confirmed.
#CryptoTrading
551
See translation
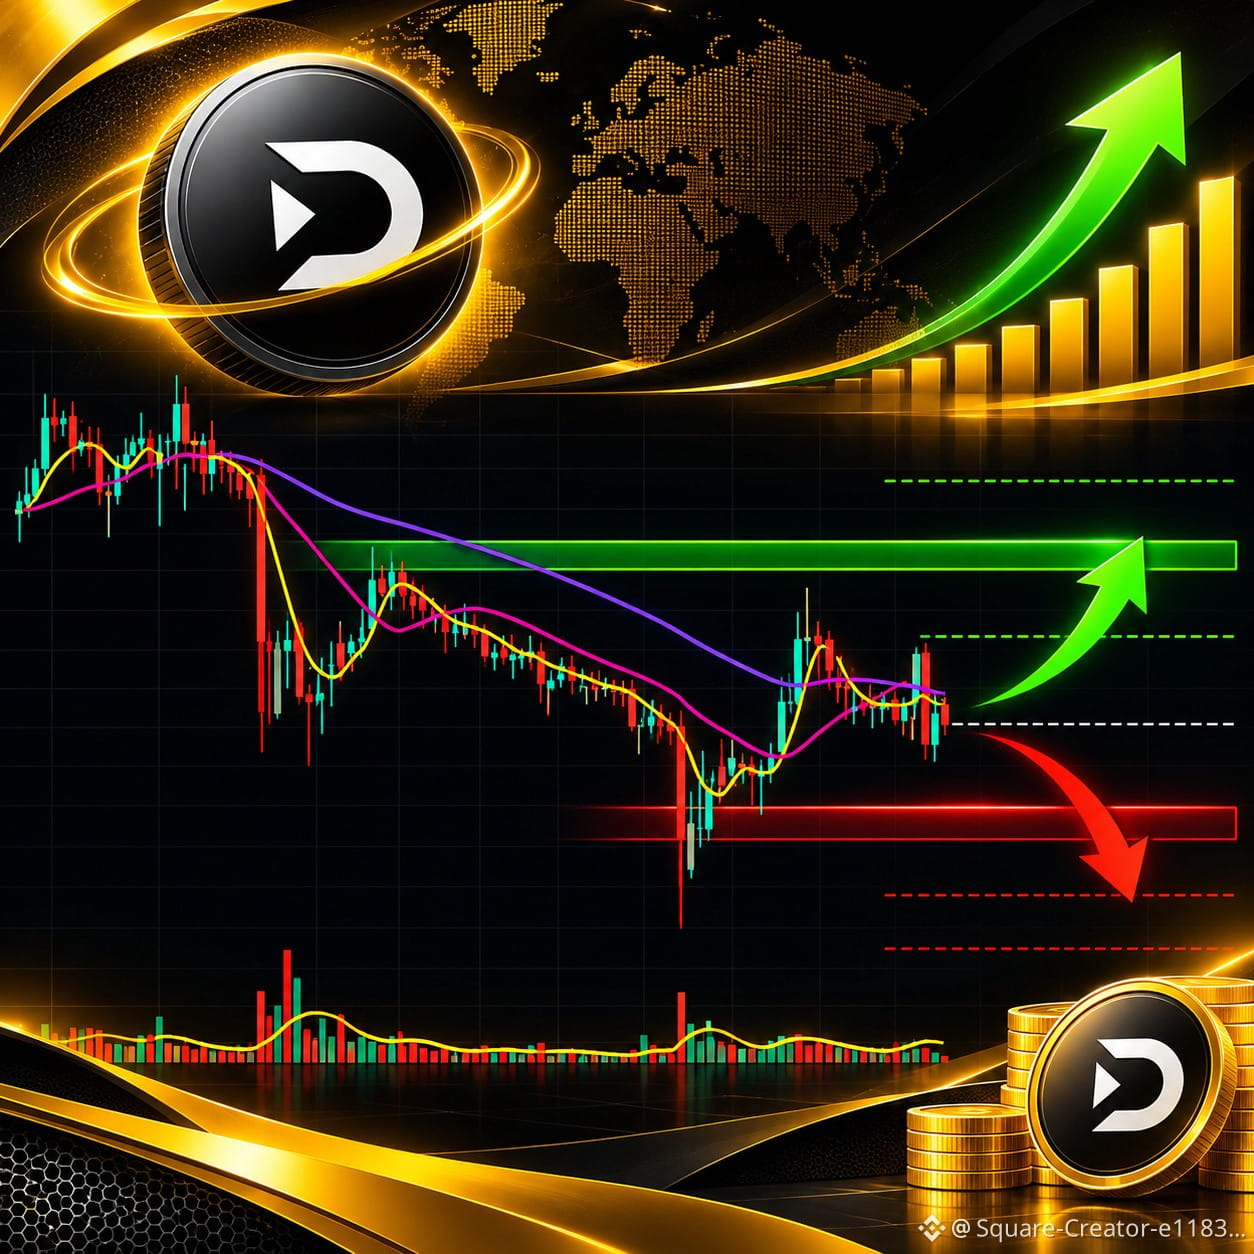
📊 DEXE/USDT – Technical Analysis | Binance
🔴 Current Market Situation
DEXE is currently trading around $1.254, down approximately 1.88%.
The chart shows continued bearish pressure after a recovery attempt from the $1.161 low. However, buyers are still struggling to regain control of the market.
📉 1. Trend Analysis
- MA(7): $1.265
- MA(25): $1.268
- MA(99): $1.271
The price is trading below all three moving averages, indicating that the short-term trend remains bearish.
📍 2. Key Support Levels
- $1.243 – Immediate support.
- $1.210 – Secondary support.
- $1.161 – Major historical low on this chart.
🚀 3. Key Resistance Levels
- $1.265 – First resistance.
- $1.273 – Important resistance zone.
- $1.296 – Next upside target.
- $1.335 – Stronger resistance.
📈 4. Possible Market Scenarios
Bullish Scenario 🟢
A strong breakout above $1.273 with increasing trading volume could open the door toward $1.296, followed by $1.335.
Bearish Scenario 🔴
A breakdown below $1.243 could increase selling pressure and push the price toward $1.210. A deeper correction could retest $1.161.
🎯 5. Trading Outlook
The market currently favors caution. Buyers need to reclaim the $1.273 resistance zone before a stronger bullish reversal can be considered.
My conclusion:
DEXE is at a critical technical zone. The next move will depend on whether buyers can defend support and break through nearby resistance.
📊 DEXE/USDT – Technical Analysis | Binance
🔴 Current Market Situation
DEXE is currently trading around $1.254, down approximately 1.88%.
The chart shows continued bearish pressure after a recovery attempt from the $1.161 low. However, buyers are still struggling to regain control of the market.
📉 1. Trend Analysis
- MA(7): $1.265
- MA(25): $1.268
- MA(99): $1.271
The price is trading below all three moving averages, indicating that the short-term trend remains bearish.
📍 2. Key Support Levels
- $1.243 – Immediate support.
- $1.210 – Secondary support.
- $1.161 – Major historical low on this chart.
🚀 3. Key Resistance Levels
- $1.265 – First resistance.
- $1.273 – Important resistance zone.
- $1.296 – Next upside target.
- $1.335 – Stronger resistance.
📈 4. Possible Market Scenarios
Bullish Scenario 🟢
A strong breakout above $1.273 with increasing trading volume could open the door toward $1.296, followed by $1.335.
Bearish Scenario 🔴
A breakdown below $1.243 could increase selling pressure and push the price toward $1.210. A deeper correction could retest $1.161.
🎯 5. Trading Outlook
The market currently favors caution. Buyers need to reclaim the $1.273 resistance zone before a stronger bullish reversal can be considered.
My conclusion:
DEXE is at a critical technical zone. The next move will depend on whether buyers can defend support and break through nearby resistance.
🔴 Current Market Situation
DEXE is currently trading around $1.254, down approximately 1.88%.
The chart shows continued bearish pressure after a recovery attempt from the $1.161 low. However, buyers are still struggling to regain control of the market.
📉 1. Trend Analysis
- MA(7): $1.265
- MA(25): $1.268
- MA(99): $1.271
The price is trading below all three moving averages, indicating that the short-term trend remains bearish.
📍 2. Key Support Levels
- $1.243 – Immediate support.
- $1.210 – Secondary support.
- $1.161 – Major historical low on this chart.
🚀 3. Key Resistance Levels
- $1.265 – First resistance.
- $1.273 – Important resistance zone.
- $1.296 – Next upside target.
- $1.335 – Stronger resistance.
📈 4. Possible Market Scenarios
Bullish Scenario 🟢
A strong breakout above $1.273 with increasing trading volume could open the door toward $1.296, followed by $1.335.
Bearish Scenario 🔴
A breakdown below $1.243 could increase selling pressure and push the price toward $1.210. A deeper correction could retest $1.161.
🎯 5. Trading Outlook
The market currently favors caution. Buyers need to reclaim the $1.273 resistance zone before a stronger bullish reversal can be considered.
My conclusion:
DEXE is at a critical technical zone. The next move will depend on whether buyers can defend support and break through nearby resistance.
658
See translation
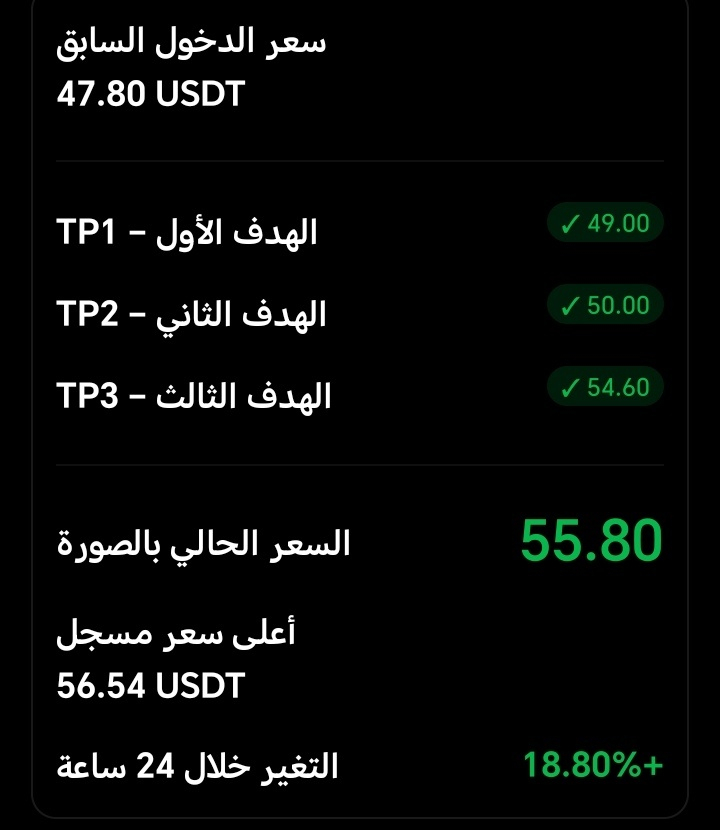
🚀🔥 SOXLUSDT – 100% OF OUR LONG$ TARGETS ACHIEVED!
Our previous technical analysis delivered exactly what the bullish scenario was looking for!
📍 Previous Entry: $47.80
🎯 ALL TARGETS HIT:
✅ TP1: $49.00
✅ TP2: $50.00
✅ TP3: $54.60
📊 Latest Market Update:
- Current Price: $55.80
- 24H High: $56.54
- 24H Change: +18.80%
🔥 What's Next?
SOXL has demonstrated strong bullish momentum, breaking above previous resistance levels with significant trading volume.
Key Levels to Watch:
- Support: $54.30 – $53.00
- Resistance: $56.54 – $57.77
- Next Potential Target: $60.00
🐂 The bullish scenario has successfully completed all three targets.
But the big question remains:
Can SOXL break $60, or are we approaching a profit-taking correction?
Congratulations to everyone who followed the bullish setup! 🎯$SOXLB
🚀🔥 SOXLUSDT – 100% OF OUR LONG$ TARGETS ACHIEVED!
Our previous technical analysis delivered exactly what the bullish scenario was looking for!
📍 Previous Entry: $47.80
🎯 ALL TARGETS HIT:
✅ TP1: $49.00
✅ TP2: $50.00
✅ TP3: $54.60
📊 Latest Market Update:
- Current Price: $55.80
- 24H High: $56.54
- 24H Change: +18.80%
🔥 What's Next?
SOXL has demonstrated strong bullish momentum, breaking above previous resistance levels with significant trading volume.
Key Levels to Watch:
- Support: $54.30 – $53.00
- Resistance: $56.54 – $57.77
- Next Potential Target: $60.00
🐂 The bullish scenario has successfully completed all three targets.
But the big question remains:
Can SOXL break $60, or are we approaching a profit-taking correction?
Congratulations to everyone who followed the bullish setup! 🎯$SOXLB
Our previous technical analysis delivered exactly what the bullish scenario was looking for!
📍 Previous Entry: $47.80
🎯 ALL TARGETS HIT:
✅ TP1: $49.00
✅ TP2: $50.00
✅ TP3: $54.60
📊 Latest Market Update:
- Current Price: $55.80
- 24H High: $56.54
- 24H Change: +18.80%
🔥 What's Next?
SOXL has demonstrated strong bullish momentum, breaking above previous resistance levels with significant trading volume.
Key Levels to Watch:
- Support: $54.30 – $53.00
- Resistance: $56.54 – $57.77
- Next Potential Target: $60.00
🐂 The bullish scenario has successfully completed all three targets.
But the big question remains:
Can SOXL break $60, or are we approaching a profit-taking correction?
Congratulations to everyone who followed the bullish setup! 🎯$SOXLB
107
📊 DEXE/USDT | Has DeXe entered a recovery phase, or is this merely a temporary bounce?
DEXE is showing notable positive movement following a sharp decline. According to the chart, the price has recorded:
💰 Current price: 1.298 USDT
🟢 24-hour change: +3.92%
📈 High: 1.301 USDT
📉 Low: 1.161 USDT
🔍 Technical analysis
1️⃣ Overall trend:
Although the previous trend was bearish, the price has started showing signs of recovery after bouncing from the $1.161 area.
2️⃣ Moving averages:
- MA(7): 1.265
- MA(25): 1.245
- MA(99): 1.279
The current price is above all three moving averages, which is a positive short-term signal. However, confirming a trend reversal will require further upward movement.
3️⃣ Support and resistance levels:
🟢 Support zones:
- 1.279
- 1.265
- 1.245
- 1.219
🔴 Resistance zones:
- 1.301–1.310
- 1.368
- 1.442
🎯 Possible scenarios
🚀 Bullish scenario:
If the price breaks above 1.310 and closes above it with increasing trading volume, we may see an attempt to reach 1.368, followed by 1.442.
⚠️ Bearish scenario:
If the price fails to break through resistance and falls back below 1.279, we may see a correction toward 1.265, then 1.245.
🧠 Summary:
DEXE is currently at an important level, and price action has clearly improved following the previous decline.
But the real question is: are we seeing the start of a new bullish reversal, or just a bounce within a downtrend?
📊 DEXE/USDT | Has DeXe entered a recovery phase, or is this merely a temporary bounce?
DEXE is showing notable positive movement following a sharp decline. According to the chart, the price has recorded:
💰 Current price: 1.298 USDT
🟢 24-hour change: +3.92%
📈 High: 1.301 USDT
📉 Low: 1.161 USDT
🔍 Technical analysis
1️⃣ Overall trend:
Although the previous trend was bearish, the price has started showing signs of recovery after bouncing from the $1.161 area.
2️⃣ Moving averages:
- MA(7): 1.265
- MA(25): 1.245
- MA(99): 1.279
The current price is above all three moving averages, which is a positive short-term signal. However, confirming a trend reversal will require further upward movement.
3️⃣ Support and resistance levels:
🟢 Support zones:
- 1.279
- 1.265
- 1.245
- 1.219
🔴 Resistance zones:
- 1.301–1.310
- 1.368
- 1.442
🎯 Possible scenarios
🚀 Bullish scenario:
If the price breaks above 1.310 and closes above it with increasing trading volume, we may see an attempt to reach 1.368, followed by 1.442.
⚠️ Bearish scenario:
If the price fails to break through resistance and falls back below 1.279, we may see a correction toward 1.265, then 1.245.
🧠 Summary:
DEXE is currently at an important level, and price action has clearly improved following the previous decline.
But the real question is: are we seeing the start of a new bullish reversal, or just a bounce within a downtrend?
DEXE is showing notable positive movement following a sharp decline. According to the chart, the price has recorded:
💰 Current price: 1.298 USDT
🟢 24-hour change: +3.92%
📈 High: 1.301 USDT
📉 Low: 1.161 USDT
🔍 Technical analysis
1️⃣ Overall trend:
Although the previous trend was bearish, the price has started showing signs of recovery after bouncing from the $1.161 area.
2️⃣ Moving averages:
- MA(7): 1.265
- MA(25): 1.245
- MA(99): 1.279
The current price is above all three moving averages, which is a positive short-term signal. However, confirming a trend reversal will require further upward movement.
3️⃣ Support and resistance levels:
🟢 Support zones:
- 1.279
- 1.265
- 1.245
- 1.219
🔴 Resistance zones:
- 1.301–1.310
- 1.368
- 1.442
🎯 Possible scenarios
🚀 Bullish scenario:
If the price breaks above 1.310 and closes above it with increasing trading volume, we may see an attempt to reach 1.368, followed by 1.442.
⚠️ Bearish scenario:
If the price fails to break through resistance and falls back below 1.279, we may see a correction toward 1.265, then 1.245.
🧠 Summary:
DEXE is currently at an important level, and price action has clearly improved following the previous decline.
But the real question is: are we seeing the start of a new bullish reversal, or just a bounce within a downtrend?

682
See translation
📊 DEXE/USDT Technical Analysis – November 9, 2026
Is DEXE Preparing for a Reversal or Another Downward Move?
DEXE is currently trading around $1.236, down approximately 3.28% over the last 24 hours.
🔍 Market Overview:
- Current Price: $1.236
- 24H High: $1.278
- 24H Low: $1.175
- Market Trend: Bearish
- Momentum: Weak
📉 Technical Analysis:
DEXE remains under significant selling pressure. The price is trading below its key moving averages:
- MA7: $1.239
- MA25: $1.247
- MA99: $1.290
This indicates that bearish momentum is still dominant, although a short-term recovery remains possible.
🟢 Bullish Scenario:
A breakout above $1.247 could open the door toward:
- Target 1: $1.280
- Target 2: $1.290
- Target 3: $1.304
🔴 Bearish Scenario:
Failure to hold the $1.200 support could expose DEXE to further downside.
Key support levels:
- $1.175
- $1.161
- $1.144
🎯 My Perspective:
The current market structure suggests that DEXE is still in a bearish phase. However, the next move will depend on buying volume and the ability of bulls to reclaim important resistance levels.
The big question is:
Is this the beginning of a recovery, or just a temporary bounce before another drop?
💬 What is your prediction for DEXE?
🚀 BULLISH or 🐻 BEARISH?
#DEXEUSDT #Binance #TechnicalAnalysis
#CryptoTrading #Altcoins
📊 DEXE/USDT Technical Analysis – November 9, 2026
Is DEXE Preparing for a Reversal or Another Downward Move?
DEXE is currently trading around $1.236, down approximately 3.28% over the last 24 hours.
🔍 Market Overview:
- Current Price: $1.236
- 24H High: $1.278
- 24H Low: $1.175
- Market Trend: Bearish
- Momentum: Weak
📉 Technical Analysis:
DEXE remains under significant selling pressure. The price is trading below its key moving averages:
- MA7: $1.239
- MA25: $1.247
- MA99: $1.290
This indicates that bearish momentum is still dominant, although a short-term recovery remains possible.
🟢 Bullish Scenario:
A breakout above $1.247 could open the door toward:
- Target 1: $1.280
- Target 2: $1.290
- Target 3: $1.304
🔴 Bearish Scenario:
Failure to hold the $1.200 support could expose DEXE to further downside.
Key support levels:
- $1.175
- $1.161
- $1.144
🎯 My Perspective:
The current market structure suggests that DEXE is still in a bearish phase. However, the next move will depend on buying volume and the ability of bulls to reclaim important resistance levels.
The big question is:
Is this the beginning of a recovery, or just a temporary bounce before another drop?
💬 What is your prediction for DEXE?
🚀 BULLISH or 🐻 BEARISH?
#DEXEUSDT #Binance #TechnicalAnalysis
#CryptoTrading #Altcoins
Is DEXE Preparing for a Reversal or Another Downward Move?
DEXE is currently trading around $1.236, down approximately 3.28% over the last 24 hours.
🔍 Market Overview:
- Current Price: $1.236
- 24H High: $1.278
- 24H Low: $1.175
- Market Trend: Bearish
- Momentum: Weak
📉 Technical Analysis:
DEXE remains under significant selling pressure. The price is trading below its key moving averages:
- MA7: $1.239
- MA25: $1.247
- MA99: $1.290
This indicates that bearish momentum is still dominant, although a short-term recovery remains possible.
🟢 Bullish Scenario:
A breakout above $1.247 could open the door toward:
- Target 1: $1.280
- Target 2: $1.290
- Target 3: $1.304
🔴 Bearish Scenario:
Failure to hold the $1.200 support could expose DEXE to further downside.
Key support levels:
- $1.175
- $1.161
- $1.144
🎯 My Perspective:
The current market structure suggests that DEXE is still in a bearish phase. However, the next move will depend on buying volume and the ability of bulls to reclaim important resistance levels.
The big question is:
Is this the beginning of a recovery, or just a temporary bounce before another drop?
💬 What is your prediction for DEXE?
🚀 BULLISH or 🐻 BEARISH?
#DEXEUSDT #Binance #TechnicalAnalysis
#CryptoTrading #Altcoins
1
2
639
Partly True
See translation
🚀 SOXL/USDT – Is a Bullish Reversal
Coming?
SOXL is showing signs of short-term stabilization after a significant market decline.
📊 Technical Market Analysis
Current Price: $46.42
24H Change: +1.55%
Moving Averages:
- MA(7): $45.81
- MA(25): $45.96
- MA(99): $56.32
🔹 Key Support Levels:
- $45.00
- $43.00
- $38.81
🔹 Key Resistance Levels:
- $47.62
- $49.00–$50.00
- $54.60
📈 Bullish Scenario:
A confirmed breakout above $47.62 could open the door toward $49–$50, with $54.60 as a further potential target.
📉 Bearish Scenario:
If SOXL fails to break resistance and drops below $45, further downside toward $44 and $43 could follow.
🔥 My Market Outlook
SOXL is currently moving sideways after a sharp decline. Buyers are attempting to regain control, but the overall trend remains bearish.
A confirmed breakout with strong trading volume is needed before considering a potential trend reversal.
The big question: Is SOXL preparing for a strong recovery, or is this just a temporary consolidation before another drop?
👇 Share your thoughts!
Are you BULLISH 🐂 or BEARISH 🐻 on SOXL?
#SOXL #CryptoTrading $
#TechnicalAnalysis #TradingSignals #Semiconductors
$SOXL
🚀 SOXL/USDT – Is a Bullish Reversal
Coming?
SOXL is showing signs of short-term stabilization after a significant market decline.
📊 Technical Market Analysis
Current Price: $46.42
24H Change: +1.55%
Moving Averages:
- MA(7): $45.81
- MA(25): $45.96
- MA(99): $56.32
🔹 Key Support Levels:
- $45.00
- $43.00
- $38.81
🔹 Key Resistance Levels:
- $47.62
- $49.00–$50.00
- $54.60
📈 Bullish Scenario:
A confirmed breakout above $47.62 could open the door toward $49–$50, with $54.60 as a further potential target.
📉 Bearish Scenario:
If SOXL fails to break resistance and drops below $45, further downside toward $44 and $43 could follow.
🔥 My Market Outlook
SOXL is currently moving sideways after a sharp decline. Buyers are attempting to regain control, but the overall trend remains bearish.
A confirmed breakout with strong trading volume is needed before considering a potential trend reversal.
The big question: Is SOXL preparing for a strong recovery, or is this just a temporary consolidation before another drop?
👇 Share your thoughts!
Are you BULLISH 🐂 or BEARISH 🐻 on SOXL?
#SOXL #CryptoTrading $
#TechnicalAnalysis #TradingSignals #Semiconductors
$SOXL
Coming?
SOXL is showing signs of short-term stabilization after a significant market decline.
📊 Technical Market Analysis
Current Price: $46.42
24H Change: +1.55%
Moving Averages:
- MA(7): $45.81
- MA(25): $45.96
- MA(99): $56.32
🔹 Key Support Levels:
- $45.00
- $43.00
- $38.81
🔹 Key Resistance Levels:
- $47.62
- $49.00–$50.00
- $54.60
📈 Bullish Scenario:
A confirmed breakout above $47.62 could open the door toward $49–$50, with $54.60 as a further potential target.
📉 Bearish Scenario:
If SOXL fails to break resistance and drops below $45, further downside toward $44 and $43 could follow.
🔥 My Market Outlook
SOXL is currently moving sideways after a sharp decline. Buyers are attempting to regain control, but the overall trend remains bearish.
A confirmed breakout with strong trading volume is needed before considering a potential trend reversal.
The big question: Is SOXL preparing for a strong recovery, or is this just a temporary consolidation before another drop?
👇 Share your thoughts!
Are you BULLISH 🐂 or BEARISH 🐻 on SOXL?
#SOXL #CryptoTrading $
#TechnicalAnalysis #TradingSignals #Semiconductors
$SOXL

591
📊 DEXE/USDT | Is the coin preparing for a new breakout, or is the decline not over yet? 🚀
$DEXE is going through a critical phase after a sharp downturn, followed by a rebound from the 1.229 USDT area, bringing prices back to trade near 1.32 USDT.
🔍 Technical analysis:
The price is trying to regain positive momentum, but the overall trend remains under selling pressure. Therefore, we need confirmation of a breakout before talking about a bullish reversal.
📈 Resistance levels:
- 1.340 – 1.355
- 1.362
- 1.410
- 1.447
📉 Support levels:
- 1.296
- 1.266
- 1.229
- 1.220
🔥 Bullish scenario:
A breakout above the 1.355 area and a close above it, accompanied by increased trading volume, could open the way to test 1.362 and then 1.410.
⚠️ Bearish scenario:
If the price fails to overcome resistance and breaks below 1.296, selling pressure could return, with a possible test of 1.266 and then 1.229.
🎯 Conclusion:
DEXE is at an important point in its price action. There is no confirmed signal yet that the downtrend has ended, but the recent rebound is worth watching.
Always remember: successful trading depends not only on predictions, but also on patience and risk management.
💬 Question for the community:
Do you think DEXE is preparing to return to 1.50 USDT? Or will we see lower levels before it takes off?
Share your analysis! 👇
#DEXE #Binance #Trading #TechnicalAnalysis #Altcoins
📊 DEXE/USDT | Is the coin preparing for a new breakout, or is the decline not over yet? 🚀
$DEXE is going through a critical phase after a sharp downturn, followed by a rebound from the 1.229 USDT area, bringing prices back to trade near 1.32 USDT.
🔍 Technical analysis:
The price is trying to regain positive momentum, but the overall trend remains under selling pressure. Therefore, we need confirmation of a breakout before talking about a bullish reversal.
📈 Resistance levels:
- 1.340 – 1.355
- 1.362
- 1.410
- 1.447
📉 Support levels:
- 1.296
- 1.266
- 1.229
- 1.220
🔥 Bullish scenario:
A breakout above the 1.355 area and a close above it, accompanied by increased trading volume, could open the way to test 1.362 and then 1.410.
⚠️ Bearish scenario:
If the price fails to overcome resistance and breaks below 1.296, selling pressure could return, with a possible test of 1.266 and then 1.229.
🎯 Conclusion:
DEXE is at an important point in its price action. There is no confirmed signal yet that the downtrend has ended, but the recent rebound is worth watching.
Always remember: successful trading depends not only on predictions, but also on patience and risk management.
💬 Question for the community:
Do you think DEXE is preparing to return to 1.50 USDT? Or will we see lower levels before it takes off?
Share your analysis! 👇
#DEXE #Binance #Trading #TechnicalAnalysis #Altcoins
$DEXE is going through a critical phase after a sharp downturn, followed by a rebound from the 1.229 USDT area, bringing prices back to trade near 1.32 USDT.
🔍 Technical analysis:
The price is trying to regain positive momentum, but the overall trend remains under selling pressure. Therefore, we need confirmation of a breakout before talking about a bullish reversal.
📈 Resistance levels:
- 1.340 – 1.355
- 1.362
- 1.410
- 1.447
📉 Support levels:
- 1.296
- 1.266
- 1.229
- 1.220
🔥 Bullish scenario:
A breakout above the 1.355 area and a close above it, accompanied by increased trading volume, could open the way to test 1.362 and then 1.410.
⚠️ Bearish scenario:
If the price fails to overcome resistance and breaks below 1.296, selling pressure could return, with a possible test of 1.266 and then 1.229.
🎯 Conclusion:
DEXE is at an important point in its price action. There is no confirmed signal yet that the downtrend has ended, but the recent rebound is worth watching.
Always remember: successful trading depends not only on predictions, but also on patience and risk management.
💬 Question for the community:
Do you think DEXE is preparing to return to 1.50 USDT? Or will we see lower levels before it takes off?
Share your analysis! 👇
#DEXE #Binance #Trading #TechnicalAnalysis #Altcoins
1
514
See translation
📈🔥 Trading Is Not Just About Numbers, Green Candles, and Red Candles… It's About Patience, Discipline, and Growth.
Never let one losing trade discourage you, and never let one winning trade make you overconfident.
Remember:
- Patience is more powerful than rushing.
- Risk management comes before profits.
- Never trade out of fear of missing an opportunity.
- Learn from your mistakes and improve your strategy.
- Discipline is the key to long-term success.
The market doesn't reward those who rush. It rewards those who know when to enter, when to exit, and when to wait.
🚀 Keep learning, stay focused, trust your strategy, and remember: Success is a journey, not a single trade.
#Trading #Crypto #TradingMindset #RiskManageme $DEXE $BTC $BNB
📈🔥 Trading Is Not Just About Numbers, Green Candles, and Red Candles… It's About Patience, Discipline, and Growth.
Never let one losing trade discourage you, and never let one winning trade make you overconfident.
Remember:
- Patience is more powerful than rushing.
- Risk management comes before profits.
- Never trade out of fear of missing an opportunity.
- Learn from your mistakes and improve your strategy.
- Discipline is the key to long-term success.
The market doesn't reward those who rush. It rewards those who know when to enter, when to exit, and when to wait.
🚀 Keep learning, stay focused, trust your strategy, and remember: Success is a journey, not a single trade.
#Trading #Crypto #TradingMindset #RiskManageme $DEXE $BTC $BNB
Never let one losing trade discourage you, and never let one winning trade make you overconfident.
Remember:
- Patience is more powerful than rushing.
- Risk management comes before profits.
- Never trade out of fear of missing an opportunity.
- Learn from your mistakes and improve your strategy.
- Discipline is the key to long-term success.
The market doesn't reward those who rush. It rewards those who know when to enter, when to exit, and when to wait.
🚀 Keep learning, stay focused, trust your strategy, and remember: Success is a journey, not a single trade.
#Trading #Crypto #TradingMindset #RiskManageme $DEXE $BTC $BNB

368
See translation
Technical Analysis: DEXE/USDT (1H timeframe)
Overall trend: Bearish. Price is 1,395, down about 14% over 7 days, 25% over 30 days, and 77% over a year. Clear weakness on the medium and long term.
Moving averages:
MA(7) = 1,402, MA(25) = 1,403, MA(99) = 1,416
Price sits below all three, which is a negative signal.
MA(7) and MA(25) are very close together, meaning the market is ranging rather than trending strongly.
MA(99) slopes downward and acts as dynamic resistance.
Support and resistance:
Support: 1,372 (24h low), then 1,340 (recent bottom). A break below 1,340 opens the way for further downside.
Resistance: 1,416 (MA99), then 1,447 (24h high), then the 1,480-1,487 zone.
Price action: After a sharp drop from 1,487 to 1,340, price bounced and moved sideways between roughly 1,370 and 1,440. Highs keep trying to rise but fail at MA(99), and the latest red candles show selling pressure near resistance.
Volume: Relatively weak. Volume has faded compared to the selloff, and the bounce wasn't backed by strong buying, which lowers the reliability of any upside move.
Scenarios:
Bullish: Hourly closes above 1,416 with rising volume, targeting 1,447 then 1,480.
Technical Analysis: DEXE/USDT (1H timeframe)
Overall trend: Bearish. Price is 1,395, down about 14% over 7 days, 25% over 30 days, and 77% over a year. Clear weakness on the medium and long term.
Moving averages:
MA(7) = 1,402, MA(25) = 1,403, MA(99) = 1,416
Price sits below all three, which is a negative signal.
MA(7) and MA(25) are very close together, meaning the market is ranging rather than trending strongly.
MA(99) slopes downward and acts as dynamic resistance.
Support and resistance:
Support: 1,372 (24h low), then 1,340 (recent bottom). A break below 1,340 opens the way for further downside.
Resistance: 1,416 (MA99), then 1,447 (24h high), then the 1,480-1,487 zone.
Price action: After a sharp drop from 1,487 to 1,340, price bounced and moved sideways between roughly 1,370 and 1,440. Highs keep trying to rise but fail at MA(99), and the latest red candles show selling pressure near resistance.
Volume: Relatively weak. Volume has faded compared to the selloff, and the bounce wasn't backed by strong buying, which lowers the reliability of any upside move.
Scenarios:
Bullish: Hourly closes above 1,416 with rising volume, targeting 1,447 then 1,480.
Overall trend: Bearish. Price is 1,395, down about 14% over 7 days, 25% over 30 days, and 77% over a year. Clear weakness on the medium and long term.
Moving averages:
MA(7) = 1,402, MA(25) = 1,403, MA(99) = 1,416
Price sits below all three, which is a negative signal.
MA(7) and MA(25) are very close together, meaning the market is ranging rather than trending strongly.
MA(99) slopes downward and acts as dynamic resistance.
Support and resistance:
Support: 1,372 (24h low), then 1,340 (recent bottom). A break below 1,340 opens the way for further downside.
Resistance: 1,416 (MA99), then 1,447 (24h high), then the 1,480-1,487 zone.
Price action: After a sharp drop from 1,487 to 1,340, price bounced and moved sideways between roughly 1,370 and 1,440. Highs keep trying to rise but fail at MA(99), and the latest red candles show selling pressure near resistance.
Volume: Relatively weak. Volume has faded compared to the selloff, and the bounce wasn't backed by strong buying, which lowers the reliability of any upside move.
Scenarios:
Bullish: Hourly closes above 1,416 with rising volume, targeting 1,447 then 1,480.

1
627
DEXE/USDT Analysis (1-hour timeframe)
Current situation: Price is $1.398, up slightly by +0.94% today, following a sharp drop from a high of ~1.499 to a low of 1.340.
Trend:
The overall trend remains bearish: price is below MA(99) at 1.445, which is sloping downward.
Short-term rebound: price is above MA(7) at 1.393 and MA(25) at 1.378, signaling an initial recovery.
Levels:
Support: 1.378 (MA25), then 1.340 (recent low). A break below 1.340 would mean the decline is continuing.
Resistance: 1.411 (24-hour high), then 1.425, then the 1.445 area (MA99), followed by 1.499.
Volume: Buying volume (green bars) appeared at and after the low, which is positive, but current volume is moderate—not strong enough to confirm a trend reversal.
Historical performance: Significant losses: 7 days -11.96%, 30 days -25.84%, 90 days -39.06%, 1 year -80.67%. The coin is in a prolonged downtrend.
Scenarios:
Bullish: Hourly candle closes above 1.411 on good volume, paving the way toward 1.425 and then 1.445.
Bearish: Failure at 1.411–1.425 followed by a break below 1.378 would send the price back to test 1.340.
DEXE/USDT Analysis (1-hour timeframe)
Current situation: Price is $1.398, up slightly by +0.94% today, following a sharp drop from a high of ~1.499 to a low of 1.340.
Trend:
The overall trend remains bearish: price is below MA(99) at 1.445, which is sloping downward.
Short-term rebound: price is above MA(7) at 1.393 and MA(25) at 1.378, signaling an initial recovery.
Levels:
Support: 1.378 (MA25), then 1.340 (recent low). A break below 1.340 would mean the decline is continuing.
Resistance: 1.411 (24-hour high), then 1.425, then the 1.445 area (MA99), followed by 1.499.
Volume: Buying volume (green bars) appeared at and after the low, which is positive, but current volume is moderate—not strong enough to confirm a trend reversal.
Historical performance: Significant losses: 7 days -11.96%, 30 days -25.84%, 90 days -39.06%, 1 year -80.67%. The coin is in a prolonged downtrend.
Scenarios:
Bullish: Hourly candle closes above 1.411 on good volume, paving the way toward 1.425 and then 1.445.
Bearish: Failure at 1.411–1.425 followed by a break below 1.378 would send the price back to test 1.340.
Current situation: Price is $1.398, up slightly by +0.94% today, following a sharp drop from a high of ~1.499 to a low of 1.340.
Trend:
The overall trend remains bearish: price is below MA(99) at 1.445, which is sloping downward.
Short-term rebound: price is above MA(7) at 1.393 and MA(25) at 1.378, signaling an initial recovery.
Levels:
Support: 1.378 (MA25), then 1.340 (recent low). A break below 1.340 would mean the decline is continuing.
Resistance: 1.411 (24-hour high), then 1.425, then the 1.445 area (MA99), followed by 1.499.
Volume: Buying volume (green bars) appeared at and after the low, which is positive, but current volume is moderate—not strong enough to confirm a trend reversal.
Historical performance: Significant losses: 7 days -11.96%, 30 days -25.84%, 90 days -39.06%, 1 year -80.67%. The coin is in a prolonged downtrend.
Scenarios:
Bullish: Hourly candle closes above 1.411 on good volume, paving the way toward 1.425 and then 1.445.
Bearish: Failure at 1.411–1.425 followed by a break below 1.378 would send the price back to test 1.340.
338
BTC/USDT analysis on the daily timeframe (from the chart$):
Overall trend: bearish in the short term, bullish in the medium term
The current price is 77,892, below MA(7) at 78,777 and MA(25) at 81,114, but above MA(99) at 76,711.
This means short-term selling pressure is continuing, but the rising MA(99) is acting as dynamic support. The price recently touched it and bounced.
Performance: -2.97% in 7 days, -7.85% in 30 days, +22.48% in 90 days, -4.38% in 180 days, -29.10% in a year.
Important levels:
Support: 76,700 (MA99 and approximately the low of the latest candle), then 72,300, then 66,900.
Resistance: 78,800 (MA7), then 81,100 (MA25), then 83,200, with the strongest resistance at the peak of 87,395.
Price action:
The price fell from the peak of 87,395 through a series of red candles, then bounced from the MA99 area with small green candles. The bounce has been weak so far, and the price is stuck between MA99 support and MA7 resistance.
Volume:
Volume has declined in recent days compared with the large red candles during the drop, which means the current bounce lacks clear buying momentum.
Scenarios:
Bullish: A daily close above 78,800 and then 81,100, accompanied by higher volume, would point toward 83,000–87,000.
Bearish: A clear daily close below 76,700 would open the way toward 72,300, and possibly 70,000.
Notes:
The image shows that you have an open position: the cost price is 70,198 and the average purchase price is around 64,6xx, so you are most likely currently in profit. A stop-loss to protect your profit (for example, below 72,300 or below MA99, depending on your risk tolerance) is worth considering.$BTC
BTC/USDT analysis on the daily timeframe (from the chart$):
Overall trend: bearish in the short term, bullish in the medium term
The current price is 77,892, below MA(7) at 78,777 and MA(25) at 81,114, but above MA(99) at 76,711.
This means short-term selling pressure is continuing, but the rising MA(99) is acting as dynamic support. The price recently touched it and bounced.
Performance: -2.97% in 7 days, -7.85% in 30 days, +22.48% in 90 days, -4.38% in 180 days, -29.10% in a year.
Important levels:
Support: 76,700 (MA99 and approximately the low of the latest candle), then 72,300, then 66,900.
Resistance: 78,800 (MA7), then 81,100 (MA25), then 83,200, with the strongest resistance at the peak of 87,395.
Price action:
The price fell from the peak of 87,395 through a series of red candles, then bounced from the MA99 area with small green candles. The bounce has been weak so far, and the price is stuck between MA99 support and MA7 resistance.
Volume:
Volume has declined in recent days compared with the large red candles during the drop, which means the current bounce lacks clear buying momentum.
Scenarios:
Bullish: A daily close above 78,800 and then 81,100, accompanied by higher volume, would point toward 83,000–87,000.
Bearish: A clear daily close below 76,700 would open the way toward 72,300, and possibly 70,000.
Notes:
The image shows that you have an open position: the cost price is 70,198 and the average purchase price is around 64,6xx, so you are most likely currently in profit. A stop-loss to protect your profit (for example, below 72,300 or below MA99, depending on your risk tolerance) is worth considering.$BTC
Overall trend: bearish in the short term, bullish in the medium term
The current price is 77,892, below MA(7) at 78,777 and MA(25) at 81,114, but above MA(99) at 76,711.
This means short-term selling pressure is continuing, but the rising MA(99) is acting as dynamic support. The price recently touched it and bounced.
Performance: -2.97% in 7 days, -7.85% in 30 days, +22.48% in 90 days, -4.38% in 180 days, -29.10% in a year.
Important levels:
Support: 76,700 (MA99 and approximately the low of the latest candle), then 72,300, then 66,900.
Resistance: 78,800 (MA7), then 81,100 (MA25), then 83,200, with the strongest resistance at the peak of 87,395.
Price action:
The price fell from the peak of 87,395 through a series of red candles, then bounced from the MA99 area with small green candles. The bounce has been weak so far, and the price is stuck between MA99 support and MA7 resistance.
Volume:
Volume has declined in recent days compared with the large red candles during the drop, which means the current bounce lacks clear buying momentum.
Scenarios:
Bullish: A daily close above 78,800 and then 81,100, accompanied by higher volume, would point toward 83,000–87,000.
Bearish: A clear daily close below 76,700 would open the way toward 72,300, and possibly 70,000.
Notes:
The image shows that you have an open position: the cost price is 70,198 and the average purchase price is around 64,6xx, so you are most likely currently in profit. A stop-loss to protect your profit (for example, below 72,300 or below MA99, depending on your risk tolerance) is worth considering.$BTC

70
DEXE/USDT analysis on the 1-hour timeframe (based on the chart):
Overall trend: Bearish
Current price is 1.435, below the three moving averages: MA(7) at 1.431, very close; MA(25) at 1.452; and MA(99) at 1.484.
The 99-period moving average is clearly sloping downward, and MA(25) crossed below it earlier, confirming continued selling pressure.
Long-term performance is negative: -10% in 7 days, -25% in 30 days, -36% in 90 days, and -80% in a year.
Key levels:
Support: 1.420 (the recent low, and also the 24-hour low), followed by the 1.415 area.
Resistance: 1.452 (MA25), then 1.485–1.487 (MA99 and the 24-hour high), with the strongest resistance at the 1.502 peak.
Current price action:
The price bounced from 1.420 with small green candles, but the rebound is weak so far and is likely a correction within a downtrend unless it breaks above 1.452 and holds.
Volume:
Trading volume is weak and declining compared with the previous period, so the current rebound lacks strong buying momentum.
Scenarios:
Bullish: A 1-hour candle close above 1.452 accompanied by rising volume could open the way toward 1.485.
Bearish: A clear close below 1.420 could push the price lower (approximately 1.38–1.40, depending on price action).
Notes:
The coin is in a medium- and long-term downtrend, so entering against the trend carries high risk.
If you decide to enter, it is better to wait for confirmation (a break above MA25) and place a stop-loss below 1.420.$DEXE
DEXE/USDT analysis on the 1-hour timeframe (based on the chart):
Overall trend: Bearish
Current price is 1.435, below the three moving averages: MA(7) at 1.431, very close; MA(25) at 1.452; and MA(99) at 1.484.
The 99-period moving average is clearly sloping downward, and MA(25) crossed below it earlier, confirming continued selling pressure.
Long-term performance is negative: -10% in 7 days, -25% in 30 days, -36% in 90 days, and -80% in a year.
Key levels:
Support: 1.420 (the recent low, and also the 24-hour low), followed by the 1.415 area.
Resistance: 1.452 (MA25), then 1.485–1.487 (MA99 and the 24-hour high), with the strongest resistance at the 1.502 peak.
Current price action:
The price bounced from 1.420 with small green candles, but the rebound is weak so far and is likely a correction within a downtrend unless it breaks above 1.452 and holds.
Volume:
Trading volume is weak and declining compared with the previous period, so the current rebound lacks strong buying momentum.
Scenarios:
Bullish: A 1-hour candle close above 1.452 accompanied by rising volume could open the way toward 1.485.
Bearish: A clear close below 1.420 could push the price lower (approximately 1.38–1.40, depending on price action).
Notes:
The coin is in a medium- and long-term downtrend, so entering against the trend carries high risk.
If you decide to enter, it is better to wait for confirmation (a break above MA25) and place a stop-loss below 1.420.$DEXE
Overall trend: Bearish
Current price is 1.435, below the three moving averages: MA(7) at 1.431, very close; MA(25) at 1.452; and MA(99) at 1.484.
The 99-period moving average is clearly sloping downward, and MA(25) crossed below it earlier, confirming continued selling pressure.
Long-term performance is negative: -10% in 7 days, -25% in 30 days, -36% in 90 days, and -80% in a year.
Key levels:
Support: 1.420 (the recent low, and also the 24-hour low), followed by the 1.415 area.
Resistance: 1.452 (MA25), then 1.485–1.487 (MA99 and the 24-hour high), with the strongest resistance at the 1.502 peak.
Current price action:
The price bounced from 1.420 with small green candles, but the rebound is weak so far and is likely a correction within a downtrend unless it breaks above 1.452 and holds.
Volume:
Trading volume is weak and declining compared with the previous period, so the current rebound lacks strong buying momentum.
Scenarios:
Bullish: A 1-hour candle close above 1.452 accompanied by rising volume could open the way toward 1.485.
Bearish: A clear close below 1.420 could push the price lower (approximately 1.38–1.40, depending on price action).
Notes:
The coin is in a medium- and long-term downtrend, so entering against the trend carries high risk.
If you decide to enter, it is better to wait for confirmation (a break above MA25) and place a stop-loss below 1.420.$DEXE
1
720
Current situation
The price is 1.481, up +0.20% today, with a 24-hour range of 1.466 to 1.499.
The price is slightly above MA7 (1.477) and MA25 (1.480), indicating more indecision and consolidation than an uptrend.
The price is below MA99 (1.529), and the moving average is still sloping downward, so the overall trend on this timeframe is bearish.
What happened on the chart
A sharp drop from around 1.60 to a low of 1.404, with a long wick and high volume, resembling a liquidation or sudden sell-off.
Afterward, the price rebounded and consolidated in a narrow sideways range between around 1.44 and 1.50.
Volume is gradually declining, meaning the market is quiet and waiting for a catalyst.
Key levels
Support: 1.466, then 1.444, then 1.404 (the recent low).
Resistance: 1.499, then 1.529 (MA99), then 1.60–1.64.
The bigger picture
Performance is negative across nearly all time periods: 7 days -9.3%, 30 days -21.4%, 90 days -37.3%, 180 days -85.8%, and one year -78.9%. The long-term trend is strongly bearish.
Scenarios
Bullish: An hourly close above 1.50 with increasing volume could open the way toward 1.53, then 1.60.
Bearish: A break below 1.44 puts the price at risk of retesting 1.404, or possibly lower.
Most likely for now: Continued sideways movement until a clear breakout in either direction.
Current situation
The price is 1.481, up +0.20% today, with a 24-hour range of 1.466 to 1.499.
The price is slightly above MA7 (1.477) and MA25 (1.480), indicating more indecision and consolidation than an uptrend.
The price is below MA99 (1.529), and the moving average is still sloping downward, so the overall trend on this timeframe is bearish.
What happened on the chart
A sharp drop from around 1.60 to a low of 1.404, with a long wick and high volume, resembling a liquidation or sudden sell-off.
Afterward, the price rebounded and consolidated in a narrow sideways range between around 1.44 and 1.50.
Volume is gradually declining, meaning the market is quiet and waiting for a catalyst.
Key levels
Support: 1.466, then 1.444, then 1.404 (the recent low).
Resistance: 1.499, then 1.529 (MA99), then 1.60–1.64.
The bigger picture
Performance is negative across nearly all time periods: 7 days -9.3%, 30 days -21.4%, 90 days -37.3%, 180 days -85.8%, and one year -78.9%. The long-term trend is strongly bearish.
Scenarios
Bullish: An hourly close above 1.50 with increasing volume could open the way toward 1.53, then 1.60.
Bearish: A break below 1.44 puts the price at risk of retesting 1.404, or possibly lower.
Most likely for now: Continued sideways movement until a clear breakout in either direction.
The price is 1.481, up +0.20% today, with a 24-hour range of 1.466 to 1.499.
The price is slightly above MA7 (1.477) and MA25 (1.480), indicating more indecision and consolidation than an uptrend.
The price is below MA99 (1.529), and the moving average is still sloping downward, so the overall trend on this timeframe is bearish.
What happened on the chart
A sharp drop from around 1.60 to a low of 1.404, with a long wick and high volume, resembling a liquidation or sudden sell-off.
Afterward, the price rebounded and consolidated in a narrow sideways range between around 1.44 and 1.50.
Volume is gradually declining, meaning the market is quiet and waiting for a catalyst.
Key levels
Support: 1.466, then 1.444, then 1.404 (the recent low).
Resistance: 1.499, then 1.529 (MA99), then 1.60–1.64.
The bigger picture
Performance is negative across nearly all time periods: 7 days -9.3%, 30 days -21.4%, 90 days -37.3%, 180 days -85.8%, and one year -78.9%. The long-term trend is strongly bearish.
Scenarios
Bullish: An hourly close above 1.50 with increasing volume could open the way toward 1.53, then 1.60.
Bearish: A break below 1.44 puts the price at risk of retesting 1.404, or possibly lower.
Most likely for now: Continued sideways movement until a clear breakout in either direction.

1
1
1k

Article
News – Major Security Breach at BinanceThe platform suffered a serious security incident on October 29, 2026, and Binance announced the following details:
Estimated losses: approximately $6.3 billion in affected digital assets.
Preliminary cause: a DevOps engineer’s computer was compromised.
Initial investigations found no evidence that private wallet keys had been leaked.
Binance announced that it would absorb the losses, and users would not bear them.
News – Major Security Breach at Binance
The platform suffered a serious security incident on October 29, 2026, and Binance announced the following details:
Estimated losses: approximately $6.3 billion in affected digital assets.
Preliminary cause: a DevOps engineer’s computer was compromised.
Initial investigations found no evidence that private wallet keys had been leaked.
Binance announced that it would absorb the losses, and users would not bear them.
Estimated losses: approximately $6.3 billion in affected digital assets.
Preliminary cause: a DevOps engineer’s computer was compromised.
Initial investigations found no evidence that private wallet keys had been leaked.
Binance announced that it would absorb the losses, and users would not bear them.
138
Current situation: Price is $1.485, up +0.41% today. 24-hour high: 1.502; low: 1.460.
What the chart shows:
Overall downtrend: The purple MA(99) at 1.550 is above the price and sloping downward, meaning the broader trend remains negative.
A sharp drop occurred around October 30, from the 1.60 area to a low of 1.404, with a very long wick and massive trading volume (panic selling). The price then rebounded quickly, indicating that buyers defended the 1.40–1.44 area.
Sideways consolidation: Since the rebound, the price has been moving between 1.445 and 1.498, while volume has fallen noticeably (the market is calming down).
The moving averages are close together: MA(7) = 1.487 and MA(25) = 1.482, with the price around them, indicating short-term neutrality with a slight positive bias.
Important levels:
Support: 1.445, then 1.404 (the recent low)
Resistance: 1.498–1.50, then 1.55 (MA99), then 1.60–1.644
Scenarios:
Bullish: An hourly close above 1.50 on good volume could open the way toward 1.55.
Bearish: A break below 1.445 could lead to a retest of 1.404; breaking below that would mean further declines.
Historical performance (at the bottom of the image): The red figures show losses of 11.65% over 7 days, 19.33% over 30 days, 37.38% over 90 days, 85.49% over 180 days, and 76.27% over one year, indicating a strong long-term downtrend.
Summary: The coin is consolidating after a sharp drop, but the overall trend remains downward, and the current low volume does not confirm a reversal. Entering hastily in the middle of the range is risky; it’s better to wait for a clear breakout above 1.50 or a confirmed bounce off support, with a stop-loss below the level you’re relying on.
Current situation: Price is $1.485, up +0.41% today. 24-hour high: 1.502; low: 1.460.
What the chart shows:
Overall downtrend: The purple MA(99) at 1.550 is above the price and sloping downward, meaning the broader trend remains negative.
A sharp drop occurred around October 30, from the 1.60 area to a low of 1.404, with a very long wick and massive trading volume (panic selling). The price then rebounded quickly, indicating that buyers defended the 1.40–1.44 area.
Sideways consolidation: Since the rebound, the price has been moving between 1.445 and 1.498, while volume has fallen noticeably (the market is calming down).
The moving averages are close together: MA(7) = 1.487 and MA(25) = 1.482, with the price around them, indicating short-term neutrality with a slight positive bias.
Important levels:
Support: 1.445, then 1.404 (the recent low)
Resistance: 1.498–1.50, then 1.55 (MA99), then 1.60–1.644
Scenarios:
Bullish: An hourly close above 1.50 on good volume could open the way toward 1.55.
Bearish: A break below 1.445 could lead to a retest of 1.404; breaking below that would mean further declines.
Historical performance (at the bottom of the image): The red figures show losses of 11.65% over 7 days, 19.33% over 30 days, 37.38% over 90 days, 85.49% over 180 days, and 76.27% over one year, indicating a strong long-term downtrend.
Summary: The coin is consolidating after a sharp drop, but the overall trend remains downward, and the current low volume does not confirm a reversal. Entering hastily in the middle of the range is risky; it’s better to wait for a clear breakout above 1.50 or a confirmed bounce off support, with a stop-loss below the level you’re relying on.
What the chart shows:
Overall downtrend: The purple MA(99) at 1.550 is above the price and sloping downward, meaning the broader trend remains negative.
A sharp drop occurred around October 30, from the 1.60 area to a low of 1.404, with a very long wick and massive trading volume (panic selling). The price then rebounded quickly, indicating that buyers defended the 1.40–1.44 area.
Sideways consolidation: Since the rebound, the price has been moving between 1.445 and 1.498, while volume has fallen noticeably (the market is calming down).
The moving averages are close together: MA(7) = 1.487 and MA(25) = 1.482, with the price around them, indicating short-term neutrality with a slight positive bias.
Important levels:
Support: 1.445, then 1.404 (the recent low)
Resistance: 1.498–1.50, then 1.55 (MA99), then 1.60–1.644
Scenarios:
Bullish: An hourly close above 1.50 on good volume could open the way toward 1.55.
Bearish: A break below 1.445 could lead to a retest of 1.404; breaking below that would mean further declines.
Historical performance (at the bottom of the image): The red figures show losses of 11.65% over 7 days, 19.33% over 30 days, 37.38% over 90 days, 85.49% over 180 days, and 76.27% over one year, indicating a strong long-term downtrend.
Summary: The coin is consolidating after a sharp drop, but the overall trend remains downward, and the current low volume does not confirm a reversal. Entering hastily in the middle of the range is risky; it’s better to wait for a clear breakout above 1.50 or a confirmed bounce off support, with a stop-loss below the level you’re relying on.
1
2
824
See translation
🚨 DEXE | Is This the End or the Beginning of Something Bigger? 🚀
The $DEXE community is facing a critical question as the token experiences price pressure and uncertainty. 📉 Is this simply a market correction before a potential recovery, or could further downside still be ahead?
🔍 The real question isn't how far the price has fallen, but what happens next.
📊 Two Possible Scenarios:
🟢 Bullish Scenario: A strong return of buying pressure, followed by a breakout above key resistance levels, could signal a potential recovery and a shift in market momentum.
🔴 Bearish Scenario: If DEXE loses important support levels, selling pressure could increase, potentially leading to further declines.
💡 The Bottom Line:
A price drop doesn't automatically mean the end of a project, just as a potential recovery doesn't guarantee a new rally. Watch price action, trading volume, and key technical levels before making any decisions.
🔥 Now it's your turn!
Do you believe $DEXE is preparing for a new beginning, or is the worst still ahead?
👇 Share your analysis and predictions in the comments!
#DEXE #Crypto #Binance #CryptoAnalysis #Altcoins
🚨 DEXE | Is This the End or the Beginning of Something Bigger? 🚀
The $DEXE community is facing a critical question as the token experiences price pressure and uncertainty. 📉 Is this simply a market correction before a potential recovery, or could further downside still be ahead?
🔍 The real question isn't how far the price has fallen, but what happens next.
📊 Two Possible Scenarios:
🟢 Bullish Scenario: A strong return of buying pressure, followed by a breakout above key resistance levels, could signal a potential recovery and a shift in market momentum.
🔴 Bearish Scenario: If DEXE loses important support levels, selling pressure could increase, potentially leading to further declines.
💡 The Bottom Line:
A price drop doesn't automatically mean the end of a project, just as a potential recovery doesn't guarantee a new rally. Watch price action, trading volume, and key technical levels before making any decisions.
🔥 Now it's your turn!
Do you believe $DEXE is preparing for a new beginning, or is the worst still ahead?
👇 Share your analysis and predictions in the comments!
#DEXE #Crypto #Binance #CryptoAnalysis #Altcoins
The $DEXE community is facing a critical question as the token experiences price pressure and uncertainty. 📉 Is this simply a market correction before a potential recovery, or could further downside still be ahead?
🔍 The real question isn't how far the price has fallen, but what happens next.
📊 Two Possible Scenarios:
🟢 Bullish Scenario: A strong return of buying pressure, followed by a breakout above key resistance levels, could signal a potential recovery and a shift in market momentum.
🔴 Bearish Scenario: If DEXE loses important support levels, selling pressure could increase, potentially leading to further declines.
💡 The Bottom Line:
A price drop doesn't automatically mean the end of a project, just as a potential recovery doesn't guarantee a new rally. Watch price action, trading volume, and key technical levels before making any decisions.
🔥 Now it's your turn!
Do you believe $DEXE is preparing for a new beginning, or is the worst still ahead?
👇 Share your analysis and predictions in the comments!
#DEXE #Crypto #Binance #CryptoAnalysis #Altcoins
2
670
See translation
📊 DEXE/USDT Technical Analysis on Binance
Based on the chart provided, DeXe (DEXE) is experiencing a clear downtrend, with an attempt to rebound from a support zone. Here is the technical analysis.
💰 1. Price and Indicators
- Current Price: 1.595 USDT
- 24-Hour High: 1.626 USDT
- 24-Hour Low: 1.562 USDT
- Recent Chart Low: 1.552 USDT
- MA(7): 1.590
- MA(25): 1.588
- MA(99): 1.622
📉 2. Overall Trend
The overall trend remains bearish, with a short-term recovery attempt.
- The price is slightly above the MA(7) and MA(25), indicating a limited short-term improvement.
- The price remains below the MA(99) at 1.622, suggesting that bearish pressure is still present.
- The current upward movement has not yet confirmed a trend reversal.
🎯 3. Key Support and Resistance Levels
Level| Price (USDT)
First Resistance| 1.605
Second Resistance| 1.622
Third Resistance| 1.650
First Support| 1.580
Second Support| 1.562
Third Support| 1.552
These levels are estimates based on the chart provided and may change as market conditions evolve.
🚀 4. Potential Scenarios
🟢 Bullish Scenario:
If DEXE breaks above 1.605 and then moves above 1.622 with increasing trading volume, the next potential targets could be 1.650 and 1.680 USDT.
🔴 Bearish Scenario:
If the price fails to break resistance and falls below 1.580, it may retest 1.562. A break below this level could push the price toward 1.552 or even lower levels.
💡 5. Is It a Good Time to Buy DEXE on the Spot Market?
If you are trading DEXE on the spot market, it may be better to avoid investing your entire amount at once.
- More conservative entry: Wait for a breakout above 1.622 and confirmation that the price can hold above this level.
- Buying near support: Monitor the 1.562–1.580 zone and wait for clear signs of a rebound.
- Invalidation level: A break below 1.552 could indicate further downside risk.
⚠️ There is no guarantee that the price will rebound from support. Avoid investing your entire capital in a single trade.
📊 DEXE/USDT Technical Analysis on Binance
Based on the chart provided, DeXe (DEXE) is experiencing a clear downtrend, with an attempt to rebound from a support zone. Here is the technical analysis.
💰 1. Price and Indicators
- Current Price: 1.595 USDT
- 24-Hour High: 1.626 USDT
- 24-Hour Low: 1.562 USDT
- Recent Chart Low: 1.552 USDT
- MA(7): 1.590
- MA(25): 1.588
- MA(99): 1.622
📉 2. Overall Trend
The overall trend remains bearish, with a short-term recovery attempt.
- The price is slightly above the MA(7) and MA(25), indicating a limited short-term improvement.
- The price remains below the MA(99) at 1.622, suggesting that bearish pressure is still present.
- The current upward movement has not yet confirmed a trend reversal.
🎯 3. Key Support and Resistance Levels
Level| Price (USDT)
First Resistance| 1.605
Second Resistance| 1.622
Third Resistance| 1.650
First Support| 1.580
Second Support| 1.562
Third Support| 1.552
These levels are estimates based on the chart provided and may change as market conditions evolve.
🚀 4. Potential Scenarios
🟢 Bullish Scenario:
If DEXE breaks above 1.605 and then moves above 1.622 with increasing trading volume, the next potential targets could be 1.650 and 1.680 USDT.
🔴 Bearish Scenario:
If the price fails to break resistance and falls below 1.580, it may retest 1.562. A break below this level could push the price toward 1.552 or even lower levels.
💡 5. Is It a Good Time to Buy DEXE on the Spot Market?
If you are trading DEXE on the spot market, it may be better to avoid investing your entire amount at once.
- More conservative entry: Wait for a breakout above 1.622 and confirmation that the price can hold above this level.
- Buying near support: Monitor the 1.562–1.580 zone and wait for clear signs of a rebound.
- Invalidation level: A break below 1.552 could indicate further downside risk.
⚠️ There is no guarantee that the price will rebound from support. Avoid investing your entire capital in a single trade.
Based on the chart provided, DeXe (DEXE) is experiencing a clear downtrend, with an attempt to rebound from a support zone. Here is the technical analysis.
💰 1. Price and Indicators
- Current Price: 1.595 USDT
- 24-Hour High: 1.626 USDT
- 24-Hour Low: 1.562 USDT
- Recent Chart Low: 1.552 USDT
- MA(7): 1.590
- MA(25): 1.588
- MA(99): 1.622
📉 2. Overall Trend
The overall trend remains bearish, with a short-term recovery attempt.
- The price is slightly above the MA(7) and MA(25), indicating a limited short-term improvement.
- The price remains below the MA(99) at 1.622, suggesting that bearish pressure is still present.
- The current upward movement has not yet confirmed a trend reversal.
🎯 3. Key Support and Resistance Levels
Level| Price (USDT)
First Resistance| 1.605
Second Resistance| 1.622
Third Resistance| 1.650
First Support| 1.580
Second Support| 1.562
Third Support| 1.552
These levels are estimates based on the chart provided and may change as market conditions evolve.
🚀 4. Potential Scenarios
🟢 Bullish Scenario:
If DEXE breaks above 1.605 and then moves above 1.622 with increasing trading volume, the next potential targets could be 1.650 and 1.680 USDT.
🔴 Bearish Scenario:
If the price fails to break resistance and falls below 1.580, it may retest 1.562. A break below this level could push the price toward 1.552 or even lower levels.
💡 5. Is It a Good Time to Buy DEXE on the Spot Market?
If you are trading DEXE on the spot market, it may be better to avoid investing your entire amount at once.
- More conservative entry: Wait for a breakout above 1.622 and confirmation that the price can hold above this level.
- Buying near support: Monitor the 1.562–1.580 zone and wait for clear signs of a rebound.
- Invalidation level: A break below 1.552 could indicate further downside risk.
⚠️ There is no guarantee that the price will rebound from support. Avoid investing your entire capital in a single trade.

1
974
🚀 $DEXE | Trust in patience and a long-term vision! 📈
In the world of crypto, volatility is part of the journey, and success takes patience and smart risk management. 🔥
DEXE is worth following and analyzing, but the most important thing is to make decisions based on data, not just emotions or expectations.
💎 Do you think DEXE can make a strong breakout in the coming period?
📊 Share your thoughts and predictions with us!
#DEXE #Crypto #Binance #Altcoins #CryptoCommunity
🚀 $DEXE | Trust in patience and a long-term vision! 📈
In the world of crypto, volatility is part of the journey, and success takes patience and smart risk management. 🔥
DEXE is worth following and analyzing, but the most important thing is to make decisions based on data, not just emotions or expectations.
💎 Do you think DEXE can make a strong breakout in the coming period?
📊 Share your thoughts and predictions with us!
#DEXE #Crypto #Binance #Altcoins #CryptoCommunity
In the world of crypto, volatility is part of the journey, and success takes patience and smart risk management. 🔥
DEXE is worth following and analyzing, but the most important thing is to make decisions based on data, not just emotions or expectations.
💎 Do you think DEXE can make a strong breakout in the coming period?
📊 Share your thoughts and predictions with us!
#DEXE #Crypto #Binance #Altcoins #CryptoCommunity
2
614
📊 DEXE/USDT Coin Analysis on Binance
Price: 1.798 USDT
Timeframe: One hour (1H).
🔍 First: Technical Analysis
Trend: Short-term uptrend, with the price approaching a resistance zone.
MA(7) = 1.800: The price is near the short-term moving average, indicating a slight slowdown in upward momentum.
MA(25) = 1.792: Nearby support for the price.
MA(99) = 1.751: The price is above it, which is a positive signal for the short- and medium-term trend.
Trading volume: No strong, sustained increase in trading volume is evident, so the upward move needs further confirmation.
🎯 Second: Support and Resistance Levels
Level
Price
🔴 First resistance
1.812
🔴 Second resistance
1.821
🔴 Third resistance
1.865
🟢 First support
1.792
🟢 Second support
1.778
🟢 Third support
1.751
⚠️ Important support
1.735
🚀 Third: Possible Scenarios
🟢 Bullish scenario: If the price breaks through 1.812 and closes above it with rising trading volume, it may target:
First target: 1.821
Second target: 1.850
Third target: 1.865
🔴 Bearish scenario: If the price fails to break through resistance and falls below 1.778, it may decline toward:
First target: 1.768
Second target: 1.751
Third target: 1.735
💰 Fourth: Is Now a Good Time to Buy on the Spot Market?
Since you are trading on the spot market (Spot), it is best to watch for one of these two scenarios:
Buy after the breakout: Wait for a break above 1.812 and confirmation that the price holds above it.
📊 DEXE/USDT Coin Analysis on Binance
Price: 1.798 USDT
Timeframe: One hour (1H).
🔍 First: Technical Analysis
Trend: Short-term uptrend, with the price approaching a resistance zone.
MA(7) = 1.800: The price is near the short-term moving average, indicating a slight slowdown in upward momentum.
MA(25) = 1.792: Nearby support for the price.
MA(99) = 1.751: The price is above it, which is a positive signal for the short- and medium-term trend.
Trading volume: No strong, sustained increase in trading volume is evident, so the upward move needs further confirmation.
🎯 Second: Support and Resistance Levels
Level
Price
🔴 First resistance
1.812
🔴 Second resistance
1.821
🔴 Third resistance
1.865
🟢 First support
1.792
🟢 Second support
1.778
🟢 Third support
1.751
⚠️ Important support
1.735
🚀 Third: Possible Scenarios
🟢 Bullish scenario: If the price breaks through 1.812 and closes above it with rising trading volume, it may target:
First target: 1.821
Second target: 1.850
Third target: 1.865
🔴 Bearish scenario: If the price fails to break through resistance and falls below 1.778, it may decline toward:
First target: 1.768
Second target: 1.751
Third target: 1.735
💰 Fourth: Is Now a Good Time to Buy on the Spot Market?
Since you are trading on the spot market (Spot), it is best to watch for one of these two scenarios:
Buy after the breakout: Wait for a break above 1.812 and confirmation that the price holds above it.
Price: 1.798 USDT
Timeframe: One hour (1H).
🔍 First: Technical Analysis
Trend: Short-term uptrend, with the price approaching a resistance zone.
MA(7) = 1.800: The price is near the short-term moving average, indicating a slight slowdown in upward momentum.
MA(25) = 1.792: Nearby support for the price.
MA(99) = 1.751: The price is above it, which is a positive signal for the short- and medium-term trend.
Trading volume: No strong, sustained increase in trading volume is evident, so the upward move needs further confirmation.
🎯 Second: Support and Resistance Levels
Level
Price
🔴 First resistance
1.812
🔴 Second resistance
1.821
🔴 Third resistance
1.865
🟢 First support
1.792
🟢 Second support
1.778
🟢 Third support
1.751
⚠️ Important support
1.735
🚀 Third: Possible Scenarios
🟢 Bullish scenario: If the price breaks through 1.812 and closes above it with rising trading volume, it may target:
First target: 1.821
Second target: 1.850
Third target: 1.865
🔴 Bearish scenario: If the price fails to break through resistance and falls below 1.778, it may decline toward:
First target: 1.768
Second target: 1.751
Third target: 1.735
💰 Fourth: Is Now a Good Time to Buy on the Spot Market?
Since you are trading on the spot market (Spot), it is best to watch for one of these two scenarios:
Buy after the breakout: Wait for a break above 1.812 and confirmation that the price holds above it.
2
455
Log in to explore more content
Join global crypto users on Binance Square
⚡️ Get latest and useful information about crypto.
💬 Trusted by the world’s largest crypto exchange.
👍 Discover real insights from verified creators.
Email / Phone number
Trending Topics
HuangExitNvidiaStrategyInFocus
78,172 views
907 Discussing
STOCKS | Nvidia’s Jensen Huang Resigns, Colette Kress Named as Interim CEO
Binance News
·21 Likes
·33.2k views
AnthropicRejectsIPODelayValuationinQuestion
676,294 views
5,192 Discussing
BitMineReports$6.3BNetLossForFiscal2026
9,975 views
115 Discussing