
#usar
usar
28,956 views
371 Discussing
Hot
Latest

·
--
See translation
⚡ $USAR FLIPS RESISTANCE AT 19.50 INTO SUPPORT FOR A CLEAN BREAKOUT! 🐂
Entry: 19.70 - 20.00 ⚡
Target: 20.50 - 21.50 🚀
Stop Loss: 19.25 ⚠️
📌 The 4H chart just printed a textbook breakout, clearing the heavy 19.50 resistance level with aggressive buyer velocity. As long as bulls defend this structural flip on any pullbacks, the path of least resistance points higher.
⚡ Order flow is leaning heavily toward the upper liquidity targets, offering an exceptionally clean risk-managed setup. 💬 Are you bidding this retest range or waiting for a push past 20.50? 👇
⚠️ Not financial advice. Always manage your risk. 🛡️
🏷️ #USAR #LongSetup #Breakout #Crypto
🔥 💎
⚡ $USAR FLIPS RESISTANCE AT 19.50 INTO SUPPORT FOR A CLEAN BREAKOUT! 🐂
Entry: 19.70 - 20.00 ⚡
Target: 20.50 - 21.50 🚀
Stop Loss: 19.25 ⚠️
📌 The 4H chart just printed a textbook breakout, clearing the heavy 19.50 resistance level with aggressive buyer velocity. As long as bulls defend this structural flip on any pullbacks, the path of least resistance points higher.
⚡ Order flow is leaning heavily toward the upper liquidity targets, offering an exceptionally clean risk-managed setup. 💬 Are you bidding this retest range or waiting for a push past 20.50? 👇
⚠️ Not financial advice. Always manage your risk. 🛡️
🏷️ #USAR #LongSetup #Breakout #Crypto
🔥 💎
Entry: 19.70 - 20.00 ⚡
Target: 20.50 - 21.50 🚀
Stop Loss: 19.25 ⚠️
📌 The 4H chart just printed a textbook breakout, clearing the heavy 19.50 resistance level with aggressive buyer velocity. As long as bulls defend this structural flip on any pullbacks, the path of least resistance points higher.
⚡ Order flow is leaning heavily toward the upper liquidity targets, offering an exceptionally clean risk-managed setup. 💬 Are you bidding this retest range or waiting for a push past 20.50? 👇
⚠️ Not financial advice. Always manage your risk. 🛡️
🏷️ #USAR #LongSetup #Breakout #Crypto
🔥 💎
7
·
--
See translation
$USAR PRESSING HARD AGAINST RESISTANCE FOR EXPLOSIVE CONTINUATION! 🐂 ⚡
Entry: 19.30 - 19.80 ⚡
Target: 20.50 / 21.20 / 22.00 🚀
Stop Loss: 18.80 ⚠️
Bulls have locked in a clean structure on $USAR after reclaiming the critical $19.00 base. Price action is now coiling directly beneath the $19.90 resistance ceiling, showing heavy absorption as sellers run out of ammo. 📊
A decisive 4H candle close above $19.94 will act as the green light for an aggressive expansion into higher liquidity pools. ⚡ Momentum favors the bid as long as structure holds above market support. 🎯
💬 Are you riding this breakout above $19.94 or waiting for a retest back into the demand zone? 👇
⚠️ Not financial advice. Always manage your risk. 🛡️
🏷️ #USAR #LongSetup #Breakout #Crypto #Trading
⚡ 💎
$USAR PRESSING HARD AGAINST RESISTANCE FOR EXPLOSIVE CONTINUATION! 🐂 ⚡
Entry: 19.30 - 19.80 ⚡
Target: 20.50 / 21.20 / 22.00 🚀
Stop Loss: 18.80 ⚠️
Bulls have locked in a clean structure on $USAR after reclaiming the critical $19.00 base. Price action is now coiling directly beneath the $19.90 resistance ceiling, showing heavy absorption as sellers run out of ammo. 📊
A decisive 4H candle close above $19.94 will act as the green light for an aggressive expansion into higher liquidity pools. ⚡ Momentum favors the bid as long as structure holds above market support. 🎯
💬 Are you riding this breakout above $19.94 or waiting for a retest back into the demand zone? 👇
⚠️ Not financial advice. Always manage your risk. 🛡️
🏷️ #USAR #LongSetup #Breakout #Crypto #Trading
⚡ 💎
Entry: 19.30 - 19.80 ⚡
Target: 20.50 / 21.20 / 22.00 🚀
Stop Loss: 18.80 ⚠️
Bulls have locked in a clean structure on $USAR after reclaiming the critical $19.00 base. Price action is now coiling directly beneath the $19.90 resistance ceiling, showing heavy absorption as sellers run out of ammo. 📊
A decisive 4H candle close above $19.94 will act as the green light for an aggressive expansion into higher liquidity pools. ⚡ Momentum favors the bid as long as structure holds above market support. 🎯
💬 Are you riding this breakout above $19.94 or waiting for a retest back into the demand zone? 👇
⚠️ Not financial advice. Always manage your risk. 🛡️
🏷️ #USAR #LongSetup #Breakout #Crypto #Trading
⚡ 💎
13

See translation
💥 $USAR BREAKS KEY RESISTANCE AS HEAVY LIQUIDITY PUSHES PRICES HIGHER! 🚀
Entry: 19.70 - 20.00 ⚡
Target: 20.50 - 21.50 🚀
Stop Loss: 19.25 ⚠️
$USAR just sliced through key 4H resistance on aggressive volume, absorbing sell-side liquidity instantly. Institutional order flow is driving this breakout, leaving late sellers caught completely off guard.
Momentum indicators are flashing green as buyer activity accelerates into this fresh structural reclaim. 📊 As long as price holds above the demand zone, velocity favors a direct run into the upper target band. 📌
💬 Are you bidding this breakout retest or letting the momentum leave without you? 👇
⚠️ Not financial advice. Always manage your risk. 🛡️
🏷️ #USAR #Breakout #Crypto #Trading #Momentum
🔥 ⚡
💥 $USAR BREAKS KEY RESISTANCE AS HEAVY LIQUIDITY PUSHES PRICES HIGHER! 🚀
Entry: 19.70 - 20.00 ⚡
Target: 20.50 - 21.50 🚀
Stop Loss: 19.25 ⚠️
$USAR just sliced through key 4H resistance on aggressive volume, absorbing sell-side liquidity instantly. Institutional order flow is driving this breakout, leaving late sellers caught completely off guard.
Momentum indicators are flashing green as buyer activity accelerates into this fresh structural reclaim. 📊 As long as price holds above the demand zone, velocity favors a direct run into the upper target band. 📌
💬 Are you bidding this breakout retest or letting the momentum leave without you? 👇
⚠️ Not financial advice. Always manage your risk. 🛡️
🏷️ #USAR #Breakout #Crypto #Trading #Momentum
🔥 ⚡
Entry: 19.70 - 20.00 ⚡
Target: 20.50 - 21.50 🚀
Stop Loss: 19.25 ⚠️
$USAR just sliced through key 4H resistance on aggressive volume, absorbing sell-side liquidity instantly. Institutional order flow is driving this breakout, leaving late sellers caught completely off guard.
Momentum indicators are flashing green as buyer activity accelerates into this fresh structural reclaim. 📊 As long as price holds above the demand zone, velocity favors a direct run into the upper target band. 📌
💬 Are you bidding this breakout retest or letting the momentum leave without you? 👇
⚠️ Not financial advice. Always manage your risk. 🛡️
🏷️ #USAR #Breakout #Crypto #Trading #Momentum
🔥 ⚡
3
·
--
See translation
💥 $USAR CLEARS CONSOLIDATION RANGE AS BUYING PRESSURE DRIVES EXPLOSIVE UPWARD MOMENTUM! 📈
Entry: 20.09 ⚡
Target: 21.50 🚀
Stop Loss: 19.45 ⚠️
Bulls just forcefully reclaimed control on $USAR , shattering the 1H consolidation ceiling with convincing volume expansion. 📊 Price action is holding firmly above the breakout level, flipping former resistance into a fresh structural launchpad.
⚡ As long as buyers defend this newly established shelf, order flow naturally favors continuation toward upper liquidity targets. 💡 Market structure is cleanly aligned for a sustained expansion leg. 💬 Are you bidding the pullback to support or waiting for confirmation above 21.00? 👇
⚠️ Not financial advice. Always manage your risk. 🛡️
🏷️ #USAR #Breakout #LongSetup #Crypto #Trading
🔥 💎
💥 $USAR CLEARS CONSOLIDATION RANGE AS BUYING PRESSURE DRIVES EXPLOSIVE UPWARD MOMENTUM! 📈
Entry: 20.09 ⚡
Target: 21.50 🚀
Stop Loss: 19.45 ⚠️
Bulls just forcefully reclaimed control on $USAR , shattering the 1H consolidation ceiling with convincing volume expansion. 📊 Price action is holding firmly above the breakout level, flipping former resistance into a fresh structural launchpad.
⚡ As long as buyers defend this newly established shelf, order flow naturally favors continuation toward upper liquidity targets. 💡 Market structure is cleanly aligned for a sustained expansion leg. 💬 Are you bidding the pullback to support or waiting for confirmation above 21.00? 👇
⚠️ Not financial advice. Always manage your risk. 🛡️
🏷️ #USAR #Breakout #LongSetup #Crypto #Trading
🔥 💎
Entry: 20.09 ⚡
Target: 21.50 🚀
Stop Loss: 19.45 ⚠️
Bulls just forcefully reclaimed control on $USAR , shattering the 1H consolidation ceiling with convincing volume expansion. 📊 Price action is holding firmly above the breakout level, flipping former resistance into a fresh structural launchpad.
⚡ As long as buyers defend this newly established shelf, order flow naturally favors continuation toward upper liquidity targets. 💡 Market structure is cleanly aligned for a sustained expansion leg. 💬 Are you bidding the pullback to support or waiting for confirmation above 21.00? 👇
⚠️ Not financial advice. Always manage your risk. 🛡️
🏷️ #USAR #Breakout #LongSetup #Crypto #Trading
🔥 💎
5

·
--
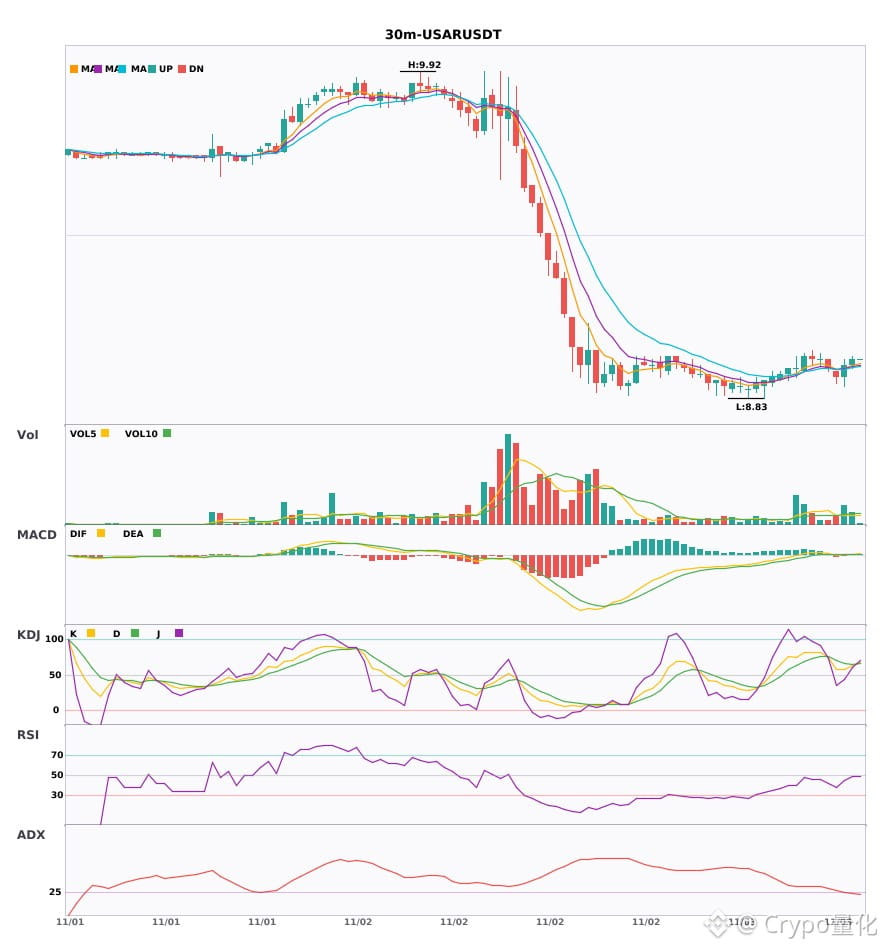
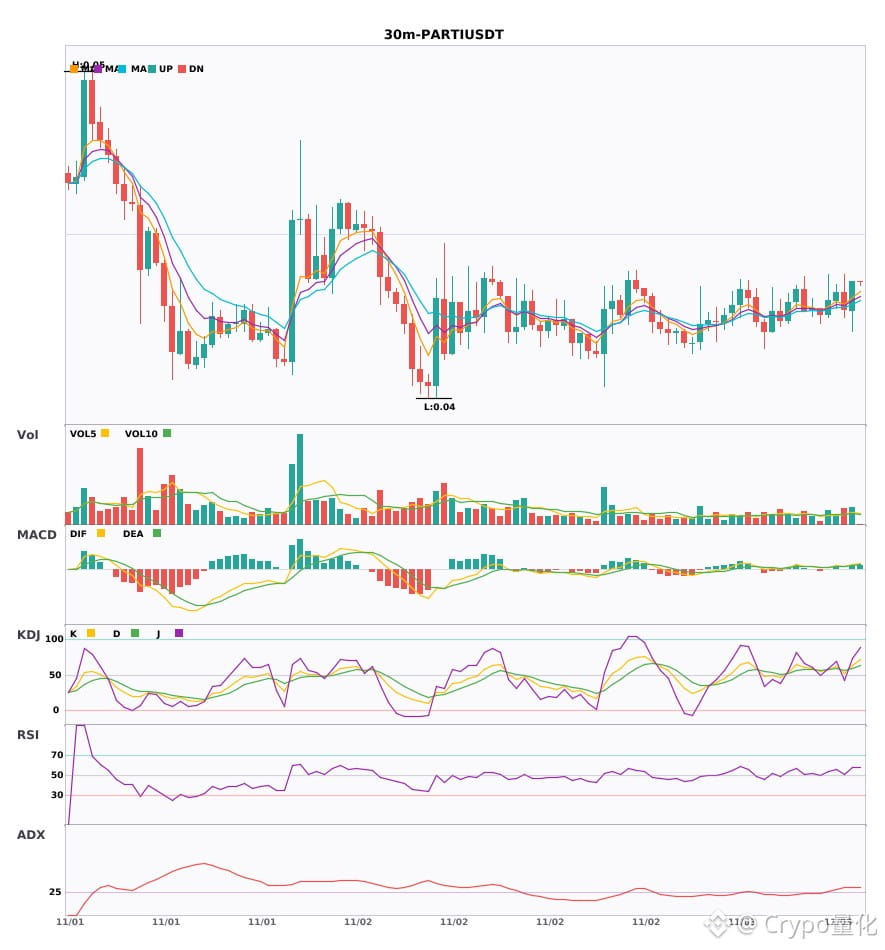
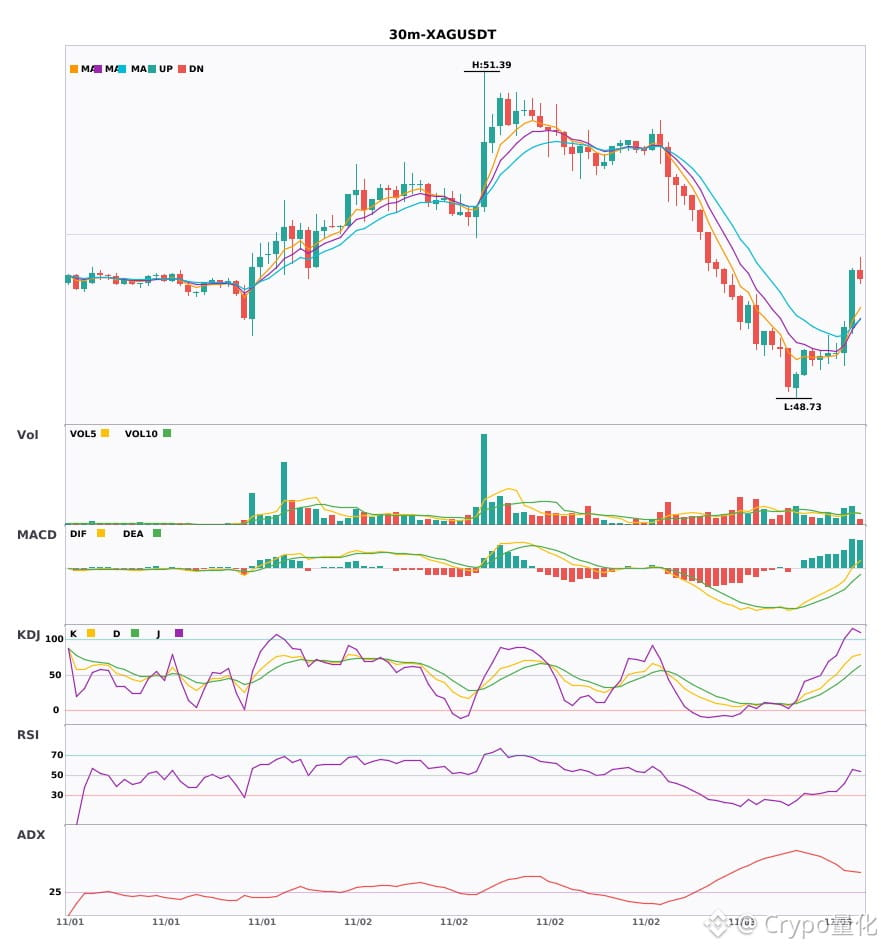
$USAR / $PARTI / $XAG 30-minute synchronized bullish reversal; bullish signals appearing simultaneously🔥
════════════════════
🔴 $USAR 30-minute bullish signal
⚠️Technical analysis: ADX(25): Trend is forming; opportunity to participate | MACD golden cross above zero, releasing bullish momentum | EMA5 > EMA8 > EMA13: bullish alignment | KDJ trending strongly, bulls in control (K: 63.9, D: 65.2) | Volume increased (1.8x)
════════════════════
🔴 $PARTI 30-minute bullish signal
⚠️Technical analysis: ADX(33): Clear trending market | MACD golden cross above zero, releasing bullish momentum | EMA5 > EMA8 > EMA13: bullish alignment | KDJ golden cross, short-term outlook bullish (K: 63.3, D: 58.7) | Volume increased (1.6x)
════════════════════
🔴 $XAG 30-minute bullish signal
⚠️Technical analysis: ADX(48): Very strong trend (watch for an overheated pullback) | MACD DIF breaks above the zero line, signaling a bullish trend reversal | Moving averages are converging and building momentum; a direction is about to be chosen | KDJ trending strongly, bulls in control (K: 75.4, D: 55.5) | Volume increased (1.6x)
════════════════════
🔔 Follow for first-hand market movement alerts 🔔
#技术分析 #USAR #PARTI #XAG
📌 When trading, check whether the candlestick patterns confirm the signal
$USAR / $PARTI / $XAG 30-minute synchronized bullish reversal; bullish signals appearing simultaneously🔥
════════════════════
🔴 $USAR 30-minute bullish signal
⚠️Technical analysis: ADX(25): Trend is forming; opportunity to participate | MACD golden cross above zero, releasing bullish momentum | EMA5 > EMA8 > EMA13: bullish alignment | KDJ trending strongly, bulls in control (K: 63.9, D: 65.2) | Volume increased (1.8x)
════════════════════
🔴 $PARTI 30-minute bullish signal
⚠️Technical analysis: ADX(33): Clear trending market | MACD golden cross above zero, releasing bullish momentum | EMA5 > EMA8 > EMA13: bullish alignment | KDJ golden cross, short-term outlook bullish (K: 63.3, D: 58.7) | Volume increased (1.6x)
════════════════════
🔴 $XAG 30-minute bullish signal
⚠️Technical analysis: ADX(48): Very strong trend (watch for an overheated pullback) | MACD DIF breaks above the zero line, signaling a bullish trend reversal | Moving averages are converging and building momentum; a direction is about to be chosen | KDJ trending strongly, bulls in control (K: 75.4, D: 55.5) | Volume increased (1.6x)
════════════════════
🔔 Follow for first-hand market movement alerts 🔔
#技术分析 #USAR #PARTI #XAG
📌 When trading, check whether the candlestick patterns confirm the signal
════════════════════
🔴 $USAR 30-minute bullish signal
⚠️Technical analysis: ADX(25): Trend is forming; opportunity to participate | MACD golden cross above zero, releasing bullish momentum | EMA5 > EMA8 > EMA13: bullish alignment | KDJ trending strongly, bulls in control (K: 63.9, D: 65.2) | Volume increased (1.8x)
════════════════════
🔴 $PARTI 30-minute bullish signal
⚠️Technical analysis: ADX(33): Clear trending market | MACD golden cross above zero, releasing bullish momentum | EMA5 > EMA8 > EMA13: bullish alignment | KDJ golden cross, short-term outlook bullish (K: 63.3, D: 58.7) | Volume increased (1.6x)
════════════════════
🔴 $XAG 30-minute bullish signal
⚠️Technical analysis: ADX(48): Very strong trend (watch for an overheated pullback) | MACD DIF breaks above the zero line, signaling a bullish trend reversal | Moving averages are converging and building momentum; a direction is about to be chosen | KDJ trending strongly, bulls in control (K: 75.4, D: 55.5) | Volume increased (1.6x)
════════════════════
🔔 Follow for first-hand market movement alerts 🔔
#技术分析 #USAR #PARTI #XAG
📌 When trading, check whether the candlestick patterns confirm the signal
6
·
--
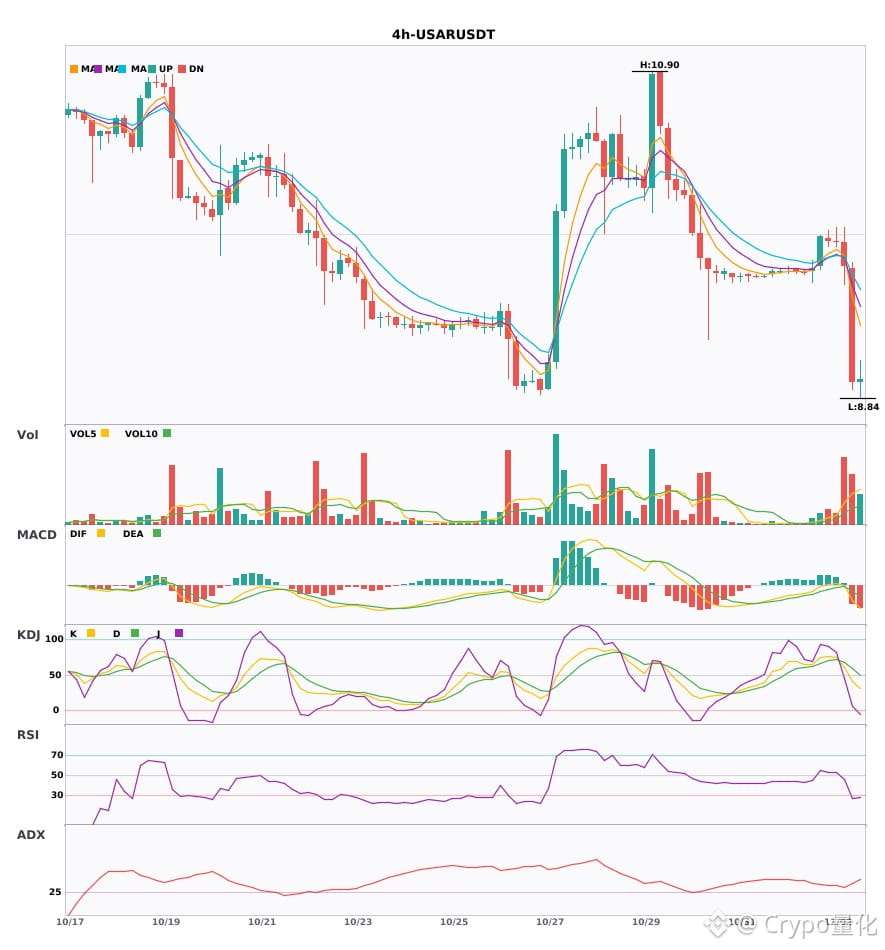
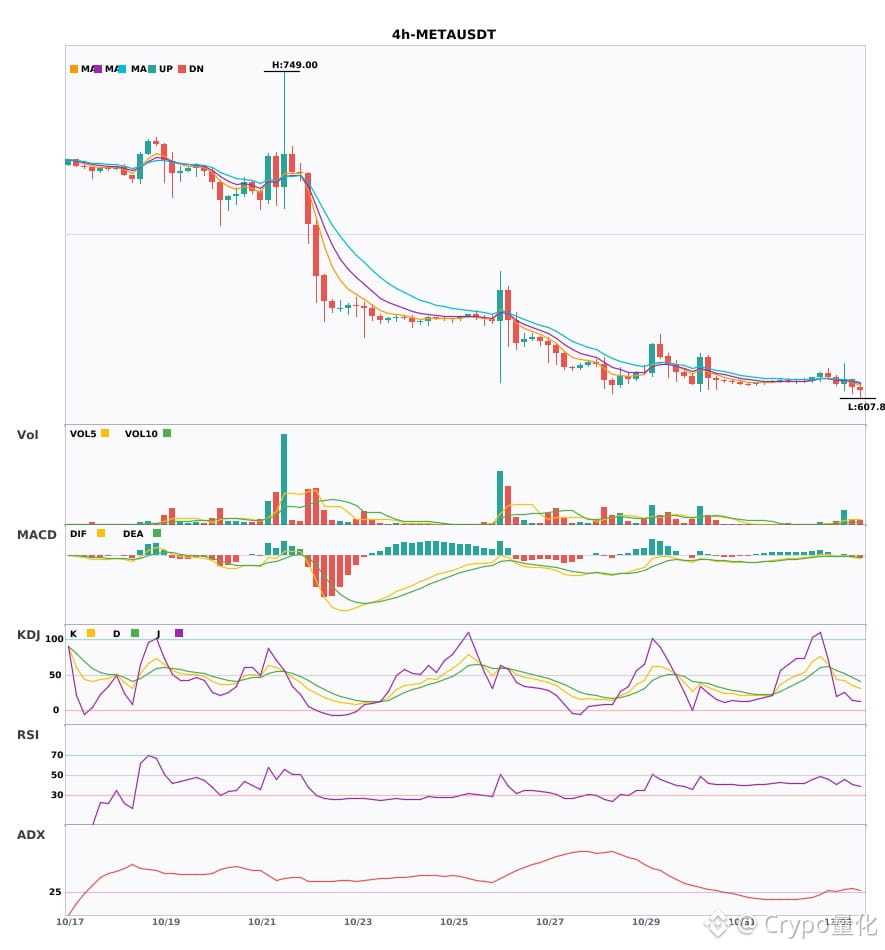
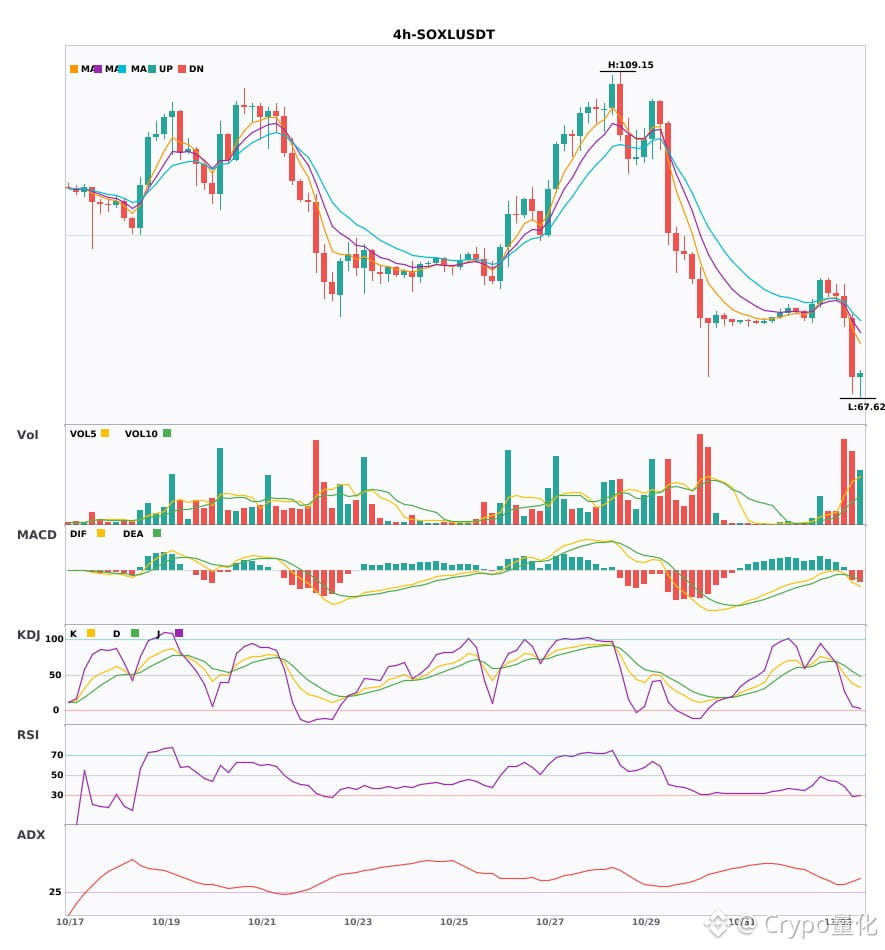
$USAR / $META / $SOXL 4-hour technical indicators are weakening simultaneously. Be mindful of risk 🔥
════════════════════
🟢 $USAR 4-hour bearish signal
⚠️ Technical indicators: ADX(39) indicates a strong trend | MACD bearish cross below zero, bearish momentum accelerating | EMA5 crosses below EMA8, short-term outlook turns bearish | Volume surge (5.6x)
════════════════════
🟢 $META 4-hour bearish signal
⚠️ Technical indicators: ADX(34) indicates a strong trend | MACD bearish cross below zero, bearish momentum accelerating | EMA5 below EMA8 below EMA13, bearish alignment | KDJ moving in weak territory, bears in control (K: 35.4, D: 46.1) | Volume surge (5.9x)
════════════════════
🟢 $SOXL 4-hour bearish signal
⚠️ Technical indicators: ADX(39) indicates a strong trend | MACD bearish cross below zero, bearish momentum accelerating | EMA5 below EMA8 below EMA13, bearish alignment | Volume surge (5.4x)
════════════════════
🔔 Follow for first-hand market updates 🔔
#技术分析 #USAR #META #SOXL
📌 When trading, pay attention to whether the candlestick patterns confirm the setup
$USAR / $META / $SOXL 4-hour technical indicators are weakening simultaneously. Be mindful of risk 🔥
════════════════════
🟢 $USAR 4-hour bearish signal
⚠️ Technical indicators: ADX(39) indicates a strong trend | MACD bearish cross below zero, bearish momentum accelerating | EMA5 crosses below EMA8, short-term outlook turns bearish | Volume surge (5.6x)
════════════════════
🟢 $META 4-hour bearish signal
⚠️ Technical indicators: ADX(34) indicates a strong trend | MACD bearish cross below zero, bearish momentum accelerating | EMA5 below EMA8 below EMA13, bearish alignment | KDJ moving in weak territory, bears in control (K: 35.4, D: 46.1) | Volume surge (5.9x)
════════════════════
🟢 $SOXL 4-hour bearish signal
⚠️ Technical indicators: ADX(39) indicates a strong trend | MACD bearish cross below zero, bearish momentum accelerating | EMA5 below EMA8 below EMA13, bearish alignment | Volume surge (5.4x)
════════════════════
🔔 Follow for first-hand market updates 🔔
#技术分析 #USAR #META #SOXL
📌 When trading, pay attention to whether the candlestick patterns confirm the setup
════════════════════
🟢 $USAR 4-hour bearish signal
⚠️ Technical indicators: ADX(39) indicates a strong trend | MACD bearish cross below zero, bearish momentum accelerating | EMA5 crosses below EMA8, short-term outlook turns bearish | Volume surge (5.6x)
════════════════════
🟢 $META 4-hour bearish signal
⚠️ Technical indicators: ADX(34) indicates a strong trend | MACD bearish cross below zero, bearish momentum accelerating | EMA5 below EMA8 below EMA13, bearish alignment | KDJ moving in weak territory, bears in control (K: 35.4, D: 46.1) | Volume surge (5.9x)
════════════════════
🟢 $SOXL 4-hour bearish signal
⚠️ Technical indicators: ADX(39) indicates a strong trend | MACD bearish cross below zero, bearish momentum accelerating | EMA5 below EMA8 below EMA13, bearish alignment | Volume surge (5.4x)
════════════════════
🔔 Follow for first-hand market updates 🔔
#技术分析 #USAR #META #SOXL
📌 When trading, pay attention to whether the candlestick patterns confirm the setup
39
·
--
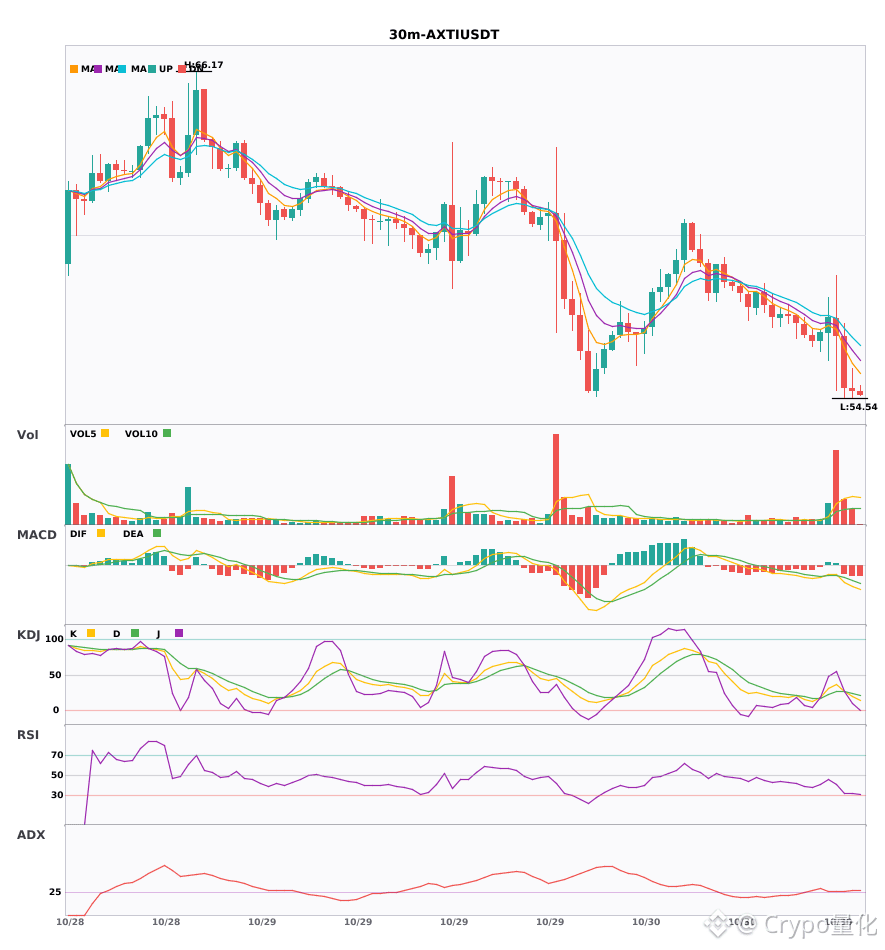
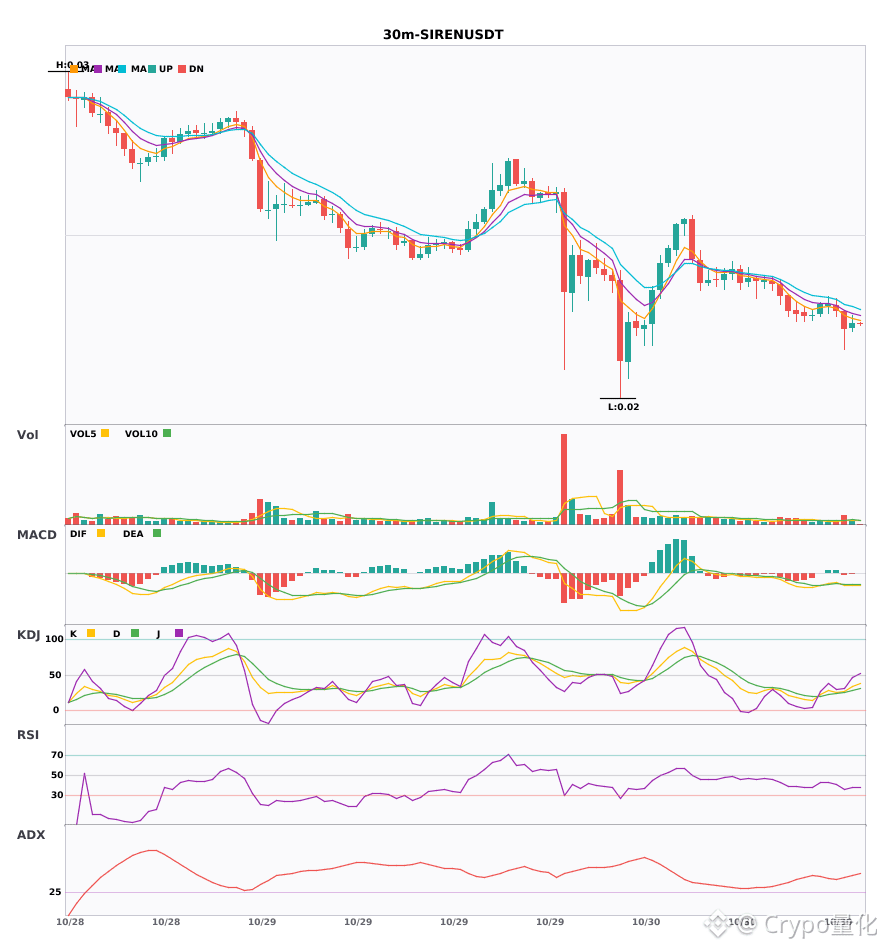
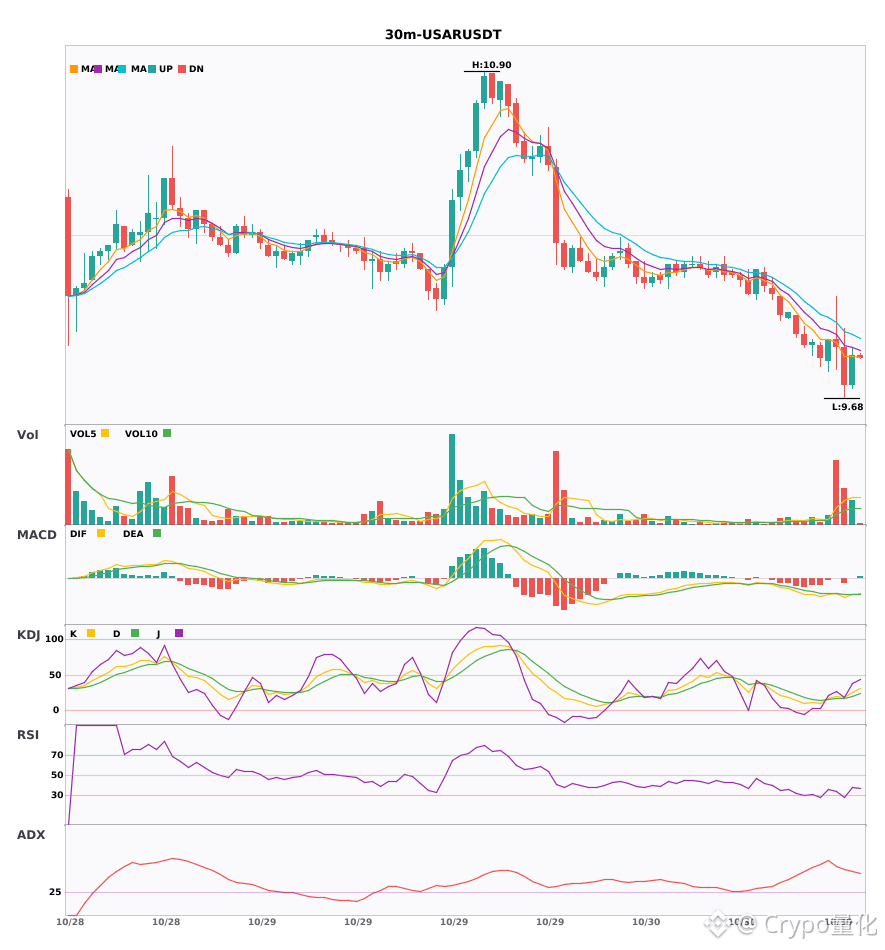
3 short alerts on the 30-minute timeframe: $AXTI / $SIREN / $USAR🔥
════════════════════
🟢 $AXTI 30-minute short signal
⚠️Technical analysis: ADX(29) Trend is forming; opportunity to participate | MACD bearish crossover below zero, bearish momentum accelerating | EMA5 < EMA8 < EMA13, bearish alignment | KDJ bearish crossover, short-term outlook is bearish (K is 26.6, D is 26.7) | Volume surge (5.6x)
════════════════════
🟢 $SIREN 30-minute short signal
⚠️Technical analysis: ADX(43) Clear trending market | MACD bearish crossover below zero, bearish momentum accelerating | EMA5 < EMA8 < EMA13, bearish alignment | KDJ showing weakness, bears have the upper hand (K is 27.2, D is 25.1) | Increased volume (2.0x)
════════════════════
🟢 $USAR 30-minute short signal
⚠️Technical analysis: ADX(52) Very strong trend (watch out for an overheated pullback) | MACD bearish crossover below zero, bearish momentum accelerating | EMA5 < EMA8 < EMA13, bearish alignment | KDJ in oversold territory; watch for rebound opportunities (K is 17.8, D is 17.2) | Volume surge (5.9x)
════════════════════
🔔 Follow to get real-time market alerts 🔔
#技术分析 #AXTI #SIREN #USAR
📌 When trading, check whether the candlestick pattern confirms the signal
3 short alerts on the 30-minute timeframe: $AXTI / $SIREN / $USAR 🔥
════════════════════
🟢 $AXTI 30-minute short signal
⚠️Technical analysis: ADX(29) Trend is forming; opportunity to participate | MACD bearish crossover below zero, bearish momentum accelerating | EMA5 < EMA8 < EMA13, bearish alignment | KDJ bearish crossover, short-term outlook is bearish (K is 26.6, D is 26.7) | Volume surge (5.6x)
════════════════════
🟢 $SIREN 30-minute short signal
⚠️Technical analysis: ADX(43) Clear trending market | MACD bearish crossover below zero, bearish momentum accelerating | EMA5 < EMA8 < EMA13, bearish alignment | KDJ showing weakness, bears have the upper hand (K is 27.2, D is 25.1) | Increased volume (2.0x)
════════════════════
🟢 $USAR 30-minute short signal
⚠️Technical analysis: ADX(52) Very strong trend (watch out for an overheated pullback) | MACD bearish crossover below zero, bearish momentum accelerating | EMA5 < EMA8 < EMA13, bearish alignment | KDJ in oversold territory; watch for rebound opportunities (K is 17.8, D is 17.2) | Volume surge (5.9x)
════════════════════
🔔 Follow to get real-time market alerts 🔔
#技术分析 #AXTI #SIREN #USAR
📌 When trading, check whether the candlestick pattern confirms the signal
════════════════════
🟢 $AXTI 30-minute short signal
⚠️Technical analysis: ADX(29) Trend is forming; opportunity to participate | MACD bearish crossover below zero, bearish momentum accelerating | EMA5 < EMA8 < EMA13, bearish alignment | KDJ bearish crossover, short-term outlook is bearish (K is 26.6, D is 26.7) | Volume surge (5.6x)
════════════════════
🟢 $SIREN 30-minute short signal
⚠️Technical analysis: ADX(43) Clear trending market | MACD bearish crossover below zero, bearish momentum accelerating | EMA5 < EMA8 < EMA13, bearish alignment | KDJ showing weakness, bears have the upper hand (K is 27.2, D is 25.1) | Increased volume (2.0x)
════════════════════
🟢 $USAR 30-minute short signal
⚠️Technical analysis: ADX(52) Very strong trend (watch out for an overheated pullback) | MACD bearish crossover below zero, bearish momentum accelerating | EMA5 < EMA8 < EMA13, bearish alignment | KDJ in oversold territory; watch for rebound opportunities (K is 17.8, D is 17.2) | Volume surge (5.9x)
════════════════════
🔔 Follow to get real-time market alerts 🔔
#技术分析 #AXTI #SIREN #USAR
📌 When trading, check whether the candlestick pattern confirms the signal
1
27
·
--
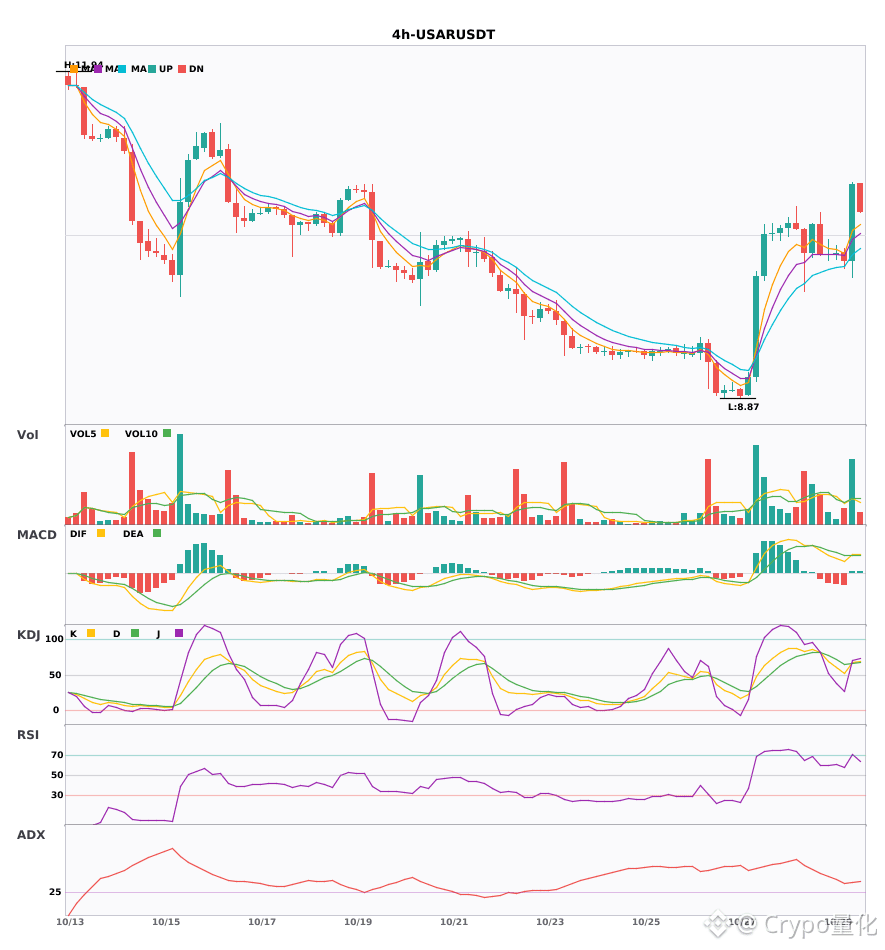
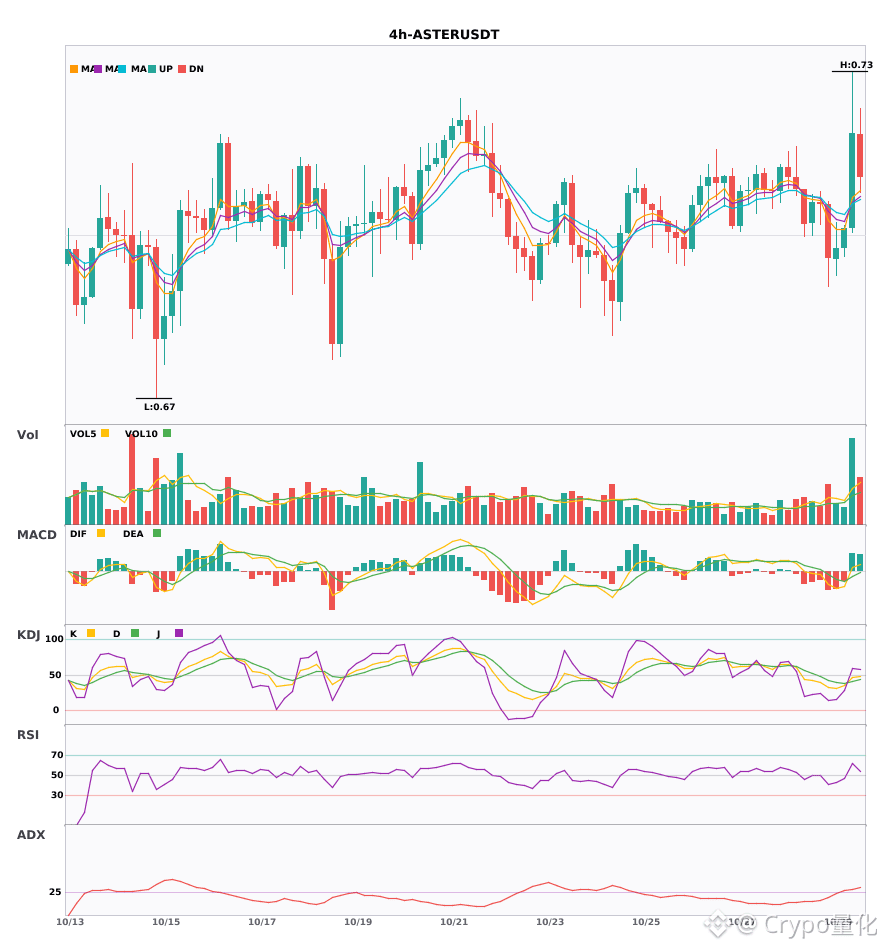
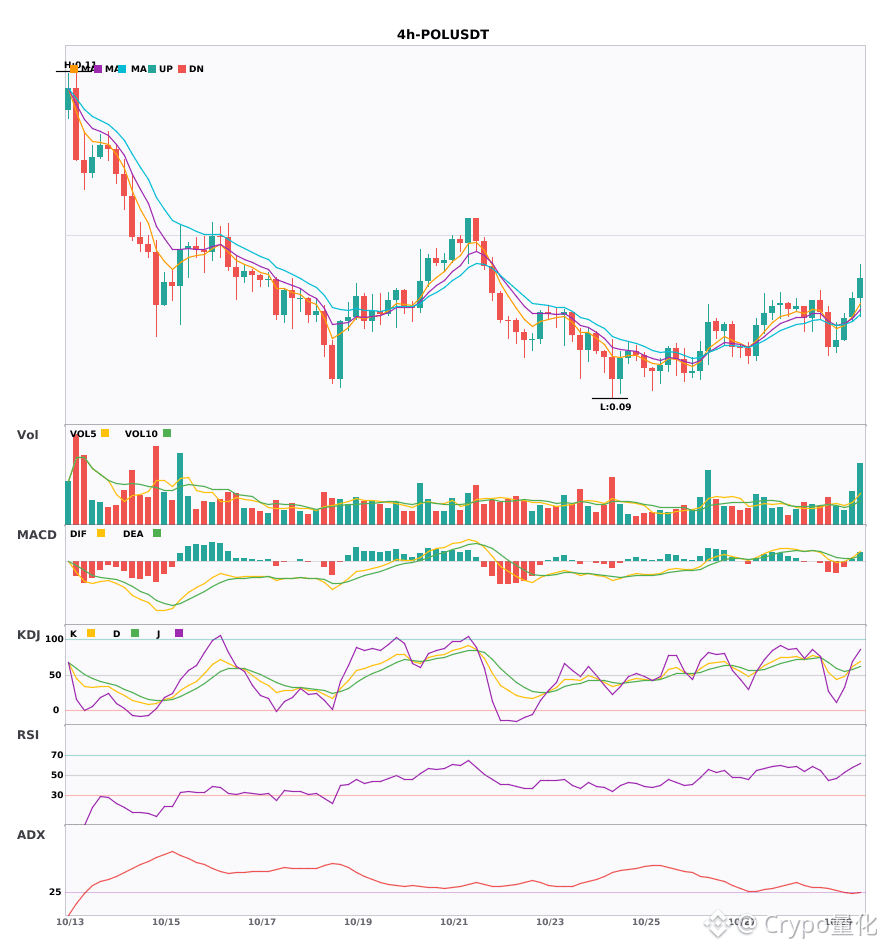
$USAR / $ASTER / $POL 4-hour confluence turns bullish, with bullish signals appearing simultaneously🔥
════════════════════
🔴 $USAR 4-hour bullish signal
⚠️Technical analysis: ADX(34) indicates a clear trending market | MACD golden cross above zero, releasing bullish momentum | EMA5 > EMA8 > EMA13, bullish alignment | KDJ golden cross, short-term bullish (K = 67.4, D = 65.8) | Volume expands (2.4x)
════════════════════
🔴 $ASTER 4-hour bullish signal
⚠️Technical analysis: ADX(34) indicates a clear trending market | MACD golden cross above zero, releasing bullish momentum | EMA5 crosses above EMA8, short-term bullish reversal | KDJ golden cross, short-term bullish (K = 46.8, D = 40.5) | Volume surges (2.9x)
════════════════════
🔴 $POL 4-hour bullish signal
⚠️Technical analysis: ADX(25) indicates a trend is forming, offering an opportunity to participate | MACD golden cross above zero, releasing bullish momentum | EMA5 crosses above EMA8, short-term bullish reversal | KDJ golden cross, short-term bullish (K = 61.2, D = 57.4) | Volume expands (1.7x)
════════════════════
🔔 Follow for the latest market movements 🔔
#技术分析 #USAR #ASTER #POL
📌 When trading, pay attention to whether the candlestick pattern confirms the signal
$USAR / $ASTER / $POL 4-hour confluence turns bullish, with bullish signals appearing simultaneously🔥
════════════════════
🔴 $USAR 4-hour bullish signal
⚠️Technical analysis: ADX(34) indicates a clear trending market | MACD golden cross above zero, releasing bullish momentum | EMA5 > EMA8 > EMA13, bullish alignment | KDJ golden cross, short-term bullish (K = 67.4, D = 65.8) | Volume expands (2.4x)
════════════════════
🔴 $ASTER 4-hour bullish signal
⚠️Technical analysis: ADX(34) indicates a clear trending market | MACD golden cross above zero, releasing bullish momentum | EMA5 crosses above EMA8, short-term bullish reversal | KDJ golden cross, short-term bullish (K = 46.8, D = 40.5) | Volume surges (2.9x)
════════════════════
🔴 $POL 4-hour bullish signal
⚠️Technical analysis: ADX(25) indicates a trend is forming, offering an opportunity to participate | MACD golden cross above zero, releasing bullish momentum | EMA5 crosses above EMA8, short-term bullish reversal | KDJ golden cross, short-term bullish (K = 61.2, D = 57.4) | Volume expands (1.7x)
════════════════════
🔔 Follow for the latest market movements 🔔
#技术分析 #USAR #ASTER #POL
📌 When trading, pay attention to whether the candlestick pattern confirms the signal
════════════════════
🔴 $USAR 4-hour bullish signal
⚠️Technical analysis: ADX(34) indicates a clear trending market | MACD golden cross above zero, releasing bullish momentum | EMA5 > EMA8 > EMA13, bullish alignment | KDJ golden cross, short-term bullish (K = 67.4, D = 65.8) | Volume expands (2.4x)
════════════════════
🔴 $ASTER 4-hour bullish signal
⚠️Technical analysis: ADX(34) indicates a clear trending market | MACD golden cross above zero, releasing bullish momentum | EMA5 crosses above EMA8, short-term bullish reversal | KDJ golden cross, short-term bullish (K = 46.8, D = 40.5) | Volume surges (2.9x)
════════════════════
🔴 $POL 4-hour bullish signal
⚠️Technical analysis: ADX(25) indicates a trend is forming, offering an opportunity to participate | MACD golden cross above zero, releasing bullish momentum | EMA5 crosses above EMA8, short-term bullish reversal | KDJ golden cross, short-term bullish (K = 61.2, D = 57.4) | Volume expands (1.7x)
════════════════════
🔔 Follow for the latest market movements 🔔
#技术分析 #USAR #ASTER #POL
📌 When trading, pay attention to whether the candlestick pattern confirms the signal
16

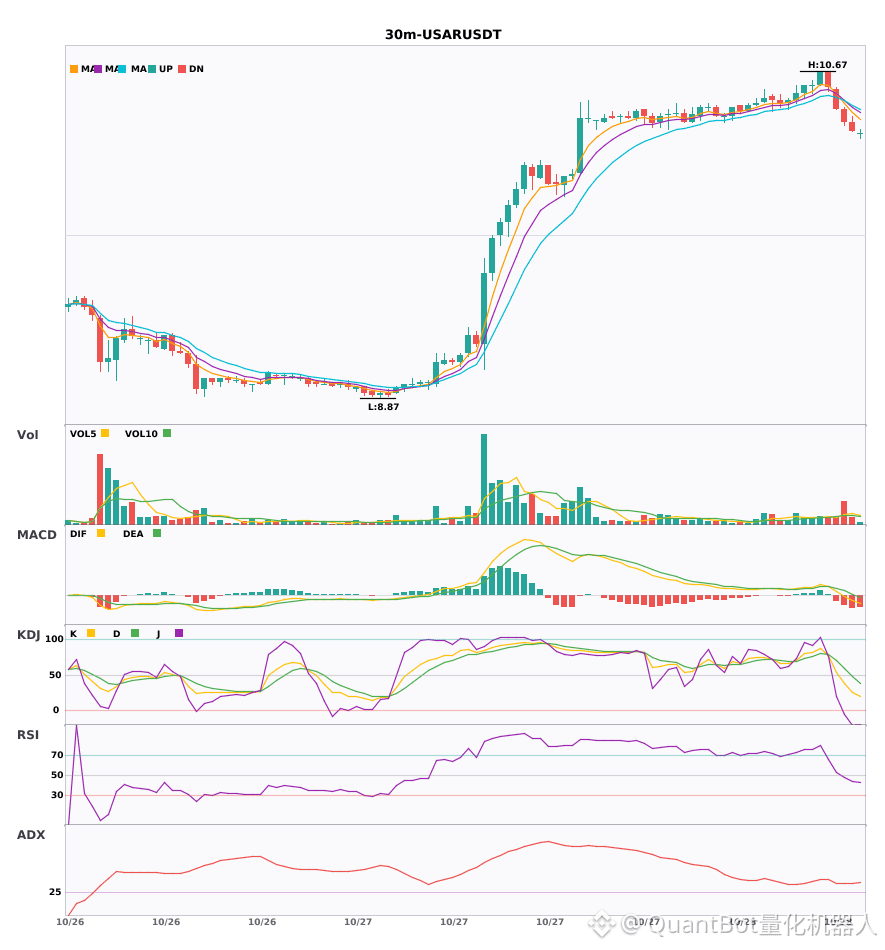
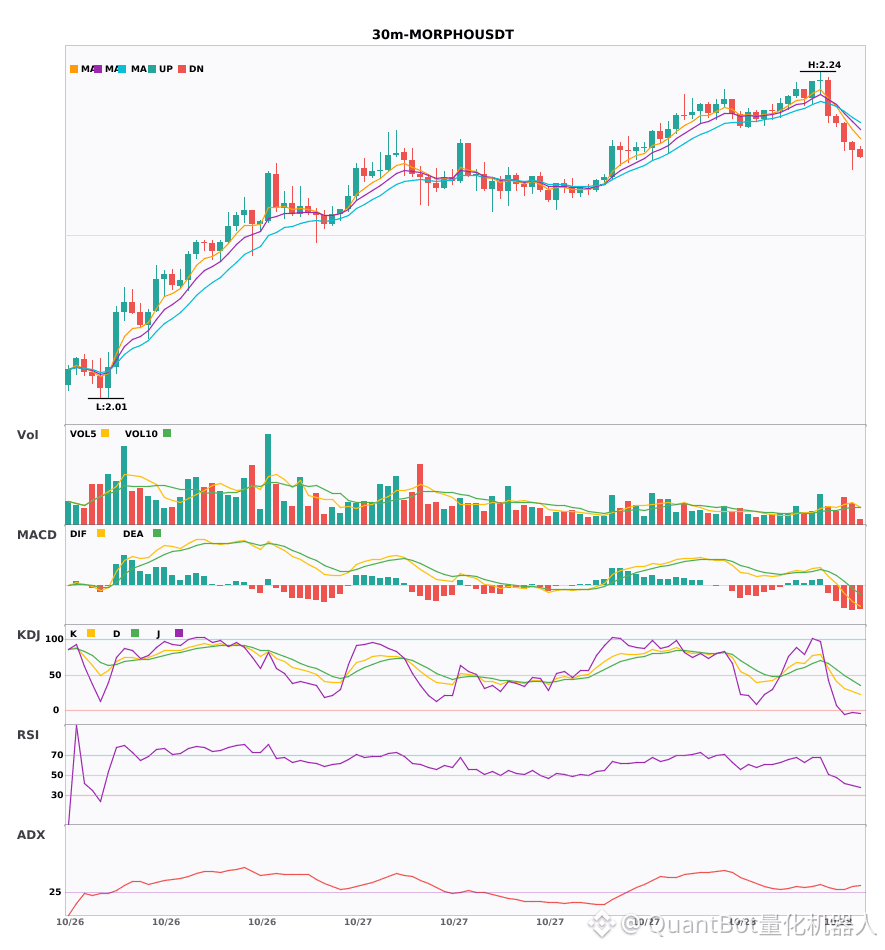
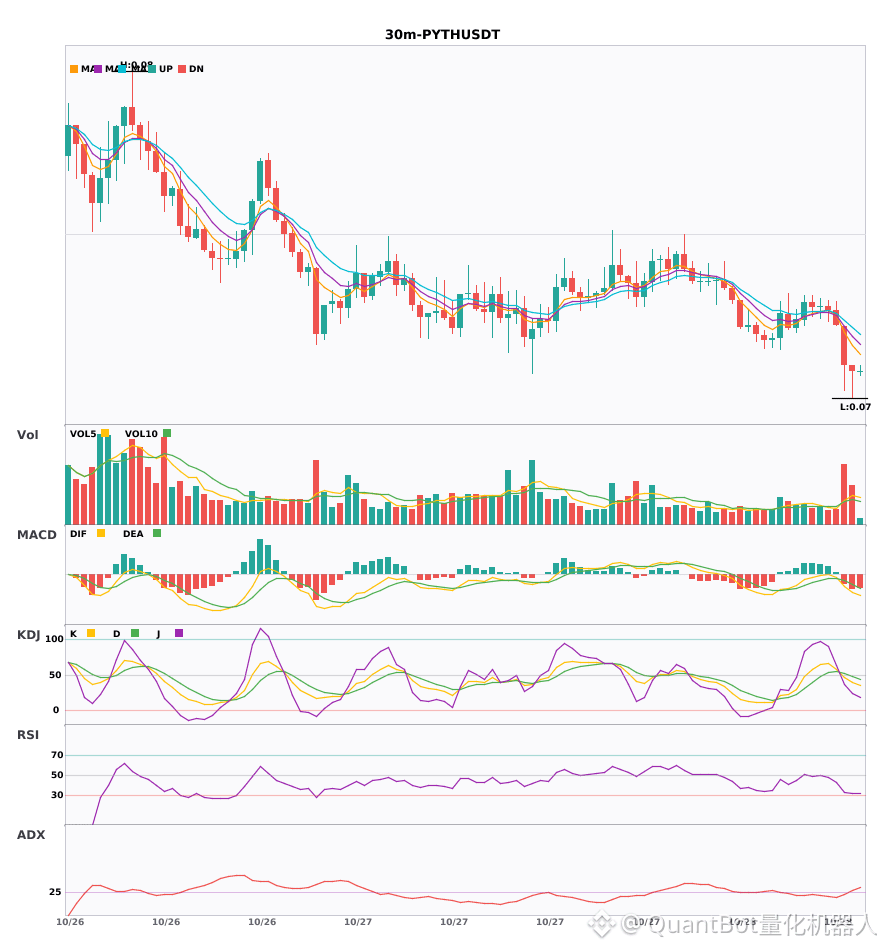
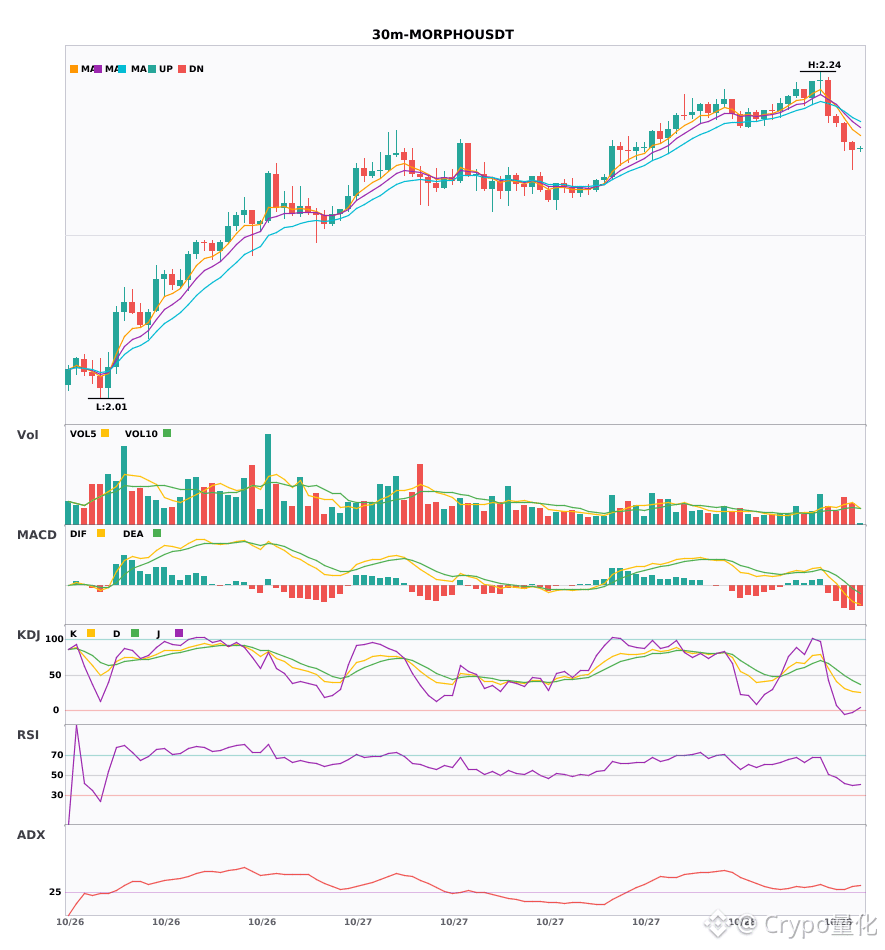
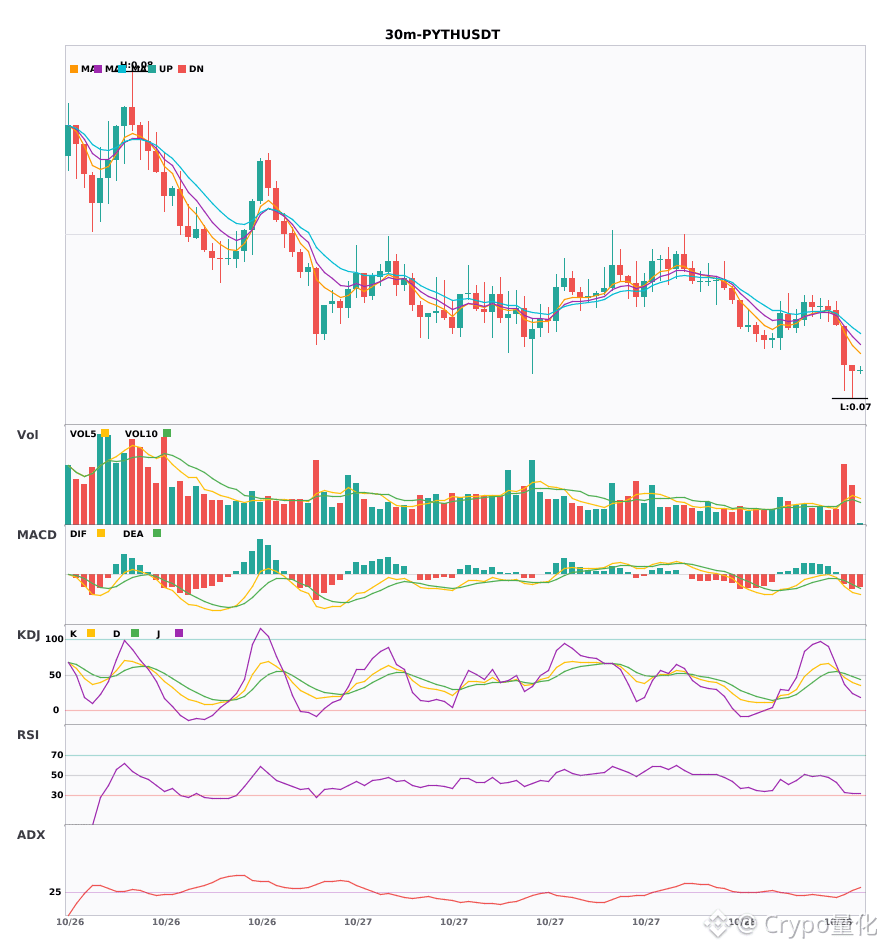
$USAR / $MORPHO / $PYTH 30-minute technicals are weakening in tandem; watch for risk
📉 $USAR | 30-minute bearish signal
━━━━━━━━━━━━━━━━━━
Technical analysis: ADX(35): Clear trending market | MACD is bearish, trend is weak, momentum is strengthening | EMA5 < EMA8 < EMA13, bearish alignment | KDJ is weak, bears have the upper hand (K: 25.2, D: 48.2) | Volume increased (2.5x)
Price change: -0.4800%
📉 $MORPHO | 30-minute bearish signal
━━━━━━━━━━━━━━━━━━
Technical analysis: ADX(30): Trend is forming; entry is possible | MACD DIF has fallen below the zero line, signaling a bearish trend | EMA5 < EMA8 < EMA13, bearish alignment | KDJ is weak, bears have the upper hand (K: 30.6, D: 48.9) | Volume increased (1.7x)
Price change: -0.6300%
📉 $PYTH | 30-minute bearish signal
━━━━━━━━━━━━━━━━━━
Technical analysis: ADX(25): Trend is forming; entry is possible | MACD bearish crossover below zero, bearish momentum accelerating | EMA5 < EMA8 < EMA13, bearish alignment | KDJ bearish crossover, bearish short-term outlook (K: 47.2, D: 52.6) | Volume surged (2.6x)
Price change: -1.0000%
━━━━━━━━━━━━━━━━━━
#技术分析 #USAR #MORPHO #PYTH
📌 The above is for reference only and does not constitute investment advice
$USAR / $MORPHO / $PYTH 30-minute technicals are weakening in tandem; watch for risk
📉 $USAR | 30-minute bearish signal
━━━━━━━━━━━━━━━━━━
Technical analysis: ADX(35): Clear trending market | MACD is bearish, trend is weak, momentum is strengthening | EMA5 < EMA8 < EMA13, bearish alignment | KDJ is weak, bears have the upper hand (K: 25.2, D: 48.2) | Volume increased (2.5x)
Price change: -0.4800%
📉 $MORPHO | 30-minute bearish signal
━━━━━━━━━━━━━━━━━━
Technical analysis: ADX(30): Trend is forming; entry is possible | MACD DIF has fallen below the zero line, signaling a bearish trend | EMA5 < EMA8 < EMA13, bearish alignment | KDJ is weak, bears have the upper hand (K: 30.6, D: 48.9) | Volume increased (1.7x)
Price change: -0.6300%
📉 $PYTH | 30-minute bearish signal
━━━━━━━━━━━━━━━━━━
Technical analysis: ADX(25): Trend is forming; entry is possible | MACD bearish crossover below zero, bearish momentum accelerating | EMA5 < EMA8 < EMA13, bearish alignment | KDJ bearish crossover, bearish short-term outlook (K: 47.2, D: 52.6) | Volume surged (2.6x)
Price change: -1.0000%
━━━━━━━━━━━━━━━━━━
#技术分析 #USAR #MORPHO #PYTH
📌 The above is for reference only and does not constitute investment advice
📉 $USAR | 30-minute bearish signal
━━━━━━━━━━━━━━━━━━
Technical analysis: ADX(35): Clear trending market | MACD is bearish, trend is weak, momentum is strengthening | EMA5 < EMA8 < EMA13, bearish alignment | KDJ is weak, bears have the upper hand (K: 25.2, D: 48.2) | Volume increased (2.5x)
Price change: -0.4800%
📉 $MORPHO | 30-minute bearish signal
━━━━━━━━━━━━━━━━━━
Technical analysis: ADX(30): Trend is forming; entry is possible | MACD DIF has fallen below the zero line, signaling a bearish trend | EMA5 < EMA8 < EMA13, bearish alignment | KDJ is weak, bears have the upper hand (K: 30.6, D: 48.9) | Volume increased (1.7x)
Price change: -0.6300%
📉 $PYTH | 30-minute bearish signal
━━━━━━━━━━━━━━━━━━
Technical analysis: ADX(25): Trend is forming; entry is possible | MACD bearish crossover below zero, bearish momentum accelerating | EMA5 < EMA8 < EMA13, bearish alignment | KDJ bearish crossover, bearish short-term outlook (K: 47.2, D: 52.6) | Volume surged (2.6x)
Price change: -1.0000%
━━━━━━━━━━━━━━━━━━
#技术分析 #USAR #MORPHO #PYTH
📌 The above is for reference only and does not constitute investment advice
9
·
--
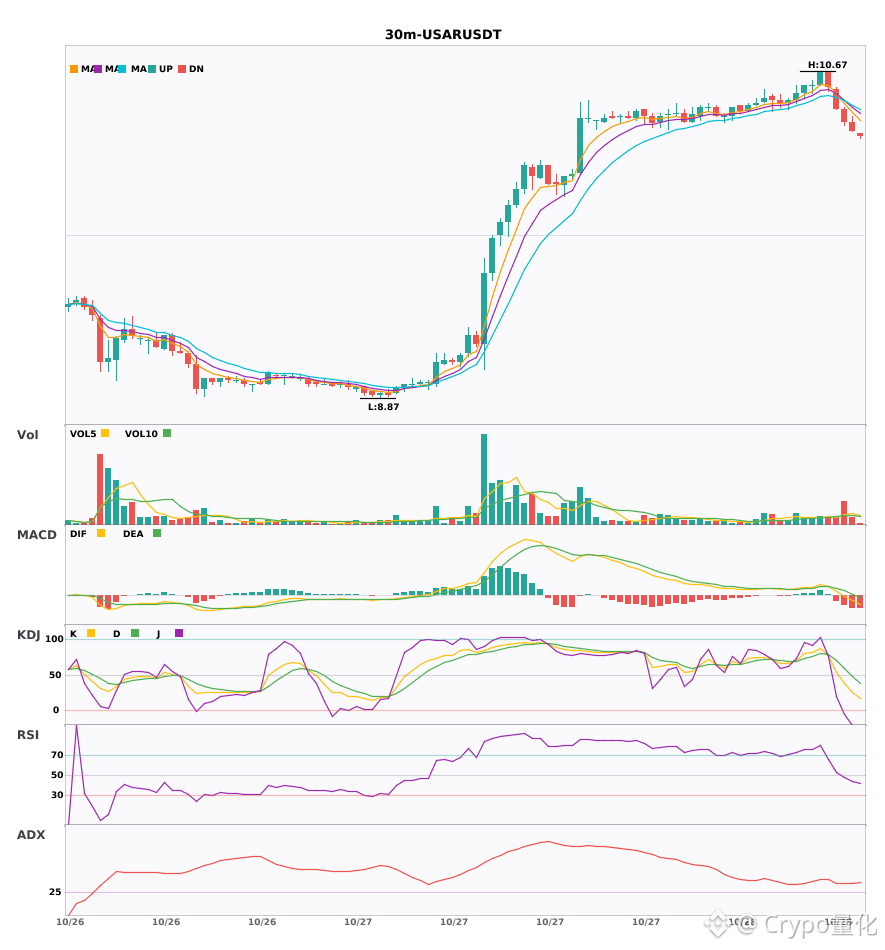
$USAR / $MORPHO / $PYTH 30-minute convergence turns bearish, with bearish signals appearing simultaneously 🔥
════════════════════
🟢 $USAR 30-minute bearish signal
⚠️ Technicals: ADX(35): clear trending market | MACD is bearish; trend is weak, with momentum strengthening | EMA5 < EMA8 < EMA13: bearish alignment | KDJ is weak, bears have the upper hand (K: 25.2, D: 48.2) | Volume increased (2.5x)
════════════════════
🟢 $MORPHO 30-minute bearish signal
⚠️ Technicals: ADX(30): trend is forming; entry is possible | MACD DIF falls below the zero line, turning the trend bearish | EMA5 < EMA8 < EMA13: bearish alignment | KDJ is weak, bears have the upper hand (K: 30.6, D: 48.9) | Volume increased (1.7x)
════════════════════
🟢 $PYTH 30-minute bearish signal
⚠️ Technicals: ADX(25): trend is forming; entry is possible | MACD bearish crossover below zero, bearish momentum accelerating | EMA5 < EMA8 < EMA13: bearish alignment | KDJ bearish crossover, short-term outlook is bearish (K: 47.2, D: 52.6) | Volume surged (2.6x)
════════════════════
🔔 Follow for the latest market movement alerts 🔔
#技术分析 #USAR #MORPHO #PYTH
📌 When trading, pay attention to whether the candlestick pattern confirms the signal
$USAR / $MORPHO / $PYTH 30-minute convergence turns bearish, with bearish signals appearing simultaneously 🔥
════════════════════
🟢 $USAR 30-minute bearish signal
⚠️ Technicals: ADX(35): clear trending market | MACD is bearish; trend is weak, with momentum strengthening | EMA5 < EMA8 < EMA13: bearish alignment | KDJ is weak, bears have the upper hand (K: 25.2, D: 48.2) | Volume increased (2.5x)
════════════════════
🟢 $MORPHO 30-minute bearish signal
⚠️ Technicals: ADX(30): trend is forming; entry is possible | MACD DIF falls below the zero line, turning the trend bearish | EMA5 < EMA8 < EMA13: bearish alignment | KDJ is weak, bears have the upper hand (K: 30.6, D: 48.9) | Volume increased (1.7x)
════════════════════
🟢 $PYTH 30-minute bearish signal
⚠️ Technicals: ADX(25): trend is forming; entry is possible | MACD bearish crossover below zero, bearish momentum accelerating | EMA5 < EMA8 < EMA13: bearish alignment | KDJ bearish crossover, short-term outlook is bearish (K: 47.2, D: 52.6) | Volume surged (2.6x)
════════════════════
🔔 Follow for the latest market movement alerts 🔔
#技术分析 #USAR #MORPHO #PYTH
📌 When trading, pay attention to whether the candlestick pattern confirms the signal
════════════════════
🟢 $USAR 30-minute bearish signal
⚠️ Technicals: ADX(35): clear trending market | MACD is bearish; trend is weak, with momentum strengthening | EMA5 < EMA8 < EMA13: bearish alignment | KDJ is weak, bears have the upper hand (K: 25.2, D: 48.2) | Volume increased (2.5x)
════════════════════
🟢 $MORPHO 30-minute bearish signal
⚠️ Technicals: ADX(30): trend is forming; entry is possible | MACD DIF falls below the zero line, turning the trend bearish | EMA5 < EMA8 < EMA13: bearish alignment | KDJ is weak, bears have the upper hand (K: 30.6, D: 48.9) | Volume increased (1.7x)
════════════════════
🟢 $PYTH 30-minute bearish signal
⚠️ Technicals: ADX(25): trend is forming; entry is possible | MACD bearish crossover below zero, bearish momentum accelerating | EMA5 < EMA8 < EMA13: bearish alignment | KDJ bearish crossover, short-term outlook is bearish (K: 47.2, D: 52.6) | Volume surged (2.6x)
════════════════════
🔔 Follow for the latest market movement alerts 🔔
#技术分析 #USAR #MORPHO #PYTH
📌 When trading, pay attention to whether the candlestick pattern confirms the signal
7

·
--
See translation
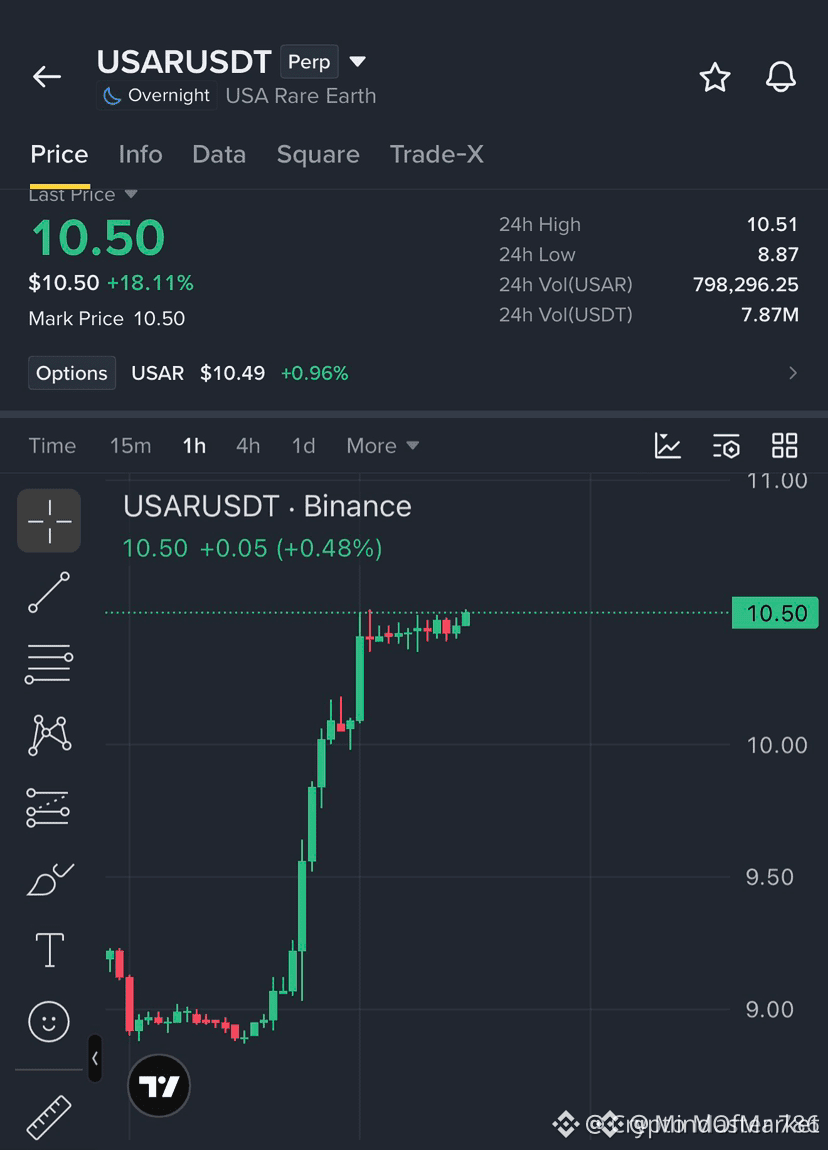
🚀 $USAR ROARS 18% HIGH – NEXT LONG ZONE AHEAD! 🟢
Entry: 10.35-10.45 ⚡
Target: 10.60/10.80/11.00 🚀
Stop Loss: 10.15 ⚠️
📊 Smart‑money is loading the 10.35‑10.45 demand block after a clean liquidity sweep, with volume spikes confirming aggressive buying. 🦈 The pullback acted as a short‑cover rally, resetting the order block for a fresh bullish thrust. ⚡ With the market now perched above the recent high, the setup offers a multi‑tiered upside that aligns with historic swing patterns. 📌 Risk‑to‑reward remains attractive, but patience is key—let the price respect the block before stepping in.
💬 Are you sizing in at the 10.35‑10.45 zone or waiting for the next liquidity test? 👇
⚠️ Not financial advice. Always manage your risk. 🛡️
🏷️ #USAR #LongSetup #Bullish #Crypto
🔥 💎
🚀 $USAR ROARS 18% HIGH – NEXT LONG ZONE AHEAD! 🟢
Entry: 10.35-10.45 ⚡
Target: 10.60/10.80/11.00 🚀
Stop Loss: 10.15 ⚠️
📊 Smart‑money is loading the 10.35‑10.45 demand block after a clean liquidity sweep, with volume spikes confirming aggressive buying. 🦈 The pullback acted as a short‑cover rally, resetting the order block for a fresh bullish thrust. ⚡ With the market now perched above the recent high, the setup offers a multi‑tiered upside that aligns with historic swing patterns. 📌 Risk‑to‑reward remains attractive, but patience is key—let the price respect the block before stepping in.
💬 Are you sizing in at the 10.35‑10.45 zone or waiting for the next liquidity test? 👇
⚠️ Not financial advice. Always manage your risk. 🛡️
🏷️ #USAR #LongSetup #Bullish #Crypto
🔥 💎
Entry: 10.35-10.45 ⚡
Target: 10.60/10.80/11.00 🚀
Stop Loss: 10.15 ⚠️
📊 Smart‑money is loading the 10.35‑10.45 demand block after a clean liquidity sweep, with volume spikes confirming aggressive buying. 🦈 The pullback acted as a short‑cover rally, resetting the order block for a fresh bullish thrust. ⚡ With the market now perched above the recent high, the setup offers a multi‑tiered upside that aligns with historic swing patterns. 📌 Risk‑to‑reward remains attractive, but patience is key—let the price respect the block before stepping in.
💬 Are you sizing in at the 10.35‑10.45 zone or waiting for the next liquidity test? 👇
⚠️ Not financial advice. Always manage your risk. 🛡️
🏷️ #USAR #LongSetup #Bullish #Crypto
🔥 💎
11

See translation
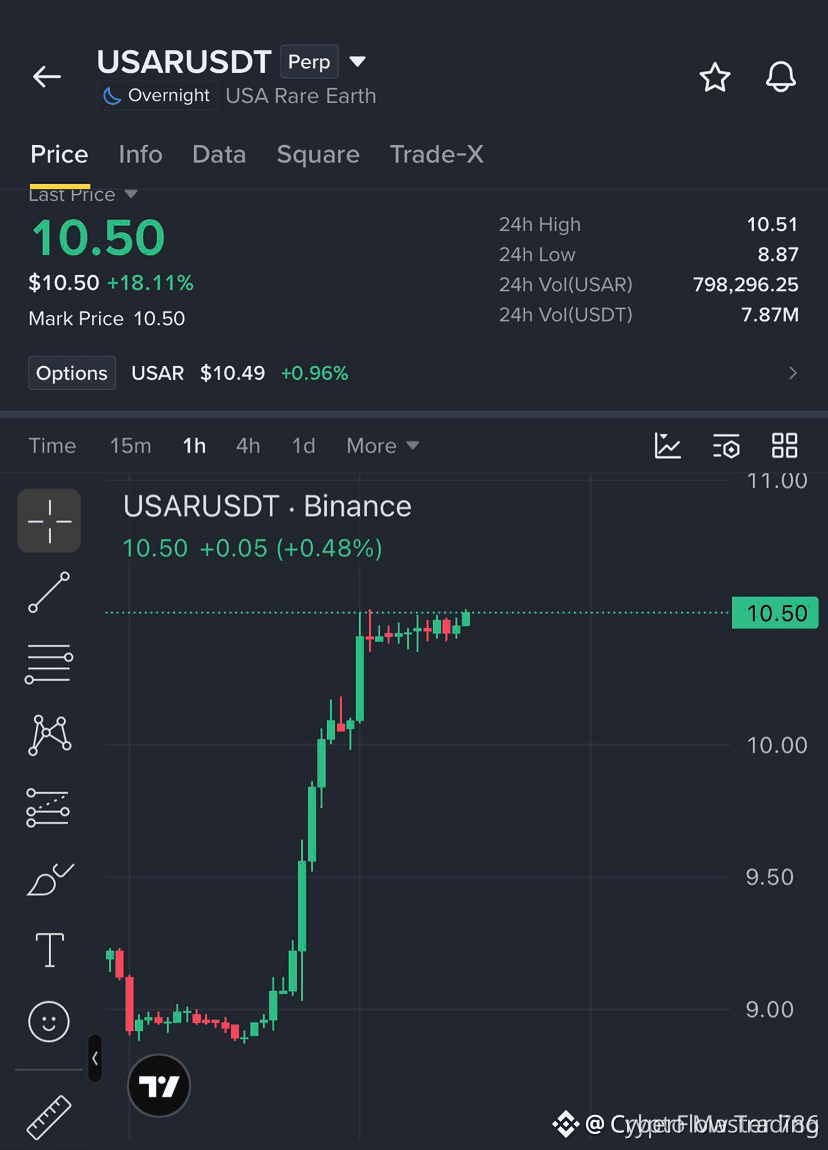
🚀 $USAR SURGES 18% ON BULLISH MOMENTUM – READY FOR THE NEXT LONG? 📈
Entry: 10.35-10.45 ⚡
Target: 10.60 / 10.80 / 11.00 🚀
Stop Loss: 10.15 ⚠️
🦈 Smart money is loading the order block around $10.40, flipping the recent pullback into fresh buying pressure. 📊 Volume on the 4H is expanding, and the RSI is climbing out of oversold territory, hinting at a sustained rally. ⚡ Keep eyes on the $10.20 support; a break there could turn the tide into a short‑term retrace.
💬 Are you stacking bids in this zone or waiting for the next liquidity sweep? 👇
⚠️ Not financial advice. Always manage your risk. 🛡️
🏷️ #USAR #LongSetup #Bullish #Momentum #Crypto
🔥 💎
🚀 $USAR SURGES 18% ON BULLISH MOMENTUM – READY FOR THE NEXT LONG? 📈
Entry: 10.35-10.45 ⚡
Target: 10.60 / 10.80 / 11.00 🚀
Stop Loss: 10.15 ⚠️
🦈 Smart money is loading the order block around $10.40, flipping the recent pullback into fresh buying pressure. 📊 Volume on the 4H is expanding, and the RSI is climbing out of oversold territory, hinting at a sustained rally. ⚡ Keep eyes on the $10.20 support; a break there could turn the tide into a short‑term retrace.
💬 Are you stacking bids in this zone or waiting for the next liquidity sweep? 👇
⚠️ Not financial advice. Always manage your risk. 🛡️
🏷️ #USAR #LongSetup #Bullish #Momentum #Crypto
🔥 💎
Entry: 10.35-10.45 ⚡
Target: 10.60 / 10.80 / 11.00 🚀
Stop Loss: 10.15 ⚠️
🦈 Smart money is loading the order block around $10.40, flipping the recent pullback into fresh buying pressure. 📊 Volume on the 4H is expanding, and the RSI is climbing out of oversold territory, hinting at a sustained rally. ⚡ Keep eyes on the $10.20 support; a break there could turn the tide into a short‑term retrace.
💬 Are you stacking bids in this zone or waiting for the next liquidity sweep? 👇
⚠️ Not financial advice. Always manage your risk. 🛡️
🏷️ #USAR #LongSetup #Bullish #Momentum #Crypto
🔥 💎
4

·
--
Bullish
See translation
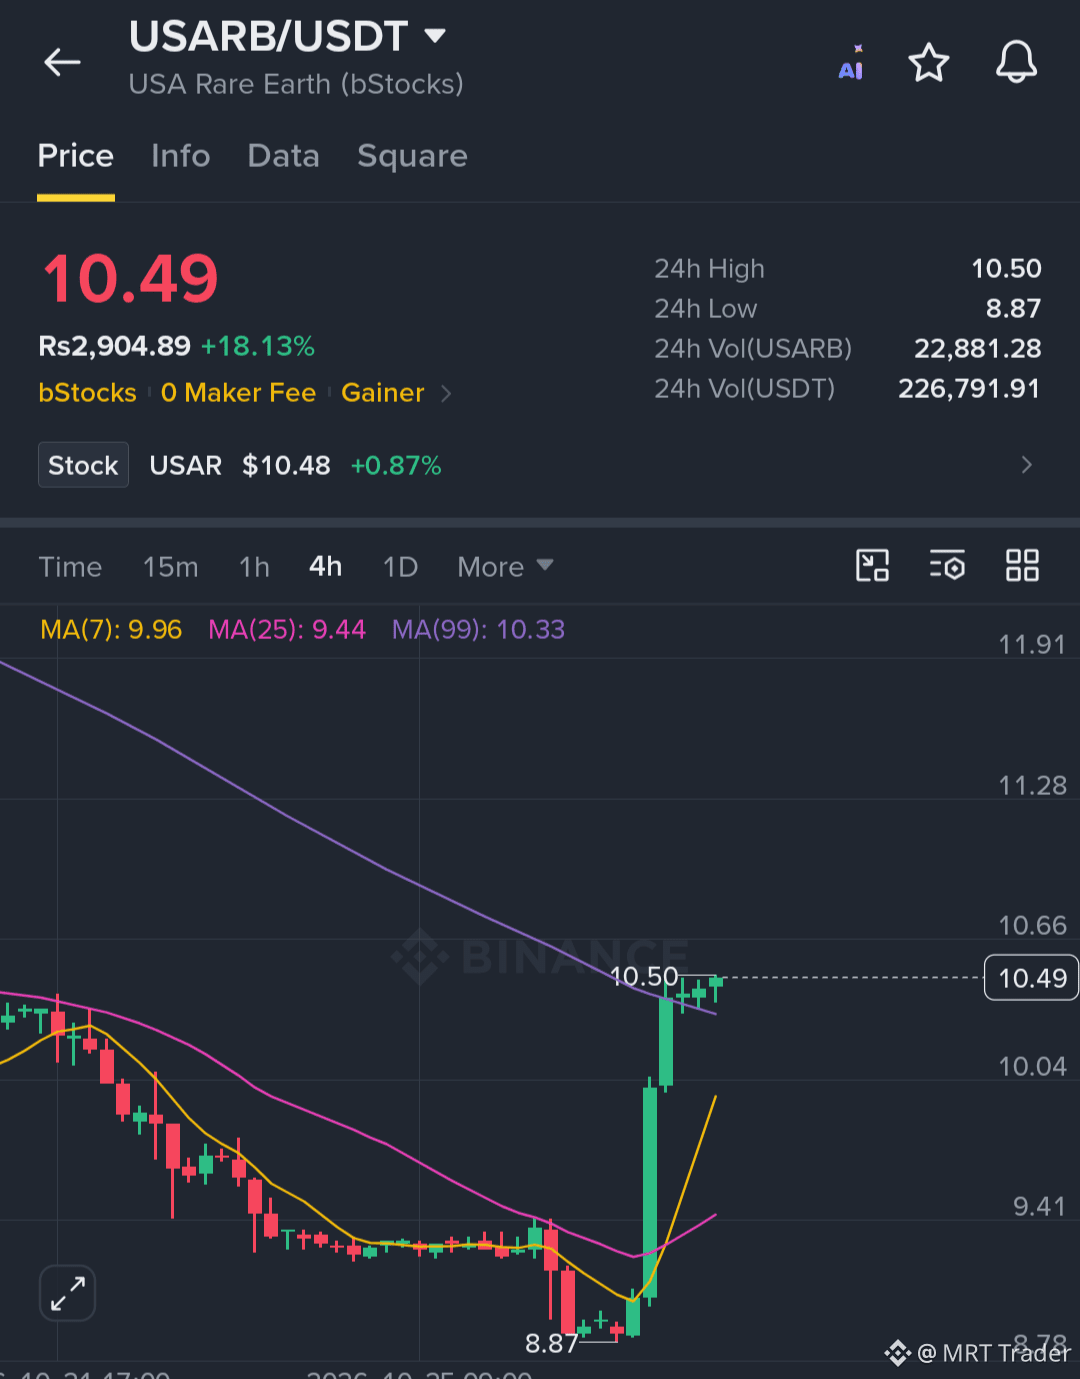
$USAR is showing powerful bullish momentum, up over 18%. I'm watching for another long opportunity after a confirmed pullback.
Key Level:
🟢 Bullish above: 10.55
Trade Setup (Long):
🟢 Entry Zone: 10.33 – 10.43
🎯 Targets: 10.62 / 10.82 / 11.02
⛔ Stop Loss: 10.13
Manage your risk and avoid chasing the pump. Wait for a confirmed pullback into the zone, and keep your size small.
Click here to buy now 👉 $USAR
{future}(USARUSDT)
#USAR #CanMicrosoftDeliverOnAI
$USAR is showing powerful bullish momentum, up over 18%. I'm watching for another long opportunity after a confirmed pullback.
Key Level:
🟢 Bullish above: 10.55
Trade Setup (Long):
🟢 Entry Zone: 10.33 – 10.43
🎯 Targets: 10.62 / 10.82 / 11.02
⛔ Stop Loss: 10.13
Manage your risk and avoid chasing the pump. Wait for a confirmed pullback into the zone, and keep your size small.
Click here to buy now 👉 $USAR
#USAR #CanMicrosoftDeliverOnAI
Key Level:
🟢 Bullish above: 10.55
Trade Setup (Long):
🟢 Entry Zone: 10.33 – 10.43
🎯 Targets: 10.62 / 10.82 / 11.02
⛔ Stop Loss: 10.13
Manage your risk and avoid chasing the pump. Wait for a confirmed pullback into the zone, and keep your size small.
Click here to buy now 👉 $USAR
#USAR #CanMicrosoftDeliverOnAI
11
See translation
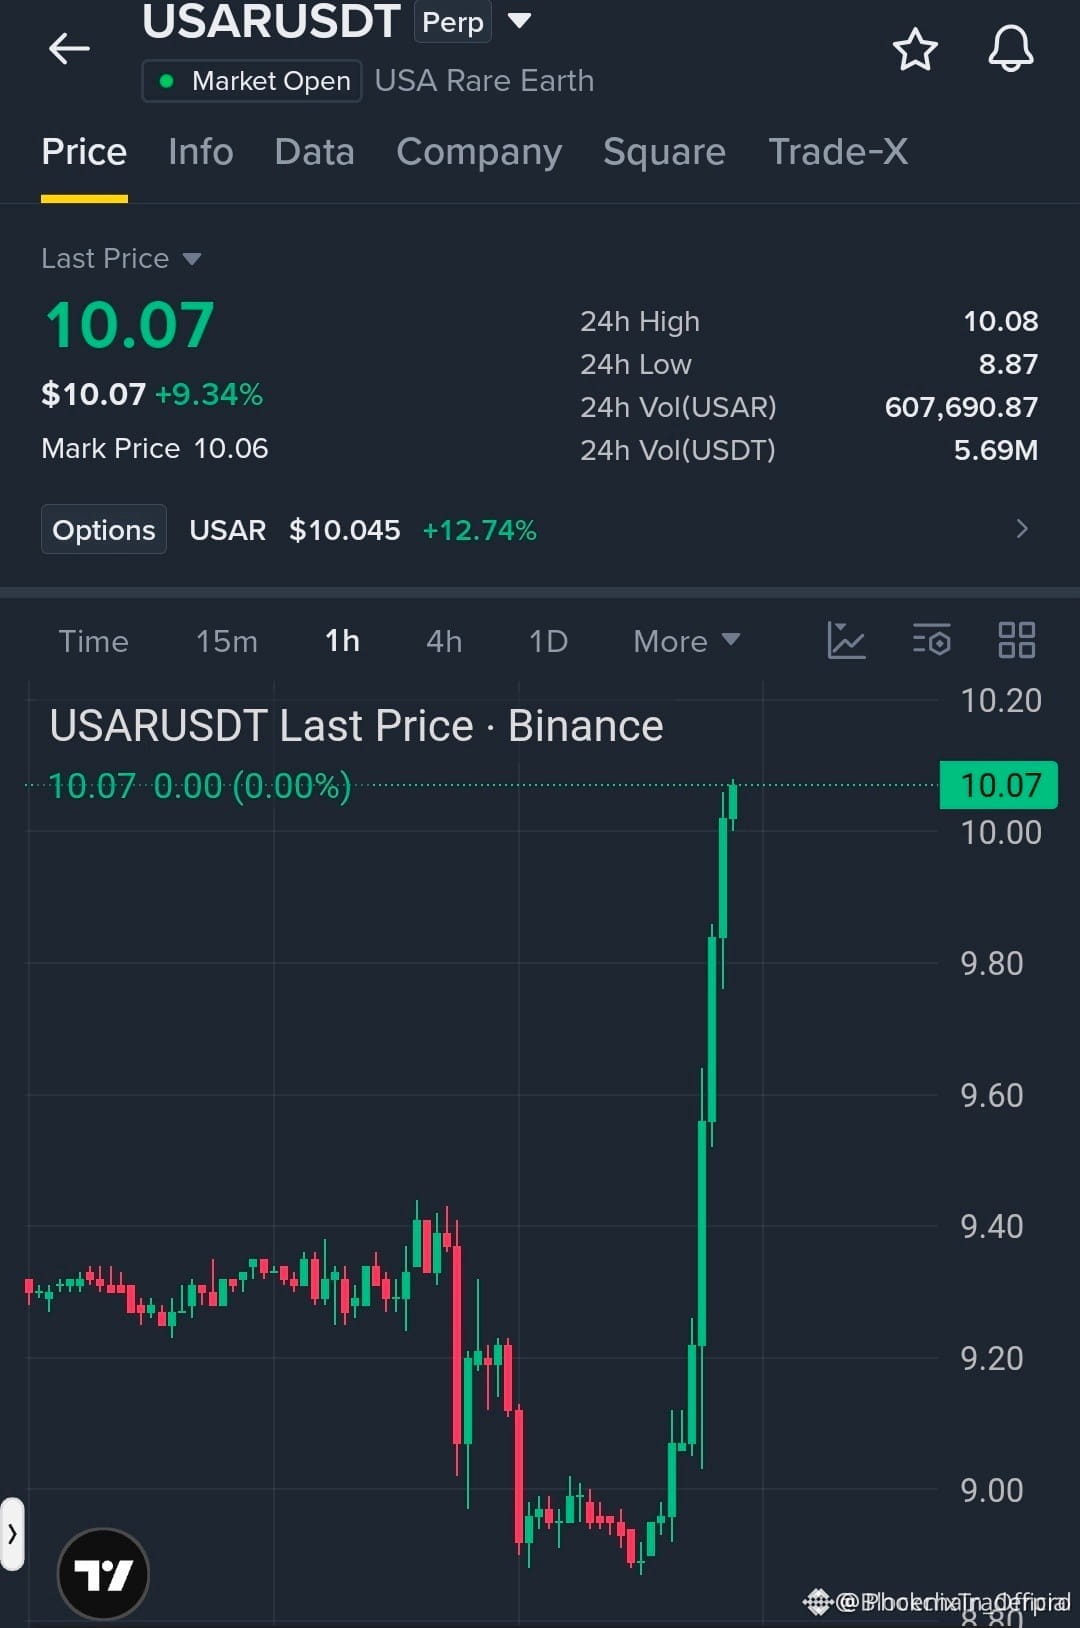
🚀 $USAR SKYROCKETS PAST $10.00 ON RAMPED BULLISH SWEEP!
Entry: 10.08 ⚡
Buyers are ripping through the $10.00 ceiling, slamming the order book and flashing a clean 9% surge. 📊 The volume spike on the 15‑minute chart screams liquidity sweep, and the price is now charging toward $10.08 with raw momentum. ⚡
If the bulls can lock the recent high, the next leg could thrust us into fresh upside territory, riding the wave of smart‑money inflow. 🌊 Keep eyes on the $10.00 pivot as a potential swing point and let the candle close confirm the next push. 📌 💬 Are you stacking bids above $10.08 or waiting for a retest? 👇
⚠️ Not financial advice. Always manage your risk. 🛡️
🏷️ #USAR #LongSetup #Breakout #Momentum #Crypto
🔥 💎
🚀 $USAR SKYROCKETS PAST $10.00 ON RAMPED BULLISH SWEEP!
Entry: 10.08 ⚡
Buyers are ripping through the $10.00 ceiling, slamming the order book and flashing a clean 9% surge. 📊 The volume spike on the 15‑minute chart screams liquidity sweep, and the price is now charging toward $10.08 with raw momentum. ⚡
If the bulls can lock the recent high, the next leg could thrust us into fresh upside territory, riding the wave of smart‑money inflow. 🌊 Keep eyes on the $10.00 pivot as a potential swing point and let the candle close confirm the next push. 📌 💬 Are you stacking bids above $10.08 or waiting for a retest? 👇
⚠️ Not financial advice. Always manage your risk. 🛡️
🏷️ #USAR #LongSetup #Breakout #Momentum #Crypto
🔥 💎
Entry: 10.08 ⚡
Buyers are ripping through the $10.00 ceiling, slamming the order book and flashing a clean 9% surge. 📊 The volume spike on the 15‑minute chart screams liquidity sweep, and the price is now charging toward $10.08 with raw momentum. ⚡
If the bulls can lock the recent high, the next leg could thrust us into fresh upside territory, riding the wave of smart‑money inflow. 🌊 Keep eyes on the $10.00 pivot as a potential swing point and let the candle close confirm the next push. 📌 💬 Are you stacking bids above $10.08 or waiting for a retest? 👇
⚠️ Not financial advice. Always manage your risk. 🛡️
🏷️ #USAR #LongSetup #Breakout #Momentum #Crypto
🔥 💎
4

See translation
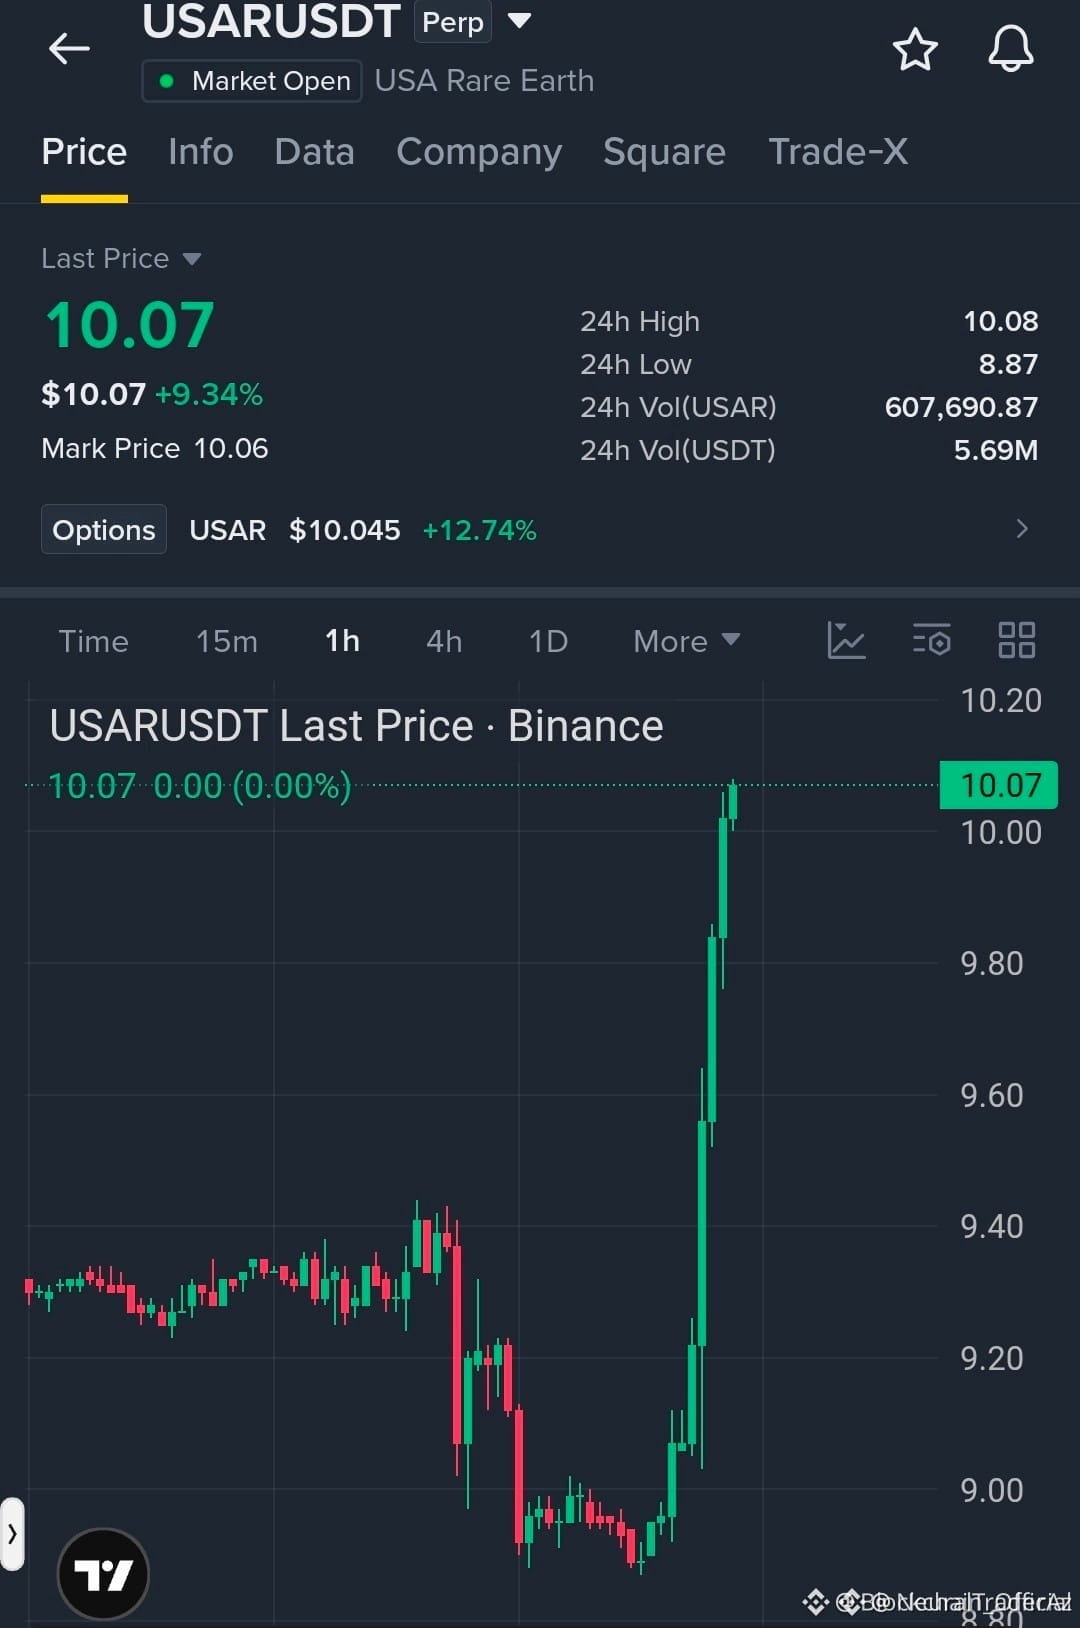
🚀 $USAR SKYROCKETS PAST $10.00, BULLISH MOMENTUM UNLEASHED! 📈
📊 The $10.00 zone has acted as a robust demand block, swallowing sell pressure three times this week. 🦈 Smart‑money liquidity is now stacked above $10.08, and every upward tick is met with expanding volume, confirming institutional accumulation. ⚡ If bulls pierce the recent high, the next swing target lies in the $10.20‑$10.30 corridor, echoing the pattern from last month’s breakout.
💬 How are you positioning for the next leg above $10.08? 👇
⚠️ Not financial advice. Always manage your risk. 🛡️
🏷️ #USAR #LongSetup #Breakout #Crypto
🔥 💎
🚀 $USAR SKYROCKETS PAST $10.00, BULLISH MOMENTUM UNLEASHED! 📈
📊 The $10.00 zone has acted as a robust demand block, swallowing sell pressure three times this week. 🦈 Smart‑money liquidity is now stacked above $10.08, and every upward tick is met with expanding volume, confirming institutional accumulation. ⚡ If bulls pierce the recent high, the next swing target lies in the $10.20‑$10.30 corridor, echoing the pattern from last month’s breakout.
💬 How are you positioning for the next leg above $10.08? 👇
⚠️ Not financial advice. Always manage your risk. 🛡️
🏷️ #USAR #LongSetup #Breakout #Crypto
🔥 💎
📊 The $10.00 zone has acted as a robust demand block, swallowing sell pressure three times this week. 🦈 Smart‑money liquidity is now stacked above $10.08, and every upward tick is met with expanding volume, confirming institutional accumulation. ⚡ If bulls pierce the recent high, the next swing target lies in the $10.20‑$10.30 corridor, echoing the pattern from last month’s breakout.
💬 How are you positioning for the next leg above $10.08? 👇
⚠️ Not financial advice. Always manage your risk. 🛡️
🏷️ #USAR #LongSetup #Breakout #Crypto
🔥 💎
5
·
--
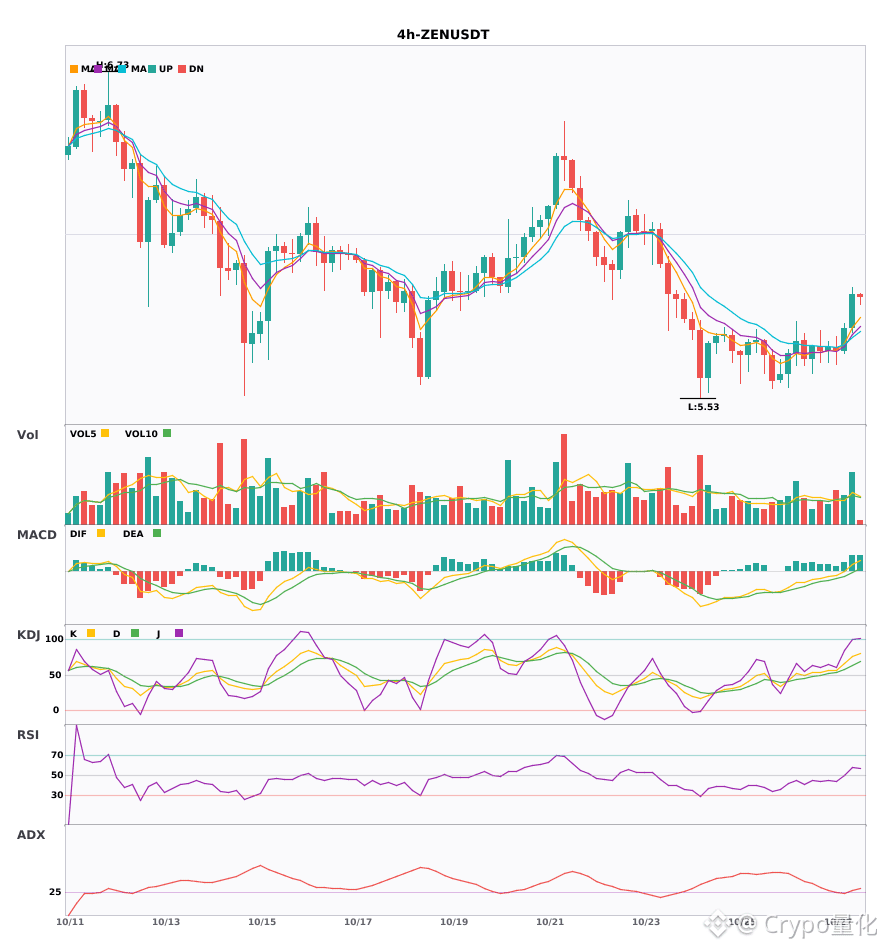
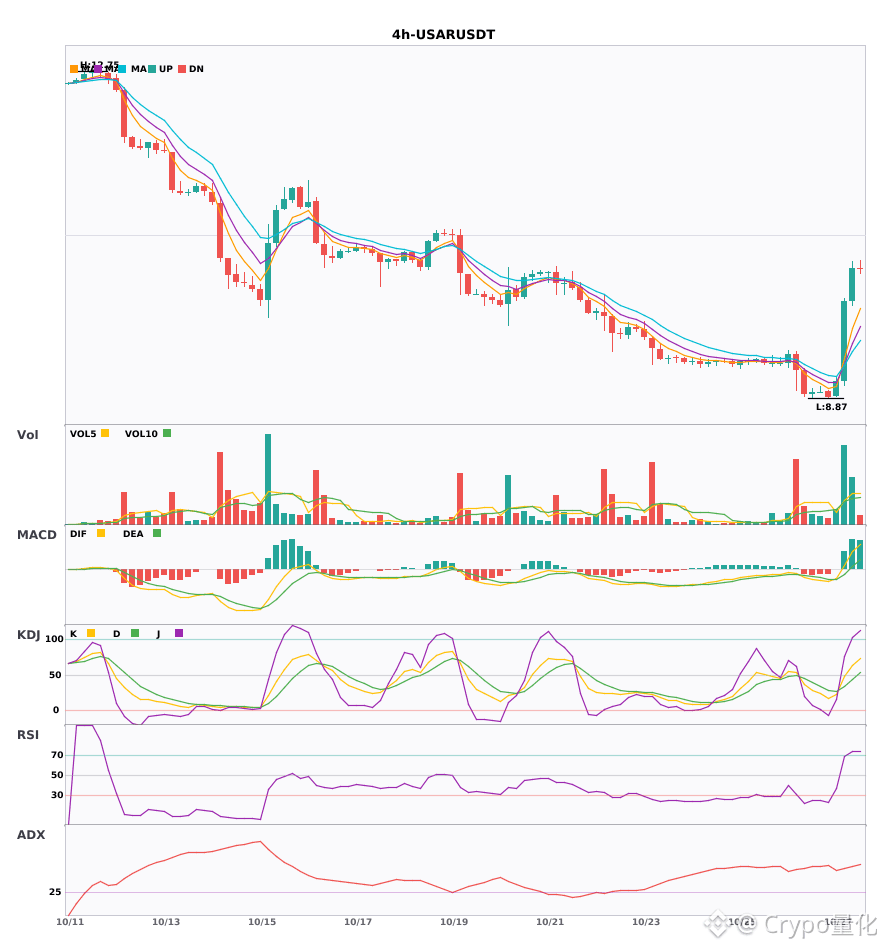
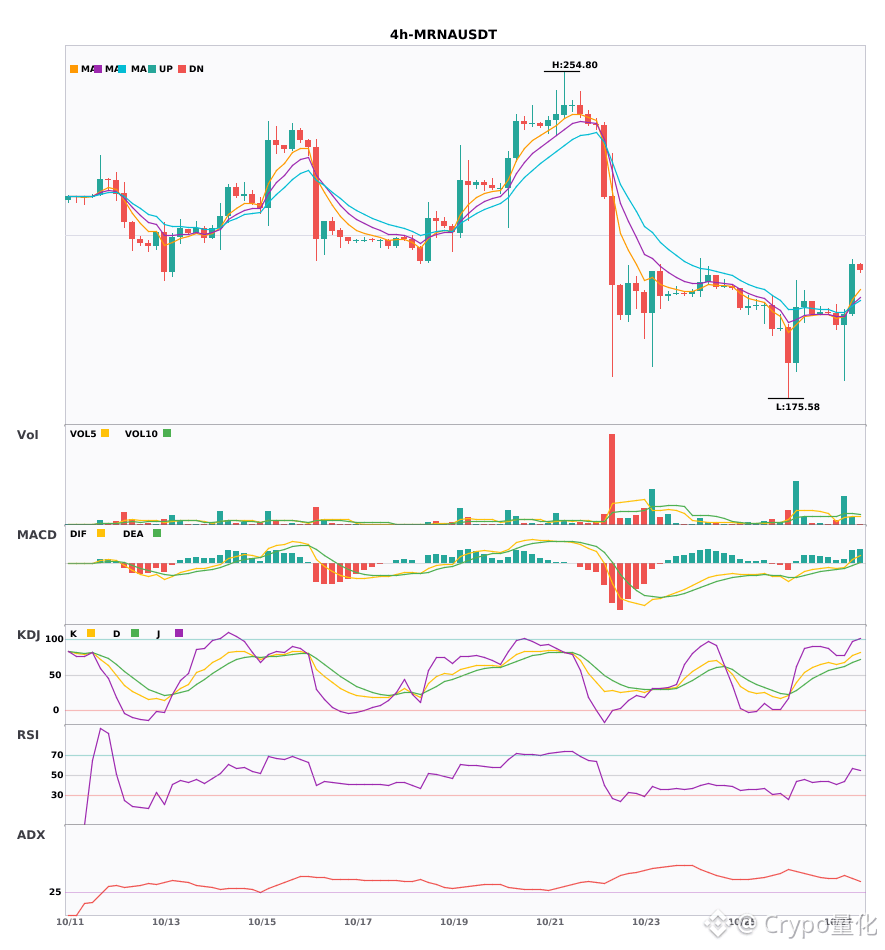
$ZEN / $USAR / $MRNA 4 Hourly bullish signals, with a short-term confluence opportunity 🔥
════════════════════
🔴 $ZEN 4-hour bullish signal
⚠️ Technical analysis: ADX(29) Trend is forming; opportunity to participate | MACD DIF has crossed above zero, signaling a bullish trend | EMA5 > EMA8 > EMA13, bullish alignment | KDJ is moving strongly, with bulls in control (K: 75.4, D: 63.6) | Volume increased (1.7x)
════════════════════
🔴 $USAR 4-hour bullish signal
⚠️ Technical analysis: ADX(51) Very strong trend (beware of overheating and a pullback) | MACD DIF has crossed above zero, signaling a bullish trend | EMA5 has crossed above EMA8, turning bullish in the short term | KDJ golden cross, bullish short-term outlook (K: 47.5, D: 33.6) | Volume surged (3.4x)
════════════════════
🔴 $MRNA 4-hour bullish signal
⚠️ Technical analysis: ADX(39) Clear trending market | MACD DIF has crossed above zero, signaling a bullish trend | EMA5 has crossed above EMA8, turning bullish in the short term | KDJ is moving strongly, with bulls in control (K: 77.0, D: 66.9) | Volume surged (2.6x)
════════════════════
🔔 Follow for first-hand market updates 🔔
#技术分析 #ZEN #USAR #MRNA
📌 When trading, pay attention to whether the candlestick pattern confirms the signal
$ZEN / $USAR / $MRNA 4 Hourly bullish signals, with a short-term confluence opportunity 🔥
════════════════════
🔴 $ZEN 4-hour bullish signal
⚠️ Technical analysis: ADX(29) Trend is forming; opportunity to participate | MACD DIF has crossed above zero, signaling a bullish trend | EMA5 > EMA8 > EMA13, bullish alignment | KDJ is moving strongly, with bulls in control (K: 75.4, D: 63.6) | Volume increased (1.7x)
════════════════════
🔴 $USAR 4-hour bullish signal
⚠️ Technical analysis: ADX(51) Very strong trend (beware of overheating and a pullback) | MACD DIF has crossed above zero, signaling a bullish trend | EMA5 has crossed above EMA8, turning bullish in the short term | KDJ golden cross, bullish short-term outlook (K: 47.5, D: 33.6) | Volume surged (3.4x)
════════════════════
🔴 $MRNA 4-hour bullish signal
⚠️ Technical analysis: ADX(39) Clear trending market | MACD DIF has crossed above zero, signaling a bullish trend | EMA5 has crossed above EMA8, turning bullish in the short term | KDJ is moving strongly, with bulls in control (K: 77.0, D: 66.9) | Volume surged (2.6x)
════════════════════
🔔 Follow for first-hand market updates 🔔
#技术分析 #ZEN #USAR #MRNA
📌 When trading, pay attention to whether the candlestick pattern confirms the signal
════════════════════
🔴 $ZEN 4-hour bullish signal
⚠️ Technical analysis: ADX(29) Trend is forming; opportunity to participate | MACD DIF has crossed above zero, signaling a bullish trend | EMA5 > EMA8 > EMA13, bullish alignment | KDJ is moving strongly, with bulls in control (K: 75.4, D: 63.6) | Volume increased (1.7x)
════════════════════
🔴 $USAR 4-hour bullish signal
⚠️ Technical analysis: ADX(51) Very strong trend (beware of overheating and a pullback) | MACD DIF has crossed above zero, signaling a bullish trend | EMA5 has crossed above EMA8, turning bullish in the short term | KDJ golden cross, bullish short-term outlook (K: 47.5, D: 33.6) | Volume surged (3.4x)
════════════════════
🔴 $MRNA 4-hour bullish signal
⚠️ Technical analysis: ADX(39) Clear trending market | MACD DIF has crossed above zero, signaling a bullish trend | EMA5 has crossed above EMA8, turning bullish in the short term | KDJ is moving strongly, with bulls in control (K: 77.0, D: 66.9) | Volume surged (2.6x)
════════════════════
🔔 Follow for first-hand market updates 🔔
#技术分析 #ZEN #USAR #MRNA
📌 When trading, pay attention to whether the candlestick pattern confirms the signal
12


·
--
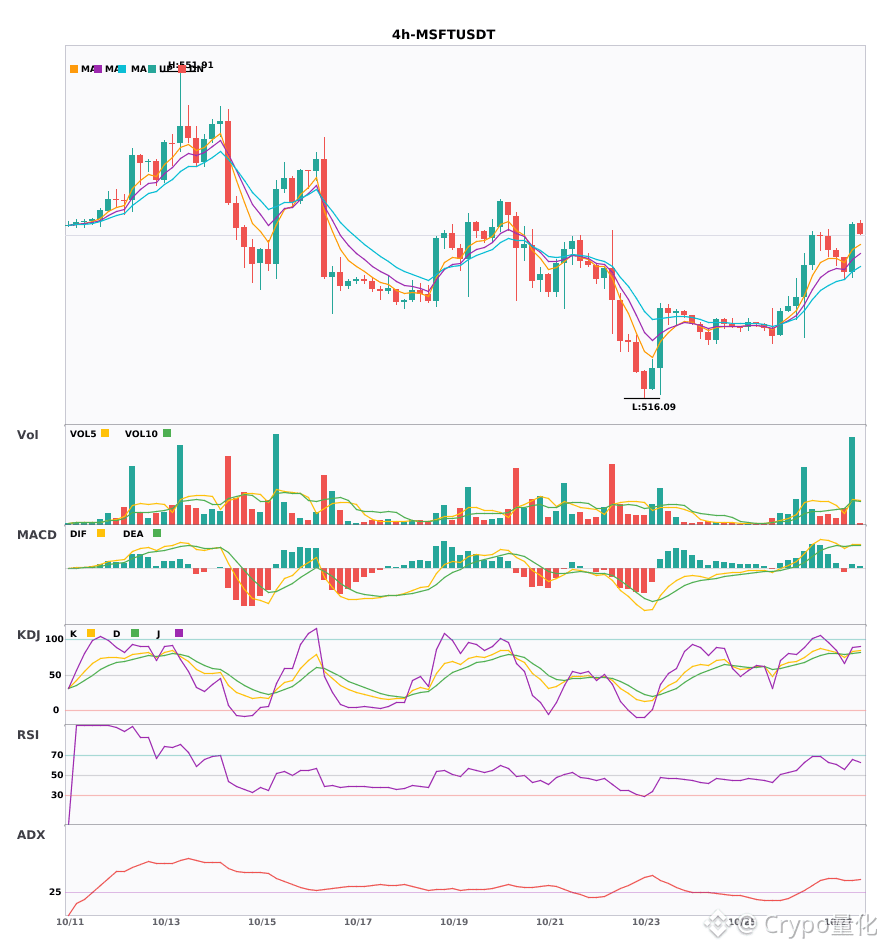
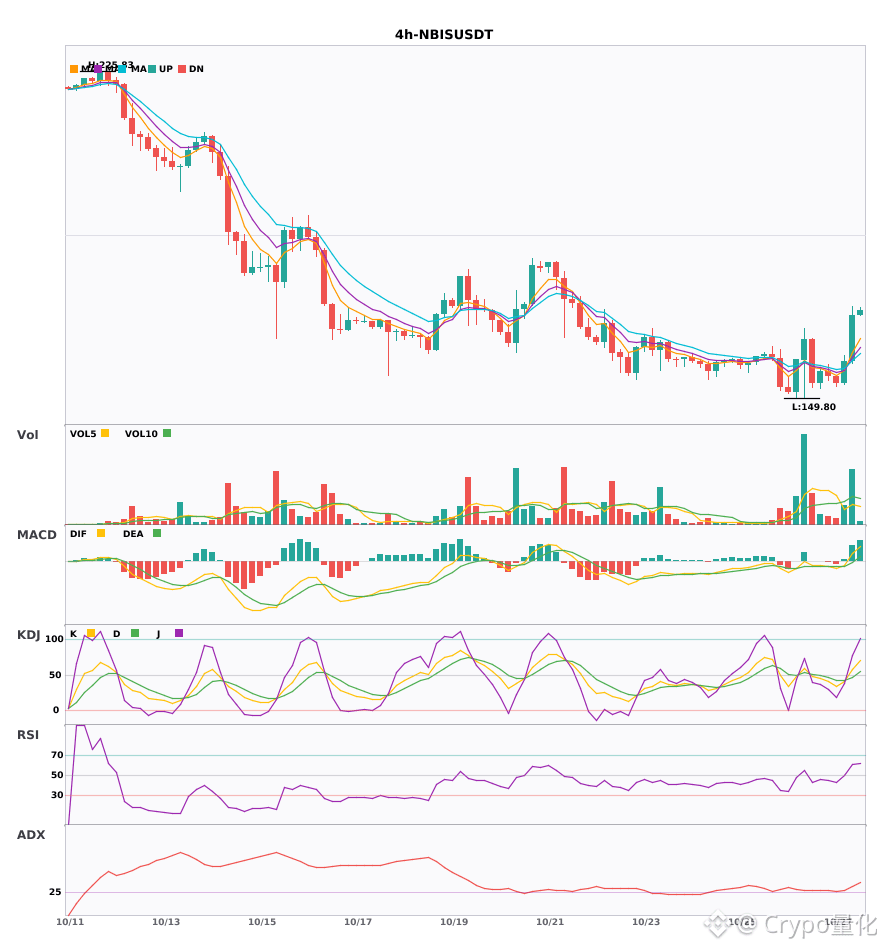
$MSFT / $USAR / $NBIS 4-hour technical indicators are strengthening in sync. Which has the greatest breakout potential? 🔥
════════════════════
🔴 $MSFT 4-hour bullish signal
⚠️ Technicals: ADX (42): clear trend | MACD bullish crossover above zero | EMA5 > EMA8 > EMA13: bullish alignment | KDJ bullish crossover, short-term outlook bullish (K: 82.6, D: 79.9) | Volume surge (3.5x)
════════════════════
🔴 $USAR 4-hour bullish signal
⚠️ Technicals: ADX (51): very strong trend (watch for an overheated pullback) | MACD DIF breaks above the zero line, trend turns bullish | EMA5 crosses above EMA8, short-term outlook turns bullish | KDJ bullish crossover, short-term outlook bullish (K: 47.5, D: 33.6) | Volume surge (3.4x)
════════════════════
🔴 $NBIS 4-hour bullish signal
⚠️ Technicals: ADX (35): clear trend | MACD DIF breaks above the zero line, trend turns bullish | EMA5 crosses above EMA8, short-term outlook turns bullish | KDJ bullish crossover, short-term outlook bullish (K: 57.1, D: 46.8) | Volume increase (2.0x)
════════════════════
🔔 Follow for first-hand market updates 🔔
#技术分析 #MSFT #USAR #NBIS
📌 When trading, pay attention to whether the candlestick pattern confirms the signal.
$MSFT / $USAR / $NBIS 4-hour technical indicators are strengthening in sync. Which has the greatest breakout potential? 🔥
════════════════════
🔴 $MSFT 4-hour bullish signal
⚠️ Technicals: ADX (42): clear trend | MACD bullish crossover above zero | EMA5 > EMA8 > EMA13: bullish alignment | KDJ bullish crossover, short-term outlook bullish (K: 82.6, D: 79.9) | Volume surge (3.5x)
════════════════════
🔴 $USAR 4-hour bullish signal
⚠️ Technicals: ADX (51): very strong trend (watch for an overheated pullback) | MACD DIF breaks above the zero line, trend turns bullish | EMA5 crosses above EMA8, short-term outlook turns bullish | KDJ bullish crossover, short-term outlook bullish (K: 47.5, D: 33.6) | Volume surge (3.4x)
════════════════════
🔴 $NBIS 4-hour bullish signal
⚠️ Technicals: ADX (35): clear trend | MACD DIF breaks above the zero line, trend turns bullish | EMA5 crosses above EMA8, short-term outlook turns bullish | KDJ bullish crossover, short-term outlook bullish (K: 57.1, D: 46.8) | Volume increase (2.0x)
════════════════════
🔔 Follow for first-hand market updates 🔔
#技术分析 #MSFT #USAR #NBIS
📌 When trading, pay attention to whether the candlestick pattern confirms the signal.
════════════════════
🔴 $MSFT 4-hour bullish signal
⚠️ Technicals: ADX (42): clear trend | MACD bullish crossover above zero | EMA5 > EMA8 > EMA13: bullish alignment | KDJ bullish crossover, short-term outlook bullish (K: 82.6, D: 79.9) | Volume surge (3.5x)
════════════════════
🔴 $USAR 4-hour bullish signal
⚠️ Technicals: ADX (51): very strong trend (watch for an overheated pullback) | MACD DIF breaks above the zero line, trend turns bullish | EMA5 crosses above EMA8, short-term outlook turns bullish | KDJ bullish crossover, short-term outlook bullish (K: 47.5, D: 33.6) | Volume surge (3.4x)
════════════════════
🔴 $NBIS 4-hour bullish signal
⚠️ Technicals: ADX (35): clear trend | MACD DIF breaks above the zero line, trend turns bullish | EMA5 crosses above EMA8, short-term outlook turns bullish | KDJ bullish crossover, short-term outlook bullish (K: 57.1, D: 46.8) | Volume increase (2.0x)
════════════════════
🔔 Follow for first-hand market updates 🔔
#技术分析 #MSFT #USAR #NBIS
📌 When trading, pay attention to whether the candlestick pattern confirms the signal.
14

·
--
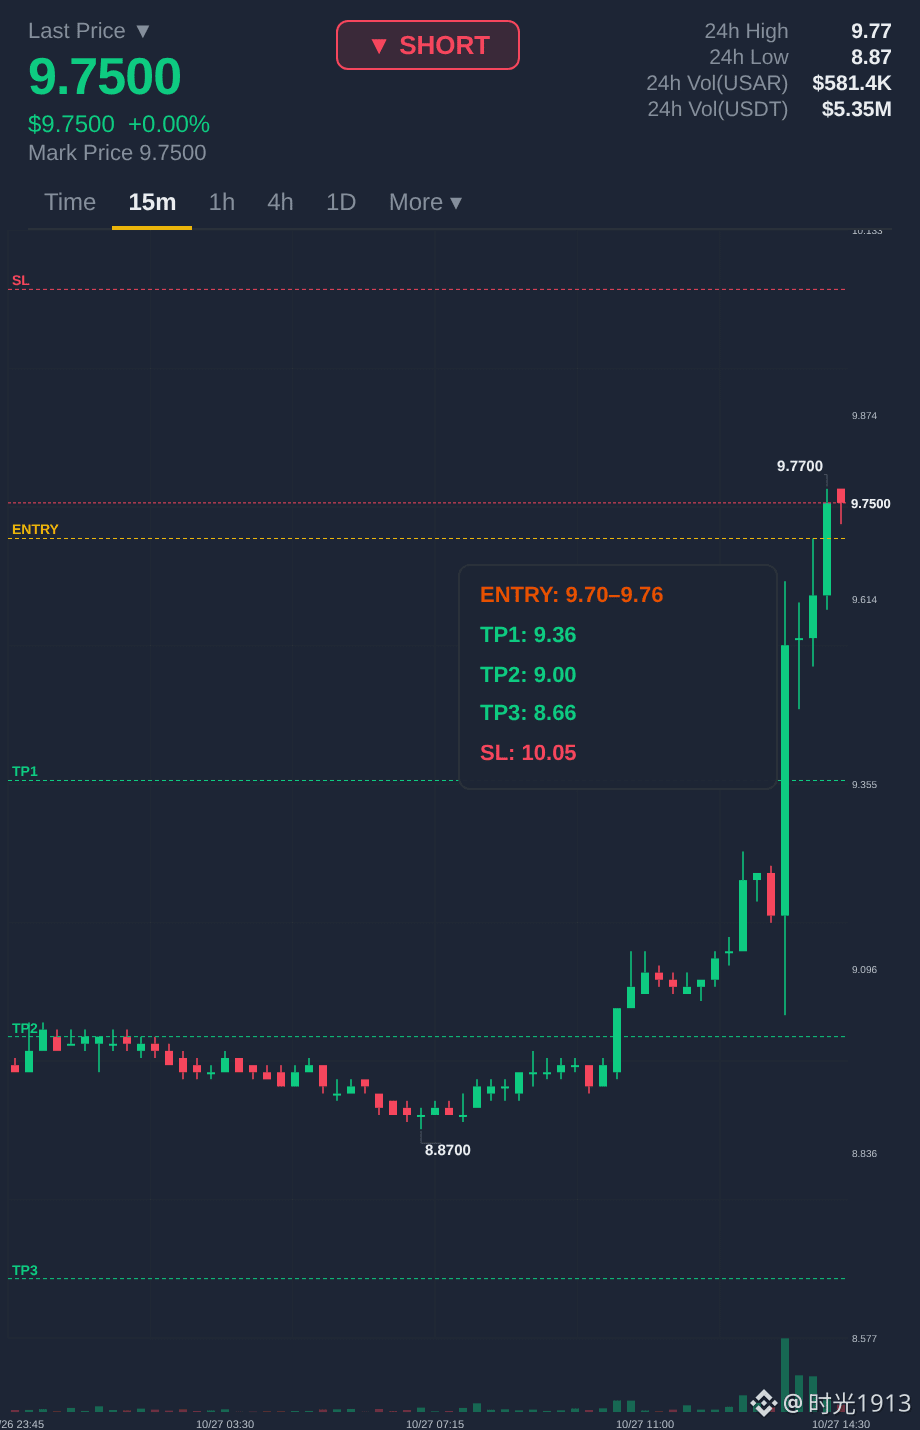
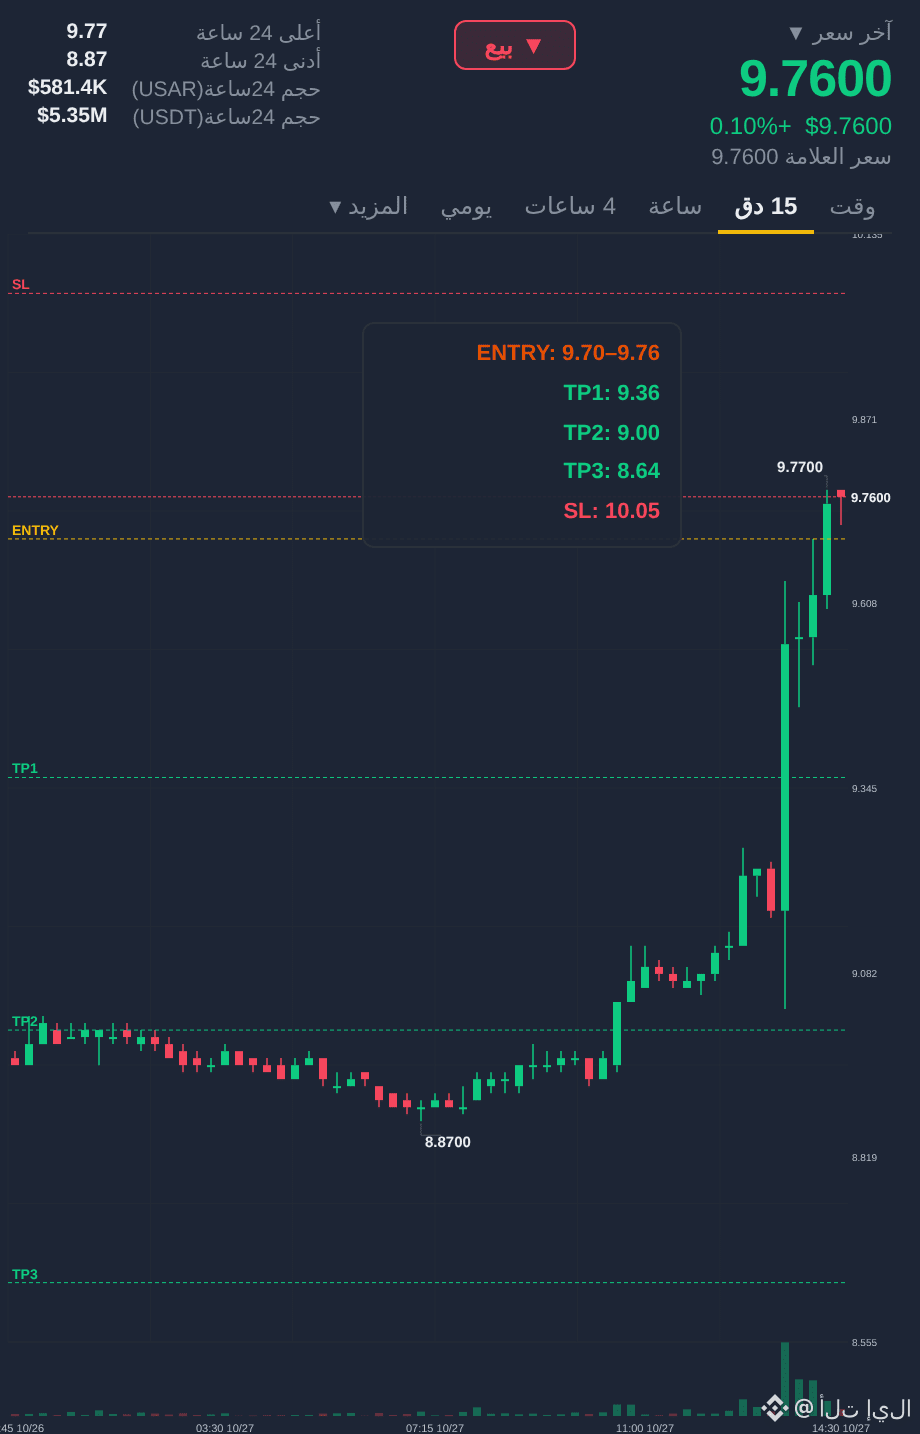
$USAR U.S. Rare Earths | Surged over 10% intraday, precisely hitting the 9.8 target!
The rare-earth sector has exploded across the board. Binance $USAR saw a high-volume rally intraday, reaching as high as 9.87, up more than 11% on the day!
- Trade recap: This morning, we flagged a breakout above the 9.15–9.20 launch zone, with a first target of 9.80–10.00. The intraday levels and timing played out exactly as expected.
- Resistance and risk management: The current price has reached the strong resistance zone at 9.80, and some short-term bulls have taken profits in stages. The stop level has been raised to 9.40: stay in the trade if it holds; lock in profits if it breaks below.
- Rationale: Follow the trend on small-cap, high-momentum names, but never chase blindly into resistance. Stick to disciplined risk management.
After this surge to 9.87, do you think it can hold above the key 10.00 level by the U.S. market close?
---
$USAR surged over 11% today, reaching 9.87 and perfectly hitting our 9.80 target from the 9.15 breakout level. Trailing stop moved up to 9.40.
#TradFi #BinanceSquare #USAR
$USAR U.S. Rare Earths | Surged over 10% intraday, precisely hitting the 9.8 target!
The rare-earth sector has exploded across the board. Binance $USAR saw a high-volume rally intraday, reaching as high as 9.87, up more than 11% on the day!
- Trade recap: This morning, we flagged a breakout above the 9.15–9.20 launch zone, with a first target of 9.80–10.00. The intraday levels and timing played out exactly as expected.
- Resistance and risk management: The current price has reached the strong resistance zone at 9.80, and some short-term bulls have taken profits in stages. The stop level has been raised to 9.40: stay in the trade if it holds; lock in profits if it breaks below.
- Rationale: Follow the trend on small-cap, high-momentum names, but never chase blindly into resistance. Stick to disciplined risk management.
After this surge to 9.87, do you think it can hold above the key 10.00 level by the U.S. market close?
---
$USAR surged over 11% today, reaching 9.87 and perfectly hitting our 9.80 target from the 9.15 breakout level. Trailing stop moved up to 9.40.
#TradFi #BinanceSquare #USAR
The rare-earth sector has exploded across the board. Binance $USAR saw a high-volume rally intraday, reaching as high as 9.87, up more than 11% on the day!
- Trade recap: This morning, we flagged a breakout above the 9.15–9.20 launch zone, with a first target of 9.80–10.00. The intraday levels and timing played out exactly as expected.
- Resistance and risk management: The current price has reached the strong resistance zone at 9.80, and some short-term bulls have taken profits in stages. The stop level has been raised to 9.40: stay in the trade if it holds; lock in profits if it breaks below.
- Rationale: Follow the trend on small-cap, high-momentum names, but never chase blindly into resistance. Stick to disciplined risk management.
After this surge to 9.87, do you think it can hold above the key 10.00 level by the U.S. market close?
---
$USAR surged over 11% today, reaching 9.87 and perfectly hitting our 9.80 target from the 9.15 breakout level. Trailing stop moved up to 9.40.
#TradFi #BinanceSquare #USAR
427

Log in to explore more content
Join global crypto users on Binance Square
⚡️ Get latest and useful information about crypto.
💬 Trusted by the world’s largest crypto exchange.
👍 Discover real insights from verified creators.
Email / Phone number
Trending Topics
1
#USMidterms-WhatAreMarketsExpecting?
30,238 views
398 Discussing
2
#USOctoberNFP-AreRateCutsStillPossible
213,827 views
1,689 Discussing
3
#AMDBeatsExpectations-AINarrativeContinues
4,497 views
153 Discussing
4
#BinanceIncidentReport
181,269 views
1,148 Discussing
5
#AnthropicIPOPricedDownasInvestorsEye$1.5T
6,588 views
83 Discussing
6
#BinanceReopensWithdrawalsForMoreAssets
312,722 views
2,228 Discussing
7
#HongKongToLicenseVirtualAssetCustodyAndAdvisory
909 views
32 Discussing
8
#BinanceHourlyDepositsExceedWithdrawals
134,651 views
1,106 Discussing
9
#SouthKoreaRulingPartyLeaderSeeksCryptoTaxDelay
1,296 views
40 Discussing
10
#MorganStanleyAmongFirstBanksToUseDTCCTokenization
1,328 views
50 Discussing