
#sei
sei
8.3M views
13,948 Discussing
Hot
Latest

Article
See translation
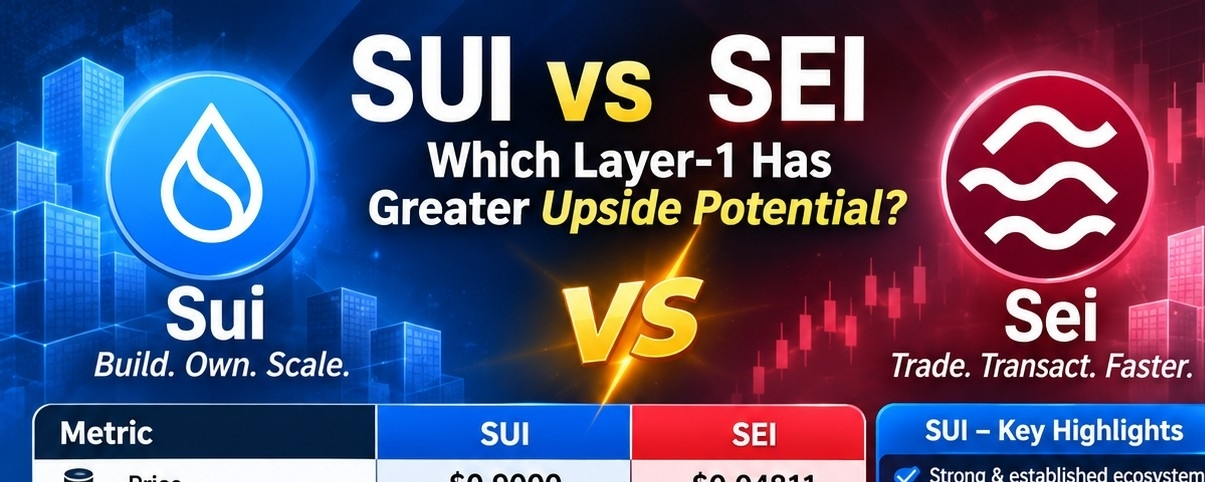
$SUI vs $SEI : Which Layer-1 Has the Bigger Opportunity?Two Layer-1 blockchains. Two different growth stories. Which one offers the stronger risk/reward opportunity?
Both $SUI and $SEI are competing for the future of high-performance blockchain infrastructure, but their valuations and catalysts differ significantly.
1. Market & Tokenomics Comparison:
Metric--------------SUI----------- ------SEI
Price---------------0.90----------------0.04
Market Cap---------3.73B-------------371.97M
Fully Diluted Valuation-9.02B-----------483.1M
Circulating Supply---4.14B--------------7.7B
Maximum Supply----10B----------------10B
Circulating Supply%-41.4%--------------77%
Volume/Market Cap--5.32%-------------8.50%
Market Cap Rank-----26----------------90
Previous ATH--------$5.3519-----------$1.1417
2. Growth Potential:
$SUI- The Established Ecosystem Play
- Object-based architecture and Move smart contracts.
- Potential growth in DeFi, gaming, digital assets and institutional tokenization.
- Recent catalysts include Samsung Wallet's announced USDC integration and institutional RWA initiatives.
- Lower circulating supply means future token unlocks and distribution deserve close monitoring.
$SEI- The High Performance Growth Play
- EVM compatible architecture with parallel transaction execution.
- Focus on trading, DeFi, stablecoins and financial applications.
- The proposed Giga upgrade targets 200,000 transactions per second and 250ms finality.
- Smaller valuation creates room for multiple expansion if adoption accelerates but execution and ecosystem growth must catch up with the technology thesis.
3. Upside vs Downside:
Factor------------SUI---------------SEI
Valuation--------Larger------------Smaller
Supply risk-Higher future unlock exposure- Lower remaining supply to circulate, but unlocks still matter
Key upside driver-DeFi, institutional adoption, RWA--Giga, EVM adoption, trading infrastructure
Main downside--Valuation compression, unlocks--Weak adoption, competition, execution risk
Risk profile----------High------------Very high
4. My Verdict:
SUI: The stronger candidate for investors seeking an established ecosystem with multiple potential adoption drivers.
SEI: The higher-speculation candidate for investors betting on a smaller valuation, EVM adoption and successful Giga execution.
#SUI🔥
#sei
{future}(SUIUSDT)
{future}(SEIUSDT)
$SUI vs $SEI : Which Layer-1 Has the Bigger Opportunity?
Two Layer-1 blockchains. Two different growth stories. Which one offers the stronger risk/reward opportunity?
Both $SUI and $SEI are competing for the future of high-performance blockchain infrastructure, but their valuations and catalysts differ significantly.
1. Market & Tokenomics Comparison:
Metric--------------SUI----------- ------SEI
Price---------------0.90----------------0.04
Market Cap---------3.73B-------------371.97M
Fully Diluted Valuation-9.02B-----------483.1M
Circulating Supply---4.14B--------------7.7B
Maximum Supply----10B----------------10B
Circulating Supply%-41.4%--------------77%
Volume/Market Cap--5.32%-------------8.50%
Market Cap Rank-----26----------------90
Previous ATH--------$5.3519-----------$1.1417
2. Growth Potential:
$SUI - The Established Ecosystem Play
- Object-based architecture and Move smart contracts.
- Potential growth in DeFi, gaming, digital assets and institutional tokenization.
- Recent catalysts include Samsung Wallet's announced USDC integration and institutional RWA initiatives.
- Lower circulating supply means future token unlocks and distribution deserve close monitoring.
$SEI - The High Performance Growth Play
- EVM compatible architecture with parallel transaction execution.
- Focus on trading, DeFi, stablecoins and financial applications.
- The proposed Giga upgrade targets 200,000 transactions per second and 250ms finality.
- Smaller valuation creates room for multiple expansion if adoption accelerates but execution and ecosystem growth must catch up with the technology thesis.
3. Upside vs Downside:
Factor------------SUI---------------SEI
Valuation--------Larger------------Smaller
Supply risk-Higher future unlock exposure- Lower remaining supply to circulate, but unlocks still matter
Key upside driver-DeFi, institutional adoption, RWA--Giga, EVM adoption, trading infrastructure
Main downside--Valuation compression, unlocks--Weak adoption, competition, execution risk
Risk profile----------High------------Very high
4. My Verdict:
SUI: The stronger candidate for investors seeking an established ecosystem with multiple potential adoption drivers.
SEI: The higher-speculation candidate for investors betting on a smaller valuation, EVM adoption and successful Giga execution.
#SUI🔥
#sei
Both $SUI and $SEI are competing for the future of high-performance blockchain infrastructure, but their valuations and catalysts differ significantly.
1. Market & Tokenomics Comparison:
Metric--------------SUI----------- ------SEI
Price---------------0.90----------------0.04
Market Cap---------3.73B-------------371.97M
Fully Diluted Valuation-9.02B-----------483.1M
Circulating Supply---4.14B--------------7.7B
Maximum Supply----10B----------------10B
Circulating Supply%-41.4%--------------77%
Volume/Market Cap--5.32%-------------8.50%
Market Cap Rank-----26----------------90
Previous ATH--------$5.3519-----------$1.1417
2. Growth Potential:
$SUI - The Established Ecosystem Play
- Object-based architecture and Move smart contracts.
- Potential growth in DeFi, gaming, digital assets and institutional tokenization.
- Recent catalysts include Samsung Wallet's announced USDC integration and institutional RWA initiatives.
- Lower circulating supply means future token unlocks and distribution deserve close monitoring.
$SEI - The High Performance Growth Play
- EVM compatible architecture with parallel transaction execution.
- Focus on trading, DeFi, stablecoins and financial applications.
- The proposed Giga upgrade targets 200,000 transactions per second and 250ms finality.
- Smaller valuation creates room for multiple expansion if adoption accelerates but execution and ecosystem growth must catch up with the technology thesis.
3. Upside vs Downside:
Factor------------SUI---------------SEI
Valuation--------Larger------------Smaller
Supply risk-Higher future unlock exposure- Lower remaining supply to circulate, but unlocks still matter
Key upside driver-DeFi, institutional adoption, RWA--Giga, EVM adoption, trading infrastructure
Main downside--Valuation compression, unlocks--Weak adoption, competition, execution risk
Risk profile----------High------------Very high
4. My Verdict:
SUI: The stronger candidate for investors seeking an established ecosystem with multiple potential adoption drivers.
SEI: The higher-speculation candidate for investors betting on a smaller valuation, EVM adoption and successful Giga execution.
#SUI🔥
#sei
Feed-Creator-f6f71f441:
Sui will come out on top
4
1
8
2.2k

·
--
Verified
See translation
🚨 Sei’s Giga Upgrade Nears Its Biggest Test—But the 200K TPS Claim Is Still a Target
Sei’s SIP-6 proposal would replace its current consensus with Autobahn, a multi-proposer design aimed at 200,000 transactions per second and sub-250ms finality. It is the final major piece of the Giga roadmap—but it is still a proposal, not a live mainnet upgrade.
The catch: Sei has already shipped the Ares execution engine and Eidos storage layer in v6.6, but Autobahn has no confirmed mainnet date. The 200K TPS figure is a testnet target, not a proven mainnet result.
SEI also gained regulated derivatives access after perpetual futures launched on CFTC-regulated OG.com Markets, while Monaco opened an invite-only mainnet trading layer.
The takeaway: Sei’s bull case is high-performance onchain trading, but investors should separate roadmap targets from delivered throughput. The next supply test is the ecosystem-reserve unlock scheduled for November 15.
$SEI
{future}(SEIUSDT)
.
.
.
.
#Sei #Crypto
Not financial advice. DYOR.
🚨 Sei’s Giga Upgrade Nears Its Biggest Test—But the 200K TPS Claim Is Still a Target
Sei’s SIP-6 proposal would replace its current consensus with Autobahn, a multi-proposer design aimed at 200,000 transactions per second and sub-250ms finality. It is the final major piece of the Giga roadmap—but it is still a proposal, not a live mainnet upgrade.
The catch: Sei has already shipped the Ares execution engine and Eidos storage layer in v6.6, but Autobahn has no confirmed mainnet date. The 200K TPS figure is a testnet target, not a proven mainnet result.
SEI also gained regulated derivatives access after perpetual futures launched on CFTC-regulated OG.com Markets, while Monaco opened an invite-only mainnet trading layer.
The takeaway: Sei’s bull case is high-performance onchain trading, but investors should separate roadmap targets from delivered throughput. The next supply test is the ecosystem-reserve unlock scheduled for November 15.
$SEI
.
.
.
.
#Sei #Crypto
Not financial advice. DYOR.
Sei’s SIP-6 proposal would replace its current consensus with Autobahn, a multi-proposer design aimed at 200,000 transactions per second and sub-250ms finality. It is the final major piece of the Giga roadmap—but it is still a proposal, not a live mainnet upgrade.
The catch: Sei has already shipped the Ares execution engine and Eidos storage layer in v6.6, but Autobahn has no confirmed mainnet date. The 200K TPS figure is a testnet target, not a proven mainnet result.
SEI also gained regulated derivatives access after perpetual futures launched on CFTC-regulated OG.com Markets, while Monaco opened an invite-only mainnet trading layer.
The takeaway: Sei’s bull case is high-performance onchain trading, but investors should separate roadmap targets from delivered throughput. The next supply test is the ecosystem-reserve unlock scheduled for November 15.
$SEI
.
.
.
.
#Sei #Crypto
Not financial advice. DYOR.

6
1k

See translation
⚡ $SEI COMPRESSION BUILDUP AT KEY DEMAND ZONE READY TO EXPAND! 💥
Entry: 0.2815 ⚡
Target: 0.298929 🚀
Stop Loss: 0.274964 ⚠️
Price is coiling tightly near a massive reaction zone at 0.2815, setting up a textbook execution structure rather than a high-risk chase entry. 📊 Sellers are running out of downward push while buyers absorb supply within a clean 2.32% risk boundary.
⚡ With a crisp 1.67 risk-to-reward ratio targeting systematic upside pushes, order flow signals that smart money is preparing for the next directional move. 💡 Patience here separates disciplined execution from emotional trading. 💬 Are you front-running this key level or waiting for confirmed breakout volume? 👇
⚠️ Not financial advice. Always manage your risk. 🛡️
🏷️ #SEI #LongSetup #TradingPlan #Crypto
🔥 ⚡
⚡ $SEI COMPRESSION BUILDUP AT KEY DEMAND ZONE READY TO EXPAND! 💥
Entry: 0.2815 ⚡
Target: 0.298929 🚀
Stop Loss: 0.274964 ⚠️
Price is coiling tightly near a massive reaction zone at 0.2815, setting up a textbook execution structure rather than a high-risk chase entry. 📊 Sellers are running out of downward push while buyers absorb supply within a clean 2.32% risk boundary.
⚡ With a crisp 1.67 risk-to-reward ratio targeting systematic upside pushes, order flow signals that smart money is preparing for the next directional move. 💡 Patience here separates disciplined execution from emotional trading. 💬 Are you front-running this key level or waiting for confirmed breakout volume? 👇
⚠️ Not financial advice. Always manage your risk. 🛡️
🏷️ #SEI #LongSetup #TradingPlan #Crypto
🔥 ⚡
Entry: 0.2815 ⚡
Target: 0.298929 🚀
Stop Loss: 0.274964 ⚠️
Price is coiling tightly near a massive reaction zone at 0.2815, setting up a textbook execution structure rather than a high-risk chase entry. 📊 Sellers are running out of downward push while buyers absorb supply within a clean 2.32% risk boundary.
⚡ With a crisp 1.67 risk-to-reward ratio targeting systematic upside pushes, order flow signals that smart money is preparing for the next directional move. 💡 Patience here separates disciplined execution from emotional trading. 💬 Are you front-running this key level or waiting for confirmed breakout volume? 👇
⚠️ Not financial advice. Always manage your risk. 🛡️
🏷️ #SEI #LongSetup #TradingPlan #Crypto
🔥 ⚡
24

·
--
See translation
$SEI is up 0.7 percent today and I am passing on it
Volume sits at 0.5x the weekly average meaning real money is not backing this move
Just 1.6M in daily volume means size gets trapped here very easily
I need an hourly close and hold above 0.04856 to take it seriously
Or I want a pullback that holds 0.04707 and actually bounces first
It could keep running without you and a bad entry costs more than a missed move
Chasing $SEI here or waiting for 0.04707
#SEI #RiskManagement
$SEI is up 0.7 percent today and I am passing on it
Volume sits at 0.5x the weekly average meaning real money is not backing this move
Just 1.6M in daily volume means size gets trapped here very easily
I need an hourly close and hold above 0.04856 to take it seriously
Or I want a pullback that holds 0.04707 and actually bounces first
It could keep running without you and a bad entry costs more than a missed move
Chasing $SEI here or waiting for 0.04707
#SEI #RiskManagement
Volume sits at 0.5x the weekly average meaning real money is not backing this move
Just 1.6M in daily volume means size gets trapped here very easily
I need an hourly close and hold above 0.04856 to take it seriously
Or I want a pullback that holds 0.04707 and actually bounces first
It could keep running without you and a bad entry costs more than a missed move
Chasing $SEI here or waiting for 0.04707
#SEI #RiskManagement
20
·
--
See translation
$SEI has one level that matters today: $0.04898
Right now $SEI sits 2.0 percent below it in a quiet market
An hourly close above that ceiling opens up room to run
If it rejects here expect a drift right back down to $0.04707 support
Break or reject? 👀
#SEI #PriceAction
$SEI has one level that matters today: $0.04898
Right now $SEI sits 2.0 percent below it in a quiet market
An hourly close above that ceiling opens up room to run
If it rejects here expect a drift right back down to $0.04707 support
Break or reject? 👀
#SEI #PriceAction
Right now $SEI sits 2.0 percent below it in a quiet market
An hourly close above that ceiling opens up room to run
If it rejects here expect a drift right back down to $0.04707 support
Break or reject? 👀
#SEI #PriceAction
11

·
--
See translation
Can $SEI reclaim $0.05, or is this bounce already running out of fuel? 📉
$SEI is at $0.0483, up 0.88%, but $2.26M volume is thin and RSI sits at 43. Still weak.
Price remains below the 20d and 50d MAs, while longs are paying 0.003% funding. The +0.1% 4h move feels more like drift than demand. Unlike $XRP, there’s no real momentum confirmation yet. At $0.05, I’d wait for volume before getting aggressive. 👀
#Sei #Layer1
Can $SEI reclaim $0.05, or is this bounce already running out of fuel? 📉
$SEI is at $0.0483, up 0.88%, but $2.26M volume is thin and RSI sits at 43. Still weak.
Price remains below the 20d and 50d MAs, while longs are paying 0.003% funding. The +0.1% 4h move feels more like drift than demand. Unlike $XRP , there’s no real momentum confirmation yet. At $0.05, I’d wait for volume before getting aggressive. 👀
#Sei #Layer1
$SEI is at $0.0483, up 0.88%, but $2.26M volume is thin and RSI sits at 43. Still weak.
Price remains below the 20d and 50d MAs, while longs are paying 0.003% funding. The +0.1% 4h move feels more like drift than demand. Unlike $XRP , there’s no real momentum confirmation yet. At $0.05, I’d wait for volume before getting aggressive. 👀
#Sei #Layer1
64

·
--
Bullish
See translation
🟢 $SEI BUY 🟢
{future}(SEIUSDT)
📍 ENTRY: 0.04766-0.04788
🎯 TARGETS:
💰 0.04825
💰 0.05170
💰 0.05237
🛑 STOP: 0.04752
🚀 KEY SUPPORT BOUNCE — SEI BULLS ARE LOOKING FOR A REVERSAL
$SEI is reacting from key support, putting the upside levels in focus. 👀
⚡ Support defense → bullish continuation on watch.
📈 Confirmation remains key.
#SEI #SEIUSDT #CryptoSignals #TradingSignals #FuturesSignals #LongSignal
🟢 $SEI BUY 🟢
📍 ENTRY: 0.04766-0.04788
🎯 TARGETS:
💰 0.04825
💰 0.05170
💰 0.05237
🛑 STOP: 0.04752
🚀 KEY SUPPORT BOUNCE — SEI BULLS ARE LOOKING FOR A REVERSAL
$SEI is reacting from key support, putting the upside levels in focus. 👀
⚡ Support defense → bullish continuation on watch.
📈 Confirmation remains key.
#SEI #SEIUSDT #CryptoSignals #TradingSignals #FuturesSignals #LongSignal
📍 ENTRY: 0.04766-0.04788
🎯 TARGETS:
💰 0.04825
💰 0.05170
💰 0.05237
🛑 STOP: 0.04752
🚀 KEY SUPPORT BOUNCE — SEI BULLS ARE LOOKING FOR A REVERSAL
$SEI is reacting from key support, putting the upside levels in focus. 👀
⚡ Support defense → bullish continuation on watch.
📈 Confirmation remains key.
#SEI #SEIUSDT #CryptoSignals #TradingSignals #FuturesSignals #LongSignal
276
·
--
See translation
$SEI moves 0.8 percent an hour and most traders guess their size instead of doing the math
A one hour swing on $SEI is 0.8 percent of price which sits right at $0.04776 right now
Let us say your account is 1000 dollars and you only want to risk 10 dollars on a trade
That 10 dollars is 1 percent of your total account value
If you place your stop loss at the 1 hour ATR distance which is 0.8 percent away
Your position size is your risk amount divided by your stop distance
Ten dollars divided by 0.8 percent gives you a 1250 dollar position size on $SEI
Never risk more than your plan allows just because the coin looks quiet
What is your exact risk limit per trade
#SEI #TradingTips
$SEI moves 0.8 percent an hour and most traders guess their size instead of doing the math
A one hour swing on $SEI is 0.8 percent of price which sits right at $0.04776 right now
Let us say your account is 1000 dollars and you only want to risk 10 dollars on a trade
That 10 dollars is 1 percent of your total account value
If you place your stop loss at the 1 hour ATR distance which is 0.8 percent away
Your position size is your risk amount divided by your stop distance
Ten dollars divided by 0.8 percent gives you a 1250 dollar position size on $SEI
Never risk more than your plan allows just because the coin looks quiet
What is your exact risk limit per trade
#SEI #TradingTips
A one hour swing on $SEI is 0.8 percent of price which sits right at $0.04776 right now
Let us say your account is 1000 dollars and you only want to risk 10 dollars on a trade
That 10 dollars is 1 percent of your total account value
If you place your stop loss at the 1 hour ATR distance which is 0.8 percent away
Your position size is your risk amount divided by your stop distance
Ten dollars divided by 0.8 percent gives you a 1250 dollar position size on $SEI
Never risk more than your plan allows just because the coin looks quiet
What is your exact risk limit per trade
#SEI #TradingTips
5


See translation
$SEI: SEI: Weighing Entry Patience Against a Falling Trend
### The Practical Trade‑off
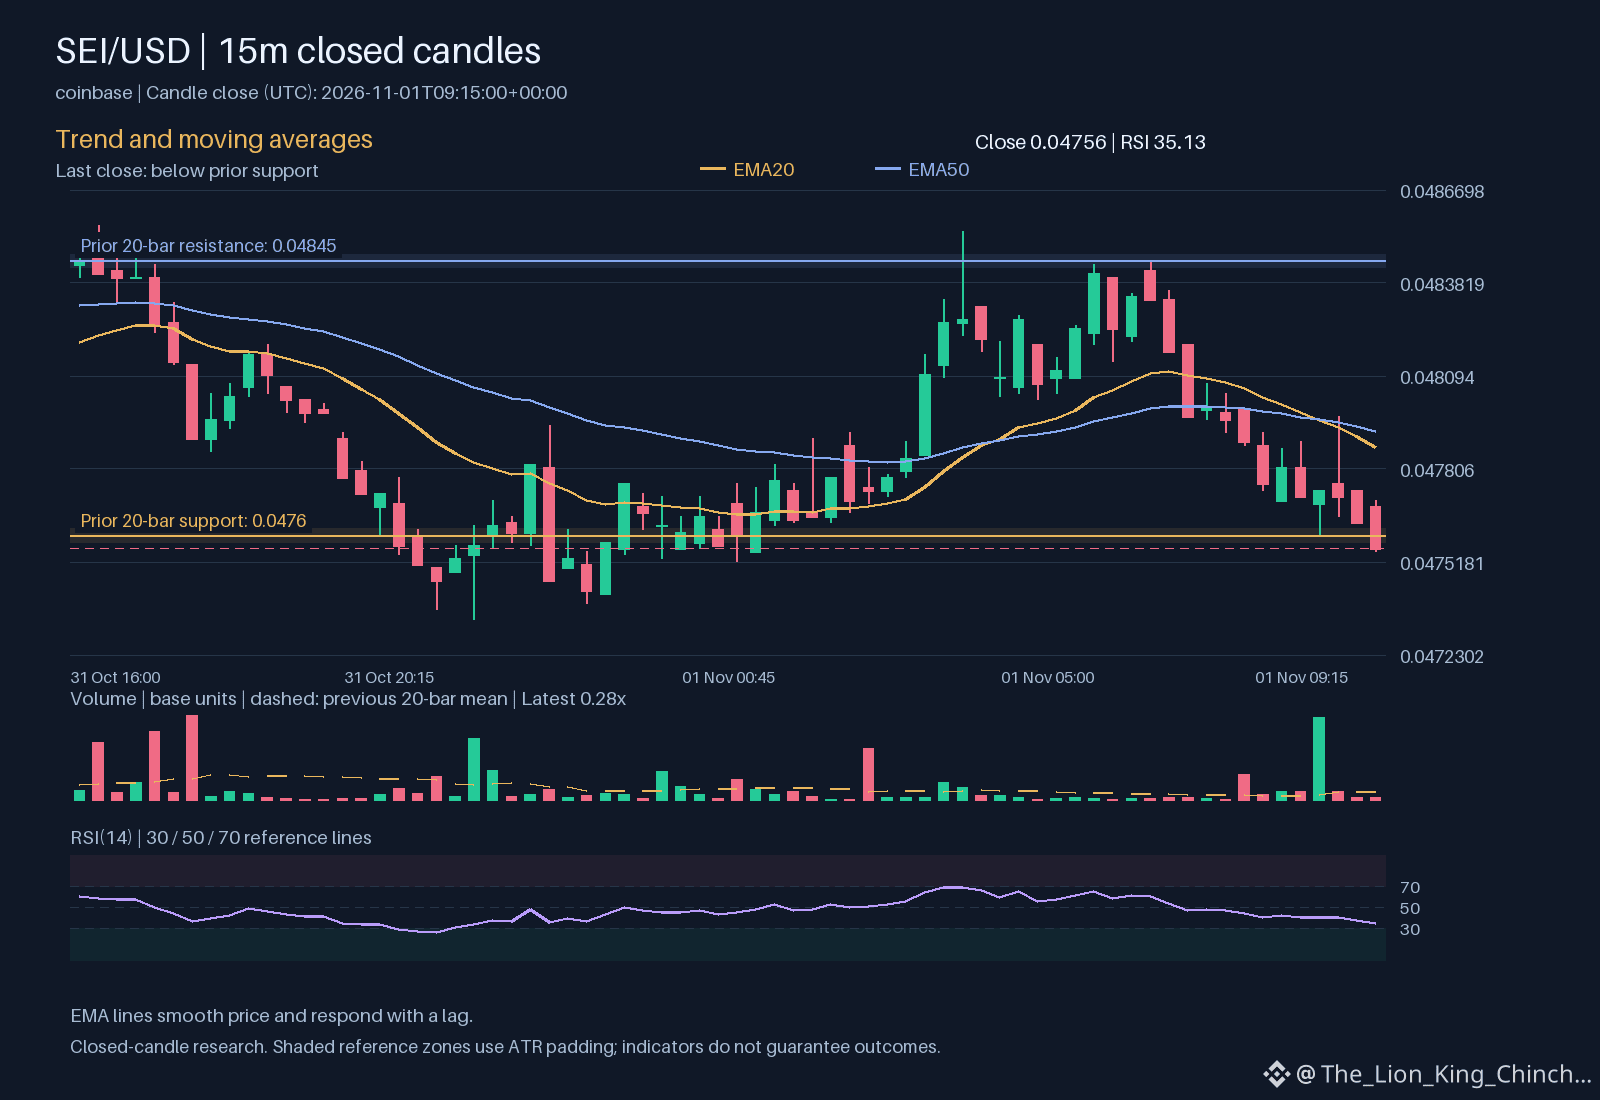
When a price sits below 0.0476 and the hourly direction is down, the temptation to chase a quick entry is strong. Imagine a trader who spots the move and rushes in, hoping the next candle will reverse. The alternative is to wait for a clearer structure, such as a bounce off a stronger support level or a volume lift that confirms buying interest.
### When the Assumption Fails
If the market continues its decline, an early entry may sit too close to the current price, leaving little room for the stop. The stop might need to be placed just above the recent low, which compresses the risk‑to‑reward profile. Conversely, waiting for a stronger signal could mean missing a short‑term rebound, but it also provides a chance to set a stop farther away, giving the trade more breathing room.
### Decision Checklist
- Is the price still below 0.0476?
- Does the hourly direction remain down?
- Is the volume still not above baseline?
- Can a stop be placed at a distance that respects the average true range 0.000174228?
A simple thought experiment helps: picture two scenarios, one where you enter immediately with a tight stop, and another where you wait for a confirming candle and set a wider stop. Compare the potential outcomes on paper without committing capital. This exercise highlights how entry quality trades off against the urge to chase. Reassess the trade by checking whether the price has moved closer to 0.04845 or if volume begins to rise above the baseline, then decide if the risk profile has improved.
Probabilistic market research, not a recommendation or guaranteed return.
Would you wait for clearer structure or reassess the risk first?
#SEI #RiskManagement
$SEI : SEI: Weighing Entry Patience Against a Falling Trend
### The Practical Trade‑off
When a price sits below 0.0476 and the hourly direction is down, the temptation to chase a quick entry is strong. Imagine a trader who spots the move and rushes in, hoping the next candle will reverse. The alternative is to wait for a clearer structure, such as a bounce off a stronger support level or a volume lift that confirms buying interest.
### When the Assumption Fails
If the market continues its decline, an early entry may sit too close to the current price, leaving little room for the stop. The stop might need to be placed just above the recent low, which compresses the risk‑to‑reward profile. Conversely, waiting for a stronger signal could mean missing a short‑term rebound, but it also provides a chance to set a stop farther away, giving the trade more breathing room.
### Decision Checklist
- Is the price still below 0.0476?
- Does the hourly direction remain down?
- Is the volume still not above baseline?
- Can a stop be placed at a distance that respects the average true range 0.000174228?
A simple thought experiment helps: picture two scenarios, one where you enter immediately with a tight stop, and another where you wait for a confirming candle and set a wider stop. Compare the potential outcomes on paper without committing capital. This exercise highlights how entry quality trades off against the urge to chase. Reassess the trade by checking whether the price has moved closer to 0.04845 or if volume begins to rise above the baseline, then decide if the risk profile has improved.
Probabilistic market research, not a recommendation or guaranteed return.
Would you wait for clearer structure or reassess the risk first?
#SEI #RiskManagement
### The Practical Trade‑off
When a price sits below 0.0476 and the hourly direction is down, the temptation to chase a quick entry is strong. Imagine a trader who spots the move and rushes in, hoping the next candle will reverse. The alternative is to wait for a clearer structure, such as a bounce off a stronger support level or a volume lift that confirms buying interest.
### When the Assumption Fails
If the market continues its decline, an early entry may sit too close to the current price, leaving little room for the stop. The stop might need to be placed just above the recent low, which compresses the risk‑to‑reward profile. Conversely, waiting for a stronger signal could mean missing a short‑term rebound, but it also provides a chance to set a stop farther away, giving the trade more breathing room.
### Decision Checklist
- Is the price still below 0.0476?
- Does the hourly direction remain down?
- Is the volume still not above baseline?
- Can a stop be placed at a distance that respects the average true range 0.000174228?
A simple thought experiment helps: picture two scenarios, one where you enter immediately with a tight stop, and another where you wait for a confirming candle and set a wider stop. Compare the potential outcomes on paper without committing capital. This exercise highlights how entry quality trades off against the urge to chase. Reassess the trade by checking whether the price has moved closer to 0.04845 or if volume begins to rise above the baseline, then decide if the risk profile has improved.
Probabilistic market research, not a recommendation or guaranteed return.
Would you wait for clearer structure or reassess the risk first?
#SEI #RiskManagement
22
See translation
$SEI: SEI: How Liquidity Shapes a Simple Upward Move
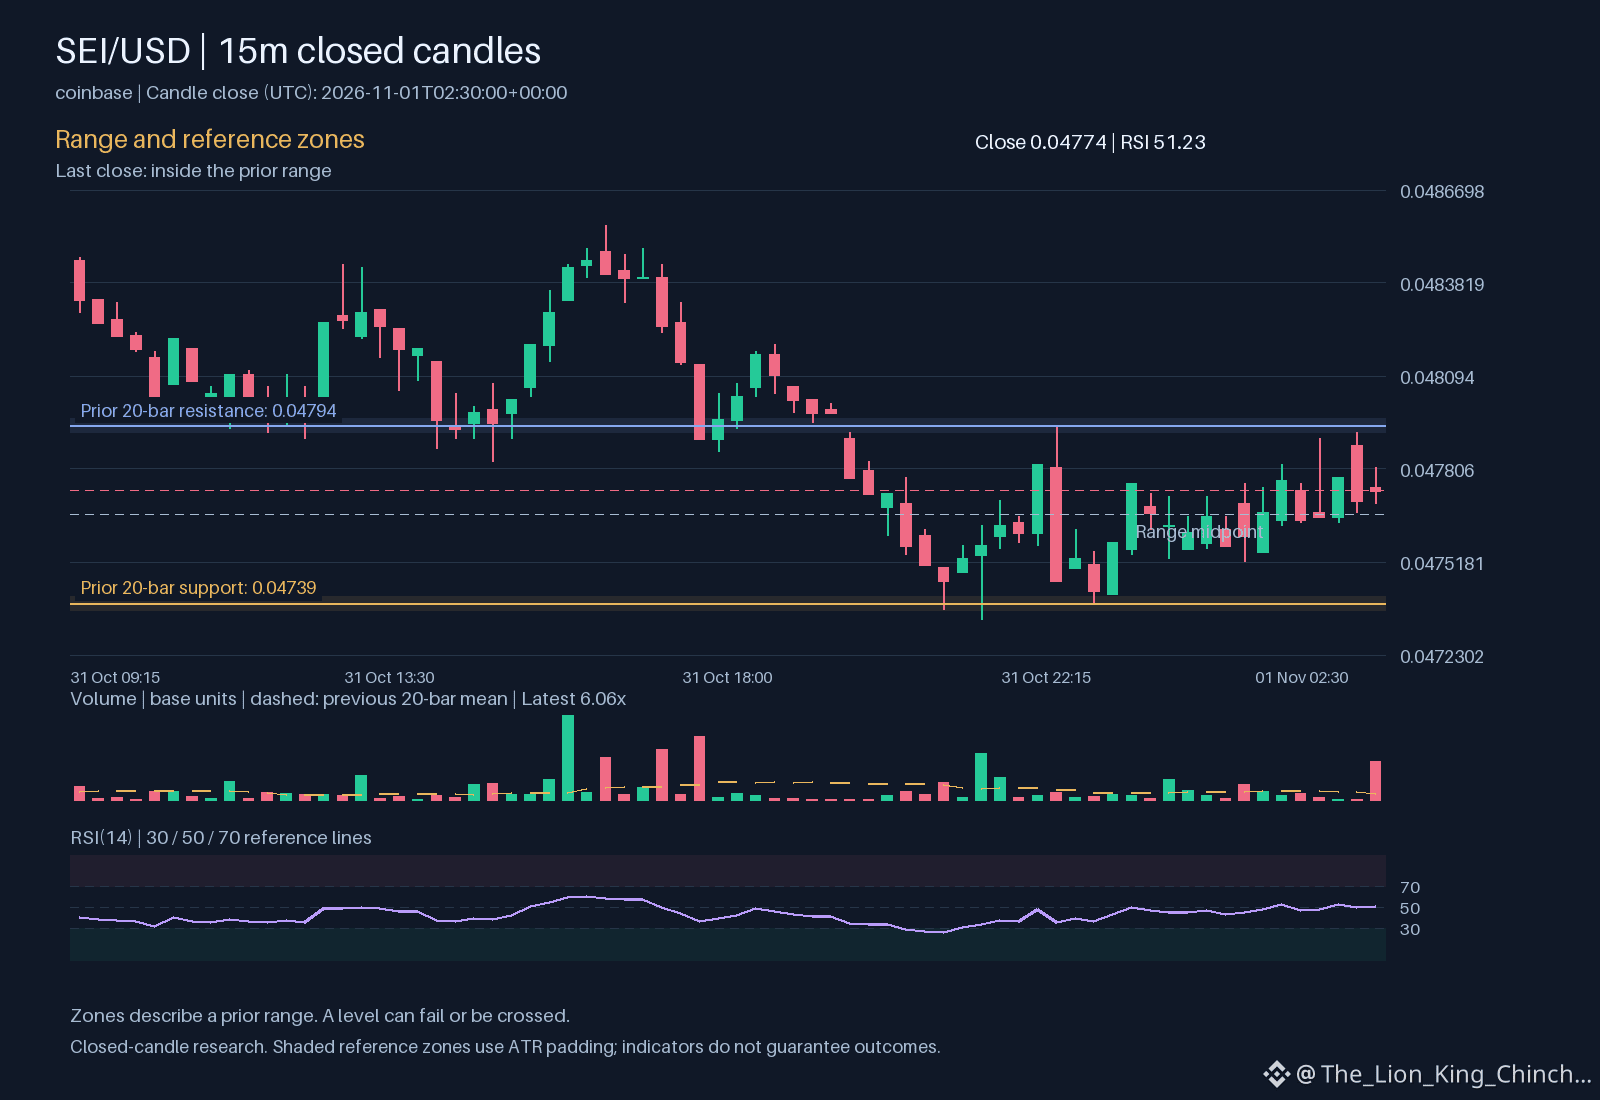
When a chart shows an hourly up direction while volume sits above baseline, the first question is not just "is price rising?" but "what does the market depth allow?" Liquidity, the ease of turning a token into cash without moving the price dramatically, acts like water flowing through a pipe. A wide pipe (high liquidity) lets a large amount of water pass with little change in pressure, while a narrow pipe (low liquidity) creates a splash that quickly raises the water level.
In practical terms, the observed rise in $SEI suggests buyers are finding enough sell orders close to the current price to fill their demand. If the order book were thin, even a modest purchase would push the price far above the recent range, creating a spike that often reverses quickly. The relative volume metric 6.05638 hints at how much trading activity is occurring compared to a typical period, while the quote volume 508761 shows the total dollar flow. Together they give a sense of how deep the market is.
To reassess the move, compare the price change 0.188877 with the spread between the best bid and ask. A narrow spread alongside rising volume supports the view that liquidity is healthy and the up trend may sustain. Conversely, a widening spread would signal that the price rise is being driven by a few aggressive orders, raising the risk of a short‑term reversal.
Think of it as testing a bridge: many small cars crossing smoothly indicate a sturdy structure, while a single heavy truck causing the deck to shake suggests a weakness. Applying this analogy helps separate a genuine liquidity‑backed move from a temporary price distortion.
Probabilistic market research, not a recommendation or guaranteed return.
Which crypto concept becomes clearer when you look at an actual chart?
#SEI #CryptoEducation #CryptoLearning
$SEI : SEI: How Liquidity Shapes a Simple Upward Move
When a chart shows an hourly up direction while volume sits above baseline, the first question is not just "is price rising?" but "what does the market depth allow?" Liquidity, the ease of turning a token into cash without moving the price dramatically, acts like water flowing through a pipe. A wide pipe (high liquidity) lets a large amount of water pass with little change in pressure, while a narrow pipe (low liquidity) creates a splash that quickly raises the water level.
In practical terms, the observed rise in $SEI suggests buyers are finding enough sell orders close to the current price to fill their demand. If the order book were thin, even a modest purchase would push the price far above the recent range, creating a spike that often reverses quickly. The relative volume metric 6.05638 hints at how much trading activity is occurring compared to a typical period, while the quote volume 508761 shows the total dollar flow. Together they give a sense of how deep the market is.
To reassess the move, compare the price change 0.188877 with the spread between the best bid and ask. A narrow spread alongside rising volume supports the view that liquidity is healthy and the up trend may sustain. Conversely, a widening spread would signal that the price rise is being driven by a few aggressive orders, raising the risk of a short‑term reversal.
Think of it as testing a bridge: many small cars crossing smoothly indicate a sturdy structure, while a single heavy truck causing the deck to shake suggests a weakness. Applying this analogy helps separate a genuine liquidity‑backed move from a temporary price distortion.
Probabilistic market research, not a recommendation or guaranteed return.
Which crypto concept becomes clearer when you look at an actual chart?
#SEI #CryptoEducation #CryptoLearning
When a chart shows an hourly up direction while volume sits above baseline, the first question is not just "is price rising?" but "what does the market depth allow?" Liquidity, the ease of turning a token into cash without moving the price dramatically, acts like water flowing through a pipe. A wide pipe (high liquidity) lets a large amount of water pass with little change in pressure, while a narrow pipe (low liquidity) creates a splash that quickly raises the water level.
In practical terms, the observed rise in $SEI suggests buyers are finding enough sell orders close to the current price to fill their demand. If the order book were thin, even a modest purchase would push the price far above the recent range, creating a spike that often reverses quickly. The relative volume metric 6.05638 hints at how much trading activity is occurring compared to a typical period, while the quote volume 508761 shows the total dollar flow. Together they give a sense of how deep the market is.
To reassess the move, compare the price change 0.188877 with the spread between the best bid and ask. A narrow spread alongside rising volume supports the view that liquidity is healthy and the up trend may sustain. Conversely, a widening spread would signal that the price rise is being driven by a few aggressive orders, raising the risk of a short‑term reversal.
Think of it as testing a bridge: many small cars crossing smoothly indicate a sturdy structure, while a single heavy truck causing the deck to shake suggests a weakness. Applying this analogy helps separate a genuine liquidity‑backed move from a temporary price distortion.
Probabilistic market research, not a recommendation or guaranteed return.
Which crypto concept becomes clearer when you look at an actual chart?
#SEI #CryptoEducation #CryptoLearning
101

·
--
Bullish
$SEI Auction rotation shows buyers absorbing selling below VAL at 0.04752. Buy trade setup
📍 Entry: 0.04741
🛑 Stop loss: 0.04701 (-0.8%)
🎯 First target: 0.04821 (+1.7%)
🎯 Second target: 0.04861 (+2.5%)
⚖️ Close half the position at the first target ← Move the stop loss to the entry price
$SEI
{future}(SEIUSDT)
#SEI
$SEI Auction rotation shows buyers absorbing selling below VAL at 0.04752. Buy trade setup
📍 Entry: 0.04741
🛑 Stop loss: 0.04701 (-0.8%)
🎯 First target: 0.04821 (+1.7%)
🎯 Second target: 0.04861 (+2.5%)
⚖️ Close half the position at the first target ← Move the stop loss to the entry price
$SEI
#SEI
📍 Entry: 0.04741
🛑 Stop loss: 0.04701 (-0.8%)
🎯 First target: 0.04821 (+1.7%)
🎯 Second target: 0.04861 (+2.5%)
⚖️ Close half the position at the first target ← Move the stop loss to the entry price
$SEI
#SEI
758

·
--
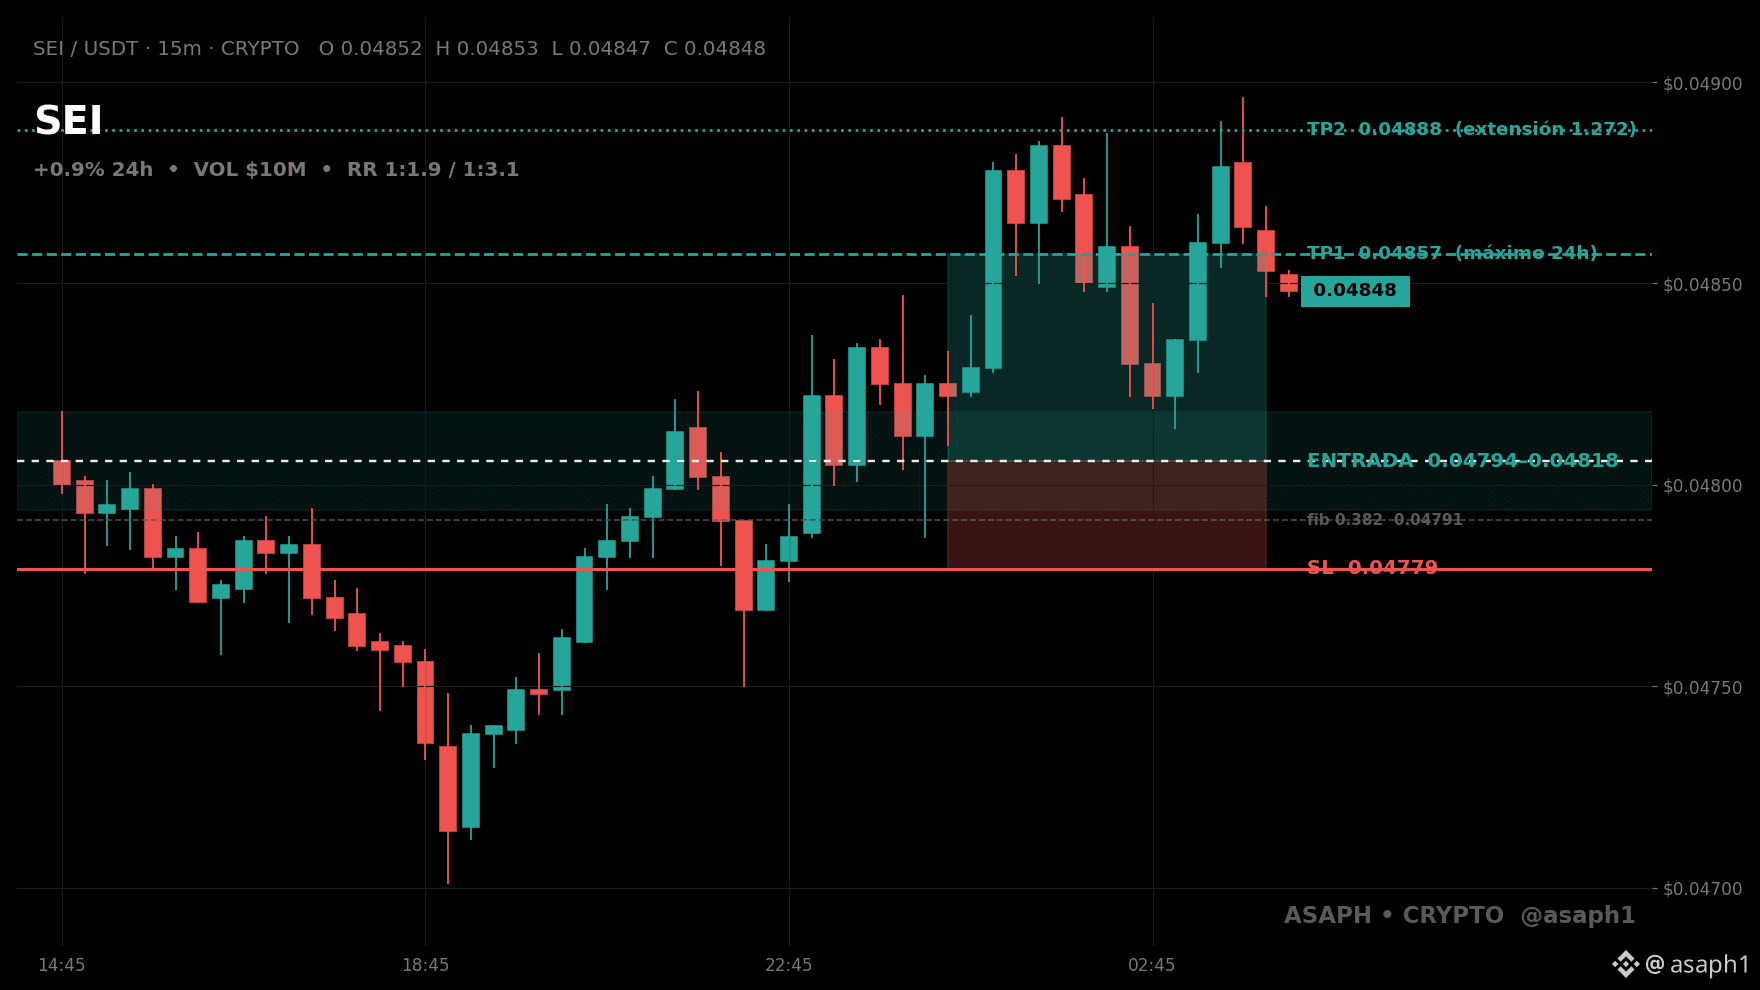
🌱 $SEI TOCÓ TP1 Y TP2 ✅✅ — THE LAYER 1 NO ONE EXPECTED COMPLETED THE PLAN
At 20:41, the long was opened at $0.04794–$0.04818, and the market first took it to TP1 at $0.04857 (+1.1%) at 21:00, then to TP2 at $0.04888 (+1.7%) at 21:30, with the stop at $0.04779 untouched the whole way. Plan complete, 100% collected.
SEI is now trading at $0.04848, between TP1 and TP2, both of which it just hit.
Did you collect the full SEI plan, or are you still waiting for another push? 👇
$SEI
#Sei #Reservas #Crypto
🌱 $SEI TOCÓ TP1 Y TP2 ✅✅ — THE LAYER 1 NO ONE EXPECTED COMPLETED THE PLAN
At 20:41, the long was opened at $0.04794–$0.04818, and the market first took it to TP1 at $0.04857 (+1.1%) at 21:00, then to TP2 at $0.04888 (+1.7%) at 21:30, with the stop at $0.04779 untouched the whole way. Plan complete, 100% collected.
SEI is now trading at $0.04848, between TP1 and TP2, both of which it just hit.
Did you collect the full SEI plan, or are you still waiting for another push? 👇
$SEI
#Sei #Reservas #Crypto
At 20:41, the long was opened at $0.04794–$0.04818, and the market first took it to TP1 at $0.04857 (+1.1%) at 21:00, then to TP2 at $0.04888 (+1.7%) at 21:30, with the stop at $0.04779 untouched the whole way. Plan complete, 100% collected.
SEI is now trading at $0.04848, between TP1 and TP2, both of which it just hit.
Did you collect the full SEI plan, or are you still waiting for another push? 👇
$SEI
#Sei #Reservas #Crypto
39

See translation
Dear Binancian, here #CoinVahini presents $SEI Market Metrics & Valuation👇
Sei is currently positioned at rank No. 89 globally, backed by a market capitalization of $370.97 million and a fully diluted market cap of $481.8 million.
Watch now price then continue...
{spot}(SEIUSDT)
Can you find if a partial accumulation zone is going on, on the chart?
Okay.. we need to go a little deeper!
💡Circulating supply stands at 7.7 billion SEI against a total and maximum supply of 10 billion SEI, leaving roughly 2.3 billion tokens subject to future dilution or unlock schedules.
💡Daily trading volume reached $32.95 million, yielding a volume-to-market cap ratio of 8.88%, indicating moderate liquidity relative to its valuation.
💡The asset touched an all-time high of $1.1417 on March 16, 2024, and an all-time low of $0.00799 on August 15, 2023.
For crypto traders and active investors, monitoring unlock cliffs and volume-to-market cap ratios remains vital for assessing structural risk in Layer 1 assets. Notable events and facts to be updated here. keep a touch with me to get those details 😊
#Sei #Layer1 #TokenLearning #Tokenomics
Dear Binancian, here #CoinVahini presents $SEI Market Metrics & Valuation👇
Sei is currently positioned at rank No. 89 globally, backed by a market capitalization of $370.97 million and a fully diluted market cap of $481.8 million.
Watch now price then continue...
Can you find if a partial accumulation zone is going on, on the chart?
Okay.. we need to go a little deeper!
💡Circulating supply stands at 7.7 billion SEI against a total and maximum supply of 10 billion SEI, leaving roughly 2.3 billion tokens subject to future dilution or unlock schedules.
💡Daily trading volume reached $32.95 million, yielding a volume-to-market cap ratio of 8.88%, indicating moderate liquidity relative to its valuation.
💡The asset touched an all-time high of $1.1417 on March 16, 2024, and an all-time low of $0.00799 on August 15, 2023.
For crypto traders and active investors, monitoring unlock cliffs and volume-to-market cap ratios remains vital for assessing structural risk in Layer 1 assets. Notable events and facts to be updated here. keep a touch with me to get those details 😊
#Sei #Layer1 #TokenLearning #Tokenomics
Sei is currently positioned at rank No. 89 globally, backed by a market capitalization of $370.97 million and a fully diluted market cap of $481.8 million.
Watch now price then continue...
Can you find if a partial accumulation zone is going on, on the chart?
Okay.. we need to go a little deeper!
💡Circulating supply stands at 7.7 billion SEI against a total and maximum supply of 10 billion SEI, leaving roughly 2.3 billion tokens subject to future dilution or unlock schedules.
💡Daily trading volume reached $32.95 million, yielding a volume-to-market cap ratio of 8.88%, indicating moderate liquidity relative to its valuation.
💡The asset touched an all-time high of $1.1417 on March 16, 2024, and an all-time low of $0.00799 on August 15, 2023.
For crypto traders and active investors, monitoring unlock cliffs and volume-to-market cap ratios remains vital for assessing structural risk in Layer 1 assets. Notable events and facts to be updated here. keep a touch with me to get those details 😊
#Sei #Layer1 #TokenLearning #Tokenomics
20

·
--
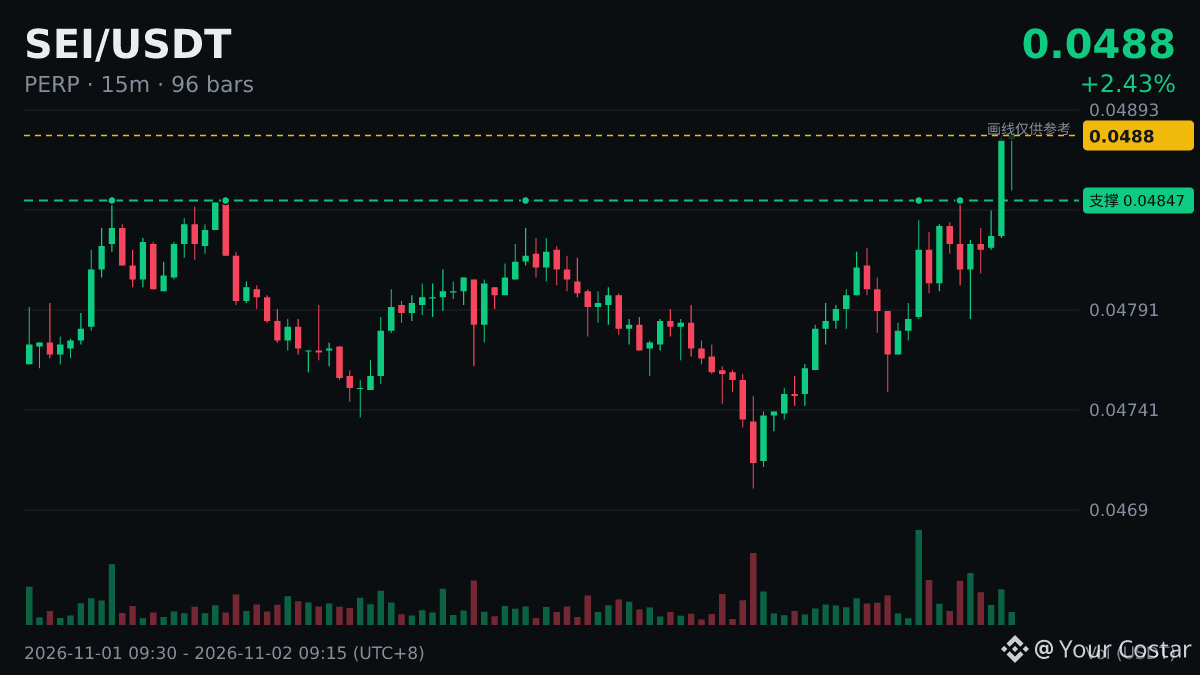
$SEI hit a new 24-hour high of 0.04885, breaking the previous high of 0.04848.
Strong as hell—not giving anyone a chance to get in. Strong coins usually don’t pull back much, while weak rallies often don’t last long. Do you think this move was driven by capital or sentiment?
#SEI
Just my personal opinion, not investment advice.
$SEI hit a new 24-hour high of 0.04885, breaking the previous high of 0.04848.
Strong as hell—not giving anyone a chance to get in. Strong coins usually don’t pull back much, while weak rallies often don’t last long. Do you think this move was driven by capital or sentiment?
#SEI
Just my personal opinion, not investment advice.
Strong as hell—not giving anyone a chance to get in. Strong coins usually don’t pull back much, while weak rallies often don’t last long. Do you think this move was driven by capital or sentiment?
#SEI
Just my personal opinion, not investment advice.
172
·
--
🚨 $SEI RESERVE BETRAYAL: BINANCE REVEALS ITS WALLETS AND SEI BREAKS AWAY
Binance published its latest proof-of-reserves snapshot today, dated October 31, and promises full cryptographic verification by November 3, with the SAFU fund back up to $1 billion. To me, the fact that the exchange has to show its wallets to calm the market says that trust is no longer something you ask for: you have to prove it. Meanwhile, capital is looking for layer 1s that aren’t in the eye of the storm.
Look at the detail nobody is noticing:
→ The October 31 reserves snapshot came out today, with BTC, ETH, USDT, BNB, SOL, USDC, XRP, and ZEC among the 100% backed balances, and full verification promised for November 3.
→ SEI +1.1% at $8.9M, while SUI -0.6% and APT -1.7% are falling among the layer 1s: SEI is the only one in the group in the green.
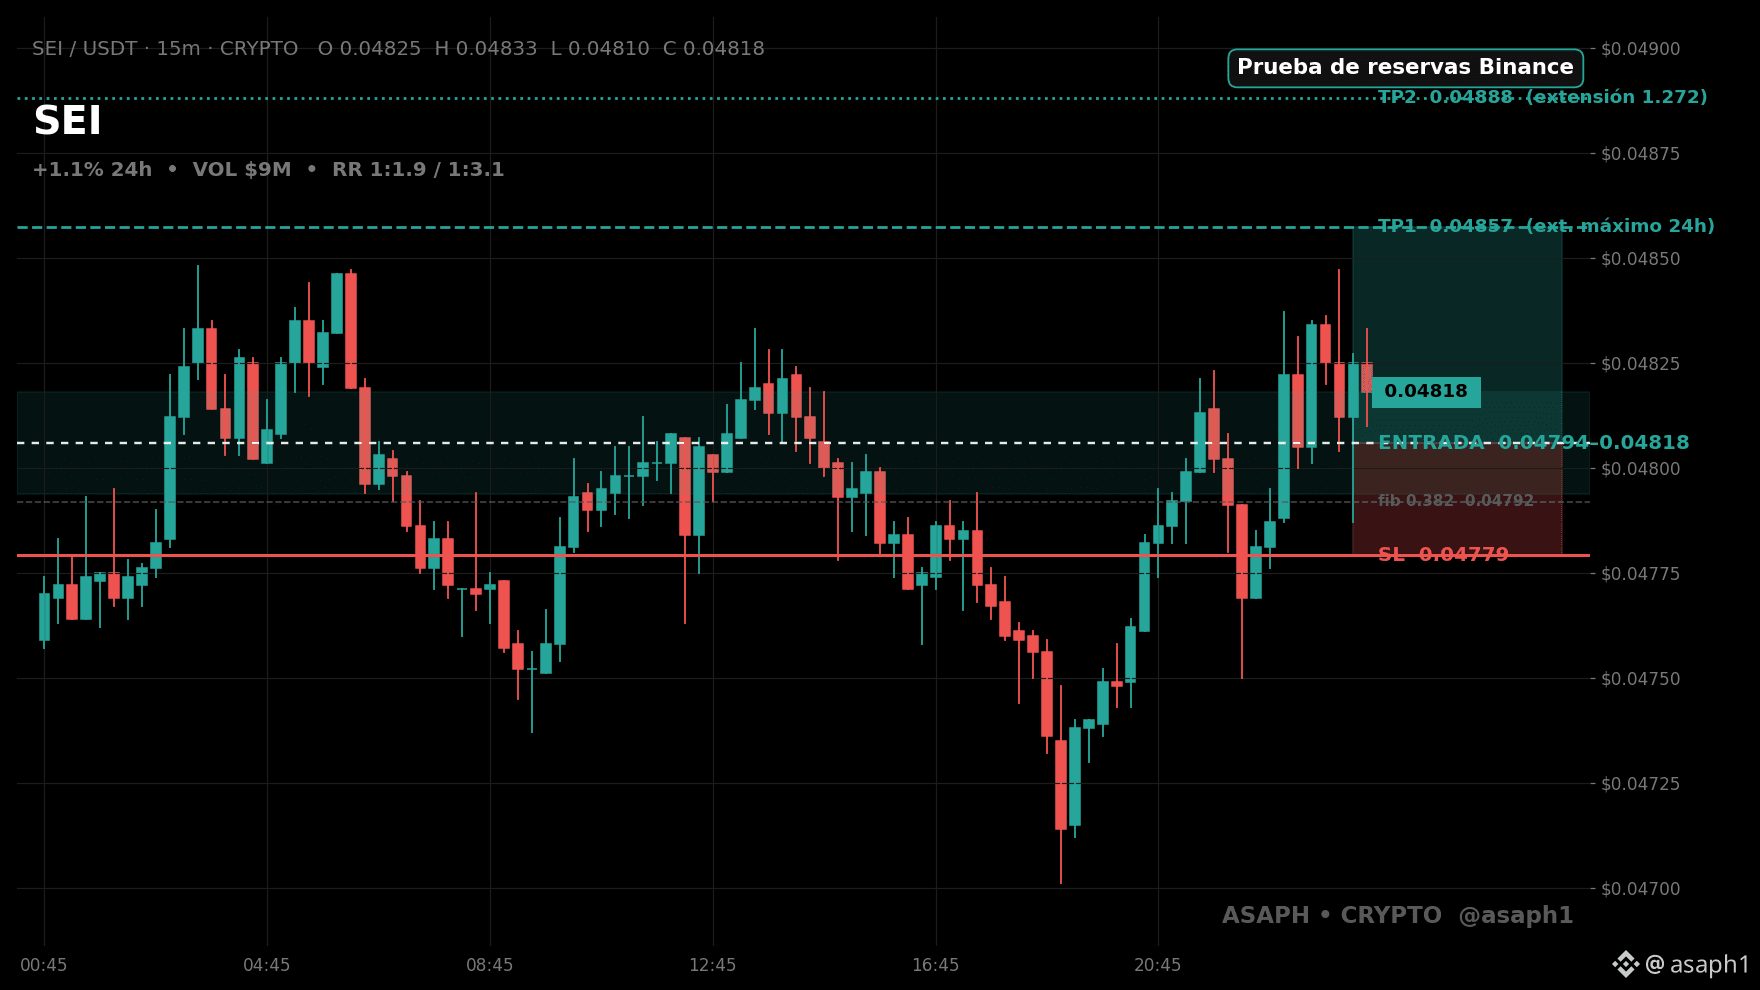
→ Entry $0.0479375–$0.04818, SL $0.047792, TP1 $0.04857325 (+1.1%) → TP2 $0.04887984 (+1.7%).
Will SEI stay in the green up to $0.04888, or will SUI drag it back down? 👇
$SEI $SUI $APT
#Sei #Reservas #Trading
🚨 $SEI RESERVE BETRAYAL: BINANCE REVEALS ITS WALLETS AND SEI BREAKS AWAY
Binance published its latest proof-of-reserves snapshot today, dated October 31, and promises full cryptographic verification by November 3, with the SAFU fund back up to $1 billion. To me, the fact that the exchange has to show its wallets to calm the market says that trust is no longer something you ask for: you have to prove it. Meanwhile, capital is looking for layer 1s that aren’t in the eye of the storm.
Look at the detail nobody is noticing:
→ The October 31 reserves snapshot came out today, with BTC, ETH, USDT, BNB, SOL, USDC, XRP, and ZEC among the 100% backed balances, and full verification promised for November 3.
→ SEI +1.1% at $8.9M, while SUI -0.6% and APT -1.7% are falling among the layer 1s: SEI is the only one in the group in the green.
→ Entry $0.0479375–$0.04818, SL $0.047792, TP1 $0.04857325 (+1.1%) → TP2 $0.04887984 (+1.7%).
Will SEI stay in the green up to $0.04888, or will SUI drag it back down? 👇
$SEI $SUI $APT
#Sei #Reservas #Trading
Binance published its latest proof-of-reserves snapshot today, dated October 31, and promises full cryptographic verification by November 3, with the SAFU fund back up to $1 billion. To me, the fact that the exchange has to show its wallets to calm the market says that trust is no longer something you ask for: you have to prove it. Meanwhile, capital is looking for layer 1s that aren’t in the eye of the storm.
Look at the detail nobody is noticing:
→ The October 31 reserves snapshot came out today, with BTC, ETH, USDT, BNB, SOL, USDC, XRP, and ZEC among the 100% backed balances, and full verification promised for November 3.
→ SEI +1.1% at $8.9M, while SUI -0.6% and APT -1.7% are falling among the layer 1s: SEI is the only one in the group in the green.
→ Entry $0.0479375–$0.04818, SL $0.047792, TP1 $0.04857325 (+1.1%) → TP2 $0.04887984 (+1.7%).
Will SEI stay in the green up to $0.04888, or will SUI drag it back down? 👇
$SEI $SUI $APT
#Sei #Reservas #Trading
44

·
--
See translation
🦈 $SEI RECLAIMS KEY INTRADAY HIGH AFTER EXTENDED LIQUIDITY PURGE! ⚡
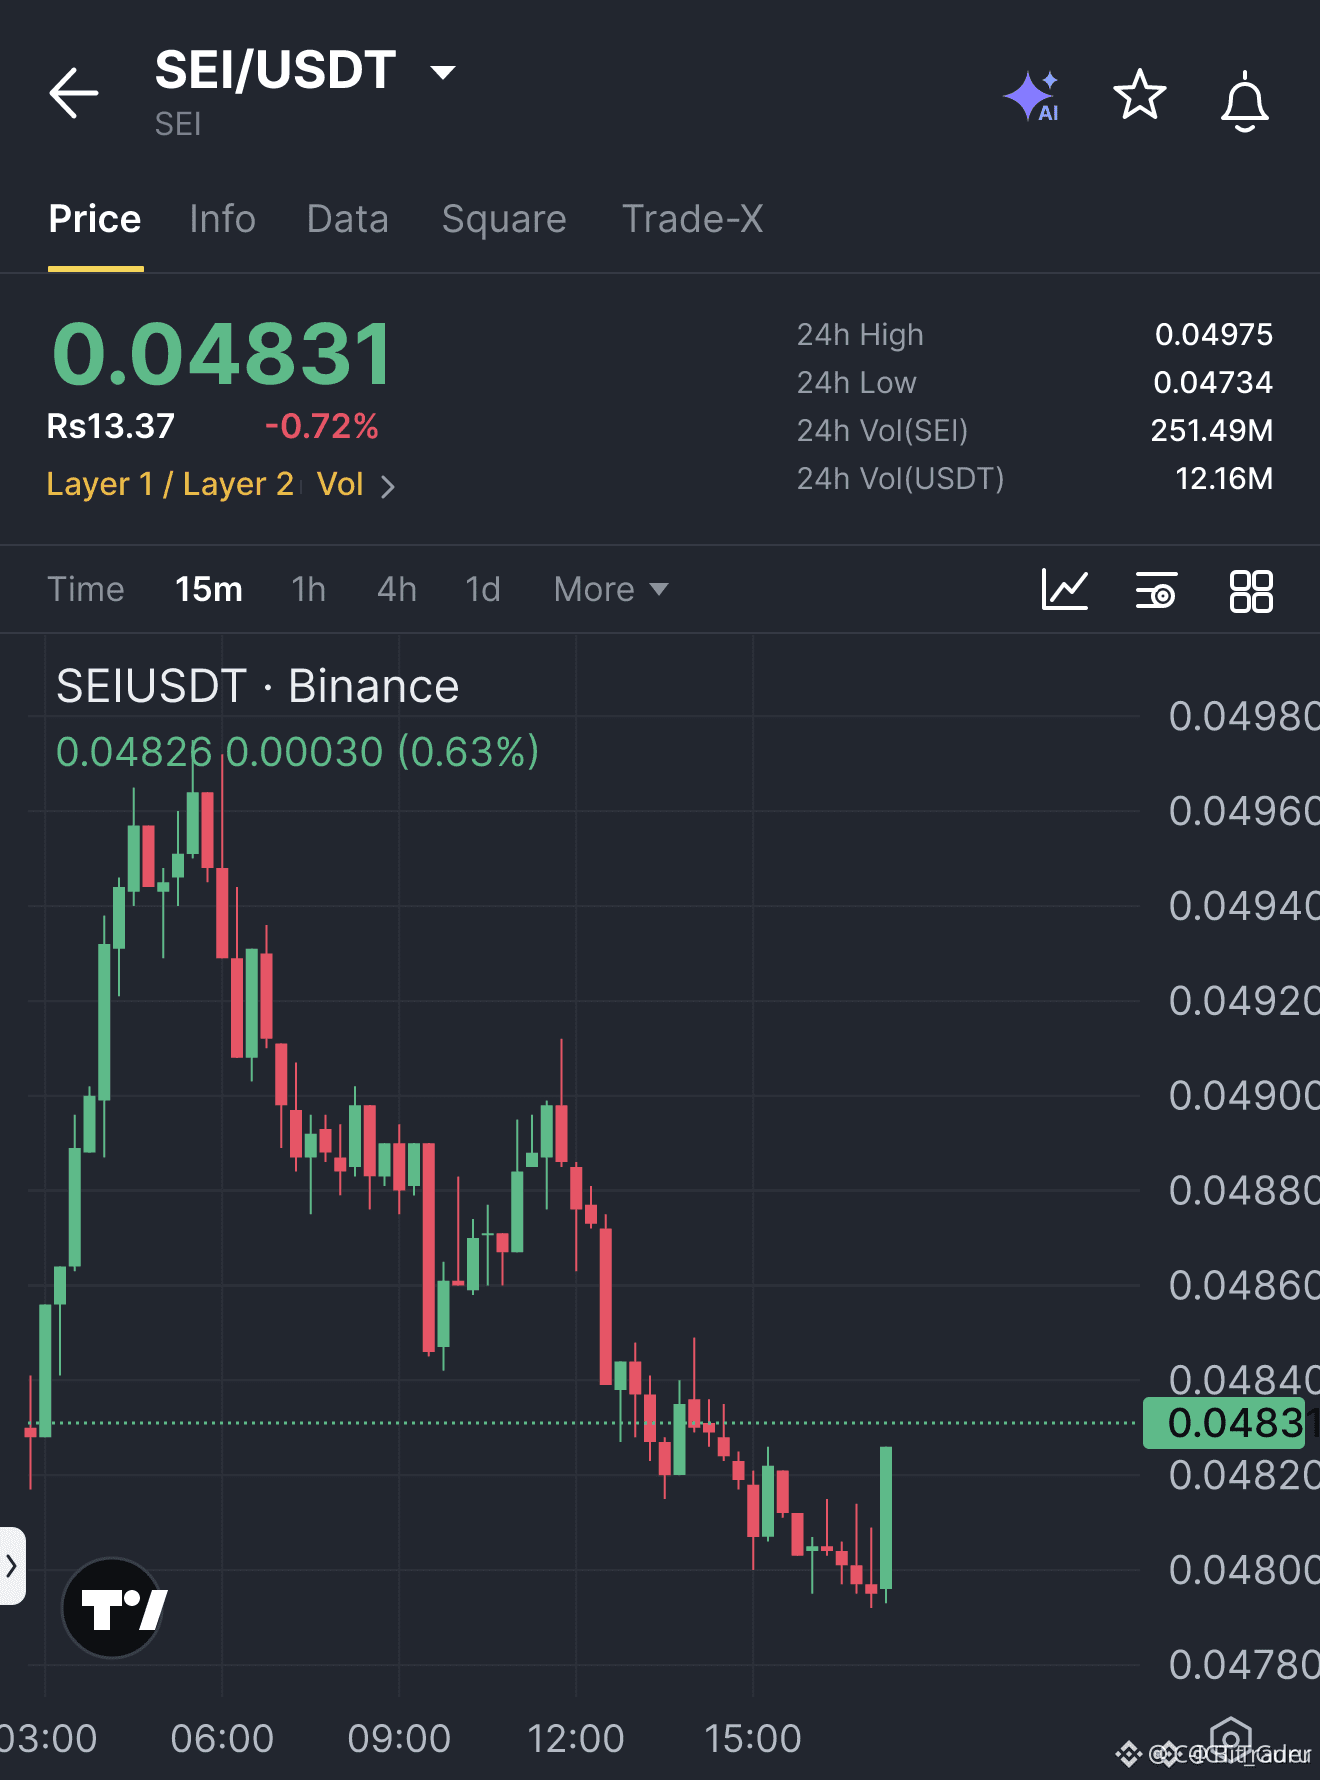
Entry: 0.04828 ⚡
Target: 0.04885 🎯
Stop Loss: 0.0479 ⚠️
🔍 After an extended markdown phase sweeping sell-side liquidity, $SEI has printed an immediate change of character by taking out the previous candle high. 🌊 This reclaim reflects responsive institutional demand stepping in to absorb market sell pressure at discounted levels.
💡 Market structure favors a systematic mean reversion toward overhead inefficiencies, with immediate liquidity resting at 0.04885 before higher levels are tested. 💬 Are you positioning on this structural trigger or waiting for a secondary retest? 👇
⚠️ Not financial advice. Always manage your risk. 🛡️
🏷️ #SEI #Altcoins #TradingSetup #MarketStructure
🎯 🦈
🦈 $SEI RECLAIMS KEY INTRADAY HIGH AFTER EXTENDED LIQUIDITY PURGE! ⚡
Entry: 0.04828 ⚡
Target: 0.04885 🎯
Stop Loss: 0.0479 ⚠️
🔍 After an extended markdown phase sweeping sell-side liquidity, $SEI has printed an immediate change of character by taking out the previous candle high. 🌊 This reclaim reflects responsive institutional demand stepping in to absorb market sell pressure at discounted levels.
💡 Market structure favors a systematic mean reversion toward overhead inefficiencies, with immediate liquidity resting at 0.04885 before higher levels are tested. 💬 Are you positioning on this structural trigger or waiting for a secondary retest? 👇
⚠️ Not financial advice. Always manage your risk. 🛡️
🏷️ #SEI #Altcoins #TradingSetup #MarketStructure
🎯 🦈
Entry: 0.04828 ⚡
Target: 0.04885 🎯
Stop Loss: 0.0479 ⚠️
🔍 After an extended markdown phase sweeping sell-side liquidity, $SEI has printed an immediate change of character by taking out the previous candle high. 🌊 This reclaim reflects responsive institutional demand stepping in to absorb market sell pressure at discounted levels.
💡 Market structure favors a systematic mean reversion toward overhead inefficiencies, with immediate liquidity resting at 0.04885 before higher levels are tested. 💬 Are you positioning on this structural trigger or waiting for a secondary retest? 👇
⚠️ Not financial advice. Always manage your risk. 🛡️
🏷️ #SEI #Altcoins #TradingSetup #MarketStructure
🎯 🦈
25
See translation
⚡ $SEI RECLAIMS MOMENTUM AS BUYERS BREAK HIGHS AFTER EXTENDED BLEED! 📈
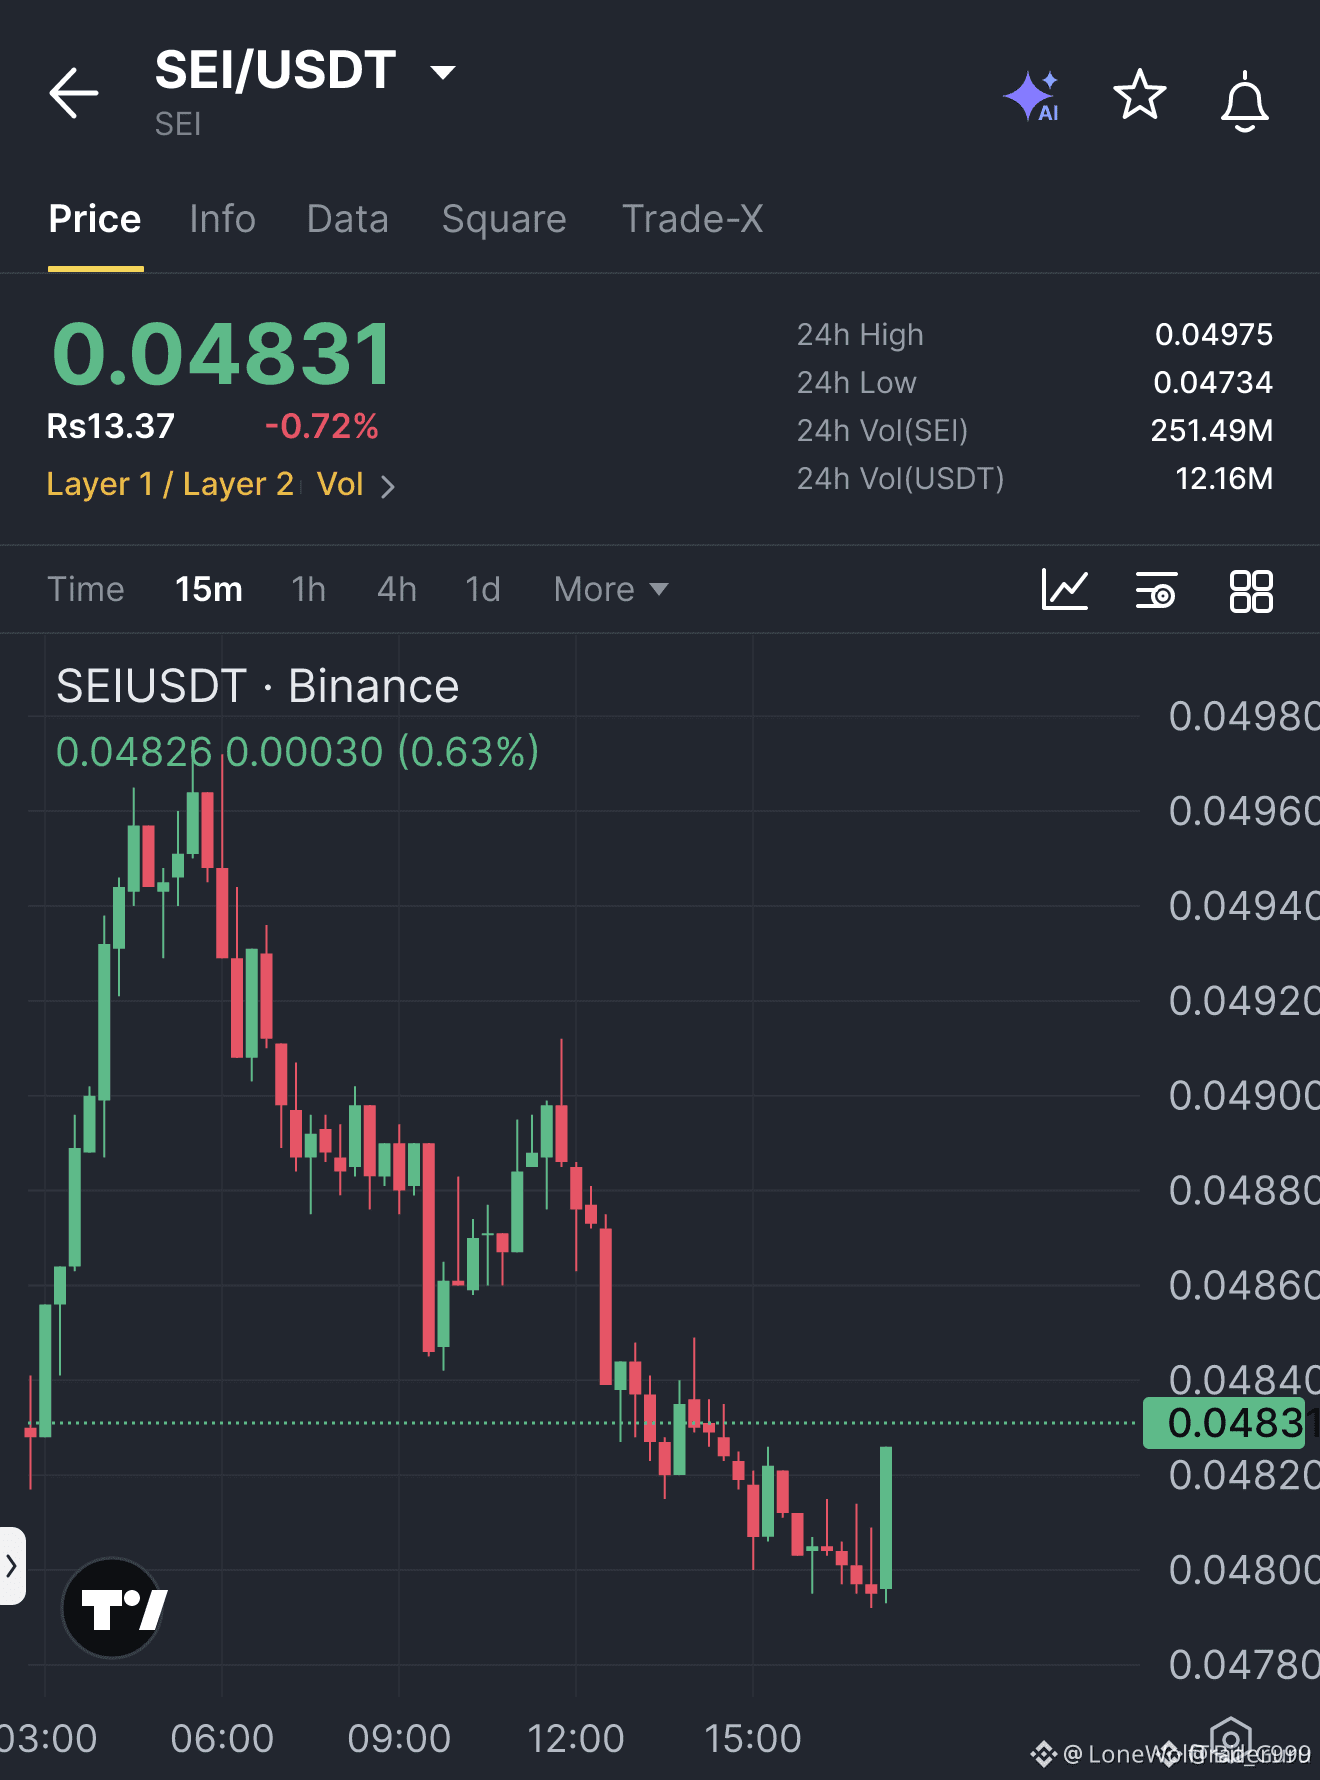
Entry: 0.04828 ⚡
Target: 0.04885 🎯
Stop Loss: 0.0479 ⚠️
📌 Sellers ran out of gas after an extended bleed, and aggressive bids just reclaimed momentum by taking out the previous candle high. ⚡ This structural shift confirms responsive buyers stepping into the order book to defend the lows.
💡 The tactical play here is locking gains into the immediate 0.04885 level while letting secondary runners hunt 0.04923 and 0.0498. 📊 With risk strictly anchored below 0.0479, the setup offers clean asymmetry for patient execution.
💬 Are you taking the recovery trigger here, or waiting for higher confirmation above 0.049? 👇
⚠️ Not financial advice. Always manage your risk. 🛡️
🏷️ #SEI #LongSetup #Trading #Altcoins #Crypto
⚡ 🎯
⚡ $SEI RECLAIMS MOMENTUM AS BUYERS BREAK HIGHS AFTER EXTENDED BLEED! 📈
Entry: 0.04828 ⚡
Target: 0.04885 🎯
Stop Loss: 0.0479 ⚠️
📌 Sellers ran out of gas after an extended bleed, and aggressive bids just reclaimed momentum by taking out the previous candle high. ⚡ This structural shift confirms responsive buyers stepping into the order book to defend the lows.
💡 The tactical play here is locking gains into the immediate 0.04885 level while letting secondary runners hunt 0.04923 and 0.0498. 📊 With risk strictly anchored below 0.0479, the setup offers clean asymmetry for patient execution.
💬 Are you taking the recovery trigger here, or waiting for higher confirmation above 0.049? 👇
⚠️ Not financial advice. Always manage your risk. 🛡️
🏷️ #SEI #LongSetup #Trading #Altcoins #Crypto
⚡ 🎯
Entry: 0.04828 ⚡
Target: 0.04885 🎯
Stop Loss: 0.0479 ⚠️
📌 Sellers ran out of gas after an extended bleed, and aggressive bids just reclaimed momentum by taking out the previous candle high. ⚡ This structural shift confirms responsive buyers stepping into the order book to defend the lows.
💡 The tactical play here is locking gains into the immediate 0.04885 level while letting secondary runners hunt 0.04923 and 0.0498. 📊 With risk strictly anchored below 0.0479, the setup offers clean asymmetry for patient execution.
💬 Are you taking the recovery trigger here, or waiting for higher confirmation above 0.049? 👇
⚠️ Not financial advice. Always manage your risk. 🛡️
🏷️ #SEI #LongSetup #Trading #Altcoins #Crypto
⚡ 🎯
20

The explainer on perpetual funding rates for $SEI just came out, and its 0.75% initial margin ratio immediately shatters many beginners’ illusions about leverage.
$SEI is now quoted at 0.047610, down 1.04% over 24 hours. It’s nowhere on the trending lists, and money isn’t flowing into it.
This funding rate explainer is just a delayed take on the market—it offers no new trading signals. Right now, the price action is simply bottoming out along with the broader market.
There’s just one practical takeaway: don’t rush into leverage. If you want to test the waters, use at most 10% of your position and keep 90% in reserve until volume confirms the move.
What should you do now? Either watch to see if $SEI can break above 0.048 on rising volume, or join Spot Tournament S10 to practice and earn Write2Earn rewards.
Are you currently holding $SEI ? Reply 1 if you are, or 2 if you’re sitting on the sidelines waiting for a signal.
#Write2Earn #BinanceSquare #SEI #Futures #HalloweenPumpkinFrenzy
The explainer on perpetual funding rates for $SEI just came out, and its 0.75% initial margin ratio immediately shatters many beginners’ illusions about leverage.
$SEI is now quoted at 0.047610, down 1.04% over 24 hours. It’s nowhere on the trending lists, and money isn’t flowing into it.
This funding rate explainer is just a delayed take on the market—it offers no new trading signals. Right now, the price action is simply bottoming out along with the broader market.
There’s just one practical takeaway: don’t rush into leverage. If you want to test the waters, use at most 10% of your position and keep 90% in reserve until volume confirms the move.
What should you do now? Either watch to see if $SEI can break above 0.048 on rising volume, or join Spot Tournament S10 to practice and earn Write2Earn rewards.
Are you currently holding $SEI ? Reply 1 if you are, or 2 if you’re sitting on the sidelines waiting for a signal.
#Write2Earn #BinanceSquare #SEI #Futures #HalloweenPumpkinFrenzy
$SEI is now quoted at 0.047610, down 1.04% over 24 hours. It’s nowhere on the trending lists, and money isn’t flowing into it.
This funding rate explainer is just a delayed take on the market—it offers no new trading signals. Right now, the price action is simply bottoming out along with the broader market.
There’s just one practical takeaway: don’t rush into leverage. If you want to test the waters, use at most 10% of your position and keep 90% in reserve until volume confirms the move.
What should you do now? Either watch to see if $SEI can break above 0.048 on rising volume, or join Spot Tournament S10 to practice and earn Write2Earn rewards.
Are you currently holding $SEI ? Reply 1 if you are, or 2 if you’re sitting on the sidelines waiting for a signal.
#Write2Earn #BinanceSquare #SEI #Futures #HalloweenPumpkinFrenzy
4

·
--
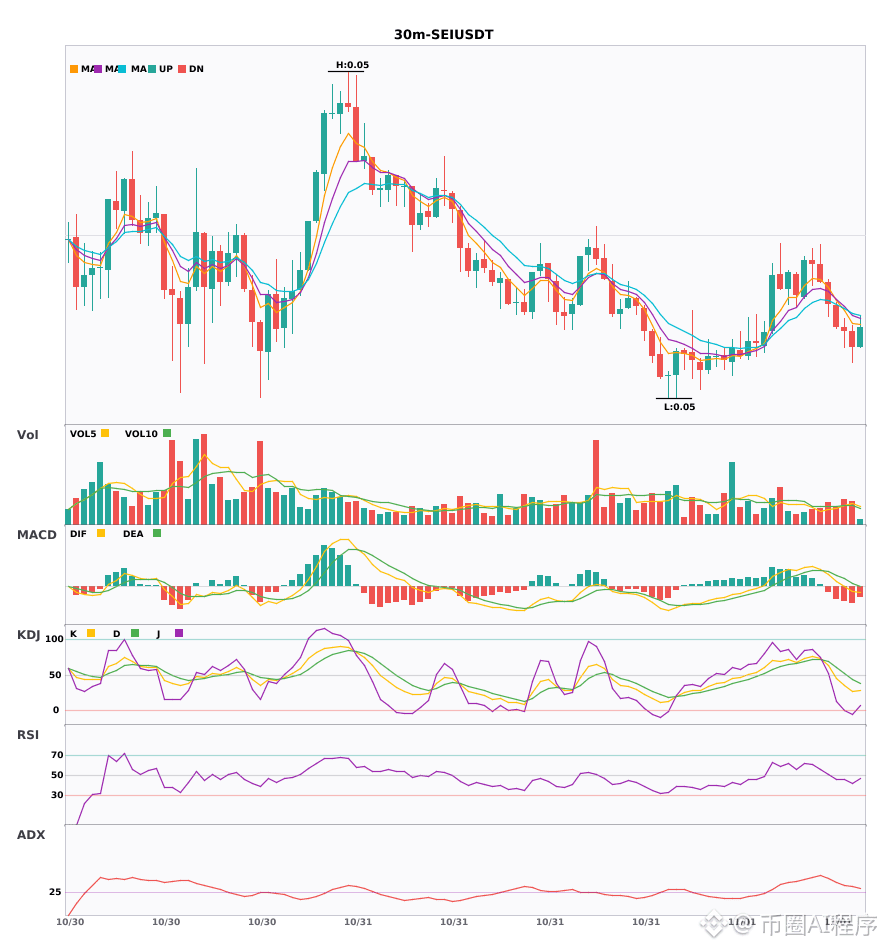
$SEI 30-minute convergence: 4-hour bearish trend. Bearish warning—watch the risk 🔥
════════════════════
🟢 $SEI 30-minute bearish signal
⚠️Technical analysis: 4-hour bearish convergence confirmed | 30-minute entry: MACD is bearish, the trend is weak, and momentum is strengthening | EMA5 < EMA8 < EMA13: bearish alignment | KDJ is weak, with bears in control (K: 27.5, D: 43.9) | Normal volume (1.3x)
════════════════════
🔔 Follow for the latest market movements 🔔
#多周期共振 #SEI
📌 When trading, check whether the candlestick pattern matches.
$SEI 30-minute convergence: 4-hour bearish trend. Bearish warning—watch the risk 🔥
════════════════════
🟢 $SEI 30-minute bearish signal
⚠️Technical analysis: 4-hour bearish convergence confirmed | 30-minute entry: MACD is bearish, the trend is weak, and momentum is strengthening | EMA5 < EMA8 < EMA13: bearish alignment | KDJ is weak, with bears in control (K: 27.5, D: 43.9) | Normal volume (1.3x)
════════════════════
🔔 Follow for the latest market movements 🔔
#多周期共振 #SEI
📌 When trading, check whether the candlestick pattern matches.
════════════════════
🟢 $SEI 30-minute bearish signal
⚠️Technical analysis: 4-hour bearish convergence confirmed | 30-minute entry: MACD is bearish, the trend is weak, and momentum is strengthening | EMA5 < EMA8 < EMA13: bearish alignment | KDJ is weak, with bears in control (K: 27.5, D: 43.9) | Normal volume (1.3x)
════════════════════
🔔 Follow for the latest market movements 🔔
#多周期共振 #SEI
📌 When trading, check whether the candlestick pattern matches.
8
·
--
See translation
$SEI moves 1.0 percent an hour and most people size it like a stablecoin
That hourly ATR is your natural yardstick for risk control
Say your account holds 1000 dollars total
You want to risk exactly 1 percent which is 10 dollars
With the hourly ATR at 0.00048 dollars a stop at that distance costs 10 dollars if you buy about 20687 units of $SEI
Position size is just math dividing your risk by the distance to your stop
Always calculate your size before you enter instead of guessing
What risk percentage do you use on each trade
#SEI #TradingTips
$SEI moves 1.0 percent an hour and most people size it like a stablecoin
That hourly ATR is your natural yardstick for risk control
Say your account holds 1000 dollars total
You want to risk exactly 1 percent which is 10 dollars
With the hourly ATR at 0.00048 dollars a stop at that distance costs 10 dollars if you buy about 20687 units of $SEI
Position size is just math dividing your risk by the distance to your stop
Always calculate your size before you enter instead of guessing
What risk percentage do you use on each trade
#SEI #TradingTips
That hourly ATR is your natural yardstick for risk control
Say your account holds 1000 dollars total
You want to risk exactly 1 percent which is 10 dollars
With the hourly ATR at 0.00048 dollars a stop at that distance costs 10 dollars if you buy about 20687 units of $SEI
Position size is just math dividing your risk by the distance to your stop
Always calculate your size before you enter instead of guessing
What risk percentage do you use on each trade
#SEI #TradingTips
9
Log in to explore more content
Join global crypto users on Binance Square
⚡️ Get latest and useful information about crypto.
💬 Trusted by the world’s largest crypto exchange.
👍 Discover real insights from verified creators.
Email / Phone number
Trending Topics
1
#BinanceWithdrawalScamWarning
13,313 views
411 Discussing
2
#USMidtermElections
563,367 views
2,974 Discussing
3
#USOctoberNFP-AreRateCutsStillPossible
22,266 views
397 Discussing
4
#AppleEarningsAhead-CanStockHitNewHigh
7,506 views
284 Discussing
5
#Verify1to1BinanceReserves
20,927 views
312 Discussing
6
#BinanceRestores28FiatWithdrawals
102,145 views
948 Discussing
7
#StrategyRepurchases$208MSTRCAdds811Bitcoin
3,538 views
15 Discussing
8
#FATFLaunchesReviewOfCryptoHubsMoneyLaunderingControls
486 views
9 Discussing
9
#BinanceProcesses$4.65BWithdrawals
98,613 views
356 Discussing
10
#HKMALaunchesSAGEAgenticFinanceProject
2,850 views
150 Discussing