
#onchainanalysis
onchainanalysis
851,239 views
2,301 Discussing
Hot
Latest

·
--
See translation
On-chain analysis is the blockchain’s public order flow.
Instead of looking only at candles, analysts study wallet and network behavior:
• Exchange inflows: coins moving to exchanges may increase potential sell supply.
• Exchange outflows: withdrawals can indicate custody or accumulation—but context matters.
• Whale transfers: large movements deserve investigation, not automatic bullish or bearish labels.
• Stablecoin supply: expanding liquidity can support activity; contraction can reduce it.
• Active addresses and transaction count: useful measures of network participation.
• Realized price and coin age: help reveal where holders may be in profit or loss.
• Holder concentration: identifies how much supply is controlled by a small group.
A reliable workflow has three steps:
1. Define a question: “Are long-term holders distributing?”
2. Compare multiple metrics against historical baselines.
3. Check price, derivatives, liquidity and macro context before forming a thesis.
A single large transfer is not a signal. It may be an internal wallet movement, custody reshuffle or operational transaction.
Blockchain data is transparent, but interpretation is not automatic. Good on-chain analysis combines verifiable data with time, context and disciplined uncertainty.
Learn the fundamentals through Binance Academy, then practise tracing transactions with a block explorer.
Educational content only. Not financial advice.
#OnChainAnalysis #CryptoEducation #BinanceAngels
On-chain analysis is the blockchain’s public order flow.
Instead of looking only at candles, analysts study wallet and network behavior:
• Exchange inflows: coins moving to exchanges may increase potential sell supply.
• Exchange outflows: withdrawals can indicate custody or accumulation—but context matters.
• Whale transfers: large movements deserve investigation, not automatic bullish or bearish labels.
• Stablecoin supply: expanding liquidity can support activity; contraction can reduce it.
• Active addresses and transaction count: useful measures of network participation.
• Realized price and coin age: help reveal where holders may be in profit or loss.
• Holder concentration: identifies how much supply is controlled by a small group.
A reliable workflow has three steps:
1. Define a question: “Are long-term holders distributing?”
2. Compare multiple metrics against historical baselines.
3. Check price, derivatives, liquidity and macro context before forming a thesis.
A single large transfer is not a signal. It may be an internal wallet movement, custody reshuffle or operational transaction.
Blockchain data is transparent, but interpretation is not automatic. Good on-chain analysis combines verifiable data with time, context and disciplined uncertainty.
Learn the fundamentals through Binance Academy, then practise tracing transactions with a block explorer.
Educational content only. Not financial advice.
#OnChainAnalysis #CryptoEducation #BinanceAngels
Instead of looking only at candles, analysts study wallet and network behavior:
• Exchange inflows: coins moving to exchanges may increase potential sell supply.
• Exchange outflows: withdrawals can indicate custody or accumulation—but context matters.
• Whale transfers: large movements deserve investigation, not automatic bullish or bearish labels.
• Stablecoin supply: expanding liquidity can support activity; contraction can reduce it.
• Active addresses and transaction count: useful measures of network participation.
• Realized price and coin age: help reveal where holders may be in profit or loss.
• Holder concentration: identifies how much supply is controlled by a small group.
A reliable workflow has three steps:
1. Define a question: “Are long-term holders distributing?”
2. Compare multiple metrics against historical baselines.
3. Check price, derivatives, liquidity and macro context before forming a thesis.
A single large transfer is not a signal. It may be an internal wallet movement, custody reshuffle or operational transaction.
Blockchain data is transparent, but interpretation is not automatic. Good on-chain analysis combines verifiable data with time, context and disciplined uncertainty.
Learn the fundamentals through Binance Academy, then practise tracing transactions with a block explorer.
Educational content only. Not financial advice.
#OnChainAnalysis #CryptoEducation #BinanceAngels
66

·
--
See translation
The most overlooked on-chain signal right now isn't whale accumulation or exchange outflows. It's the widening gap between short-term holder spending and long-term holder dormancy.
When you look at spent output age bands, the pattern is striking: coins moving on-chain are increasingly young — minted within weeks, not years. Meanwhile, the supply that hasn't moved in 3+ years keeps climbing. The market is splitting into two completely different populations.
Short-term holders are hyper-active, cycling positions every pullback and rally. They're providing all the liquidity. Long-term holders are behaving like they don't even check prices anymore. They're not selling into strength. They're not selling into weakness. They've effectively gone dormant.
This matters because it tells you the market's fuel mix. When long-term holders refuse to spend, the float shrinks. Less available supply meets consistent demand = structurally rising price floor. The volatility you see on daily charts is almost entirely short-term holder behavior bouncing off a shrinking supply base.
The signal to watch: when long-term holders finally start spending meaningfully, that's not a sell signal — it's the distribution phase of a cycle top. Until then, every pullback is just noise between two groups that aren't even trading with each other.
$BTC $ETH $BNB
#OnChainAnalysis #Bitcoin #CryptoMarkets #HODL #MarketStructure
The most overlooked on-chain signal right now isn't whale accumulation or exchange outflows. It's the widening gap between short-term holder spending and long-term holder dormancy.
When you look at spent output age bands, the pattern is striking: coins moving on-chain are increasingly young — minted within weeks, not years. Meanwhile, the supply that hasn't moved in 3+ years keeps climbing. The market is splitting into two completely different populations.
Short-term holders are hyper-active, cycling positions every pullback and rally. They're providing all the liquidity. Long-term holders are behaving like they don't even check prices anymore. They're not selling into strength. They're not selling into weakness. They've effectively gone dormant.
This matters because it tells you the market's fuel mix. When long-term holders refuse to spend, the float shrinks. Less available supply meets consistent demand = structurally rising price floor. The volatility you see on daily charts is almost entirely short-term holder behavior bouncing off a shrinking supply base.
The signal to watch: when long-term holders finally start spending meaningfully, that's not a sell signal — it's the distribution phase of a cycle top. Until then, every pullback is just noise between two groups that aren't even trading with each other.
$BTC $ETH $BNB
#OnChainAnalysis #Bitcoin #CryptoMarkets #HODL #MarketStructure
When you look at spent output age bands, the pattern is striking: coins moving on-chain are increasingly young — minted within weeks, not years. Meanwhile, the supply that hasn't moved in 3+ years keeps climbing. The market is splitting into two completely different populations.
Short-term holders are hyper-active, cycling positions every pullback and rally. They're providing all the liquidity. Long-term holders are behaving like they don't even check prices anymore. They're not selling into strength. They're not selling into weakness. They've effectively gone dormant.
This matters because it tells you the market's fuel mix. When long-term holders refuse to spend, the float shrinks. Less available supply meets consistent demand = structurally rising price floor. The volatility you see on daily charts is almost entirely short-term holder behavior bouncing off a shrinking supply base.
The signal to watch: when long-term holders finally start spending meaningfully, that's not a sell signal — it's the distribution phase of a cycle top. Until then, every pullback is just noise between two groups that aren't even trading with each other.
$BTC $ETH $BNB
#OnChainAnalysis #Bitcoin #CryptoMarkets #HODL #MarketStructure
62
·
--
See translation
The crypto markets obsess over transaction counts as a proxy for network health. It is the wrong metric.
A chain processing 10 million transactions per day sounds impressive — until you realize 9.8 million are DEX arbitrage cycles and wash trades between the same three contracts. Raw throughput tells you about activity. It does not tell you about health.
The metric that actually matters is transaction diversity — the number of unique smart contracts being interacted with over a given period. This separates organic ecosystem growth from speculative churn.
When a chain’s transaction count spikes but contract diversity stays flat, you are looking at speculation. When contract diversity climbs even as raw transactions stay steady, you are watching real product-market fit emerge. Developers are building. Users are discovering. Use cases are compounding.
We saw this pattern in 2021. Transaction counts screamed bull market. But contract diversity had already peaked months earlier — the same few DeFi protocols were recycling the same capital. In the bear market that followed, transaction counts collapsed but contract diversity on the strongest chains never returned to zero. New contracts kept deploying. The floor held.
The chains that will matter next are the ones where unique contract interactions are growing faster than token price. $ETH leads on settlement diversity. $SOL shows the widest contract interaction breadth per active wallet. $BNB captures the most diverse user base by transaction type — payments, DeFi, gaming, and identity all coexisting.
Transaction diversity is the on-chain signal that separates builders from casinos. Track it.
#OnChainAnalysis #CryptoMarkets #BlockchainMetrics #Web3 #CryptoInvesting
The crypto markets obsess over transaction counts as a proxy for network health. It is the wrong metric.
A chain processing 10 million transactions per day sounds impressive — until you realize 9.8 million are DEX arbitrage cycles and wash trades between the same three contracts. Raw throughput tells you about activity. It does not tell you about health.
The metric that actually matters is transaction diversity — the number of unique smart contracts being interacted with over a given period. This separates organic ecosystem growth from speculative churn.
When a chain’s transaction count spikes but contract diversity stays flat, you are looking at speculation. When contract diversity climbs even as raw transactions stay steady, you are watching real product-market fit emerge. Developers are building. Users are discovering. Use cases are compounding.
We saw this pattern in 2021. Transaction counts screamed bull market. But contract diversity had already peaked months earlier — the same few DeFi protocols were recycling the same capital. In the bear market that followed, transaction counts collapsed but contract diversity on the strongest chains never returned to zero. New contracts kept deploying. The floor held.
The chains that will matter next are the ones where unique contract interactions are growing faster than token price. $ETH leads on settlement diversity. $SOL shows the widest contract interaction breadth per active wallet. $BNB captures the most diverse user base by transaction type — payments, DeFi, gaming, and identity all coexisting.
Transaction diversity is the on-chain signal that separates builders from casinos. Track it.
#OnChainAnalysis #CryptoMarkets #BlockchainMetrics #Web3 #CryptoInvesting
A chain processing 10 million transactions per day sounds impressive — until you realize 9.8 million are DEX arbitrage cycles and wash trades between the same three contracts. Raw throughput tells you about activity. It does not tell you about health.
The metric that actually matters is transaction diversity — the number of unique smart contracts being interacted with over a given period. This separates organic ecosystem growth from speculative churn.
When a chain’s transaction count spikes but contract diversity stays flat, you are looking at speculation. When contract diversity climbs even as raw transactions stay steady, you are watching real product-market fit emerge. Developers are building. Users are discovering. Use cases are compounding.
We saw this pattern in 2021. Transaction counts screamed bull market. But contract diversity had already peaked months earlier — the same few DeFi protocols were recycling the same capital. In the bear market that followed, transaction counts collapsed but contract diversity on the strongest chains never returned to zero. New contracts kept deploying. The floor held.
The chains that will matter next are the ones where unique contract interactions are growing faster than token price. $ETH leads on settlement diversity. $SOL shows the widest contract interaction breadth per active wallet. $BNB captures the most diverse user base by transaction type — payments, DeFi, gaming, and identity all coexisting.
Transaction diversity is the on-chain signal that separates builders from casinos. Track it.
#OnChainAnalysis #CryptoMarkets #BlockchainMetrics #Web3 #CryptoInvesting
45
·
--
See translation
On-chain analysis: reading what the blockchain actually says.
On-chain analysis means inspecting public blockchain data to understand market behavior—without relying on exchange order books or centralized reports.
Core data you can observe:
• Whale flows: large transfers between wallets, exchanges, cold storage
• Exchange netflows: deposits vs withdrawals signal supply pressure
• Stablecoin mints/burns: on-chain liquidity creation or contraction
• Smart-contract interactions: protocol usage, TVL changes, contract deployments
• Token age/concentration: how long coins are held, who holds supply
• Miner/validator behavior: revenue, selling pressure, staking dynamics
Why it matters:
Price follows flows. On-chain data often moves before price does, and it cannot be spoofed the way off-exchange metrics can.
Common tools:
• Block explorers (Etherscan, BscScan, Tronscan)
• Analytics platforms (Nansen, Arkham, Glassnode, IntoTheBlock, Dune)
• Binance on-chain dashboards and Binance Academy courses
Binance Academy offers a structured on-chain analysis curriculum. Complete it and you can earn a certificate—proof you know how to query, interpret and build theses from raw chain data.
FACT: blockchain data is public and verifiable.
INTERPRETATION: analysis quality depends on the questions you ask and the baselines you set.
Not financial advice.
#OnChainAnalysis #BinanceAcademy #BinanceAngels
On-chain analysis: reading what the blockchain actually says.
On-chain analysis means inspecting public blockchain data to understand market behavior—without relying on exchange order books or centralized reports.
Core data you can observe:
• Whale flows: large transfers between wallets, exchanges, cold storage
• Exchange netflows: deposits vs withdrawals signal supply pressure
• Stablecoin mints/burns: on-chain liquidity creation or contraction
• Smart-contract interactions: protocol usage, TVL changes, contract deployments
• Token age/concentration: how long coins are held, who holds supply
• Miner/validator behavior: revenue, selling pressure, staking dynamics
Why it matters:
Price follows flows. On-chain data often moves before price does, and it cannot be spoofed the way off-exchange metrics can.
Common tools:
• Block explorers (Etherscan, BscScan, Tronscan)
• Analytics platforms (Nansen, Arkham, Glassnode, IntoTheBlock, Dune)
• Binance on-chain dashboards and Binance Academy courses
Binance Academy offers a structured on-chain analysis curriculum. Complete it and you can earn a certificate—proof you know how to query, interpret and build theses from raw chain data.
FACT: blockchain data is public and verifiable.
INTERPRETATION: analysis quality depends on the questions you ask and the baselines you set.
Not financial advice.
#OnChainAnalysis #BinanceAcademy #BinanceAngels
On-chain analysis means inspecting public blockchain data to understand market behavior—without relying on exchange order books or centralized reports.
Core data you can observe:
• Whale flows: large transfers between wallets, exchanges, cold storage
• Exchange netflows: deposits vs withdrawals signal supply pressure
• Stablecoin mints/burns: on-chain liquidity creation or contraction
• Smart-contract interactions: protocol usage, TVL changes, contract deployments
• Token age/concentration: how long coins are held, who holds supply
• Miner/validator behavior: revenue, selling pressure, staking dynamics
Why it matters:
Price follows flows. On-chain data often moves before price does, and it cannot be spoofed the way off-exchange metrics can.
Common tools:
• Block explorers (Etherscan, BscScan, Tronscan)
• Analytics platforms (Nansen, Arkham, Glassnode, IntoTheBlock, Dune)
• Binance on-chain dashboards and Binance Academy courses
Binance Academy offers a structured on-chain analysis curriculum. Complete it and you can earn a certificate—proof you know how to query, interpret and build theses from raw chain data.
FACT: blockchain data is public and verifiable.
INTERPRETATION: analysis quality depends on the questions you ask and the baselines you set.
Not financial advice.
#OnChainAnalysis #BinanceAcademy #BinanceAngels
54

See translation
ULTIMATE $BTC BREAKOUT SIGNAL? ON-CHAIN DATA REVEALS 🚨
A classic technical breakout is forming, but the real alpha is on-chain. Three massive convergence signals are pointing toward a potential game-changing move for Bitcoin:
Institutional Buying Power: Stablecoin Supply Ratio (SSR) shows maxed-out institutional liquidity waiting on the sidelines.
Whale Accumulation: Massive spike in Whale Transaction Count (>$1M) during consolidation.
Supply Shock: Exchange reserves are evaporating rapidly as BTC moves to long-term cold storage.
This isn't just retail noise—this is where institutional smart money is positioning.
Are you looking at the right data or just watching price candles? Drop your thoughts below! 👇
$BTC #OnChainAnalysis #InstitutionalCrypto #CryptoAlpha #TradingSignal
{spot}(BTCUSDT)
ULTIMATE $BTC BREAKOUT SIGNAL? ON-CHAIN DATA REVEALS 🚨
A classic technical breakout is forming, but the real alpha is on-chain. Three massive convergence signals are pointing toward a potential game-changing move for Bitcoin:
Institutional Buying Power: Stablecoin Supply Ratio (SSR) shows maxed-out institutional liquidity waiting on the sidelines.
Whale Accumulation: Massive spike in Whale Transaction Count (>$1M) during consolidation.
Supply Shock: Exchange reserves are evaporating rapidly as BTC moves to long-term cold storage.
This isn't just retail noise—this is where institutional smart money is positioning.
Are you looking at the right data or just watching price candles? Drop your thoughts below! 👇
$BTC #OnChainAnalysis #InstitutionalCrypto #CryptoAlpha #TradingSignal
A classic technical breakout is forming, but the real alpha is on-chain. Three massive convergence signals are pointing toward a potential game-changing move for Bitcoin:
Institutional Buying Power: Stablecoin Supply Ratio (SSR) shows maxed-out institutional liquidity waiting on the sidelines.
Whale Accumulation: Massive spike in Whale Transaction Count (>$1M) during consolidation.
Supply Shock: Exchange reserves are evaporating rapidly as BTC moves to long-term cold storage.
This isn't just retail noise—this is where institutional smart money is positioning.
Are you looking at the right data or just watching price candles? Drop your thoughts below! 👇
$BTC #OnChainAnalysis #InstitutionalCrypto #CryptoAlpha #TradingSignal
53

·
--
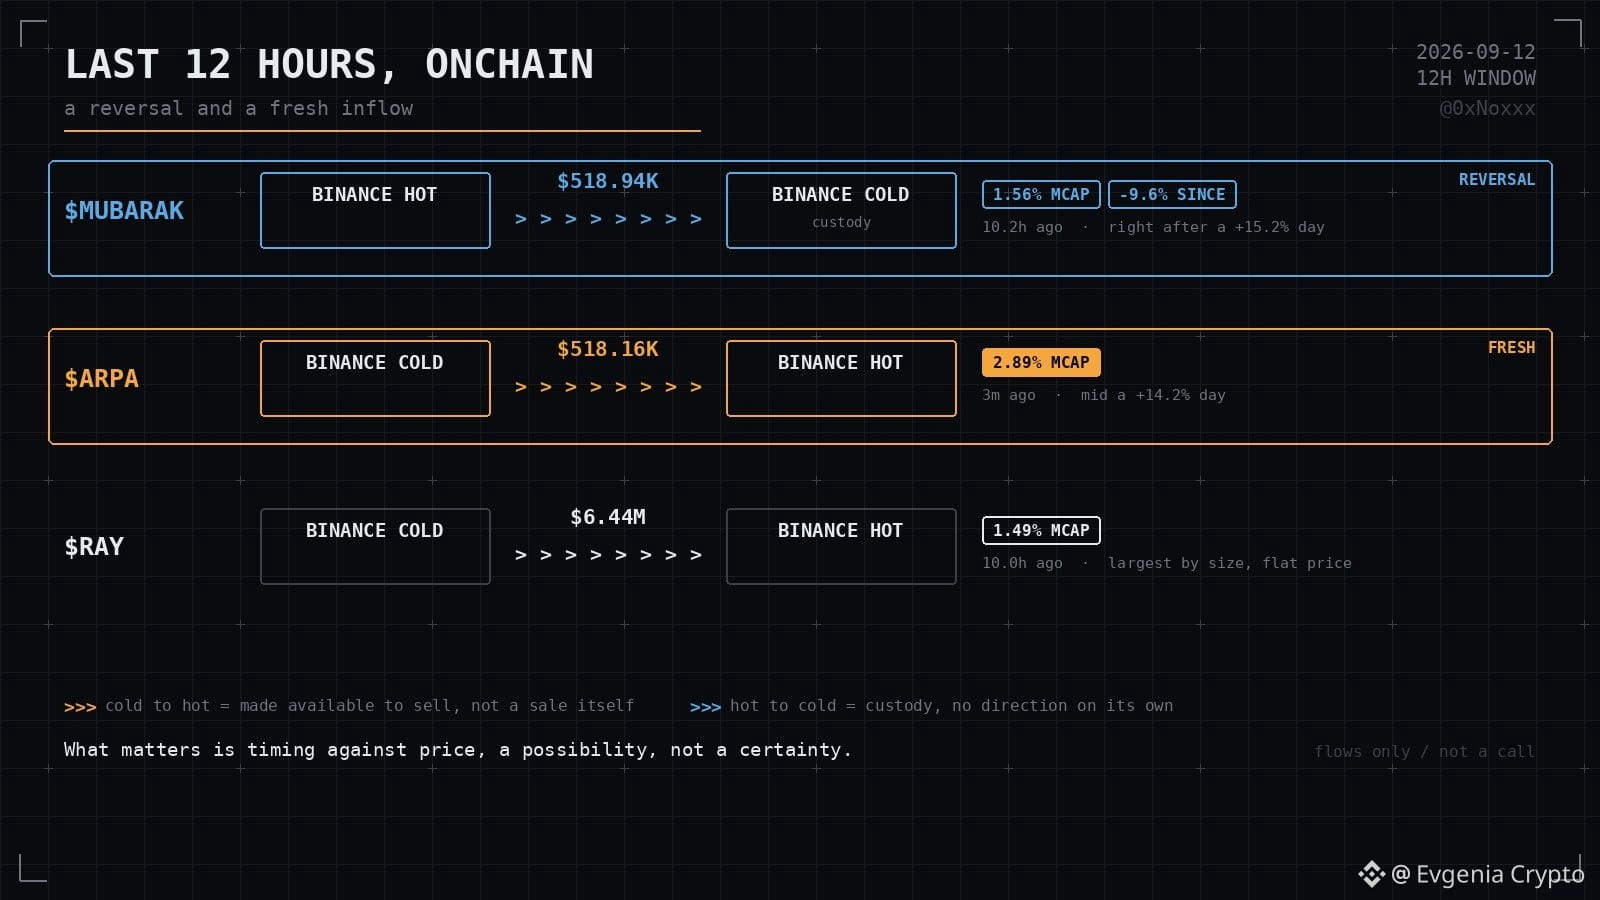
Battle of wallets in real time: a fresh on-chain snapshot reveals dangerous liquidity maneuvers on Binance.
$MUBARAK hid more than $518K in a cold vault amid a 15% growth wave, temporarily offloading the order book.
But $ARPA and the giant $RAY $6.44 million shot from cold straight to hot addresses amid active pump movement.
Exchanges are building inventory for potential sales.
This migration by itself is only a balance-prep step, but the timing at the price peak demands the utmost focus from traders and strict risk management!
#Crypto #OnchainAnalysis #Binance
Battle of wallets in real time: a fresh on-chain snapshot reveals dangerous liquidity maneuvers on Binance.
$MUBARAK hid more than $518K in a cold vault amid a 15% growth wave, temporarily offloading the order book.
But $ARPA and the giant $RAY $6.44 million shot from cold straight to hot addresses amid active pump movement.
Exchanges are building inventory for potential sales.
This migration by itself is only a balance-prep step, but the timing at the price peak demands the utmost focus from traders and strict risk management!
#Crypto #OnchainAnalysis #Binance
$MUBARAK hid more than $518K in a cold vault amid a 15% growth wave, temporarily offloading the order book.
But $ARPA and the giant $RAY $6.44 million shot from cold straight to hot addresses amid active pump movement.
Exchanges are building inventory for potential sales.
This migration by itself is only a balance-prep step, but the timing at the price peak demands the utmost focus from traders and strict risk management!
#Crypto #OnchainAnalysis #Binance
216

·
--
See translation
🦈 INSIDER SMART MONEY TURNS $8.8K INTO OVER $340K ON $EMBER 🔍
Onchain footprint analysis reveals an extraordinary smart money execution in $EMBER . An early wallet absorbed illiquid supply with just $8,850 before systematically distributing into expanding liquidity for $342,000, locking in over $337,000 in realized gains. 📥
This structural play leaves the entity holding 1.86 million remaining tokens as a zero-cost runner while market participants absorb the overhead supply block. 📊 When institutional-style capital extracts massive efficiency while retaining exposure, price structure often enters a crucial repricing phase. 💡
🤔 Do you track wallet accumulation patterns before volume spikes, or wait for secondary market confirmation? 👇
⚠️ Not financial advice. Always manage your risk. 🛡️
🏷️ #EMBER #SmartMoney #OnchainAnalysis #Crypto
🎯 🦈
🦈 INSIDER SMART MONEY TURNS $8.8K INTO OVER $340K ON $EMBER 🔍
Onchain footprint analysis reveals an extraordinary smart money execution in $EMBER . An early wallet absorbed illiquid supply with just $8,850 before systematically distributing into expanding liquidity for $342,000, locking in over $337,000 in realized gains. 📥
This structural play leaves the entity holding 1.86 million remaining tokens as a zero-cost runner while market participants absorb the overhead supply block. 📊 When institutional-style capital extracts massive efficiency while retaining exposure, price structure often enters a crucial repricing phase. 💡
🤔 Do you track wallet accumulation patterns before volume spikes, or wait for secondary market confirmation? 👇
⚠️ Not financial advice. Always manage your risk. 🛡️
🏷️ #EMBER #SmartMoney #OnchainAnalysis #Crypto
🎯 🦈
Onchain footprint analysis reveals an extraordinary smart money execution in $EMBER . An early wallet absorbed illiquid supply with just $8,850 before systematically distributing into expanding liquidity for $342,000, locking in over $337,000 in realized gains. 📥
This structural play leaves the entity holding 1.86 million remaining tokens as a zero-cost runner while market participants absorb the overhead supply block. 📊 When institutional-style capital extracts massive efficiency while retaining exposure, price structure often enters a crucial repricing phase. 💡
🤔 Do you track wallet accumulation patterns before volume spikes, or wait for secondary market confirmation? 👇
⚠️ Not financial advice. Always manage your risk. 🛡️
🏷️ #EMBER #SmartMoney #OnchainAnalysis #Crypto
🎯 🦈
3

On-Chain Analysis: Understanding the movements of the “Whales”
Title: On-chain metrics to track to spot accumulation 🐳🔍
Content:
Blockchain offers unique transparency: all transactions from major wallets are public.
📊 Important On-Chain signals:
1️⃣ Net platform outflows (Exchange Outflows): When large volumes leave exchanges for cold wallets, it indicates a desire to hold (HODL).
2️⃣ Growth in active addresses: An increase in the number of active network addresses confirms adoption and the health of the ecosystem.
3️⃣ Distribution by wallet size: The growth of balances held by large holders signals strategic accumulation.
#OnChainAnalysis #WhaleTracker #BlockchainData #CryptoResearch #Binance @Square-Creator-ce2378404
On-Chain Analysis: Understanding the movements of the “Whales”
Title: On-chain metrics to track to spot accumulation 🐳🔍
Content:
Blockchain offers unique transparency: all transactions from major wallets are public.
📊 Important On-Chain signals:
1️⃣ Net platform outflows (Exchange Outflows): When large volumes leave exchanges for cold wallets, it indicates a desire to hold (HODL).
2️⃣ Growth in active addresses: An increase in the number of active network addresses confirms adoption and the health of the ecosystem.
3️⃣ Distribution by wallet size: The growth of balances held by large holders signals strategic accumulation.
#OnChainAnalysis #WhaleTracker #BlockchainData #CryptoResearch #Binance @BNB
Title: On-chain metrics to track to spot accumulation 🐳🔍
Content:
Blockchain offers unique transparency: all transactions from major wallets are public.
📊 Important On-Chain signals:
1️⃣ Net platform outflows (Exchange Outflows): When large volumes leave exchanges for cold wallets, it indicates a desire to hold (HODL).
2️⃣ Growth in active addresses: An increase in the number of active network addresses confirms adoption and the health of the ecosystem.
3️⃣ Distribution by wallet size: The growth of balances held by large holders signals strategic accumulation.
#OnChainAnalysis #WhaleTracker #BlockchainData #CryptoResearch #Binance @BNB
9

·
--
See translation
Picture this: a political meme token launches with massive fanfare, only to vaporize 95% of its value in under sixty minutes.
Most retail traders know the agony of jumping into a hyped launch, watching the green candles explode, and then finding themselves holding worthless bags before they can even hit the sell button.
We saw this play out again with the $LAPTOP token launch. Despite logging over 46,675 buys against 16,038 sells across 20,000 unique buyers from an initial $0.05 pool price, the chart fell off a cliff. On-chain forensics from Bubblemaps quickly flagged that 60% of top-holder wallets were brand new, pointing to classic insider sniping and liquidity drainage that heavily mirrors previous political tokens like $TRUMP and $BODEN.
While the team denies any insider dumping, claims their allocation remains locked, and promises 4M $LAPTOP in liquidity incentives, the initial damage is already done. Sniper bots and fragmented liquidity crushed retail momentum before the project could even establish a healthy baseline.
Do you think these political meme launches can ever fix their sniper bot vulnerabilities, or will retail keep getting drained the same way every cycle?
#CryptoTrading #Memecoins #OnChainAnalysis
Picture this: a political meme token launches with massive fanfare, only to vaporize 95% of its value in under sixty minutes.
Most retail traders know the agony of jumping into a hyped launch, watching the green candles explode, and then finding themselves holding worthless bags before they can even hit the sell button.
We saw this play out again with the $LAPTOP token launch. Despite logging over 46,675 buys against 16,038 sells across 20,000 unique buyers from an initial $0.05 pool price, the chart fell off a cliff. On-chain forensics from Bubblemaps quickly flagged that 60% of top-holder wallets were brand new, pointing to classic insider sniping and liquidity drainage that heavily mirrors previous political tokens like $TRUMP and $BODEN.
While the team denies any insider dumping, claims their allocation remains locked, and promises 4M $LAPTOP in liquidity incentives, the initial damage is already done. Sniper bots and fragmented liquidity crushed retail momentum before the project could even establish a healthy baseline.
Do you think these political meme launches can ever fix their sniper bot vulnerabilities, or will retail keep getting drained the same way every cycle?
#CryptoTrading #Memecoins #OnChainAnalysis
Most retail traders know the agony of jumping into a hyped launch, watching the green candles explode, and then finding themselves holding worthless bags before they can even hit the sell button.
We saw this play out again with the $LAPTOP token launch. Despite logging over 46,675 buys against 16,038 sells across 20,000 unique buyers from an initial $0.05 pool price, the chart fell off a cliff. On-chain forensics from Bubblemaps quickly flagged that 60% of top-holder wallets were brand new, pointing to classic insider sniping and liquidity drainage that heavily mirrors previous political tokens like $TRUMP and $BODEN.
While the team denies any insider dumping, claims their allocation remains locked, and promises 4M $LAPTOP in liquidity incentives, the initial damage is already done. Sniper bots and fragmented liquidity crushed retail momentum before the project could even establish a healthy baseline.
Do you think these political meme launches can ever fix their sniper bot vulnerabilities, or will retail keep getting drained the same way every cycle?
#CryptoTrading #Memecoins #OnChainAnalysis
90

·
--
See translation
Why is nobody talking about how easily on-chain volume metrics can trick retail traders into buying an instant collapse?
Most traders see massive buy volume and rush in, only to watch their portfolio evaporate within minutes because they ignored wallet distribution. Getting caught in a 95% drawdown right after launch is a painful reminder that high transaction counts do not guarantee safe liquidity.
The chaotic debut of $LAPTOP proves why headline volume is often misleading. Despite logging 46,675 buys against 16,038 sells across more than 20,000 buyers, the token still crashed over 95% from its initial $0.05 pool price in less than an hour. On the surface, buyer demand seemed overwhelming, but the internal token mechanics told a completely different story.
Bubblemaps revealed that 60% of top-holder wallets were completely fresh. While the team denied selling and blamed sniper bots alongside thin initial liquidity before promising 4M in $LAPTOP incentives, late buyers took the full blow. When trading volatile new listings alongside majors like $BNB, tracking wallet age and true liquidity depth matters far more than raw hype.
Where do you think this goes from here?
#CryptoTrading #MemeCoins #OnChainAnalysis
Why is nobody talking about how easily on-chain volume metrics can trick retail traders into buying an instant collapse?
Most traders see massive buy volume and rush in, only to watch their portfolio evaporate within minutes because they ignored wallet distribution. Getting caught in a 95% drawdown right after launch is a painful reminder that high transaction counts do not guarantee safe liquidity.
The chaotic debut of $LAPTOP proves why headline volume is often misleading. Despite logging 46,675 buys against 16,038 sells across more than 20,000 buyers, the token still crashed over 95% from its initial $0.05 pool price in less than an hour. On the surface, buyer demand seemed overwhelming, but the internal token mechanics told a completely different story.
Bubblemaps revealed that 60% of top-holder wallets were completely fresh. While the team denied selling and blamed sniper bots alongside thin initial liquidity before promising 4M in $LAPTOP incentives, late buyers took the full blow. When trading volatile new listings alongside majors like $BNB , tracking wallet age and true liquidity depth matters far more than raw hype.
Where do you think this goes from here?
#CryptoTrading #MemeCoins #OnChainAnalysis
Most traders see massive buy volume and rush in, only to watch their portfolio evaporate within minutes because they ignored wallet distribution. Getting caught in a 95% drawdown right after launch is a painful reminder that high transaction counts do not guarantee safe liquidity.
The chaotic debut of $LAPTOP proves why headline volume is often misleading. Despite logging 46,675 buys against 16,038 sells across more than 20,000 buyers, the token still crashed over 95% from its initial $0.05 pool price in less than an hour. On the surface, buyer demand seemed overwhelming, but the internal token mechanics told a completely different story.
Bubblemaps revealed that 60% of top-holder wallets were completely fresh. While the team denied selling and blamed sniper bots alongside thin initial liquidity before promising 4M in $LAPTOP incentives, late buyers took the full blow. When trading volatile new listings alongside majors like $BNB , tracking wallet age and true liquidity depth matters far more than raw hype.
Where do you think this goes from here?
#CryptoTrading #MemeCoins #OnChainAnalysis

15
·
--
See translation
Nearly three times more people bought into the $LAPTOP launch than sold, yet the token still managed to crash over 95% in less than sixty minutes.
Getting trapped in a launch where buy pressure looks completely dominant only to watch your balance vaporize is one of the most frustrating experiences in on-chain trading. It makes you feel like the game was rigged against you before the pool even opened.
Looking under the hood of this launch tells the real story. The initial pool started at $0.05 per token and drew 46,675 buys from 20,085 distinct buyers against only 16,038 sells. On paper that looks like clear accumulation, but on-chain tracking from Bubblemaps showed that 60% of the top-holder wallets were brand new addresses funded right before launch.
When sniper bots and concentrated fresh wallets dump into thin initial liquidity, raw buyer count cannot save the chart. The team pointed fingers at MEV snipers and pledged 4M tokens in liquidity incentives while stating team allocations remain locked, but the structural damage was already done. Chasing rapid launches on networks like $SOL or Ethereum without checking wallet clustering almost always ends the same way.
How closely do you inspect fresh wallet distribution before jumping into a new token launch?
#CryptoTrading #OnChainAnalysis #DeFi
Nearly three times more people bought into the $LAPTOP launch than sold, yet the token still managed to crash over 95% in less than sixty minutes.
Getting trapped in a launch where buy pressure looks completely dominant only to watch your balance vaporize is one of the most frustrating experiences in on-chain trading. It makes you feel like the game was rigged against you before the pool even opened.
Looking under the hood of this launch tells the real story. The initial pool started at $0.05 per token and drew 46,675 buys from 20,085 distinct buyers against only 16,038 sells. On paper that looks like clear accumulation, but on-chain tracking from Bubblemaps showed that 60% of the top-holder wallets were brand new addresses funded right before launch.
When sniper bots and concentrated fresh wallets dump into thin initial liquidity, raw buyer count cannot save the chart. The team pointed fingers at MEV snipers and pledged 4M tokens in liquidity incentives while stating team allocations remain locked, but the structural damage was already done. Chasing rapid launches on networks like $SOL or Ethereum without checking wallet clustering almost always ends the same way.
How closely do you inspect fresh wallet distribution before jumping into a new token launch?
#CryptoTrading #OnChainAnalysis #DeFi
Getting trapped in a launch where buy pressure looks completely dominant only to watch your balance vaporize is one of the most frustrating experiences in on-chain trading. It makes you feel like the game was rigged against you before the pool even opened.
Looking under the hood of this launch tells the real story. The initial pool started at $0.05 per token and drew 46,675 buys from 20,085 distinct buyers against only 16,038 sells. On paper that looks like clear accumulation, but on-chain tracking from Bubblemaps showed that 60% of the top-holder wallets were brand new addresses funded right before launch.
When sniper bots and concentrated fresh wallets dump into thin initial liquidity, raw buyer count cannot save the chart. The team pointed fingers at MEV snipers and pledged 4M tokens in liquidity incentives while stating team allocations remain locked, but the structural damage was already done. Chasing rapid launches on networks like $SOL or Ethereum without checking wallet clustering almost always ends the same way.
How closely do you inspect fresh wallet distribution before jumping into a new token launch?
#CryptoTrading #OnChainAnalysis #DeFi

21

·
--
See translation
Over 46,000 buy orders hit the tape, yet buyers still watched their capital vanish by 95% in less than sixty minutes.
That sick feeling in your stomach when a chart collapses before you can even approve a swap transaction is something every on-chain participant knows all too well. You tell yourself this launch will be different, only to realize the game was decided before the pool even opened.
We saw this play out with the recent $LAPTOP launch, where 20,085 eager buyers were completely overpowered by just 8,714 sellers. On-chain forensics from Bubblemaps revealed that 60% of the top-holding wallets were brand new addresses created right before launch. While retail was busy bidding the initial $0.05 liquidity price, automated snipers and coordinated insiders had already drained the pool liquidity, leaving everyday traders holding the bag.
I have seen this exact playbook run across every single cycle since early $ETH decentralized trading began, and later during the $SOL memecoin mania. Devs always point fingers at low depth or promise millions in future liquidity incentives after the damage is done, but the math never lies: when fresh insider wallets dominate the supply distribution at block zero, retail exit liquidity always pays the bill.
How do you usually spot and avoid sniper-heavy token launches before committing your capital?
#CryptoTrading #OnChainAnalysis #RiskManagement
Over 46,000 buy orders hit the tape, yet buyers still watched their capital vanish by 95% in less than sixty minutes.
That sick feeling in your stomach when a chart collapses before you can even approve a swap transaction is something every on-chain participant knows all too well. You tell yourself this launch will be different, only to realize the game was decided before the pool even opened.
We saw this play out with the recent $LAPTOP launch, where 20,085 eager buyers were completely overpowered by just 8,714 sellers. On-chain forensics from Bubblemaps revealed that 60% of the top-holding wallets were brand new addresses created right before launch. While retail was busy bidding the initial $0.05 liquidity price, automated snipers and coordinated insiders had already drained the pool liquidity, leaving everyday traders holding the bag.
I have seen this exact playbook run across every single cycle since early $ETH decentralized trading began, and later during the $SOL memecoin mania. Devs always point fingers at low depth or promise millions in future liquidity incentives after the damage is done, but the math never lies: when fresh insider wallets dominate the supply distribution at block zero, retail exit liquidity always pays the bill.
How do you usually spot and avoid sniper-heavy token launches before committing your capital?
#CryptoTrading #OnChainAnalysis #RiskManagement
That sick feeling in your stomach when a chart collapses before you can even approve a swap transaction is something every on-chain participant knows all too well. You tell yourself this launch will be different, only to realize the game was decided before the pool even opened.
We saw this play out with the recent $LAPTOP launch, where 20,085 eager buyers were completely overpowered by just 8,714 sellers. On-chain forensics from Bubblemaps revealed that 60% of the top-holding wallets were brand new addresses created right before launch. While retail was busy bidding the initial $0.05 liquidity price, automated snipers and coordinated insiders had already drained the pool liquidity, leaving everyday traders holding the bag.
I have seen this exact playbook run across every single cycle since early $ETH decentralized trading began, and later during the $SOL memecoin mania. Devs always point fingers at low depth or promise millions in future liquidity incentives after the damage is done, but the math never lies: when fresh insider wallets dominate the supply distribution at block zero, retail exit liquidity always pays the bill.
How do you usually spot and avoid sniper-heavy token launches before committing your capital?
#CryptoTrading #OnChainAnalysis #RiskManagement
8

See translation
Have you noticed how retail traders keep falling for hyped token launches even when the on-chain data clearly screams danger?
Most people jump in out of pure FOMO during the opening candle, only to watch their portfolio evaporate in minutes while insiders and automated snipers exit. It remains the fastest way to lose capital in fast-moving market cycles.
Look at what just unfolded with the $LAPTOP launch, which collapsed over 95 percent within its very first hour from the initial 0.05 pool price. Despite logging 20,085 buyers and 46,675 buy orders versus only 16,038 sells, standard market participants were completely crushed. Bubblemaps data revealed that 60 percent of top-holder wallets were brand new, making the official explanation about low liquidity and external bots difficult to accept at face value.
Before risking capital on volatile assets across $BNB or major chains, stop prioritizing buy volume and start auditing wallet age alongside liquidity distribution. The project team is now pledging 4M tokens in liquidity incentives to stabilize the market, but structural liquidity should always be secured before opening the doors to public trading.
How do you protect your portfolio when trading high-profile token launches like this?
#CryptoTrading #Memecoins #OnChainAnalysis
Have you noticed how retail traders keep falling for hyped token launches even when the on-chain data clearly screams danger?
Most people jump in out of pure FOMO during the opening candle, only to watch their portfolio evaporate in minutes while insiders and automated snipers exit. It remains the fastest way to lose capital in fast-moving market cycles.
Look at what just unfolded with the $LAPTOP launch, which collapsed over 95 percent within its very first hour from the initial 0.05 pool price. Despite logging 20,085 buyers and 46,675 buy orders versus only 16,038 sells, standard market participants were completely crushed. Bubblemaps data revealed that 60 percent of top-holder wallets were brand new, making the official explanation about low liquidity and external bots difficult to accept at face value.
Before risking capital on volatile assets across $BNB or major chains, stop prioritizing buy volume and start auditing wallet age alongside liquidity distribution. The project team is now pledging 4M tokens in liquidity incentives to stabilize the market, but structural liquidity should always be secured before opening the doors to public trading.
How do you protect your portfolio when trading high-profile token launches like this?
#CryptoTrading #Memecoins #OnChainAnalysis
Most people jump in out of pure FOMO during the opening candle, only to watch their portfolio evaporate in minutes while insiders and automated snipers exit. It remains the fastest way to lose capital in fast-moving market cycles.
Look at what just unfolded with the $LAPTOP launch, which collapsed over 95 percent within its very first hour from the initial 0.05 pool price. Despite logging 20,085 buyers and 46,675 buy orders versus only 16,038 sells, standard market participants were completely crushed. Bubblemaps data revealed that 60 percent of top-holder wallets were brand new, making the official explanation about low liquidity and external bots difficult to accept at face value.
Before risking capital on volatile assets across $BNB or major chains, stop prioritizing buy volume and start auditing wallet age alongside liquidity distribution. The project team is now pledging 4M tokens in liquidity incentives to stabilize the market, but structural liquidity should always be secured before opening the doors to public trading.
How do you protect your portfolio when trading high-profile token launches like this?
#CryptoTrading #Memecoins #OnChainAnalysis

44

See translation
A token can have nearly three times more buy transactions than sells and still dump 95% in less than an hour.
Most retail traders see green buy-pressure on the chart, rush in thinking it is organic momentum, and end up holding worthless bags before they can even set a stop-loss.
That is exactly what just went down with the $LAPTOP launch. Despite clocking 46,675 buys against just 16,038 sells from over 20,085 unique buyers, the price utterly collapsed from its initial pool price of $0.05 per token.
The real story was hiding on-chain. Bubblemaps flagged that roughly 60% of top-holder wallets were brand new fresh addresses, pointing to heavy sniper clustering right at block zero. While the team blamed snipers and thin liquidity rather than internal unlocks, promising 4M in token incentives to revive interest, the damage was already done for everyday $BNB and meme traders chasing the hype.
Where do you think the line between predatory sniper volume and genuine community momentum sits right now?
#CryptoTrading #OnChainAnalysis #DeFi
A token can have nearly three times more buy transactions than sells and still dump 95% in less than an hour.
Most retail traders see green buy-pressure on the chart, rush in thinking it is organic momentum, and end up holding worthless bags before they can even set a stop-loss.
That is exactly what just went down with the $LAPTOP launch. Despite clocking 46,675 buys against just 16,038 sells from over 20,085 unique buyers, the price utterly collapsed from its initial pool price of $0.05 per token.
The real story was hiding on-chain. Bubblemaps flagged that roughly 60% of top-holder wallets were brand new fresh addresses, pointing to heavy sniper clustering right at block zero. While the team blamed snipers and thin liquidity rather than internal unlocks, promising 4M in token incentives to revive interest, the damage was already done for everyday $BNB and meme traders chasing the hype.
Where do you think the line between predatory sniper volume and genuine community momentum sits right now?
#CryptoTrading #OnChainAnalysis #DeFi
Most retail traders see green buy-pressure on the chart, rush in thinking it is organic momentum, and end up holding worthless bags before they can even set a stop-loss.
That is exactly what just went down with the $LAPTOP launch. Despite clocking 46,675 buys against just 16,038 sells from over 20,085 unique buyers, the price utterly collapsed from its initial pool price of $0.05 per token.
The real story was hiding on-chain. Bubblemaps flagged that roughly 60% of top-holder wallets were brand new fresh addresses, pointing to heavy sniper clustering right at block zero. While the team blamed snipers and thin liquidity rather than internal unlocks, promising 4M in token incentives to revive interest, the damage was already done for everyday $BNB and meme traders chasing the hype.
Where do you think the line between predatory sniper volume and genuine community momentum sits right now?
#CryptoTrading #OnChainAnalysis #DeFi

18
·
--
See translation
Picture this: you ape into a hyped celebrity memecoin right at launch, only to watch your portfolio evaporate by 95% before your coffee even gets cold.
Most retail traders know the sting of buying the top on political tokens, thinking early volume means organic momentum when in reality snipers and insiders are already unloading.
Here is what happened with the $LAPTOP launch. Despite showing massive demand with 46,675 buy orders from over 20,000 unique buyers against just 16,038 sells, the price crashed from its initial $0.05 pool almost instantly. Onchain analysis from Bubblemaps revealed that 60% of the top-holder wallets were brand new addresses created right before trading went live.
We saw a nearly identical script play out with past political hype tokens like $TRUMP and early $BODEN runs, where sniper bots drained initial liquidity pools before retail could even approve their transactions. The team claimed dev tokens stayed locked and blamed low liquidity alongside MEV bots, promising 4 million tokens in liquidity incentives to patch the damage. But much like previous hyped runs, once initial trust breaks in a memecoin ecosystem, capital rarely sticks around for the recovery plan.
Do you think celebrity and political memecoins will ever fix their launch liquidity problems, or are retail traders always destined to be exit exit liquidity for snipers?
#CryptoTrading #MemeCoins #OnChainAnalysis
Picture this: you ape into a hyped celebrity memecoin right at launch, only to watch your portfolio evaporate by 95% before your coffee even gets cold.
Most retail traders know the sting of buying the top on political tokens, thinking early volume means organic momentum when in reality snipers and insiders are already unloading.
Here is what happened with the $LAPTOP launch. Despite showing massive demand with 46,675 buy orders from over 20,000 unique buyers against just 16,038 sells, the price crashed from its initial $0.05 pool almost instantly. Onchain analysis from Bubblemaps revealed that 60% of the top-holder wallets were brand new addresses created right before trading went live.
We saw a nearly identical script play out with past political hype tokens like $TRUMP and early $BODEN runs, where sniper bots drained initial liquidity pools before retail could even approve their transactions. The team claimed dev tokens stayed locked and blamed low liquidity alongside MEV bots, promising 4 million tokens in liquidity incentives to patch the damage. But much like previous hyped runs, once initial trust breaks in a memecoin ecosystem, capital rarely sticks around for the recovery plan.
Do you think celebrity and political memecoins will ever fix their launch liquidity problems, or are retail traders always destined to be exit exit liquidity for snipers?
#CryptoTrading #MemeCoins #OnChainAnalysis
Most retail traders know the sting of buying the top on political tokens, thinking early volume means organic momentum when in reality snipers and insiders are already unloading.
Here is what happened with the $LAPTOP launch. Despite showing massive demand with 46,675 buy orders from over 20,000 unique buyers against just 16,038 sells, the price crashed from its initial $0.05 pool almost instantly. Onchain analysis from Bubblemaps revealed that 60% of the top-holder wallets were brand new addresses created right before trading went live.
We saw a nearly identical script play out with past political hype tokens like $TRUMP and early $BODEN runs, where sniper bots drained initial liquidity pools before retail could even approve their transactions. The team claimed dev tokens stayed locked and blamed low liquidity alongside MEV bots, promising 4 million tokens in liquidity incentives to patch the damage. But much like previous hyped runs, once initial trust breaks in a memecoin ecosystem, capital rarely sticks around for the recovery plan.
Do you think celebrity and political memecoins will ever fix their launch liquidity problems, or are retail traders always destined to be exit exit liquidity for snipers?
#CryptoTrading #MemeCoins #OnChainAnalysis

1
82
·
--
See translation
If you are still chasing unvetted celebrity narrative launches in the first five minutes, this costly habit will drain your portfolio dry.
We have all felt that sudden adrenaline rush when a trending ticker appears, only to watch liquidity vanish and realize we bought the exact top while insiders exit.
The launch of $LAPTOP proved once again why early sniper dynamics crush retail buyers. Within the very first hour, the price plunged over 95 percent despite having 46,675 buy orders against just 16,038 sells. On-chain data from Bubblemaps revealed that roughly 60 percent of top-holder wallets were brand new addresses created right before trading went live.
While the team blamed low liquidity and sniper bots rather than developer dumps, promising 4 million $LAPTOP in liquidity incentives, the chart looks identical to previous political token runs like $TRUMP where early liquidity extraction leaves late entrants holding deep losses.
Do you think these political meme launches can ever build sustainable liquidity, or are they strictly sniper games at this point?
#CryptoTrading #MemeCoins #OnChainAnalysis
If you are still chasing unvetted celebrity narrative launches in the first five minutes, this costly habit will drain your portfolio dry.
We have all felt that sudden adrenaline rush when a trending ticker appears, only to watch liquidity vanish and realize we bought the exact top while insiders exit.
The launch of $LAPTOP proved once again why early sniper dynamics crush retail buyers. Within the very first hour, the price plunged over 95 percent despite having 46,675 buy orders against just 16,038 sells. On-chain data from Bubblemaps revealed that roughly 60 percent of top-holder wallets were brand new addresses created right before trading went live.
While the team blamed low liquidity and sniper bots rather than developer dumps, promising 4 million $LAPTOP in liquidity incentives, the chart looks identical to previous political token runs like $TRUMP where early liquidity extraction leaves late entrants holding deep losses.
Do you think these political meme launches can ever build sustainable liquidity, or are they strictly sniper games at this point?
#CryptoTrading #MemeCoins #OnChainAnalysis
We have all felt that sudden adrenaline rush when a trending ticker appears, only to watch liquidity vanish and realize we bought the exact top while insiders exit.
The launch of $LAPTOP proved once again why early sniper dynamics crush retail buyers. Within the very first hour, the price plunged over 95 percent despite having 46,675 buy orders against just 16,038 sells. On-chain data from Bubblemaps revealed that roughly 60 percent of top-holder wallets were brand new addresses created right before trading went live.
While the team blamed low liquidity and sniper bots rather than developer dumps, promising 4 million $LAPTOP in liquidity incentives, the chart looks identical to previous political token runs like $TRUMP where early liquidity extraction leaves late entrants holding deep losses.
Do you think these political meme launches can ever build sustainable liquidity, or are they strictly sniper games at this point?
#CryptoTrading #MemeCoins #OnChainAnalysis

125
·
--
See translation
Why is nobody talking about how easily retail gets farmed on high-profile meme token launches?
Most traders jump into trending launches expecting an instant multiplier, only to watch their balance evaporate before they can even approve a swap transaction.
The recent rollout of $LAPTOP shows exactly how this trap plays out. Despite having 20,085 buyers and over 46,675 buy orders dominating the initial pool at $0.05, the price cratered by more than 95% in the first sixty minutes. The order book looked overwhelmingly bullish on the surface, but on-chain data revealed that 60% of top-holder wallets were brand-new addresses ready to dump.
Blaming trading bots and thin liquidity is the oldest excuse in the book when early snipers extract all the capital from retail buyers chasing $SOL pairs. Promising 4 million tokens in future liquidity incentives does nothing to fix the fundamental problem of insider-heavy supply distribution. If you want to survive these launches, you need to track wallet age and holder concentration before putting fresh $USDT on the line.
How do you filter out insider-heavy launches before jumping in?
#CryptoTrading #MemeCoins #OnChainAnalysis
Why is nobody talking about how easily retail gets farmed on high-profile meme token launches?
Most traders jump into trending launches expecting an instant multiplier, only to watch their balance evaporate before they can even approve a swap transaction.
The recent rollout of $LAPTOP shows exactly how this trap plays out. Despite having 20,085 buyers and over 46,675 buy orders dominating the initial pool at $0.05, the price cratered by more than 95% in the first sixty minutes. The order book looked overwhelmingly bullish on the surface, but on-chain data revealed that 60% of top-holder wallets were brand-new addresses ready to dump.
Blaming trading bots and thin liquidity is the oldest excuse in the book when early snipers extract all the capital from retail buyers chasing $SOL pairs. Promising 4 million tokens in future liquidity incentives does nothing to fix the fundamental problem of insider-heavy supply distribution. If you want to survive these launches, you need to track wallet age and holder concentration before putting fresh $USDT on the line.
How do you filter out insider-heavy launches before jumping in?
#CryptoTrading #MemeCoins #OnChainAnalysis
Most traders jump into trending launches expecting an instant multiplier, only to watch their balance evaporate before they can even approve a swap transaction.
The recent rollout of $LAPTOP shows exactly how this trap plays out. Despite having 20,085 buyers and over 46,675 buy orders dominating the initial pool at $0.05, the price cratered by more than 95% in the first sixty minutes. The order book looked overwhelmingly bullish on the surface, but on-chain data revealed that 60% of top-holder wallets were brand-new addresses ready to dump.
Blaming trading bots and thin liquidity is the oldest excuse in the book when early snipers extract all the capital from retail buyers chasing $SOL pairs. Promising 4 million tokens in future liquidity incentives does nothing to fix the fundamental problem of insider-heavy supply distribution. If you want to survive these launches, you need to track wallet age and holder concentration before putting fresh $USDT on the line.
How do you filter out insider-heavy launches before jumping in?
#CryptoTrading #MemeCoins #OnChainAnalysis

53

Bitcoin has just sent an extremely interesting on-chain signal: Sell-side risk (selling risk) has dropped to a historically rare level. 📉
Data shows that investors are almost not panic selling. BTC has held most of August’s gains, and more importantly: the sell volume waiting at the $80K level is gradually disappearing. This suggests a shift in supply and demand—on the supply side, liquidity is running out as holders refuse to hand over coins cheaply. 🧠
When sell risk hits historically low levels, it often coincides with an accumulation phase or a breakout. But remember: on-chain only tells you what *has already happened*, not what *will happen*. Macro factors, ETF flows, or any bad news from the SEC/Fed could still flip the table in an instant.
What on-chain metric are you guys reading to track the current holder sentiment? 👇
#Bitcoin #OnChainAnalysis #BTC #CryptoVietnam #BinanceSquare
Bitcoin has just sent an extremely interesting on-chain signal: Sell-side risk (selling risk) has dropped to a historically rare level. 📉
Data shows that investors are almost not panic selling. BTC has held most of August’s gains, and more importantly: the sell volume waiting at the $80K level is gradually disappearing. This suggests a shift in supply and demand—on the supply side, liquidity is running out as holders refuse to hand over coins cheaply. 🧠
When sell risk hits historically low levels, it often coincides with an accumulation phase or a breakout. But remember: on-chain only tells you what *has already happened*, not what *will happen*. Macro factors, ETF flows, or any bad news from the SEC/Fed could still flip the table in an instant.
What on-chain metric are you guys reading to track the current holder sentiment? 👇
#Bitcoin #OnChainAnalysis #BTC #CryptoVietnam #BinanceSquare
Data shows that investors are almost not panic selling. BTC has held most of August’s gains, and more importantly: the sell volume waiting at the $80K level is gradually disappearing. This suggests a shift in supply and demand—on the supply side, liquidity is running out as holders refuse to hand over coins cheaply. 🧠
When sell risk hits historically low levels, it often coincides with an accumulation phase or a breakout. But remember: on-chain only tells you what *has already happened*, not what *will happen*. Macro factors, ETF flows, or any bad news from the SEC/Fed could still flip the table in an instant.
What on-chain metric are you guys reading to track the current holder sentiment? 👇
#Bitcoin #OnChainAnalysis #BTC #CryptoVietnam #BinanceSquare

82
·
--
See translation
The On-Chain MVRV Gap Is Telling a Story Price Charts Aren't
Most traders evaluate cycle positioning using moving averages and RSI. The deeper signal lives in MVRV — Market Value to Realized Value — and right now it's painting a picture that deserves more attention.
MVRV measures the gap between what the market thinks an asset is worth and what holders actually paid for it. When MVRV pushes above 3.5, historically we're in euphoria territory. Below 1.0, holders are underwater on average — often a generational accumulation zone.
Here's the nuance most people miss: MVRV works differently across assets. $BTC MVRV is a macro cycle indicator. $ETH MVRV reflects staking lock dynamics — when staked supply rises, realized value becomes stickier, compressing the ratio's range. And for $SOL, rapid lockup-vesting cycles distort realized value faster than other L1s.
The signal that matters right now isn't the absolute MVRV reading — it's the divergence between MVRV and price. When price makes new highs but MVRV doesn't follow with the same intensity, it means new buyers are entering at higher cost bases. That's healthy accumulation, not speculative froth.
On-chain data never lies. It just doesn't volunteer information — you have to know where to look.
#MVRV #OnChainAnalysis #CryptoMarkets #CyclePositioning
The On-Chain MVRV Gap Is Telling a Story Price Charts Aren't
Most traders evaluate cycle positioning using moving averages and RSI. The deeper signal lives in MVRV — Market Value to Realized Value — and right now it's painting a picture that deserves more attention.
MVRV measures the gap between what the market thinks an asset is worth and what holders actually paid for it. When MVRV pushes above 3.5, historically we're in euphoria territory. Below 1.0, holders are underwater on average — often a generational accumulation zone.
Here's the nuance most people miss: MVRV works differently across assets. $BTC MVRV is a macro cycle indicator. $ETH MVRV reflects staking lock dynamics — when staked supply rises, realized value becomes stickier, compressing the ratio's range. And for $SOL , rapid lockup-vesting cycles distort realized value faster than other L1s.
The signal that matters right now isn't the absolute MVRV reading — it's the divergence between MVRV and price. When price makes new highs but MVRV doesn't follow with the same intensity, it means new buyers are entering at higher cost bases. That's healthy accumulation, not speculative froth.
On-chain data never lies. It just doesn't volunteer information — you have to know where to look.
#MVRV #OnChainAnalysis #CryptoMarkets #CyclePositioning
Most traders evaluate cycle positioning using moving averages and RSI. The deeper signal lives in MVRV — Market Value to Realized Value — and right now it's painting a picture that deserves more attention.
MVRV measures the gap between what the market thinks an asset is worth and what holders actually paid for it. When MVRV pushes above 3.5, historically we're in euphoria territory. Below 1.0, holders are underwater on average — often a generational accumulation zone.
Here's the nuance most people miss: MVRV works differently across assets. $BTC MVRV is a macro cycle indicator. $ETH MVRV reflects staking lock dynamics — when staked supply rises, realized value becomes stickier, compressing the ratio's range. And for $SOL , rapid lockup-vesting cycles distort realized value faster than other L1s.
The signal that matters right now isn't the absolute MVRV reading — it's the divergence between MVRV and price. When price makes new highs but MVRV doesn't follow with the same intensity, it means new buyers are entering at higher cost bases. That's healthy accumulation, not speculative froth.
On-chain data never lies. It just doesn't volunteer information — you have to know where to look.
#MVRV #OnChainAnalysis #CryptoMarkets #CyclePositioning
76
See translation
Most traders think deep liquidity always protects them from downside, but concentrated liquidity ranges can easily trick you into a false sense of safety.
There is nothing worse than buying what seems like a well-backed token, only to watch the price collapse without any bid support catching the fall.
Looking at the on-chain liquidity for $LAPTOP reveals a textbook liquidity trap in action. The token had an official pool on Aerodrome with just 83K $USDC, while a secondary pool on Uniswap held roughly 380K $USDC. At first glance that total backing looks healthy, but the capital deployment told a completely different story.
That larger pool was set at an extremely low price band. It sat completely dormant during the initial sell-off and only activated after the token had already crashed more than 90% from its starting price. The illusion of deep liquidity was there on the charts, but actual price protection was non-existent when buyers needed it most.
Have you started checking concentrated liquidity ranges before entering new on-chain plays?
#OnChainAnalysis #DeFi #CryptoTrading
Most traders think deep liquidity always protects them from downside, but concentrated liquidity ranges can easily trick you into a false sense of safety.
There is nothing worse than buying what seems like a well-backed token, only to watch the price collapse without any bid support catching the fall.
Looking at the on-chain liquidity for $LAPTOP reveals a textbook liquidity trap in action. The token had an official pool on Aerodrome with just 83K $USDC , while a secondary pool on Uniswap held roughly 380K $USDC . At first glance that total backing looks healthy, but the capital deployment told a completely different story.
That larger pool was set at an extremely low price band. It sat completely dormant during the initial sell-off and only activated after the token had already crashed more than 90% from its starting price. The illusion of deep liquidity was there on the charts, but actual price protection was non-existent when buyers needed it most.
Have you started checking concentrated liquidity ranges before entering new on-chain plays?
#OnChainAnalysis #DeFi #CryptoTrading
There is nothing worse than buying what seems like a well-backed token, only to watch the price collapse without any bid support catching the fall.
Looking at the on-chain liquidity for $LAPTOP reveals a textbook liquidity trap in action. The token had an official pool on Aerodrome with just 83K $USDC , while a secondary pool on Uniswap held roughly 380K $USDC . At first glance that total backing looks healthy, but the capital deployment told a completely different story.
That larger pool was set at an extremely low price band. It sat completely dormant during the initial sell-off and only activated after the token had already crashed more than 90% from its starting price. The illusion of deep liquidity was there on the charts, but actual price protection was non-existent when buyers needed it most.
Have you started checking concentrated liquidity ranges before entering new on-chain plays?
#OnChainAnalysis #DeFi #CryptoTrading

6
Log in to explore more content
Join global crypto users on Binance Square
⚡️ Get latest and useful information about crypto.
💬 Trusted by the world’s largest crypto exchange.
👍 Discover real insights from verified creators.
Email / Phone number
Trending Topics
1
#FedRateWatch
1.1M views
5,350 Discussing
2
#ZcashRises6%
2,341 views
67 Discussing
3
#XRPSinks10%
653 views
50 Discussing
4
#BitcoinETFsShed$450M
34 views
22 Discussing
5
#CircleOpensArcMainnet
205 views
23 Discussing
6
#ZcashHoldersBackNU7Upgrade
8,569 views
200 Discussing
7
#MSTRTradingVolumeSurpassesMorganStanley
12,084 views
396 Discussing
8
#BitcoinFalls4%
27,642 views
659 Discussing
9
#SKHynixInTalksToMakeMemoryChipsInUS
12,976 views
279 Discussing
10
#OpenAIDiscussesNewFundingAt$1.2TValuation
2,999 views
46 Discussing