
#bot
bot
430,423 views
1,191 Discussing
Hot
Latest

$BOT gained 1.9% over the past 24 hours; the funding rate has dropped to zero. Political and military topics are heating up—narratives about autonomous weapon systems are hard to avoid, and even the name “$BOT ” itself leaves room for associations. A funding rate of zero suggests that bulls and bears are temporarily balanced, and the positioning structure is clean. However, the sector currently lacks substantive catalysts; the rise is more of a thematic pulse. If geopolitical tensions escalate, this type of asset may be targeted by short-term funds. A break below 26 is a weak signal, and if the funding rate shows abnormal fluctuations, I’ll be alert. If the current price stays put, I’ll wait for a pullback toward around 26 to trial a long position with a small size, with a stop-loss at 25.
Trading tag: #TradFi #链上美股 #BOT
Where do you think this set of judgments is most likely to be wrong?
Trading tag: #TradFi #链上美股 #BOT
Where do you think this set of judgments is most likely to be wrong?
$BOT rose mildly by 1.9% over the past 24 hours, and the funding rate has returned to zero. The geopolitical situation has heated up but not worsened. Funds are choosing to wait and watch rather than rush in, so funding is flat—this is the single key signal.
Everyone says tension means to avoid risk, but $BOT didn’t sell off; it actually edged up. That suggests some capital is quietly building positions. In this kind of non-core asset, if geopolitical risk escalates, it will be sold off first—but the current structure shows it hasn’t reached that stage yet.
Go long with a light position; stop loss at 26.5; target the prior high. If price breaks below 26.5 or the funding rate turns positive, get out.
Trade tag: #TradFi #链上美股 #BOT
Where do you think this set of assumptions is most likely to be wrong?
Everyone says tension means to avoid risk, but $BOT didn’t sell off; it actually edged up. That suggests some capital is quietly building positions. In this kind of non-core asset, if geopolitical risk escalates, it will be sold off first—but the current structure shows it hasn’t reached that stage yet.
Go long with a light position; stop loss at 26.5; target the prior high. If price breaks below 26.5 or the funding rate turns positive, get out.
Trade tag: #TradFi #链上美股 #BOT
Where do you think this set of assumptions is most likely to be wrong?

$BOT 24 hours rose by 1.04%, with a quote of 27.09. Meanwhile, its perpetual contract funding rate is 0.
This data combination is a bit interesting. The price is edging up slightly, but neither longs nor shorts are paying funding fees to each other. This usually means that the positions and sentiment on both sides are relatively balanced, with neither side aggressively adding exposure. The open interest figure of 22855.15 is not very meaningful on its own, but combined with a zero funding rate, it suggests that the current price level has not triggered strong trend bets. The market is in a wait-and-see phase.
From a macro perspective, there is currently a lack of clear catalysts to drive large swings in this kind of U.S. stock-themed contract. Traditional indicators such as Fed policy expectations and nonfarm payroll data have no new developments for now. So $BOT 's movement more likely reflects structural trading in the absence of macro shocks. This kind of slight rise plus zero funding rate structure either means the big players are slowly accumulating without alarming the market, or it simply means the price is randomly wandering because liquidity is thin.
The strongest counterpoint is that if major macro data unexpectedly beats expectations next, this balance could be broken instantly, causing funding rates to quickly tilt toward either longs or shorts.
Trading tag: #TradFi #链上美股 #BOT
Where do you think this assessment is most likely wrong?
This data combination is a bit interesting. The price is edging up slightly, but neither longs nor shorts are paying funding fees to each other. This usually means that the positions and sentiment on both sides are relatively balanced, with neither side aggressively adding exposure. The open interest figure of 22855.15 is not very meaningful on its own, but combined with a zero funding rate, it suggests that the current price level has not triggered strong trend bets. The market is in a wait-and-see phase.
From a macro perspective, there is currently a lack of clear catalysts to drive large swings in this kind of U.S. stock-themed contract. Traditional indicators such as Fed policy expectations and nonfarm payroll data have no new developments for now. So $BOT 's movement more likely reflects structural trading in the absence of macro shocks. This kind of slight rise plus zero funding rate structure either means the big players are slowly accumulating without alarming the market, or it simply means the price is randomly wandering because liquidity is thin.
The strongest counterpoint is that if major macro data unexpectedly beats expectations next, this balance could be broken instantly, causing funding rates to quickly tilt toward either longs or shorts.
Trading tag: #TradFi #链上美股 #BOT
Where do you think this assessment is most likely wrong?
$BOT report 27.09, 24-hour increase of 1.044%. The price is rising slightly, but the funding rate remains at 0.0000.
The current structure belongs to a single-signal judgment. A zero funding rate usually means that neither long nor short sides are paying extra costs in TradFi perpetual contracts, and the market is in a short-term balance or relatively thin-liquidity state. Combined with only about a 1% price move, this points to a micro environment lacking directional momentum.
From a macro observer’s perspective, this calm itself is worth being cautious about. A zero rate lowers the holding costs for both longs and shorts, and any directional macro catalyst, such as upcoming CPI data or a speech by a Federal Reserve official, could trigger a more violent position adjustment because the cost of holding positions is low. The current open interest of 22855.15, if it cannot be matched by a significant increase in trading volume, suggests that any breakout may lack sustainability.
The strongest counterargument is that the market interprets the zero rate as a long-term new normal, thereby ignoring its meaning as a sentiment indicator. If prices continue to fluctuate narrowly around 27 dollars and OI does not grow noticeably, then the current balanced state may persist for longer.
At this stage, I would choose to wait and observe.
Trading tag: #TradFi #链上美股 #BOT
Where do you think this judgment is most likely wrong?
The current structure belongs to a single-signal judgment. A zero funding rate usually means that neither long nor short sides are paying extra costs in TradFi perpetual contracts, and the market is in a short-term balance or relatively thin-liquidity state. Combined with only about a 1% price move, this points to a micro environment lacking directional momentum.
From a macro observer’s perspective, this calm itself is worth being cautious about. A zero rate lowers the holding costs for both longs and shorts, and any directional macro catalyst, such as upcoming CPI data or a speech by a Federal Reserve official, could trigger a more violent position adjustment because the cost of holding positions is low. The current open interest of 22855.15, if it cannot be matched by a significant increase in trading volume, suggests that any breakout may lack sustainability.
The strongest counterargument is that the market interprets the zero rate as a long-term new normal, thereby ignoring its meaning as a sentiment indicator. If prices continue to fluctuate narrowly around 27 dollars and OI does not grow noticeably, then the current balanced state may persist for longer.
At this stage, I would choose to wait and observe.
Trading tag: #TradFi #链上美股 #BOT
Where do you think this judgment is most likely wrong?
$BOT rose 1.044% over the past 24 hours, current price 27.09, perpetual contract funding rate 0, OI 22855.
What can be inferred from these three numbers: a zero funding rate means long and short forces are not imbalanced, and neither side is continuously paying the other. OI is only a little over twenty thousand, so the position size is not large and trading interest is average. Intraday volatility is only about one point, and volume shows no unusual movement. This contract is currently in a dormant state.
There is no funding-rate spread to arbitrage, no crowded direction to squeeze, and no trend to chase. Purely from a structural perspective, the current data points to waiting rather than trading.
The strongest counterexample is if funds suddenly enter and push OI up, while the funding rate deviates from zero, which would indicate that a major player is positioning. It would not be too late to follow then.
Invalidation conditions: funding rate breaks above 0.01% or falls below -0.01%, while OI expands significantly, meaning the long-short structure has broken and the original judgment is no longer valid.
Action: wait. This contract currently offers no direction and no edge; forcing an entry would just mean paying fees to the exchange. Three scenarios: aggressive traders can place orders near the 26.8-27.5 range to bet on a breakout; conservative traders can wait until the funding rate deviates from zero; those avoiding risk can simply look at other symbols.
Trading tag: #TradFi #链上美股 #BOT
Where do you think this whole judgment is most likely to be wrong?
What can be inferred from these three numbers: a zero funding rate means long and short forces are not imbalanced, and neither side is continuously paying the other. OI is only a little over twenty thousand, so the position size is not large and trading interest is average. Intraday volatility is only about one point, and volume shows no unusual movement. This contract is currently in a dormant state.
There is no funding-rate spread to arbitrage, no crowded direction to squeeze, and no trend to chase. Purely from a structural perspective, the current data points to waiting rather than trading.
The strongest counterexample is if funds suddenly enter and push OI up, while the funding rate deviates from zero, which would indicate that a major player is positioning. It would not be too late to follow then.
Invalidation conditions: funding rate breaks above 0.01% or falls below -0.01%, while OI expands significantly, meaning the long-short structure has broken and the original judgment is no longer valid.
Action: wait. This contract currently offers no direction and no edge; forcing an entry would just mean paying fees to the exchange. Three scenarios: aggressive traders can place orders near the 26.8-27.5 range to bet on a breakout; conservative traders can wait until the funding rate deviates from zero; those avoiding risk can simply look at other symbols.
Trading tag: #TradFi #链上美股 #BOT
Where do you think this whole judgment is most likely to be wrong?

$BOT [Accumulation] BOT Main force secretly accumulates? OI surges and rips the price up—but it’s still pinned!
[Accumulation] Discover the main-force accumulation target! OI spikes +2.9%—but the price is still stuck under pressure. The calm right before the breakout?
I scanned the on-chain data: OI is rising steadily, the price is moving sideways. It may be the early stage of positioning—⚠ big players are reducing their positions.
In plain, no-nonsense terms:
There’s big money quietly taking orders, but the price hasn’t moved much yet—this is the window that’s really worth watching!
OI spikes in the last 30 minutes by 2.9%, while the price only moves +0.28%—typical of volume leading price.
OI is the result of market participants voting with real money. It’s more honest than any candlestick pattern. With this structure, historically the win rate hasn’t been low.
──── Capital Flow Interpretation ────
[Whales reducing] Whales have shifted bearish: the long/short ratio is falling. Smart money’s attitude has changed—don’t force it.
[Retail FOMO] The retail long/short ratio jumps to 2.49—sentiment is overheated. Historically, when retail gets collectively euphoric, it often works as a contrarian indicator.
──── Scoring Breakdown ────
Whale Δ: -25 → 37.125 points | topΔ=-0.03<-0.02, whales are cutting positions
──── One-sentence Summary ────
The data doesn’t lie: the capital is already in place—the price is just running late. Keep your eyes on it and don’t blink.
[Quant Strategy Engine OI Signal V3.2]
#BOT
[Accumulation] Discover the main-force accumulation target! OI spikes +2.9%—but the price is still stuck under pressure. The calm right before the breakout?
I scanned the on-chain data: OI is rising steadily, the price is moving sideways. It may be the early stage of positioning—⚠ big players are reducing their positions.
In plain, no-nonsense terms:
There’s big money quietly taking orders, but the price hasn’t moved much yet—this is the window that’s really worth watching!
OI spikes in the last 30 minutes by 2.9%, while the price only moves +0.28%—typical of volume leading price.
OI is the result of market participants voting with real money. It’s more honest than any candlestick pattern. With this structure, historically the win rate hasn’t been low.
──── Capital Flow Interpretation ────
[Whales reducing] Whales have shifted bearish: the long/short ratio is falling. Smart money’s attitude has changed—don’t force it.
[Retail FOMO] The retail long/short ratio jumps to 2.49—sentiment is overheated. Historically, when retail gets collectively euphoric, it often works as a contrarian indicator.
──── Scoring Breakdown ────
Whale Δ: -25 → 37.125 points | topΔ=-0.03<-0.02, whales are cutting positions
──── One-sentence Summary ────
The data doesn’t lie: the capital is already in place—the price is just running late. Keep your eyes on it and don’t blink.
[Quant Strategy Engine OI Signal V3.2]
#BOT
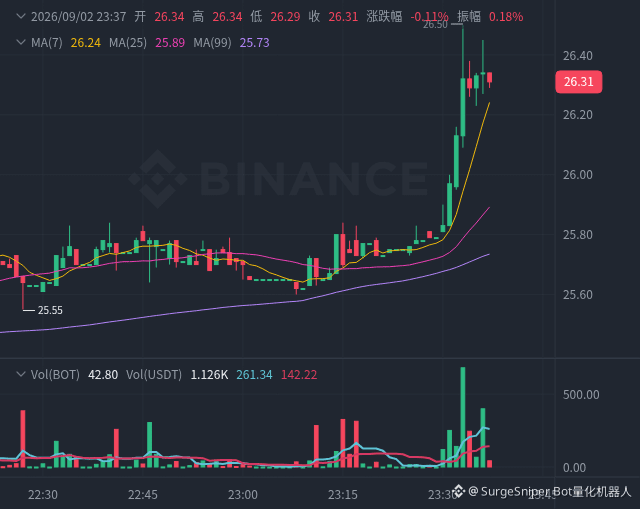




The defense minister signed a missile production expansion agreement. Meanwhile, the U.S. and Iran are once again at odds in the Middle East. Logically, the military-industrial sector should have shown a reaction. In $BOT 24 hours, however, it still fell 3.43%, with the funding rate turning negative. The shorts are essentially paying the longs, and the bearish sentiment looks somewhat crowded.
Escalation of geopolitical conflict is basically an open secret, but oil prices shot up to 90 yuan, dragging down the entire broad market—and even weighing on defense stocks that should have benefited. This is a single signal. The funding rate indicates that shorts are crowded, yet the price hasn’t dropped enough to fully reflect that—so the structure feels a bit contradictory.
If the conflict continues to escalate afterward, this rebound could be very strong.
Trading tag: #TradFi #链上美股 #BOT
Where do you think this assessment is most likely to be wrong?
Escalation of geopolitical conflict is basically an open secret, but oil prices shot up to 90 yuan, dragging down the entire broad market—and even weighing on defense stocks that should have benefited. This is a single signal. The funding rate indicates that shorts are crowded, yet the price hasn’t dropped enough to fully reflect that—so the structure feels a bit contradictory.
If the conflict continues to escalate afterward, this rebound could be very strong.
Trading tag: #TradFi #链上美股 #BOT
Where do you think this assessment is most likely to be wrong?

Are You Watching How $BOT Is Moving Right Now…!!
#BOT is displaying short term bearish momentum after a steady drop from its peak near 27.46 and is currently attempting to stabilize above the 25.95 support level If buyers step in to initiate a recovery bounce from this zone the potential targets to watch are 27.00 and 27.46 while breaking below 25.95 could lead to further decline toward 25.00$TUT
$BTW
#BOT is displaying short term bearish momentum after a steady drop from its peak near 27.46 and is currently attempting to stabilize above the 25.95 support level If buyers step in to initiate a recovery bounce from this zone the potential targets to watch are 27.00 and 27.46 while breaking below 25.95 could lead to further decline toward 25.00$TUT
$BTW
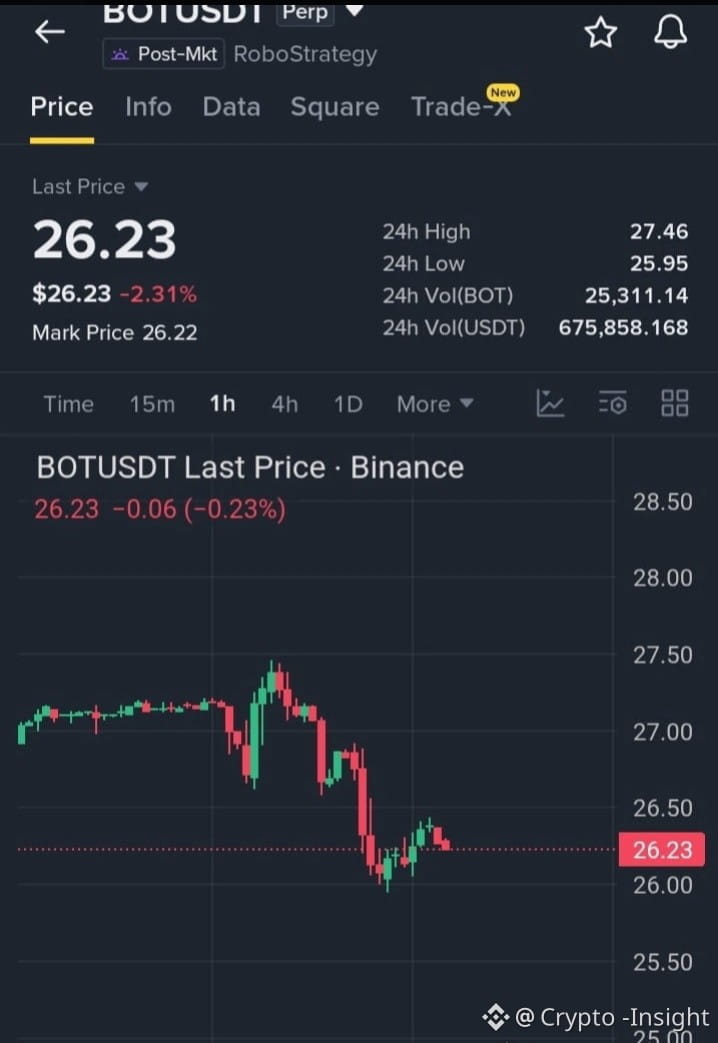
$BOT price 25.89, 24h down 3.43%, funding rate -0.00000984. As the conflict in the Middle East escalates, oil prices surge and risk-off sentiment drags down on-chain US stock futures contracts; $BOT , as an equity perp, is hit first. Shorts are crowded and may have to pay longs; chasing shorts from this level carries extremely high risk. The negative funding rate indicates that selling pressure has become excessive. If the conflict eases and oil prices pull back, short-covering could quickly drive the price higher.
Trading tag: #TradFi #链上美股 #BOT
Where do you think this set of judgments is most likely to be wrong?
Trading tag: #TradFi #链上美股 #BOT
Where do you think this set of judgments is most likely to be wrong?
$BOT fell 3.43% over the past 24 hours; the quote is 25.89, and the open interest is 25.8k, which has barely moved. A single-source report shows that the Department of Defense has signed a missile production expansion contract. The Middle East and the Taiwan Strait are tense. This should be mapping to a pulse in defense-industry stocks, but $BOT didn’t follow—price is still dropping.
My take is that the market hasn’t priced in the geopolitical risk yet. The funding rate is negative at -0.00000984—shorts are paying, and the open interest hasn’t increased, suggesting no new shorts have entered; the old shorts are just hard-holding. Price is down, but the funding rate is negative—that’s a typical structure of shorts accumulating while waiting for an eventual squeeze.
Trading tag: #TradFi #链上美股 #BOT
Where do you think this set of assumptions is most likely to be wrong?
My take is that the market hasn’t priced in the geopolitical risk yet. The funding rate is negative at -0.00000984—shorts are paying, and the open interest hasn’t increased, suggesting no new shorts have entered; the old shorts are just hard-holding. Price is down, but the funding rate is negative—that’s a typical structure of shorts accumulating while waiting for an eventual squeeze.
Trading tag: #TradFi #链上美股 #BOT
Where do you think this set of assumptions is most likely to be wrong?

🔴 $BOT REJECTS SUPPLY ZONE AT 26.35 AS INSTITUTIONAL SELLERS TARGET LIQUIDITY BELOW! 📉
Entry: 26.20 - 26.35 ⚡
Target: 25.90 🎯
Stop Loss: 26.55 ⚠️
$BOT is displaying clear structural weakness following the sharp drop from 27.40, with smart money defending the overhead supply zone near 26.35. 🔍 Lower timeframe price action reveals fading buying volume, indicating this weak bounce is running out of expansion capacity.
If 26.35 continues to act as a firm ceiling, we expect order flow to push price down into the liquidity pool at 25.90. 📊 Keep a close eye on correlated setups across $BTR and $TUT as overall momentum leans heavy.
🤔 Do you expect a fast liquidity sweep below 25.90 or a choppy consolidation here? 👇
⚠️ Not financial advice. Always manage your risk. 🛡️
🏷️ #BOT #ShortSetup #Crypto #MarketStructure
🐻 🩸
Entry: 26.20 - 26.35 ⚡
Target: 25.90 🎯
Stop Loss: 26.55 ⚠️
$BOT is displaying clear structural weakness following the sharp drop from 27.40, with smart money defending the overhead supply zone near 26.35. 🔍 Lower timeframe price action reveals fading buying volume, indicating this weak bounce is running out of expansion capacity.
If 26.35 continues to act as a firm ceiling, we expect order flow to push price down into the liquidity pool at 25.90. 📊 Keep a close eye on correlated setups across $BTR and $TUT as overall momentum leans heavy.
🤔 Do you expect a fast liquidity sweep below 25.90 or a choppy consolidation here? 👇
⚠️ Not financial advice. Always manage your risk. 🛡️
🏷️ #BOT #ShortSetup #Crypto #MarketStructure
🐻 🩸
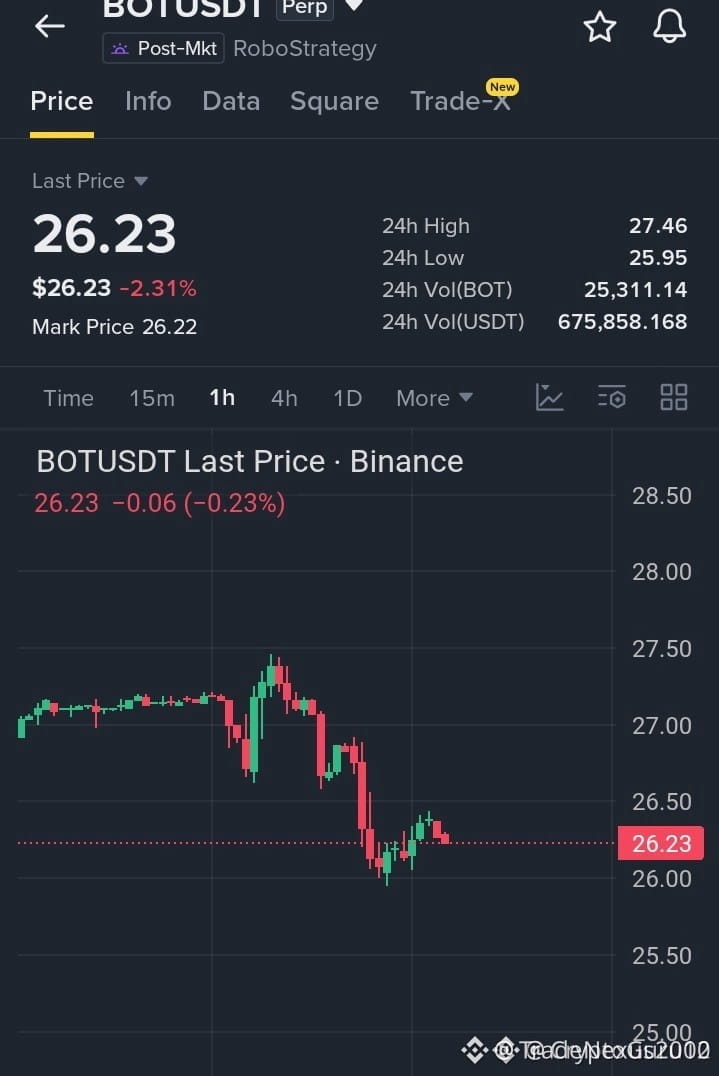

🚨 $BOT REJECTED AT RESISTANCE AS SELLER PRESSURE TARGETS LOWER SUPPORT! 📉
Entry: 26.20 - 26.35 ⚡
Target: 25.90 🎯
Stop Loss: 26.55 ⚠️
After a sharp rejection from the 27.40 supply zone, $BOT attempted a relief bounce near 26.00 that quickly ran out of momentum. Sellers are aggressively capping any recovery near 26.35, keeping the short-term structure firmly under bearish control. 📊
The order flow reveals persistent selling pressure with buyers struggling to generate real volume. 🔍 As long as 26.35 acts as an overhead ceiling, probability favors another liquidity sweep toward lower support targets. 📉
💬 Are you positioning for another push lower, or expecting buyers to defend support here? 👇
⚠️ Not financial advice. Always manage your risk. 🛡️
🏷️ #BOT #ShortSetup #Bearish #Crypto #Trading
📉 🐻
Entry: 26.20 - 26.35 ⚡
Target: 25.90 🎯
Stop Loss: 26.55 ⚠️
After a sharp rejection from the 27.40 supply zone, $BOT attempted a relief bounce near 26.00 that quickly ran out of momentum. Sellers are aggressively capping any recovery near 26.35, keeping the short-term structure firmly under bearish control. 📊
The order flow reveals persistent selling pressure with buyers struggling to generate real volume. 🔍 As long as 26.35 acts as an overhead ceiling, probability favors another liquidity sweep toward lower support targets. 📉
💬 Are you positioning for another push lower, or expecting buyers to defend support here? 👇
⚠️ Not financial advice. Always manage your risk. 🛡️
🏷️ #BOT #ShortSetup #Bearish #Crypto #Trading
📉 🐻

[M1_mag7]
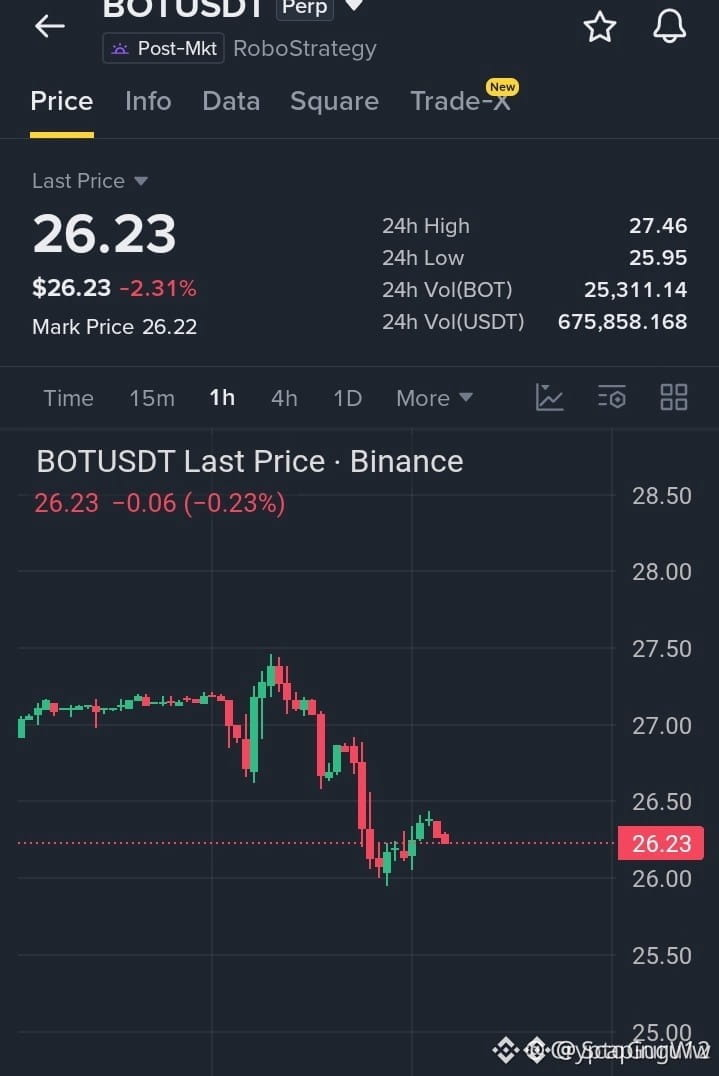
The old dog glanced at $BOT ’s order book: over the past 24 hours it’s down 3.472%, with the price hovering around 26.13 and trading volume close to 620,000. This drawdown isn’t unusual for a U.S. equities choppy-range environment, but what’s interesting is that the funding rate is sitting at zero—neither side is paying the other—while open interest is still at 26,210 contracts pressing down. It’s falling while the funding remains neutral, and open interest doesn’t show any obvious loosening. This combination is worth thinking about.
My take is that this leg down in $BOT is more likely a passive adjustment following the broader market’s beta, rather than deterioration in its own liquidity or a collapse in the narrative. Two reasons: first, the zero-funding state suggests a fragile balance between long and short forces—no classic preconditions for a squeeze are showing, such as longs absorbing offers by “holding up” funding or shorts being forced to cover. The downside momentum may be driven by the spot side or broader macro selling pressure. Second, according to public information, the market’s expectations for interest rates are being repriced. Charles Schwab, for example, has mentioned the U.S. Treasury increasing liquidity-related buyback operations to address the long period of high yields; Deloitte also notes that the long-term relationship between the fiscal deficit and bond yields could change. The U.S. 10-year Treasury yield is holding near 4.72%. In a high-yield environment, valuation for all risk assets is essentially being stress-tested—on-chain TradFi-style products can hardly stand aside. Since $BOT is categorized under the Other sector and lacks the narrative “anchors” like the Mag7 or tech stocks, in a rate-sensitive period it’s more likely to be sold first to reduce portfolio risk.
So my takeaway is: this is neither a time to bottom-fish nor a window to chase shorting. A zero funding rate means the market isn’t sending a clear directional leverage signal. Going long impulsively could mean eating position costs, while shorting could be stopped out by a sudden rebound. The right move is to wait. I’ve set two conditions: if the price rebounds and breaks above 27.5 along with the funding rate turning positive (even as little as 0.001%), that would indicate longs are starting to step in and “carry” the funding—I’d consider testing a long position with a very light size to bet on mean reversion; if the price falls below 25.0 and the funding turns negative, it could trigger short-term short crowding, which ironically often makes a rebound easier. In that case, I’d wait for the funding rate to rise back near zero before deciding whether to go long. For now, I’m not touching it.
The place this view is most likely to be wrong is in attributing $BOT ’s decline entirely to macro beta.
Trading tags: #BinanceFutures #TradFi #USDⓈM #BOT #BOTUSDT $BOT
The old dog glanced at $BOT ’s order book: over the past 24 hours it’s down 3.472%, with the price hovering around 26.13 and trading volume close to 620,000. This drawdown isn’t unusual for a U.S. equities choppy-range environment, but what’s interesting is that the funding rate is sitting at zero—neither side is paying the other—while open interest is still at 26,210 contracts pressing down. It’s falling while the funding remains neutral, and open interest doesn’t show any obvious loosening. This combination is worth thinking about.
My take is that this leg down in $BOT is more likely a passive adjustment following the broader market’s beta, rather than deterioration in its own liquidity or a collapse in the narrative. Two reasons: first, the zero-funding state suggests a fragile balance between long and short forces—no classic preconditions for a squeeze are showing, such as longs absorbing offers by “holding up” funding or shorts being forced to cover. The downside momentum may be driven by the spot side or broader macro selling pressure. Second, according to public information, the market’s expectations for interest rates are being repriced. Charles Schwab, for example, has mentioned the U.S. Treasury increasing liquidity-related buyback operations to address the long period of high yields; Deloitte also notes that the long-term relationship between the fiscal deficit and bond yields could change. The U.S. 10-year Treasury yield is holding near 4.72%. In a high-yield environment, valuation for all risk assets is essentially being stress-tested—on-chain TradFi-style products can hardly stand aside. Since $BOT is categorized under the Other sector and lacks the narrative “anchors” like the Mag7 or tech stocks, in a rate-sensitive period it’s more likely to be sold first to reduce portfolio risk.
So my takeaway is: this is neither a time to bottom-fish nor a window to chase shorting. A zero funding rate means the market isn’t sending a clear directional leverage signal. Going long impulsively could mean eating position costs, while shorting could be stopped out by a sudden rebound. The right move is to wait. I’ve set two conditions: if the price rebounds and breaks above 27.5 along with the funding rate turning positive (even as little as 0.001%), that would indicate longs are starting to step in and “carry” the funding—I’d consider testing a long position with a very light size to bet on mean reversion; if the price falls below 25.0 and the funding turns negative, it could trigger short-term short crowding, which ironically often makes a rebound easier. In that case, I’d wait for the funding rate to rise back near zero before deciding whether to go long. For now, I’m not touching it.
The place this view is most likely to be wrong is in attributing $BOT ’s decline entirely to macro beta.
Trading tags: #BinanceFutures #TradFi #USDⓈM #BOT #BOTUSDT $BOT
An old dog glanced at the order book of $BOT . Over the past 24h, it’s down 1.66%, with the price capped at 26.66. The funding rate is -0.00040801, and the open interest is 24,629.89. The drawdown isn’t that deep, but since funding is already negative, it indicates that in this drop, shorts are paying longs.
My conclusion is straightforward: $BOT is not a position to chase short right now. What’s more concerning is that shorts are crowded relative to the price falling. Negative funding means short positions are crowded, which is a prerequisite for a short squeeze. Although the price is still falling, once it stops and bottoms, the buy demand from shorts closing positions can amplify the rebound.
On the other hand, the strongest counterargument is also right here. Negative funding doesn’t mean an immediate reversal. During a trend down move, shorts can pay funding with the price spread, and a 24h drop of 1.66% isn’t enough to confirm a bottom. If $BOT continues to grind lower, there’s no reason for shorts to close. A short squeeze risk in this case is still mostly theoretical.
Looking at this asset alone, there are no contracts from the same sector to use as a reference—secondary in the input is empty—so I can’t determine whether this move in $BOT is an independent行情 or just following the sector’s rhythm. I can only treat it as a single-cash-sample. From a Crypto×TradFi perspective, the marginal capital in on-chain US stock-style contracts often follows crypto market sentiment. The price movement of $BOT may not reflect only the asset’s own fundamentals, but more the spillover of cross-market sentiment. This hypothesis needs to be revised if the price and funding diverge.
The second-order effect is boring but useful. If the price holds sideways near 26.66, shorts will have to pay funding every day. The time cost will force some shorts to withdraw first, and their buybacks will push the price up. If the price continues to break down, late shorts who enter will be taking on even more negative funding; any mild rebound afterward becomes the fuel for them to exit.
My action is: I won’t touch it. I won’t catch this falling knife, and I won’t chase shorts. I’ll wait until $BOT builds back above 26.66 on its own, and funding no longer becomes more negative. Then I’ll consider a small long position. If the price breaks down from the current level directly, I’ll abandon the short-squeeze logic. With no support specific to this single asset, crowded shorts can’t stop emotion from flowing out.
Trading tag: #BinanceFutures #TradFi #USDⓈM #BOT #BOTUSDT $BOT
My conclusion is straightforward: $BOT is not a position to chase short right now. What’s more concerning is that shorts are crowded relative to the price falling. Negative funding means short positions are crowded, which is a prerequisite for a short squeeze. Although the price is still falling, once it stops and bottoms, the buy demand from shorts closing positions can amplify the rebound.
On the other hand, the strongest counterargument is also right here. Negative funding doesn’t mean an immediate reversal. During a trend down move, shorts can pay funding with the price spread, and a 24h drop of 1.66% isn’t enough to confirm a bottom. If $BOT continues to grind lower, there’s no reason for shorts to close. A short squeeze risk in this case is still mostly theoretical.
Looking at this asset alone, there are no contracts from the same sector to use as a reference—secondary in the input is empty—so I can’t determine whether this move in $BOT is an independent行情 or just following the sector’s rhythm. I can only treat it as a single-cash-sample. From a Crypto×TradFi perspective, the marginal capital in on-chain US stock-style contracts often follows crypto market sentiment. The price movement of $BOT may not reflect only the asset’s own fundamentals, but more the spillover of cross-market sentiment. This hypothesis needs to be revised if the price and funding diverge.
The second-order effect is boring but useful. If the price holds sideways near 26.66, shorts will have to pay funding every day. The time cost will force some shorts to withdraw first, and their buybacks will push the price up. If the price continues to break down, late shorts who enter will be taking on even more negative funding; any mild rebound afterward becomes the fuel for them to exit.
My action is: I won’t touch it. I won’t catch this falling knife, and I won’t chase shorts. I’ll wait until $BOT builds back above 26.66 on its own, and funding no longer becomes more negative. Then I’ll consider a small long position. If the price breaks down from the current level directly, I’ll abandon the short-squeeze logic. With no support specific to this single asset, crowded shorts can’t stop emotion from flowing out.
Trading tag: #BinanceFutures #TradFi #USDⓈM #BOT #BOTUSDT $BOT
$BOT is now 27.18; in the past 24h, it’s up 0.966%. The fundingRate is 0.00000000, and the openInterest is 23717.14. Old Dog glanced at these numbers and his first reaction wasn’t bullish vs. bearish—it was about the relationship between funding fees and positioning. The price has only inched up by less than a point; the fee rate is essentially zero. With OI at around the 23k range and vol at 68k, when you put this setup into the peer comparison on the TRADIFI_PERPETUAL semiconductor chain, the signal is thin. But “thin” still has a way to read it.
First, let’s make one thing clear: the secondary comparison list in this post is empty. That means the input doesn’t include on-chain perpetual data for traditional semiconductor names like MU, NVDA, or AMD. So I can’t compare $BOT ’s move to specific peer benchmarks—whether by price change, funding rate, or OI. I can only talk about $BOT by itself, plus a generalized sector read. This is a single-instrument observation, not a two-dimensional peer matchup. The information gap itself is part of the conclusion.
From the M2_semi perspective, perpetual funding for the semiconductor/AI chain usually has two moods. First, the funding rate can flip quickly around earnings reports or product-cycle milestones, because longs tend to chase the narrative early. Second, marginal changes in OI often lead price pulses, since derivatives traders move positions earlier than spot traders. Now, the funding on $BOT is a clean, undisturbed zero. OI is about 23k, and the price is 27.18, up 0.966%. Old Dog’s read is: no one is fighting over direction at this level. Longs aren’t crowded enough to be forced to pay, and shorts haven’t been squeezed enough to have to pay either. The market is in a low-commitment state.
So what does “low commitment” mean? It means that any breakout in either direction is less likely to be punished by a funding-rate flip against that move. Suppose price keeps pushing higher: if funding goes from zero to positive and longs start paying—that’s the starting point of crowding. Suppose price breaks down: if funding goes from zero to negative and shorts start paying—that sets up the preconditions for a short squeeze. Right now, it’s not that; it’s a blank sheet. Therefore at this level, direction should be judged by price structure and OI turns, not by the funding rate.
Trading tag: #BinanceFutures #TradFi #USDⓈM #BOT #BOTUSDT $BOT
First, let’s make one thing clear: the secondary comparison list in this post is empty. That means the input doesn’t include on-chain perpetual data for traditional semiconductor names like MU, NVDA, or AMD. So I can’t compare $BOT ’s move to specific peer benchmarks—whether by price change, funding rate, or OI. I can only talk about $BOT by itself, plus a generalized sector read. This is a single-instrument observation, not a two-dimensional peer matchup. The information gap itself is part of the conclusion.
From the M2_semi perspective, perpetual funding for the semiconductor/AI chain usually has two moods. First, the funding rate can flip quickly around earnings reports or product-cycle milestones, because longs tend to chase the narrative early. Second, marginal changes in OI often lead price pulses, since derivatives traders move positions earlier than spot traders. Now, the funding on $BOT is a clean, undisturbed zero. OI is about 23k, and the price is 27.18, up 0.966%. Old Dog’s read is: no one is fighting over direction at this level. Longs aren’t crowded enough to be forced to pay, and shorts haven’t been squeezed enough to have to pay either. The market is in a low-commitment state.
So what does “low commitment” mean? It means that any breakout in either direction is less likely to be punished by a funding-rate flip against that move. Suppose price keeps pushing higher: if funding goes from zero to positive and longs start paying—that’s the starting point of crowding. Suppose price breaks down: if funding goes from zero to negative and shorts start paying—that sets up the preconditions for a short squeeze. Right now, it’s not that; it’s a blank sheet. Therefore at this level, direction should be judged by price structure and OI turns, not by the funding rate.
Trading tag: #BinanceFutures #TradFi #USDⓈM #BOT #BOTUSDT $BOT

$BOT latest market update 🚀
Long/Short: Long
Entry: 26.7709–26.9646
Stop Loss: 26.6633
Targets: 27.1152/27.3304/27.6532
Reasoning: Sigh, today’s mood is really down. This BOT trend is just like me—nothing much has changed. The EMA line has crossed above the long-term line, and the MACD has formed a golden cross, but the RSI hasn’t reached 60 yet. So how much can this bullish trend really do? It’s just a slow climb—up and down, grinding you down. I’m waiting: once it breaks above 26.9 or if it drops below, I’ll follow with a move. This is what the market is like—believe it or not, I don’t buy it blindly. Be careful. The recommended stop-loss level is 26.6. Otherwise, don’t play with this stuff—the risk is too high. Me? I’m just “whoever wants to, wants to”—I won’t argue with the market. Watch your own orders; don’t force a push upward. As the saying goes: step by step, take it as it comes. Stop-loss level—remember it well; don’t regret it.
Risk Warning: Recommended stop-loss level: 26.663280. Please adjust your position size according to your own risk tolerance.
#BOT
Long/Short: Long
Entry: 26.7709–26.9646
Stop Loss: 26.6633
Targets: 27.1152/27.3304/27.6532
Reasoning: Sigh, today’s mood is really down. This BOT trend is just like me—nothing much has changed. The EMA line has crossed above the long-term line, and the MACD has formed a golden cross, but the RSI hasn’t reached 60 yet. So how much can this bullish trend really do? It’s just a slow climb—up and down, grinding you down. I’m waiting: once it breaks above 26.9 or if it drops below, I’ll follow with a move. This is what the market is like—believe it or not, I don’t buy it blindly. Be careful. The recommended stop-loss level is 26.6. Otherwise, don’t play with this stuff—the risk is too high. Me? I’m just “whoever wants to, wants to”—I won’t argue with the market. Watch your own orders; don’t force a push upward. As the saying goes: step by step, take it as it comes. Stop-loss level—remember it well; don’t regret it.
Risk Warning: Recommended stop-loss level: 26.663280. Please adjust your position size according to your own risk tolerance.
#BOT

$BOT USDT LONG SETUP
Market is climbing with better confidence. Buyers are supporting the move while sellers struggle to regain control. Next resistance is now the main challenge.
Entry: 28.30 – 28.60
TP1: 29.50
TP2: 30.50
TP3: 32.00
SL: 27.40
#Binance #cryptotrading #crypto #trading #bot
$TAC $STAR
Market is climbing with better confidence. Buyers are supporting the move while sellers struggle to regain control. Next resistance is now the main challenge.
Entry: 28.30 – 28.60
TP1: 29.50
TP2: 30.50
TP3: 32.00
SL: 27.40
#Binance #cryptotrading #crypto #trading #bot
$TAC $STAR
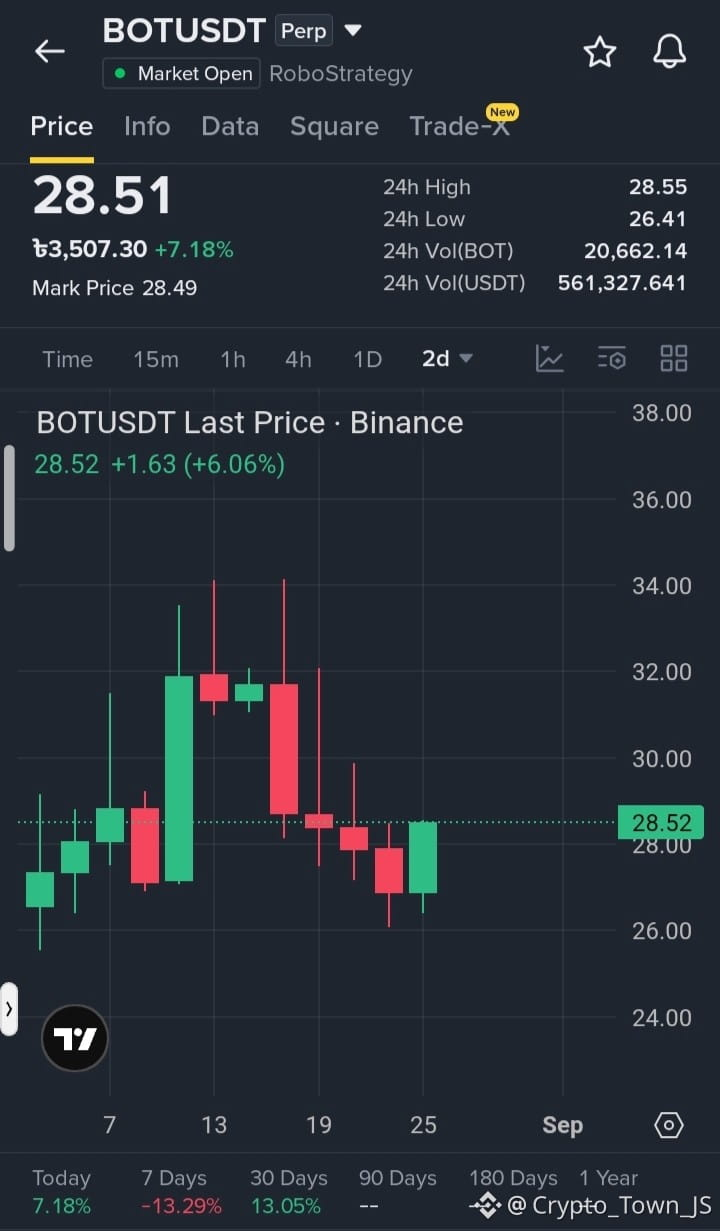

💥 $BOT COMPRESSING NEAR KEY DEMAND ZONE BEFORE EXPLOSIVE UPWARD EXPANSION! ⚡
Entry: 28.2 - 28.3 ⚡
Target: 29.0 / 30.0 / 31.0 🚀
Stop Loss: 27.4 ⚠️
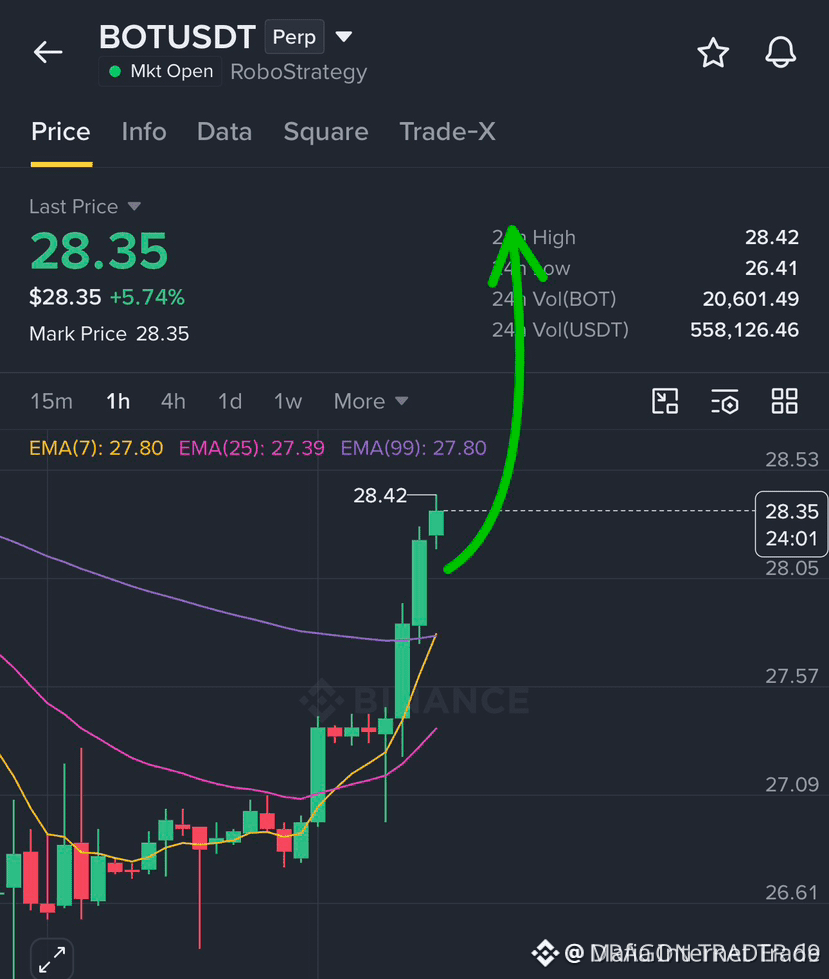
Price is consolidating directly above the 28.2 order block, showing clear signs of absorption as sellers lose steam on every dip. 📊 Order flow indicates aggressive smart money defense right at this level, paving the runway for a swift retest of higher resistance levels.
With volume expanding into the break, the risk-to-reward ratio here offers exceptional leverage for momentum buyers targeting upper liquidity pools. 💡 Are you taking the bid inside this accumulation pocket or waiting for confirmed breakout velocity? 👇
⚠️ Not financial advice. Always manage your risk. 🛡️
🏷️ #BOT #LongSetup #Crypto #Altcoins #Trading
🔥 💎
Entry: 28.2 - 28.3 ⚡
Target: 29.0 / 30.0 / 31.0 🚀
Stop Loss: 27.4 ⚠️
Price is consolidating directly above the 28.2 order block, showing clear signs of absorption as sellers lose steam on every dip. 📊 Order flow indicates aggressive smart money defense right at this level, paving the runway for a swift retest of higher resistance levels.
With volume expanding into the break, the risk-to-reward ratio here offers exceptional leverage for momentum buyers targeting upper liquidity pools. 💡 Are you taking the bid inside this accumulation pocket or waiting for confirmed breakout velocity? 👇
⚠️ Not financial advice. Always manage your risk. 🛡️
🏷️ #BOT #LongSetup #Crypto #Altcoins #Trading
🔥 💎
Log in to explore more content