
#34
34
21,902 views
69 Discussing
Hot
Latest

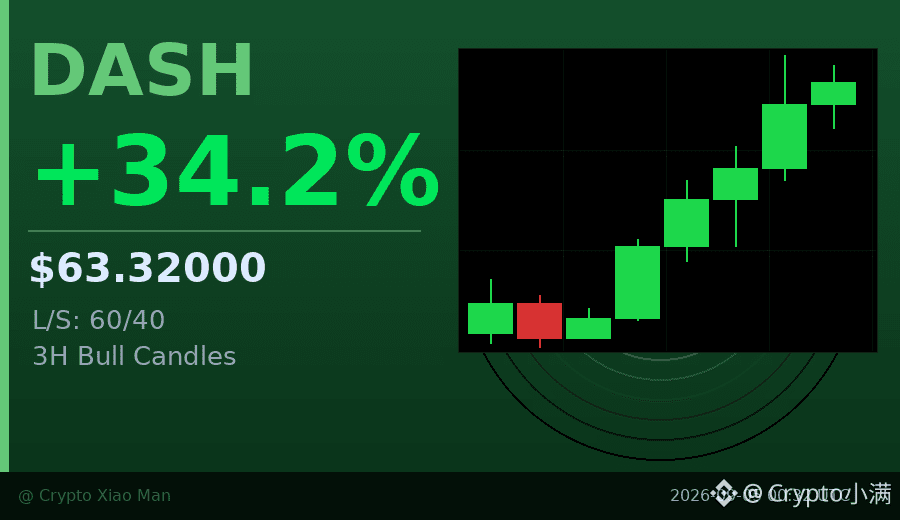
Behind the 34% surge, DASH posted a genuine price-and-volume breakout today.
24-hour trading volume surged to $348 million, while the price jumped straight from $46 to $63. The hourly chart has closed green for three consecutive candles, and the buying pace looks very steady.
The long/short ratio is 60/40, with longs in the lead but not yet crowded. Funding rate at 0.01% is almost neutral, suggesting this move wasn’t built on leverage.
I previously highlighted strong coins like FLOCK and TRIA, and DASH looks cleaner at this level—no extreme funding, no one-sided positioning, just real buying pressure pushing it up.
$DASH #强势突破 #34%
Click the card below to quickly check the market👇
24-hour trading volume surged to $348 million, while the price jumped straight from $46 to $63. The hourly chart has closed green for three consecutive candles, and the buying pace looks very steady.
The long/short ratio is 60/40, with longs in the lead but not yet crowded. Funding rate at 0.01% is almost neutral, suggesting this move wasn’t built on leverage.
I previously highlighted strong coins like FLOCK and TRIA, and DASH looks cleaner at this level—no extreme funding, no one-sided positioning, just real buying pressure pushing it up.
$DASH #强势突破 #34%
Click the card below to quickly check the market👇
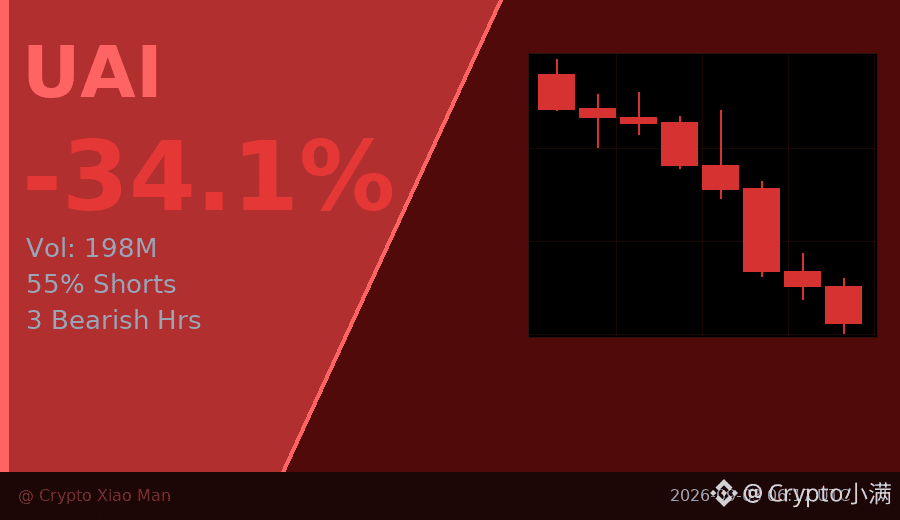
34% drop, 198M volume—this isn’t a normal pullback.
UAI was dumped straight from 0.59 to 0.36, and the hourly chart has already printed three consecutive red candles. Even more noteworthy: 55% of people are shorting, yet the funding rate is still positive—indicating that although many are bearish, the ones truly willing to pay for shorting aren’t being that aggressive.
In this kind of situation, the most likely scenario is that the short side is overcrowded, which actually leaves room for a rebound. Of course, the trend hasn’t reversed yet—the three red candles are still there, so catching the dip needs signals.
I’ll be watching the 0.38–0.40 range. If it can hold there, then I’ll reassess.
$UAI #暴跌行情 #34%
Click the small card below to quickly check the market 👇
UAI was dumped straight from 0.59 to 0.36, and the hourly chart has already printed three consecutive red candles. Even more noteworthy: 55% of people are shorting, yet the funding rate is still positive—indicating that although many are bearish, the ones truly willing to pay for shorting aren’t being that aggressive.
In this kind of situation, the most likely scenario is that the short side is overcrowded, which actually leaves room for a rebound. Of course, the trend hasn’t reversed yet—the three red candles are still there, so catching the dip needs signals.
I’ll be watching the 0.38–0.40 range. If it can hold there, then I’ll reassess.
$UAI #暴跌行情 #34%
Click the small card below to quickly check the market 👇
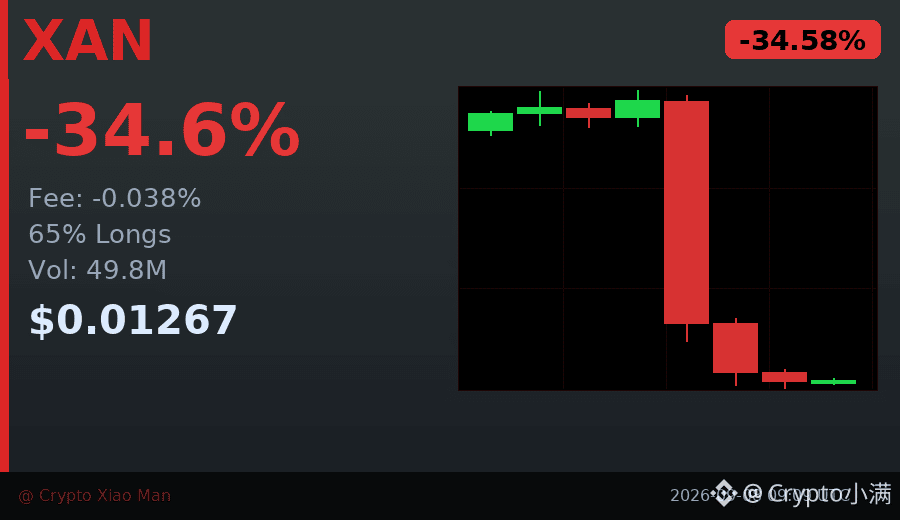
34% down move, but what’s truly worth noting is that the funding rate has already sunk to -0.038%.
XAN was smashed from 0.022 down to 0.0127—within 8 hours, it played out a full “long liquidation squeeze” script.
Trading volume swelled to 49.80 million USDT, and 65% of long positions are now being trapped inside.
This kind of extreme negative funding rate usually means: shorts are too crowded, so you should be careful about a short-term rebound.
That said, the trend hasn’t stabilized yet—bottom fishing right now is like catching a falling knife.
Wait until the candlesticks close with long lower wicks, or until the funding rate returns to neutral, for a safer read.
$XAN #资金费率 #34%跌幅
Click the card below to quickly check the market 👇
XAN was smashed from 0.022 down to 0.0127—within 8 hours, it played out a full “long liquidation squeeze” script.
Trading volume swelled to 49.80 million USDT, and 65% of long positions are now being trapped inside.
This kind of extreme negative funding rate usually means: shorts are too crowded, so you should be careful about a short-term rebound.
That said, the trend hasn’t stabilized yet—bottom fishing right now is like catching a falling knife.
Wait until the candlesticks close with long lower wicks, or until the funding rate returns to neutral, for a safer read.
$XAN #资金费率 #34%跌幅
Click the card below to quickly check the market 👇
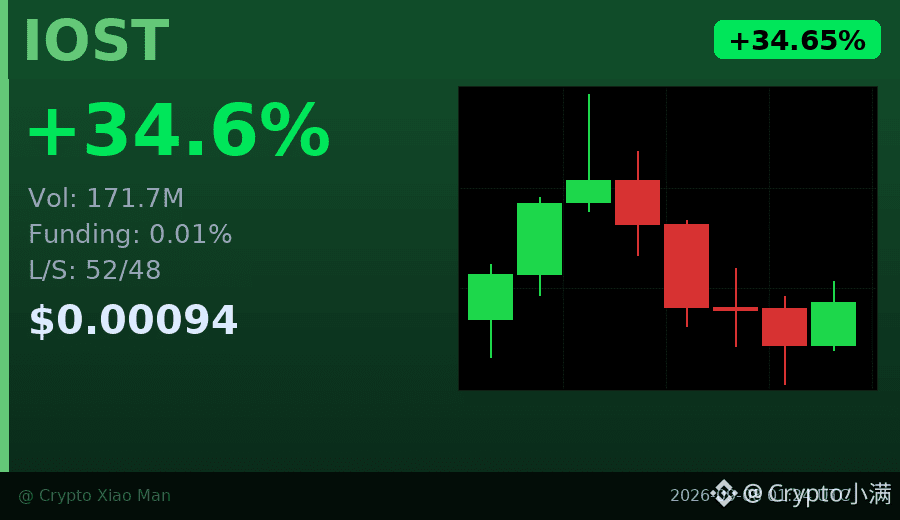
34% price increase, but funding rate is only 0.01%?
IOST is up 34.65% today, with trading volume surging to $171 million. But interestingly, the long/short ratio is 52% vs 48%, almost perfectly balanced, and the funding rate is low to the point of being pitiful.
What does this mean? This pump is mainly driven by spot buying, not leveraged funds gambling. Compared with other coins where funding rates are off the charts and the long/short positioning is extremely crowded, IOST’s rise looks healthier instead.
The K-line shows short-term consolidation. 0.0010479 is the previous high, and 0.0006961 is support. If the volume can hold steady afterward, this structure isn’t too bad.
$IOST #资金费率 #34%涨幅
Click the small card below to quickly check the market 👇
IOST is up 34.65% today, with trading volume surging to $171 million. But interestingly, the long/short ratio is 52% vs 48%, almost perfectly balanced, and the funding rate is low to the point of being pitiful.
What does this mean? This pump is mainly driven by spot buying, not leveraged funds gambling. Compared with other coins where funding rates are off the charts and the long/short positioning is extremely crowded, IOST’s rise looks healthier instead.
The K-line shows short-term consolidation. 0.0010479 is the previous high, and 0.0006961 is support. If the volume can hold steady afterward, this structure isn’t too bad.
$IOST #资金费率 #34%涨幅
Click the small card below to quickly check the market 👇
Behind the 34% rise, why is the funding rate only 0.01%?
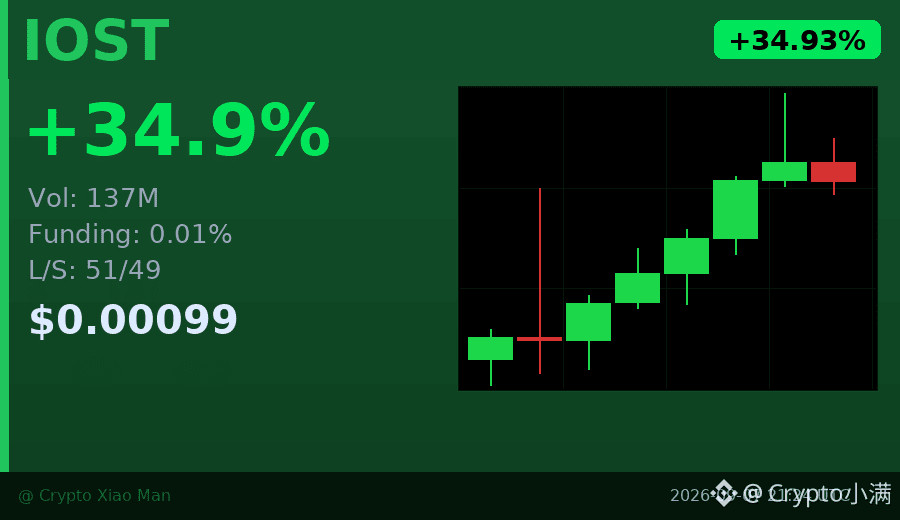
This latest surge in IOST is kind of interesting. The price has climbed from 0.00069 to 0.00104, with almost no pullback in 8 hours—but the long/short ratio of 51% to 49% suggests something. Most people are still watching from the sidelines; they haven’t dared to chase.
Trading volume is $137 million—not small—but the fact that the funding rate hasn’t spiked indicates that leveraged positions haven’t entered in large scale yet. This combination of "price and volume rising together, with funding staying calm" means either the main force is well controlling the market, or there’s still room ahead.
The key is whether 0.00105 can hold. If it breaks through, the short-term move may continue upward; if it can’t hold, a pullback toward around 0.00093 wouldn’t be surprising.
$IOST #资金费率 #34%涨幅
Click the small card below to quickly check the market👇
This latest surge in IOST is kind of interesting. The price has climbed from 0.00069 to 0.00104, with almost no pullback in 8 hours—but the long/short ratio of 51% to 49% suggests something. Most people are still watching from the sidelines; they haven’t dared to chase.
Trading volume is $137 million—not small—but the fact that the funding rate hasn’t spiked indicates that leveraged positions haven’t entered in large scale yet. This combination of "price and volume rising together, with funding staying calm" means either the main force is well controlling the market, or there’s still room ahead.
The key is whether 0.00105 can hold. If it breaks through, the short-term move may continue upward; if it can’t hold, a pullback toward around 0.00093 wouldn’t be surprising.
$IOST #资金费率 #34%涨幅
Click the small card below to quickly check the market👇
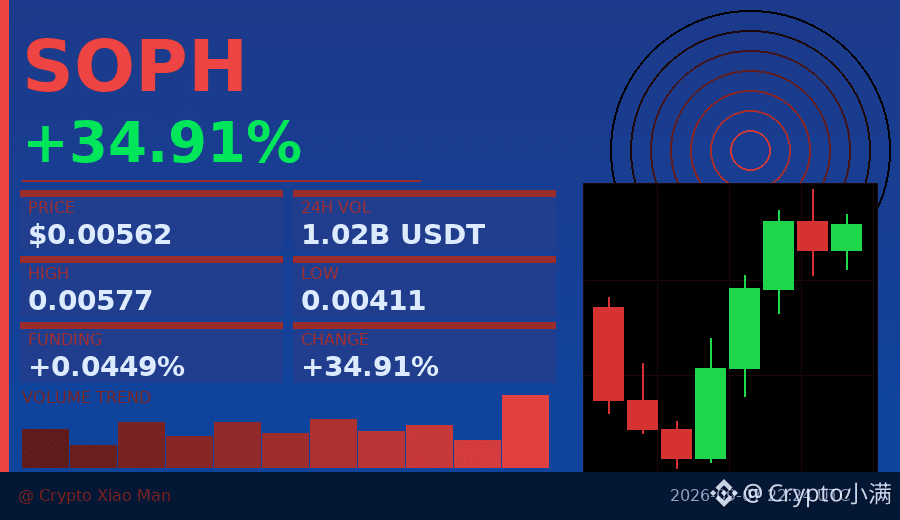
Behind the 34.91% surge, the funding rate has already spiked to 0.0449%—a signal that longs are疯狂加杠杆.
Today, SOPH’s trading volume has broken 100 million USDT, but the price has fallen from the high of 0.005765 to 0.005623, indicating that profit-takers are starting to exit.
The long-to-short ratio is 51% to 49%, which looks balanced, but the high funding rate means longs have to pay more to shorts.
The overall uptrend within the past 8 hours is still intact, but be careful when chasing—funding rates can backfire.
I’ve seen this too many times: the price is still rising, the funding rate explodes first, and then a round of liquidations follows—longs end up suffering far more than shorts.
$SOPH #资金费率预警 #34.91%
Tap the small card below to quickly check the market👇
Today, SOPH’s trading volume has broken 100 million USDT, but the price has fallen from the high of 0.005765 to 0.005623, indicating that profit-takers are starting to exit.
The long-to-short ratio is 51% to 49%, which looks balanced, but the high funding rate means longs have to pay more to shorts.
The overall uptrend within the past 8 hours is still intact, but be careful when chasing—funding rates can backfire.
I’ve seen this too many times: the price is still rising, the funding rate explodes first, and then a round of liquidations follows—longs end up suffering far more than shorts.
$SOPH #资金费率预警 #34.91%
Tap the small card below to quickly check the market👇

60-SECOND ALPHA #34 | $SCR
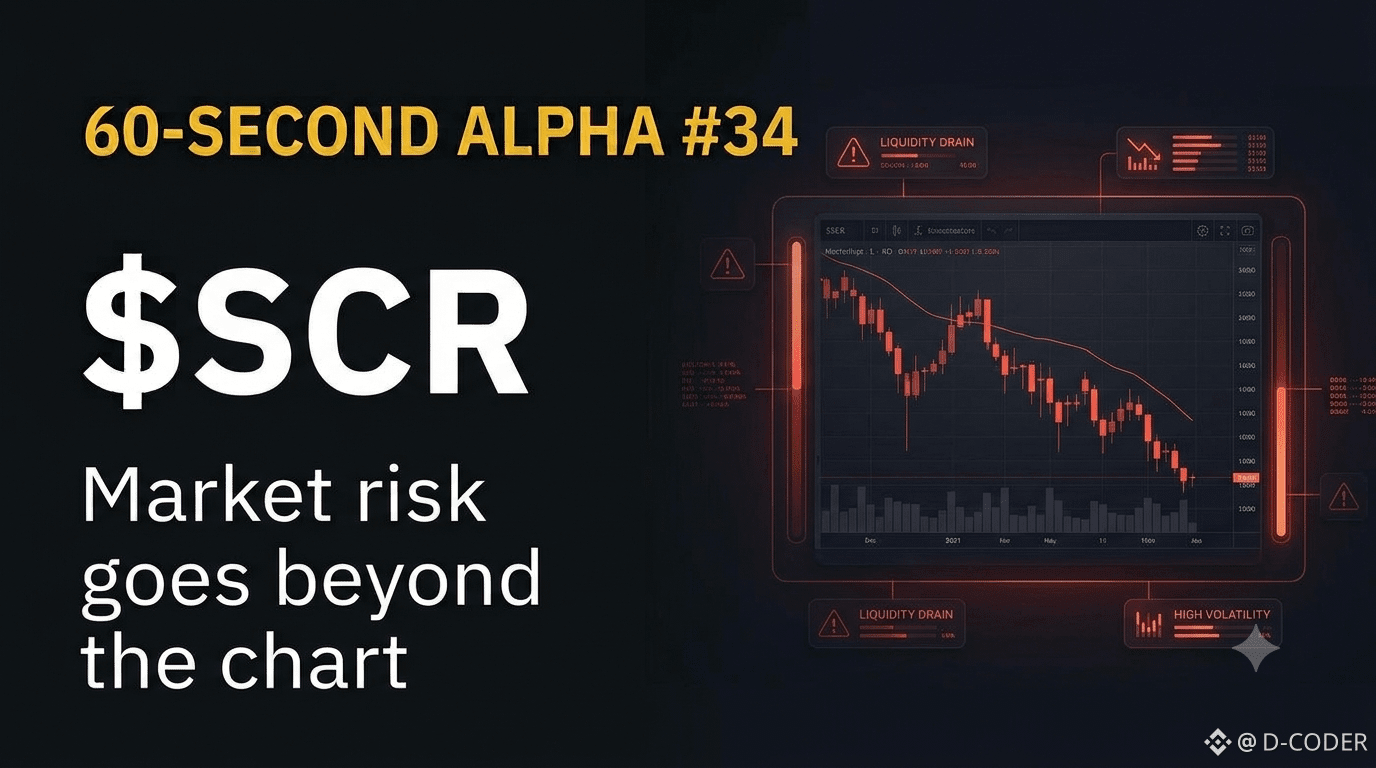
$SCR is currently around $0.021 and has been under notable selling pressure. Binance has also placed Scroll under its Monitoring Tag, meaning the asset is subject to closer periodic review.
This is a useful reminder that a strong project narrative doesn’t automatically protect a token from market pressure. Liquidity, sentiment and exchange risk can all affect price at the same time.
Alpha: When price weakens, look beyond the candle. Check the liquidity, market structure and the wider risk around the asset.
$SCR is currently around $0.021 and has been under notable selling pressure. Binance has also placed Scroll under its Monitoring Tag, meaning the asset is subject to closer periodic review.
This is a useful reminder that a strong project narrative doesn’t automatically protect a token from market pressure. Liquidity, sentiment and exchange risk can all affect price at the same time.
Alpha: When price weakens, look beyond the candle. Check the liquidity, market structure and the wider risk around the asset.

$TRIA moved very decisively this time 👇
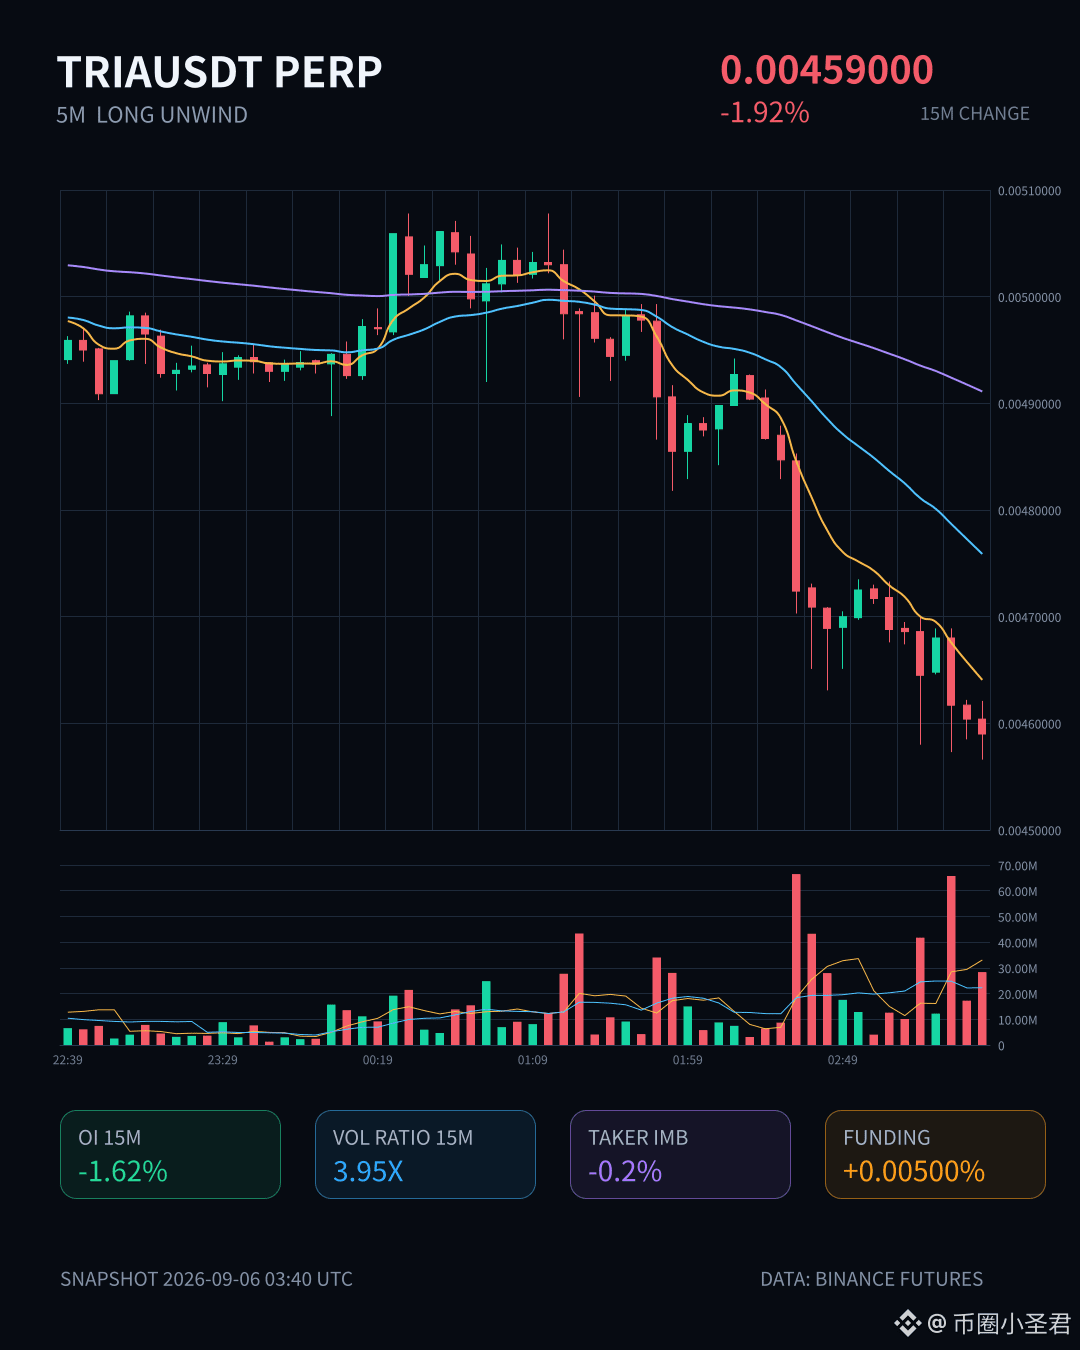
It was hammered down 1.92% in just 15 minutes, with volume surging to 3.95x the normal level — this isn’t a slow bleed, it’s a heavy-volume selloff. OI shrank in sync: contract open interest fell -1.62% over 15 minutes and -1.79% over 1 hour, with a combined notional value of nearly 440,000 U wiped out.
A classic **long de-leveraging** setup: both price and OI are down, which means this wasn’t new shorts coming in to dump the market, but longs cutting losses and exiting, forced to stop out or actively reduce positions.
Ranked #34 for pool anomalies and #31 for notional change, this kind of “price-volume divergence + position contraction” combo often leaves short-term bounces weak, so be careful chasing longs.
24-hour trading volume was 32 million U, and the buy/sell ratio was 1.00 — meaning there isn’t a one-sided sell pressure for now; it looks more like a wait-and-see zone after panic has been flushed out. If you’re itching to jump in, wait for the next signal of shrinking volume and a stop in the decline before considering it.
It was hammered down 1.92% in just 15 minutes, with volume surging to 3.95x the normal level — this isn’t a slow bleed, it’s a heavy-volume selloff. OI shrank in sync: contract open interest fell -1.62% over 15 minutes and -1.79% over 1 hour, with a combined notional value of nearly 440,000 U wiped out.
A classic **long de-leveraging** setup: both price and OI are down, which means this wasn’t new shorts coming in to dump the market, but longs cutting losses and exiting, forced to stop out or actively reduce positions.
Ranked #34 for pool anomalies and #31 for notional change, this kind of “price-volume divergence + position contraction” combo often leaves short-term bounces weak, so be careful chasing longs.
24-hour trading volume was 32 million U, and the buy/sell ratio was 1.00 — meaning there isn’t a one-sided sell pressure for now; it looks more like a wait-and-see zone after panic has been flushed out. If you’re itching to jump in, wait for the next signal of shrinking volume and a stop in the decline before considering it.
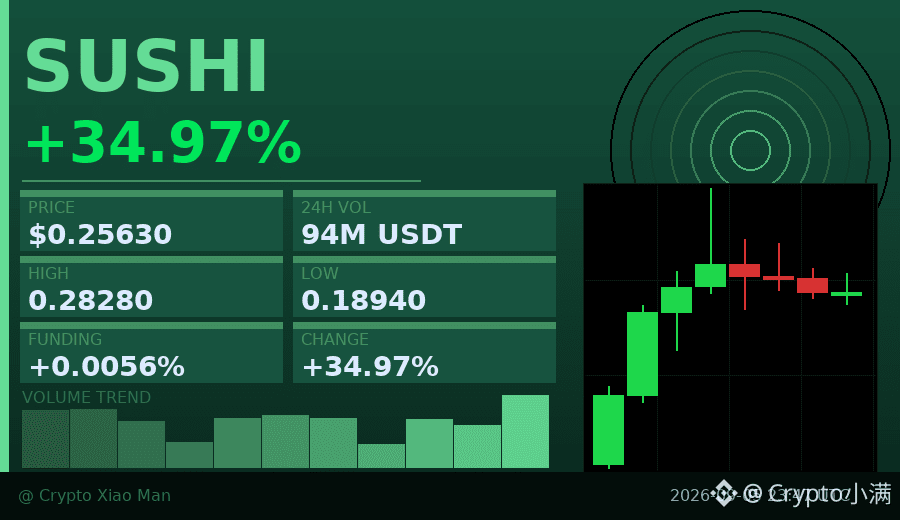
34.97% — SUSHI’s gain tonight is quite interesting.
The price moved from 0.1894 to 0.2563, with trading volume at 93.5M USDT, but the funding rate is only 0.00558%, which is not extreme.
Long positions account for 59% and short positions 41%, so the positioning is not one-sided, suggesting this rally has not yet reached the point where "everyone is on board."
Overall strength increased over the past 8 hours, with several pullbacks along the way, but each was bought up.
This kind of volume-price alignment, with positions not yet overheated, is actually more sustainable than a rally where the funding rate spikes through the roof.
$SUSHI #DeFi #34.97%
Click the small card below to quickly view the market 👇
The price moved from 0.1894 to 0.2563, with trading volume at 93.5M USDT, but the funding rate is only 0.00558%, which is not extreme.
Long positions account for 59% and short positions 41%, so the positioning is not one-sided, suggesting this rally has not yet reached the point where "everyone is on board."
Overall strength increased over the past 8 hours, with several pullbacks along the way, but each was bought up.
This kind of volume-price alignment, with positions not yet overheated, is actually more sustainable than a rally where the funding rate spikes through the roof.
$SUSHI #DeFi #34.97%
Click the small card below to quickly view the market 👇
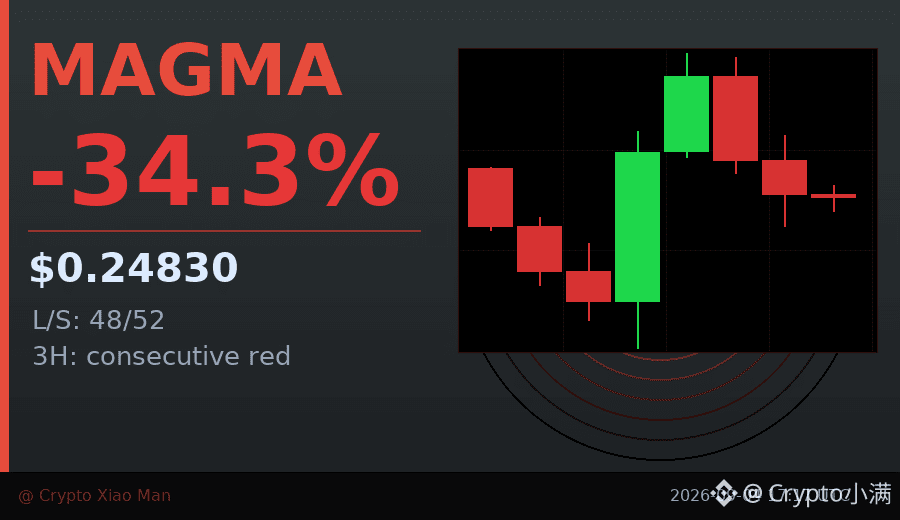
After a 34% plunge, MAGMA's trading volume surged to 126 million — this is not panic selling, but someone aggressively buying at the bottom.
The price dropped from 0.38 to 0.21, but although the last three hourly candlesticks closed red, the decline has clearly narrowed, and selling pressure is being exhausted.
More importantly, the long/short ratio is 48% to 52%, with shorts holding only a slight edge, nowhere near an extreme crowded level.
This combination of "price down, volume up + selling pressure fading" is often a precursor to a short-term rebound.
I've seen this script too many times: a sharp dump to shake out weak hands -> consolidation with declining volume -> a rapid rebound. We are now at the end of the second stage.
Of course, if the previous low at 0.21 fails to hold, there is still room for further downside. But the risk-reward is already worth a small test position.
$MAGMA #暴跌反弹 #34%
Click the small card below to quickly check the market 👇
The price dropped from 0.38 to 0.21, but although the last three hourly candlesticks closed red, the decline has clearly narrowed, and selling pressure is being exhausted.
More importantly, the long/short ratio is 48% to 52%, with shorts holding only a slight edge, nowhere near an extreme crowded level.
This combination of "price down, volume up + selling pressure fading" is often a precursor to a short-term rebound.
I've seen this script too many times: a sharp dump to shake out weak hands -> consolidation with declining volume -> a rapid rebound. We are now at the end of the second stage.
Of course, if the previous low at 0.21 fails to hold, there is still room for further downside. But the risk-reward is already worth a small test position.
$MAGMA #暴跌反弹 #34%
Click the small card below to quickly check the market 👇

$UNI This dip has something to it. In just 15 minutes, it dropped 1.46%, and the trading volume surged to 2.7 times the usual. The close even smashed through the bottoms of nearly 20 five-minute candlesticks.
It looks like the shorts are stepping up and causing trouble. Open interest is rising, but the notional value is shrinking—more like new leveraged short positions are entering than a simple liquidation-and-sell-off. The active traded volume difference is -36.4%, and the selling pressure is quite fierce. The buy-sell ratio is 0.47, essentially one-sided.
Anomalies across the whole pool rank #34 for the count, and the notional change ranks up to #5. This isn’t small—don’t rush to bottom-fish. Wait and see whether the sell pressure can catch its breath. Stay steady—don’t get carried away.
It looks like the shorts are stepping up and causing trouble. Open interest is rising, but the notional value is shrinking—more like new leveraged short positions are entering than a simple liquidation-and-sell-off. The active traded volume difference is -36.4%, and the selling pressure is quite fierce. The buy-sell ratio is 0.47, essentially one-sided.
Anomalies across the whole pool rank #34 for the count, and the notional change ranks up to #5. This isn’t small—don’t rush to bottom-fish. Wait and see whether the sell pressure can catch its breath. Stay steady—don’t get carried away.
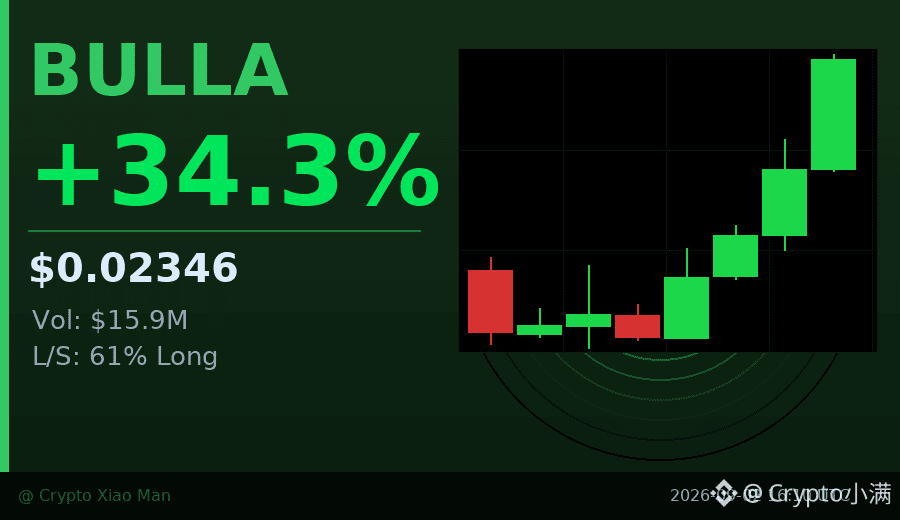
$BULLA Today is up 34%, but I think the more worth watching is its price-structure.
The price has climbed from 0.017 up to 0.023. It’s not the kind of move driven by one big bullish candle. Instead, it’s been stepping upward with a series of candles—each candle holds its ground before the next step. This kind of movement usually suggests that buyers are entering in batches, not pumping in one wave and then fading out.
The trading volume also says something: during the middle phase, several candles show large volume, which indicates that some people are buying seriously—not just following the crowd.
Currently, the long-to-short ratio is 61% betting on upside and 39% betting on downside. The bulls have a slight edge, but it’s not extremely lopsided. With this kind of split, if the trend continues, the shorts may start feeling pressure—forcing them to chase and that could push the price higher again.
Of course, a 34% gain is already a pretty big move. Chasing high comes with risk. I’ll focus on whether it can hold the 0.021 level going forward. If the volume keeps up, there may still be room to look ahead; if it falls on shrinking volume, then most likely this is a pump that’s already played out.
$BULLA #小币暴涨 #34%涨幅
Click the small card below to quickly check the market trend👇
The price has climbed from 0.017 up to 0.023. It’s not the kind of move driven by one big bullish candle. Instead, it’s been stepping upward with a series of candles—each candle holds its ground before the next step. This kind of movement usually suggests that buyers are entering in batches, not pumping in one wave and then fading out.
The trading volume also says something: during the middle phase, several candles show large volume, which indicates that some people are buying seriously—not just following the crowd.
Currently, the long-to-short ratio is 61% betting on upside and 39% betting on downside. The bulls have a slight edge, but it’s not extremely lopsided. With this kind of split, if the trend continues, the shorts may start feeling pressure—forcing them to chase and that could push the price higher again.
Of course, a 34% gain is already a pretty big move. Chasing high comes with risk. I’ll focus on whether it can hold the 0.021 level going forward. If the volume keeps up, there may still be room to look ahead; if it falls on shrinking volume, then most likely this is a pump that’s already played out.
$BULLA #小币暴涨 #34%涨幅
Click the small card below to quickly check the market trend👇

September 1, 2026, 13:56 UTC
📉 📉 📉
Cybersecurity researchers say a fake "Claude Opus 5 Free Desktop" app is being used to distribute RevStealer, a Windows malware strain that steals browser data, passwords, screenshots, VPN and messaging information, and targets more than 50 cryptocurrency wallets. The malware avoids analysis by checking for signs of a real user device before decrypting and executing its payload.
Source: https://whale-alert.io/stories/fde101699dc65f/Fake-Claude-desktop-app-used-to-spread-RevStealer-malware-targeting-more-than-50-crypto-wallets
⚠️ This content is an automated quote/summary from an external source, not personal opinion or investment advice.
📉 📉 📉
Cybersecurity researchers say a fake "Claude Opus 5 Free Desktop" app is being used to distribute RevStealer, a Windows malware strain that steals browser data, passwords, screenshots, VPN and messaging information, and targets more than 50 cryptocurrency wallets. The malware avoids analysis by checking for signs of a real user device before decrypting and executing its payload.
Source: https://whale-alert.io/stories/fde101699dc65f/Fake-Claude-desktop-app-used-to-spread-RevStealer-malware-targeting-more-than-50-crypto-wallets
⚠️ This content is an automated quote/summary from an external source, not personal opinion or investment advice.

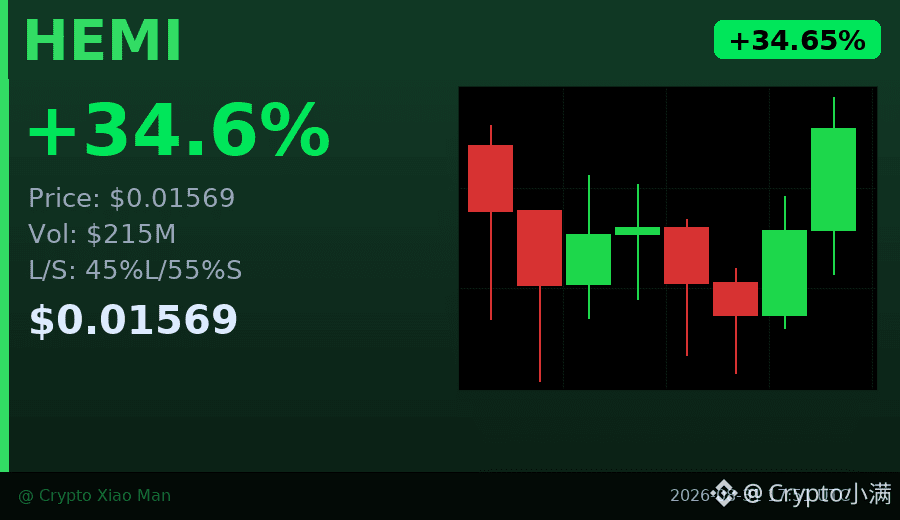
$HEMI Today’s surge, I really didn’t expect it to be this wild.
In the past 24 hours, it’s up by nearly 35%, and trading volume has surged to just over $200 million. For a small coin, that kind of volume is already quite staggering.
But what I think is even more worth paying attention to is the long/short positioning structure: right now, the number of people shorting it is actually higher than the number of people going long. 55% are betting on it to fall, while only 45% are betting on it to rise. In other words, this rally has happened while “most people don’t believe in it.”
Sometimes this kind of price action can push further upward, because if the shorts can’t hold on and get liquidated or forced to close, it can continue to drive the price higher. The candlestick chart also shows it: the most recent three hourly candles have all closed bullish, and momentum is still there.
Of course, for a single-day spike of 35%, there are two things to keep in mind. First, in the short term, volatility could be extremely intense. Second, if the rally happens on rising volume to a peak and then volume begins to contract, it’s likely a sign that the upward momentum is weakening.
I’m now focusing on whether it can hold steady near today’s high (around 0.0168). If it falls back on decreasing volume, then you’ll need to be careful.
$HEMI #小币暴涨 #34.65%
Click the small card below to quickly check the market👇
In the past 24 hours, it’s up by nearly 35%, and trading volume has surged to just over $200 million. For a small coin, that kind of volume is already quite staggering.
But what I think is even more worth paying attention to is the long/short positioning structure: right now, the number of people shorting it is actually higher than the number of people going long. 55% are betting on it to fall, while only 45% are betting on it to rise. In other words, this rally has happened while “most people don’t believe in it.”
Sometimes this kind of price action can push further upward, because if the shorts can’t hold on and get liquidated or forced to close, it can continue to drive the price higher. The candlestick chart also shows it: the most recent three hourly candles have all closed bullish, and momentum is still there.
Of course, for a single-day spike of 35%, there are two things to keep in mind. First, in the short term, volatility could be extremely intense. Second, if the rally happens on rising volume to a peak and then volume begins to contract, it’s likely a sign that the upward momentum is weakening.
I’m now focusing on whether it can hold steady near today’s high (around 0.0168). If it falls back on decreasing volume, then you’ll need to be careful.
$HEMI #小币暴涨 #34.65%
Click the small card below to quickly check the market👇

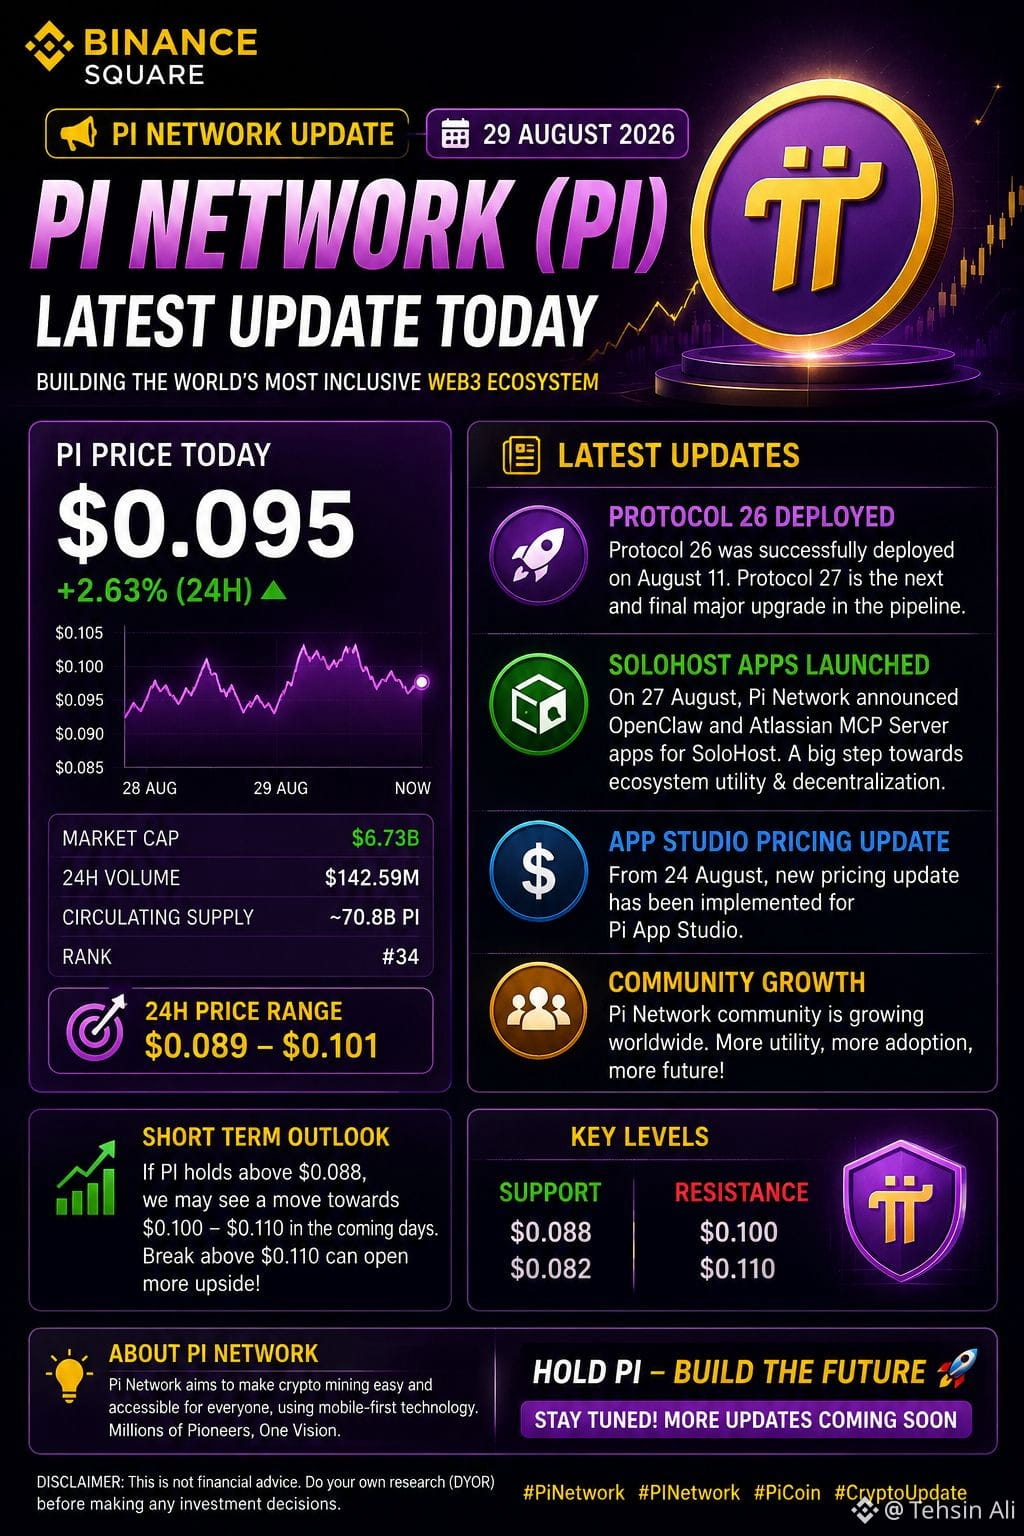
🚀 PI NETWORK (PI) – LATEST UPDATE
29 AUGUST 2026
Pi Network continues to build one of the most active and engaged Web3 communities. Here’s what’s happening today 👇
📈 PI PRICE UPDATE • Current Price: $0.095
• 24H Change: +2.63%
• 24H Range: $0.089 – $0.101
• Market Cap: $6.73B
• Circulating Supply: ~70.8B PI
• Rank: #34
🛠️ LATEST DEVELOPMENTS
✅ Protocol 26 successfully deployed on Aug 11.
✅ Protocol 27 is the next & final major upgrade in the pipeline.
✅ SoloHost apps (OpenClaw & Atlassian MCP) launched on Aug 27.
✅ Pi App Studio pricing update implemented from Aug 24.
✅ Ecosystem growth and real utility continue to expand.
🎯 SHORT TERM OUTLOOK
If PI holds above $0.088, we may see a move towards $0.100 – $0.110 in the coming days.
Break above $0.110 can open more upside!
💡 WHY PI NETWORK?
✅ Strong community
✅ Real utility & use cases
✅ Continuous development
✅ Decentralized future
📢 MY TAKE
Pi Network is still in its early stages, and the future looks promising. Keep mining, stay updated, and be part of the revolution! 💜
#PiNetwork #PI #PiCoin #CryptoUpdate #Web3 #BinanceSquare
29 AUGUST 2026
Pi Network continues to build one of the most active and engaged Web3 communities. Here’s what’s happening today 👇
📈 PI PRICE UPDATE • Current Price: $0.095
• 24H Change: +2.63%
• 24H Range: $0.089 – $0.101
• Market Cap: $6.73B
• Circulating Supply: ~70.8B PI
• Rank: #34
🛠️ LATEST DEVELOPMENTS
✅ Protocol 26 successfully deployed on Aug 11.
✅ Protocol 27 is the next & final major upgrade in the pipeline.
✅ SoloHost apps (OpenClaw & Atlassian MCP) launched on Aug 27.
✅ Pi App Studio pricing update implemented from Aug 24.
✅ Ecosystem growth and real utility continue to expand.
🎯 SHORT TERM OUTLOOK
If PI holds above $0.088, we may see a move towards $0.100 – $0.110 in the coming days.
Break above $0.110 can open more upside!
💡 WHY PI NETWORK?
✅ Strong community
✅ Real utility & use cases
✅ Continuous development
✅ Decentralized future
📢 MY TAKE
Pi Network is still in its early stages, and the future looks promising. Keep mining, stay updated, and be part of the revolution! 💜
#PiNetwork #PI #PiCoin #CryptoUpdate #Web3 #BinanceSquare

$PROM is reaching an active decision zone where momentum can expand quickly.
$PROM is still trading with strength, and dip buyers keep defending the latest breakout area.
Setup LONG $PROM (max 10x)
🎯 Entry: 3.521 - 3.549
🛑 SL: 2.69
✅ TP1: 3.585
✅ TP2: 3.631
✅ TP3: 3.684
• Vivo T5 5G is coming to India and it’s gunning for the slim phone crowd
• 2026 SkS Weekly Climate Change & Global Warming News Roundup #34
Do you prefer the breakout on $PROM , or the retest entry?
Trade $PROM here 👇
#PROM #MarketStructure #TradingSetup
$PROM is still trading with strength, and dip buyers keep defending the latest breakout area.
Setup LONG $PROM (max 10x)
🎯 Entry: 3.521 - 3.549
🛑 SL: 2.69
✅ TP1: 3.585
✅ TP2: 3.631
✅ TP3: 3.684
• Vivo T5 5G is coming to India and it’s gunning for the slim phone crowd
• 2026 SkS Weekly Climate Change & Global Warming News Roundup #34
Do you prefer the breakout on $PROM , or the retest entry?
Trade $PROM here 👇
#PROM #MarketStructure #TradingSetup

Sui ($SUI ) Gains Momentum with Strong Community Backing
Sui ($SUI ) is making waves as it climbs the ranks, currently sitting at #34 by market cap. The 24-hour volume of $102M and a modest 1.21% gain highlight its steady rise. What’s driving this momentum? A robust and active community, combined with ongoing developer updates and ecosystem growth. Sui’s unique approach to scalability and transaction efficiency is resonating with both traders and developers. As the ecosystem expands, keep an eye on how $SUI continues to perform and attract new users. ⚡🔥
Follow for more setups like this.
#HahaProfit #Sui
Sui ($SUI ) is making waves as it climbs the ranks, currently sitting at #34 by market cap. The 24-hour volume of $102M and a modest 1.21% gain highlight its steady rise. What’s driving this momentum? A robust and active community, combined with ongoing developer updates and ecosystem growth. Sui’s unique approach to scalability and transaction efficiency is resonating with both traders and developers. As the ecosystem expands, keep an eye on how $SUI continues to perform and attract new users. ⚡🔥
Follow for more setups like this.
#HahaProfit #Sui

$HOME finally shows some action.
In just 15 minutes it surged by 1.51%, with volume at 1.55 times the usual level. The volatility Z-score hit 2.10. This isn’t some minor move—there’s truly capital at work.
The data is even clearer—OI is rising. In nominal terms, the 1h change added 243K (+2.99%). That’s blatant: fresh leveraged long positions are entering to push the price, not something like shorts covering and creating a fake spike. The main orders are clearly pressing down and striking—active buy/sell ratio is 2.11, with the bid side holding an overwhelming advantage.
Even more critical: the closing price directly smashed through the upper edge of the recent range across nearly 20 five-minute candlesticks, and the OI abnormal percentile is already at 93.5%. In HOME’s own history, that kind of level is always an extreme zone.
Abnormal ranking in the whole pool #11, nominal change #34—this is the kind of instrument the entire market is watching, but nobody dares to move yet.
The 24-hour trading value of 26.5M shows liquidity is sufficient—someone is bold enough to place a heavy bet at this level.
Anyway, I’ve set my sights on it. I’ll add on the breakout, and I’m not afraid of a pullback and wick. This kind of high-volatility instrument is exactly what’s for short-term setups.
$HOME don’t let me down.
In just 15 minutes it surged by 1.51%, with volume at 1.55 times the usual level. The volatility Z-score hit 2.10. This isn’t some minor move—there’s truly capital at work.
The data is even clearer—OI is rising. In nominal terms, the 1h change added 243K (+2.99%). That’s blatant: fresh leveraged long positions are entering to push the price, not something like shorts covering and creating a fake spike. The main orders are clearly pressing down and striking—active buy/sell ratio is 2.11, with the bid side holding an overwhelming advantage.
Even more critical: the closing price directly smashed through the upper edge of the recent range across nearly 20 five-minute candlesticks, and the OI abnormal percentile is already at 93.5%. In HOME’s own history, that kind of level is always an extreme zone.
Abnormal ranking in the whole pool #11, nominal change #34—this is the kind of instrument the entire market is watching, but nobody dares to move yet.
The 24-hour trading value of 26.5M shows liquidity is sufficient—someone is bold enough to place a heavy bet at this level.
Anyway, I’ve set my sights on it. I’ll add on the breakout, and I’m not afraid of a pullback and wick. This kind of high-volatility instrument is exactly what’s for short-term setups.
$HOME don’t let me down.
$ROBO This drop has a bit of a taste to it.
In just 15 minutes, it directly dumped by 1.45%. The closing price pierced through the lower edge of nearly 20 consecutive 5-minute candles. Volume expanded to 1.49x, and the volatility Z-score jumped to 2.4. Most importantly, OI is shrinking, and so is the notional. In the 15-minute contract, open interest fell by 0.32%, and the notional change was -115K. This doesn’t look like new short positions dumping the price—it’s more like longs being forcibly deleveraged, with liquidation and stop-loss selling driving the fall.
The funding rate is still hanging around the recent high percentile, which is pretty awkward. High-level longs are still paying to hold up the market, yet the price broke the key level first. Active trading participation is worse by -44%, the buy/sell ratio is only 0.39. In the order book, bids are being eaten all the way down; there’s almost no meaningful resistance.
At the whole-pool level, the abnormal percentile is 87.9%, ranking #20, and the notional change also ranks as high as #34. Put these figures in the context of the entire pool—yes, it’s definitely “eye-catching.”
A simple dip alone would be easier to explain, but with the funding rate + level break + active sell orders all converging, don’t rush in on the short term. Wait for this round of long liquidation/clean-up, and then observe whether there are signs of a downtrend stopping on shrinking volume before making a move.
In just 15 minutes, it directly dumped by 1.45%. The closing price pierced through the lower edge of nearly 20 consecutive 5-minute candles. Volume expanded to 1.49x, and the volatility Z-score jumped to 2.4. Most importantly, OI is shrinking, and so is the notional. In the 15-minute contract, open interest fell by 0.32%, and the notional change was -115K. This doesn’t look like new short positions dumping the price—it’s more like longs being forcibly deleveraged, with liquidation and stop-loss selling driving the fall.
The funding rate is still hanging around the recent high percentile, which is pretty awkward. High-level longs are still paying to hold up the market, yet the price broke the key level first. Active trading participation is worse by -44%, the buy/sell ratio is only 0.39. In the order book, bids are being eaten all the way down; there’s almost no meaningful resistance.
At the whole-pool level, the abnormal percentile is 87.9%, ranking #20, and the notional change also ranks as high as #34. Put these figures in the context of the entire pool—yes, it’s definitely “eye-catching.”
A simple dip alone would be easier to explain, but with the funding rate + level break + active sell orders all converging, don’t rush in on the short term. Wait for this round of long liquidation/clean-up, and then observe whether there are signs of a downtrend stopping on shrinking volume before making a move.


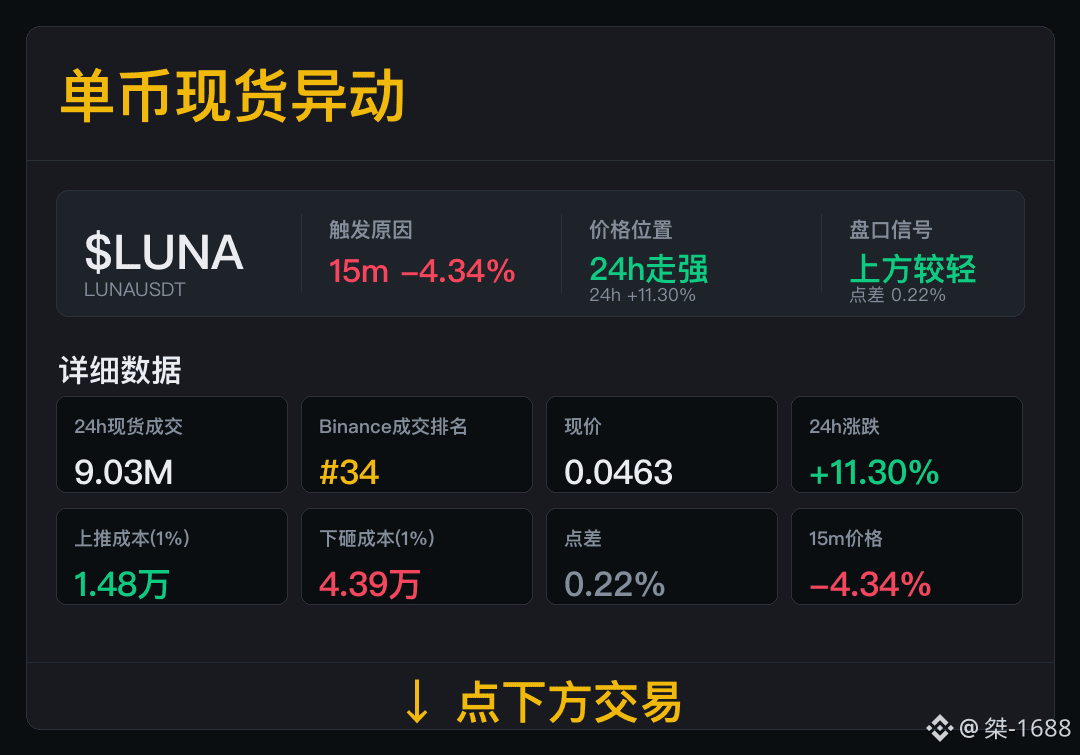
$LUNA 15m Live spot momentum—first look at volume, then position and exit routes.
Spot trades: 9.03M, Binance trade ranking #34. You can track both the trade size and its position on the leaderboard together.
Now, 24h change: +11.30%; spread: 0.22%, push-up cost: 14.8k, sell-down cost: 43.9k. After trades, keep an eye on sustained activity—current order book conditions are only meaningful as reference.
In the next step, first check volume capacity, then check the bid-ask spread.
Spot trades: 9.03M, Binance trade ranking #34. You can track both the trade size and its position on the leaderboard together.
Now, 24h change: +11.30%; spread: 0.22%, push-up cost: 14.8k, sell-down cost: 43.9k. After trades, keep an eye on sustained activity—current order book conditions are only meaningful as reference.
In the next step, first check volume capacity, then check the bid-ask spread.
Log in to explore more content