

Time Pass Hub
1.1k Posts

Time Pass Hub
Report
Block User
👉Never Give Up. Every lesson you learn today builds the foundation for tomorrow's success.✅
Frequent Trader
1.3 Years
98 Following
2.2K+ Followers
1.4K+ Liked
Posts
All
Quotes
Videos
Live
·
--
Bullish
See translation
🚀 $BMT / USDT Massive Breakout & Momentum Surge! 🔥
$BMT just exploded out of a long consolidation range around $0.0217, printing a violent parabolic surge up to a 24h high of $0.04186 (+29.4%+ gain)! 📈
Key Technical Observations (15m Timeframe):
Massive Volume Spike: High buying volume confirms strong institutional/whale entry driving this initial pump.
Supertrend & Moving Averages: Price blew past MA(7), MA(25), and MA(99) with strong bullish momentum.
Pullback & Support Zones: After hitting $0.04186, we see quick profit-taking pulling price back toward the $0.034 – $0.036 area.
🎯 Trade Setup & Levels to Watch:
🟢 Immediate Support: $0.0340 – $0.0309 (Supertrend zone)
🔴 Key Resistance / Target: $0.0385 & retest of $0.0418
⚠️ Invalidation: A breakdown below $0.0296 signals loss of short-term momentum.
Are you taking profits here or holding for a second leg up? Drop your thoughts below! 👇
#Write2Earn #CryptoTrading #Binance #TechnicalAnalysis #altcoins
$BMT
{spot}(BMTUSDT)
🚀 $BMT / USDT Massive Breakout & Momentum Surge! 🔥
$BMT just exploded out of a long consolidation range around $0.0217, printing a violent parabolic surge up to a 24h high of $0.04186 (+29.4%+ gain)! 📈
Key Technical Observations (15m Timeframe):
Massive Volume Spike: High buying volume confirms strong institutional/whale entry driving this initial pump.
Supertrend & Moving Averages: Price blew past MA(7), MA(25), and MA(99) with strong bullish momentum.
Pullback & Support Zones: After hitting $0.04186, we see quick profit-taking pulling price back toward the $0.034 – $0.036 area.
🎯 Trade Setup & Levels to Watch:
🟢 Immediate Support: $0.0340 – $0.0309 (Supertrend zone)
🔴 Key Resistance / Target: $0.0385 & retest of $0.0418
⚠️ Invalidation: A breakdown below $0.0296 signals loss of short-term momentum.
Are you taking profits here or holding for a second leg up? Drop your thoughts below! 👇
#Write2Earn #CryptoTrading #Binance #TechnicalAnalysis #altcoins
$BMT

31
46
·
--
Bullish
See translation
The technical analysis of the $ERA /USDT 15-minute Binance chart shows a strong bullish momentum cooling off after reaching a peak of 0.09610.
Key Technical Insights $ERA
* Price & Performance: The current price is 0.08972 USDT, up +31.94% in the last 24 hours.
* Moving Averages (MA):
* MA(7) (Yellow): Currently at 0.08990, acting as immediate dynamic resistance/support as the price trades right around it.
* MA(25) (Purple): Located at 0.08175, pointing sharply upwards and providing strong secondary support.
* MA(99) (Deep Purple): Sits far below at 0.07430, confirming a solid macro uptrend.
* Supertrend: Indicates a bullish signal (Green) at 0.08263, which serves as a major trend-reversal line.
* Volume: Spike in trading volume (1.13B ERA / 90.10M USDT in 24h) accompanied the sharp rally to 0.09610. Red volume bars indicate recent profit-taking/pullback.
Key Levels to Watch
* Immediate Resistance: 0.09088 – 0.09610 (24h High).
* Immediate Support: 0.08412.
* Strong Support: 0.08175 – 0.08263 (MA(25) and Supertrend level).
#Binance #analysis #trading #Write2Earn #crypto
$ERA
{spot}(ERAUSDT)
The technical analysis of the $ERA /USDT 15-minute Binance chart shows a strong bullish momentum cooling off after reaching a peak of 0.09610.
Key Technical Insights $ERA
* Price & Performance: The current price is 0.08972 USDT, up +31.94% in the last 24 hours.
* Moving Averages (MA):
* MA(7) (Yellow): Currently at 0.08990, acting as immediate dynamic resistance/support as the price trades right around it.
* MA(25) (Purple): Located at 0.08175, pointing sharply upwards and providing strong secondary support.
* MA(99) (Deep Purple): Sits far below at 0.07430, confirming a solid macro uptrend.
* Supertrend: Indicates a bullish signal (Green) at 0.08263, which serves as a major trend-reversal line.
* Volume: Spike in trading volume (1.13B ERA / 90.10M USDT in 24h) accompanied the sharp rally to 0.09610. Red volume bars indicate recent profit-taking/pullback.
Key Levels to Watch
* Immediate Resistance: 0.09088 – 0.09610 (24h High).
* Immediate Support: 0.08412.
* Strong Support: 0.08175 – 0.08263 (MA(25) and Supertrend level).
#Binance #analysis #trading #Write2Earn #crypto
$ERA

32
32
·
--
Bullish
See translation
$AKE
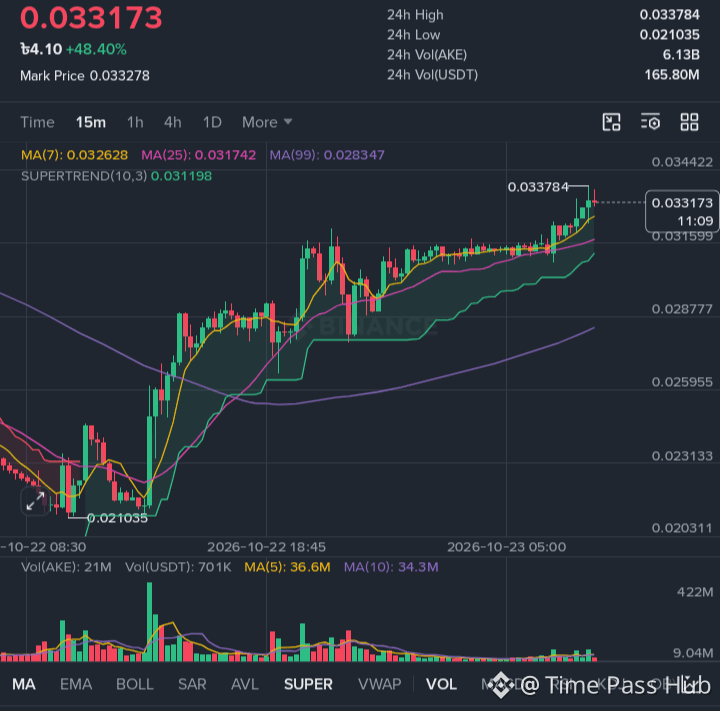
The 15-minute chart shows a strong bullish trend driven by high initial volume, though momentum is currently consolidating near local highs.
Key Technical Observations$AKE
* Current Price & Trend: The price is trading around 0.033207 USDT (+48.55% in 24 hours) after hitting a high of 0.033784.
* Moving Averages (MA):
* The MA(7) (0.032633) is above the MA(25) (0.031743) and MA(99) (0.028348), confirming a solid short-term and medium-term upward trend.
* Supertrend Indicator: The Supertrend(10,3) line is green at 0.031198, acting as a strong dynamic trailing support.
* Volume Analysis: High volume spikes accompanied the initial breakout from the 0.021035 low, but recent volume has decreased during the current top consolidation.
Key Levels to Watch
* Immediate Resistance: 0.033784 (24h High). A clear breakout above this could push prices toward 0.0344+.
* Immediate Support: 0.03263 (MA-7 line).
* Major Support Zone: 0.03120 – 0.03174 (Supertrend line and MA-25 confluence).
Technical Summary
The market structure remains bullish as long as price holds above the MA(25) and Supertrend levels (~0.0312 – 0.0317). However, the declining volume near the local peak suggests potential sideways consolidation or a minor pull-back before another attempt to breach resistance.
#Binance #TrendingTopic #TradingSignals #analysis #crypto
$AKE
{future}(AKEUSDT)
$AKE
The 15-minute chart shows a strong bullish trend driven by high initial volume, though momentum is currently consolidating near local highs.
Key Technical Observations$AKE
* Current Price & Trend: The price is trading around 0.033207 USDT (+48.55% in 24 hours) after hitting a high of 0.033784.
* Moving Averages (MA):
* The MA(7) (0.032633) is above the MA(25) (0.031743) and MA(99) (0.028348), confirming a solid short-term and medium-term upward trend.
* Supertrend Indicator: The Supertrend(10,3) line is green at 0.031198, acting as a strong dynamic trailing support.
* Volume Analysis: High volume spikes accompanied the initial breakout from the 0.021035 low, but recent volume has decreased during the current top consolidation.
Key Levels to Watch
* Immediate Resistance: 0.033784 (24h High). A clear breakout above this could push prices toward 0.0344+.
* Immediate Support: 0.03263 (MA-7 line).
* Major Support Zone: 0.03120 – 0.03174 (Supertrend line and MA-25 confluence).
Technical Summary
The market structure remains bullish as long as price holds above the MA(25) and Supertrend levels (~0.0312 – 0.0317). However, the declining volume near the local peak suggests potential sideways consolidation or a minor pull-back before another attempt to breach resistance.
#Binance #TrendingTopic #TradingSignals #analysis #crypto
$AKE
35
46
·
--
Bullish
See translation
🚀 $AGT/USDT Technical Update & Outlook (15m Timeframe) 📈
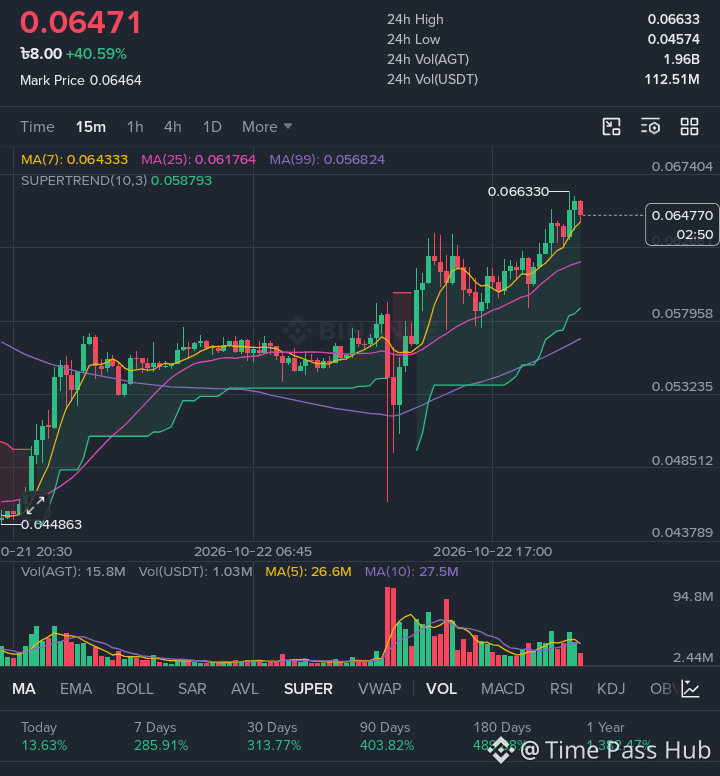
$AGT is demonstrating strong bullish momentum, up over +41% today! After rebounding sharply from the $0.04628 low, the price has broken through local resistance levels and is pushing towards $0.06633.
📊 Key Technical Highlights:$AGT
* Current Price: $0.06481
* Moving Averages (15m): Trading firmly above MA(7) ($0.0643), MA(25) ($0.0617), and MA(99) ($0.0568)—confirming short-term trend strength.
* SuperTrend: Signals a clear Bullish Trend with key trend support around $0.0590.
* Volume: Sustained trading volume following the initial surge indicates ongoing buyer interest.
🎯 Trade Setup & Targets:
* 🟢 Entry Zone: $0.0618 – $0.0635 (Look for dips near MA(25) / support for optimal entries)
* 🎯 Target 1: $0.0663 (Recent high)
* 🎯 Target 2: $0.0685
* 🎯 Target 3: $0.0720
* 🛑 Stop Loss: $0.0585 (Below SuperTrend & MA(25) support)
⚠️ Risk Management Notice: High volatility is active. Avoid over-leveraging and wait for healthy pullbacks rather than chasing the top. Always use a strict Stop Loss!
#CryptoAnalysis #Write2Earn #BinanceSquare #CryptoAnalysis #TradingSignal
$AGT
{future}(AGTUSDT)
🚀 $AGT /USDT Technical Update & Outlook (15m Timeframe) 📈
$AGT is demonstrating strong bullish momentum, up over +41% today! After rebounding sharply from the $0.04628 low, the price has broken through local resistance levels and is pushing towards $0.06633.
📊 Key Technical Highlights:$AGT
* Current Price: $0.06481
* Moving Averages (15m): Trading firmly above MA(7) ($0.0643), MA(25) ($0.0617), and MA(99) ($0.0568)—confirming short-term trend strength.
* SuperTrend: Signals a clear Bullish Trend with key trend support around $0.0590.
* Volume: Sustained trading volume following the initial surge indicates ongoing buyer interest.
🎯 Trade Setup & Targets:
* 🟢 Entry Zone: $0.0618 – $0.0635 (Look for dips near MA(25) / support for optimal entries)
* 🎯 Target 1: $0.0663 (Recent high)
* 🎯 Target 2: $0.0685
* 🎯 Target 3: $0.0720
* 🛑 Stop Loss: $0.0585 (Below SuperTrend & MA(25) support)
⚠️ Risk Management Notice: High volatility is active. Avoid over-leveraging and wait for healthy pullbacks rather than chasing the top. Always use a strict Stop Loss!
#CryptoAnalysis #Write2Earn #BinanceSquare #CryptoAnalysis #TradingSignal
$AGT
19
21
·
--
Bullish
See translation
🚀 $AGT /USDT Short-Term Bullish Surge! 🔥
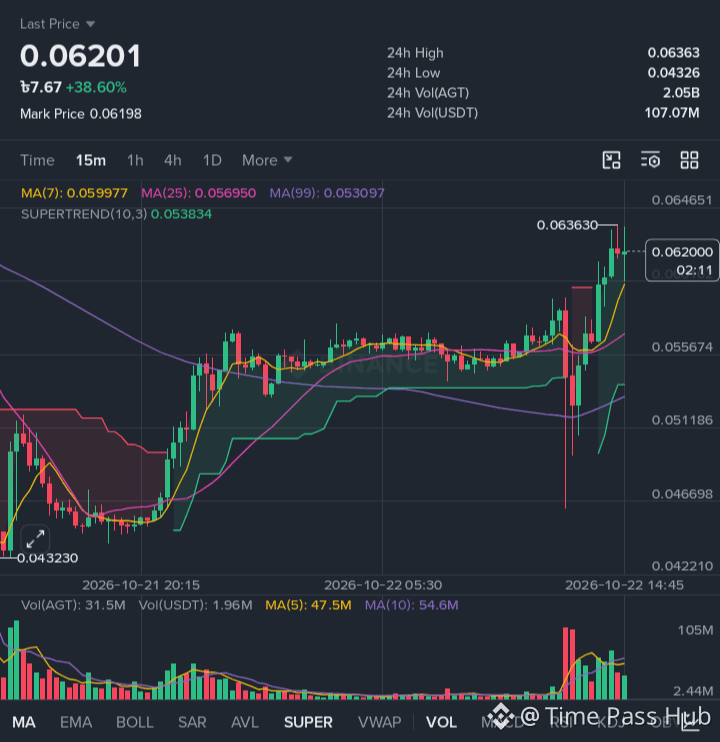
The AGT/USDT 15-minute chart is demonstrating massive upward momentum, pushing past recent resistance levels!
📊 Key Chart Observations:
* Current Price: ~$0.06182 (+38.39% 24h gain)
* 24h High / Low: $0.06363 / $0.04326
* Moving Averages (MA): Price is holding well above the MA(7) ($0.05994), MA(25) ($0.05694), and MA(99) ($0.05309), confirming strong short-term bullish alignment.
* Supertrend Indicator: Flashed a green buy signal near $0.0538, backing the upward movement.
* Volume Spike: Significant volume expansion supported the breakout above $0.060, showing active buyer interest.
🎯 Key Trading Levels:
* Immediate Resistance: $0.0636 (Recent high)
* Key Support Zone: $0.0599 – $0.0569 (Confluence of MA7 & MA25)
* Major Support: $0.0538 (Supertrend level)
💡 Strategy Takeaway:
A sustained breakout above $0.0636 could trigger another leg higher toward new local peaks. If a short-term pull-back occurs, look for consolidation around the $0.057 – $0.060 support region before entering new positions.
What’s your take? Are you holding $AGT or taking profits here? 👇
(Disclaimer: Not financial advice. Always manage your risk and DYOR!)
#CryptoAnalysis #BinanceSquare #TechnicalAnalysis #TradingSignal #Binance
$AGT
{future}(AGTUSDT)
🚀 $AGT /USDT Short-Term Bullish Surge! 🔥
The AGT/USDT 15-minute chart is demonstrating massive upward momentum, pushing past recent resistance levels!
📊 Key Chart Observations:
* Current Price: ~$0.06182 (+38.39% 24h gain)
* 24h High / Low: $0.06363 / $0.04326
* Moving Averages (MA): Price is holding well above the MA(7) ($0.05994), MA(25) ($0.05694), and MA(99) ($0.05309), confirming strong short-term bullish alignment.
* Supertrend Indicator: Flashed a green buy signal near $0.0538, backing the upward movement.
* Volume Spike: Significant volume expansion supported the breakout above $0.060, showing active buyer interest.
🎯 Key Trading Levels:
* Immediate Resistance: $0.0636 (Recent high)
* Key Support Zone: $0.0599 – $0.0569 (Confluence of MA7 & MA25)
* Major Support: $0.0538 (Supertrend level)
💡 Strategy Takeaway:
A sustained breakout above $0.0636 could trigger another leg higher toward new local peaks. If a short-term pull-back occurs, look for consolidation around the $0.057 – $0.060 support region before entering new positions.
What’s your take? Are you holding $AGT or taking profits here? 👇
(Disclaimer: Not financial advice. Always manage your risk and DYOR!)
#CryptoAnalysis #BinanceSquare #TechnicalAnalysis #TradingSignal #Binance
$AGT
36
1
44
See translation
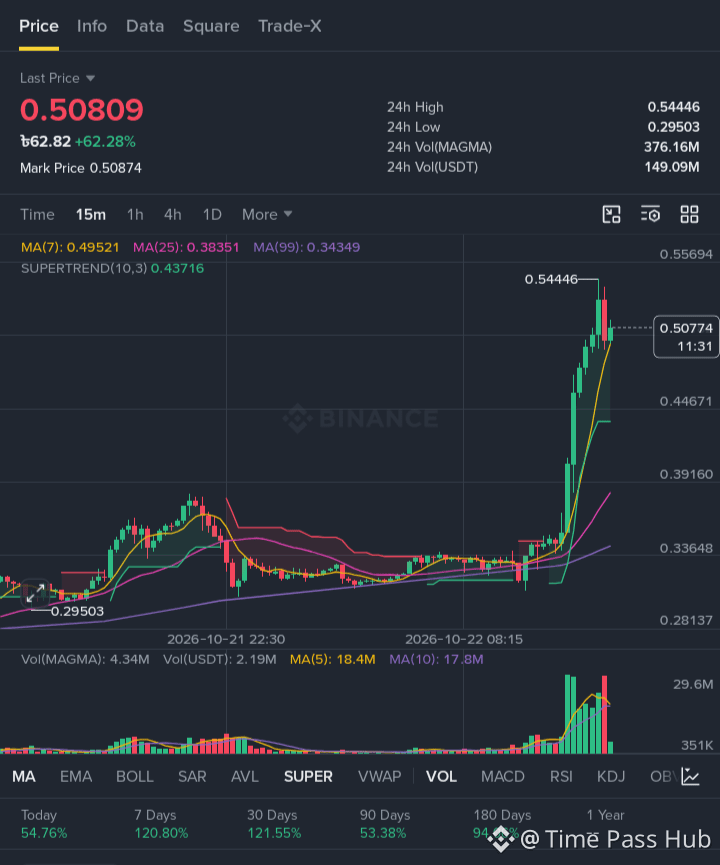
The $MAGMA /USDT 15-minute chart shows a strong bullish breakout followed by an initial pullback/consolidation around the $0.505 level.
Key Technical Levels $MAGMA
* Current Price: $0.50531 (+61.10% 24h change)
* 24h High (Resistance): $0.54446
* Immediate Support (MA 7): $0.49485
* Supertrend Support: $0.43716
* Secondary Support (MA 25): $0.38341
Chart Breakdown
* Trend & Momentum: The price experienced a parabolic spike from the ~$0.33 region up to $0.54446. The Supertrend(10,3) remains bullish (green line below price at $0.437).
* Moving Averages: Price is currently trading well above the MA(25) and MA(99), staying right near the fast MA(7) line ($0.49485). A close above MA(7) maintains immediate bullish momentum.
* Volume Activity: High volume surges accompanied the rally to $0.544. The current red candle indicates profit-taking, but volume remains relatively moderate compared to the breakout spikes.
Potential Scenarios
* Bullish Continuation: If price holds above $0.495–$0.500 (MA 7 support), it can retest $0.544 and potentially make new highs.
* Pullback / Consolidation: Falling below $0.495 may trigger a deeper retracement toward the $0.437–$0.446 zone before finding solid support.
#Binance #crypto #trading #MarketAnalysis #Write2Earn
$MAGMA
{future}(MAGMAUSDT)
The $MAGMA /USDT 15-minute chart shows a strong bullish breakout followed by an initial pullback/consolidation around the $0.505 level.
Key Technical Levels $MAGMA
* Current Price: $0.50531 (+61.10% 24h change)
* 24h High (Resistance): $0.54446
* Immediate Support (MA 7): $0.49485
* Supertrend Support: $0.43716
* Secondary Support (MA 25): $0.38341
Chart Breakdown
* Trend & Momentum: The price experienced a parabolic spike from the ~$0.33 region up to $0.54446. The Supertrend(10,3) remains bullish (green line below price at $0.437).
* Moving Averages: Price is currently trading well above the MA(25) and MA(99), staying right near the fast MA(7) line ($0.49485). A close above MA(7) maintains immediate bullish momentum.
* Volume Activity: High volume surges accompanied the rally to $0.544. The current red candle indicates profit-taking, but volume remains relatively moderate compared to the breakout spikes.
Potential Scenarios
* Bullish Continuation: If price holds above $0.495–$0.500 (MA 7 support), it can retest $0.544 and potentially make new highs.
* Pullback / Consolidation: Falling below $0.495 may trigger a deeper retracement toward the $0.437–$0.446 zone before finding solid support.
#Binance #crypto #trading #MarketAnalysis #Write2Earn
$MAGMA
126
See translation
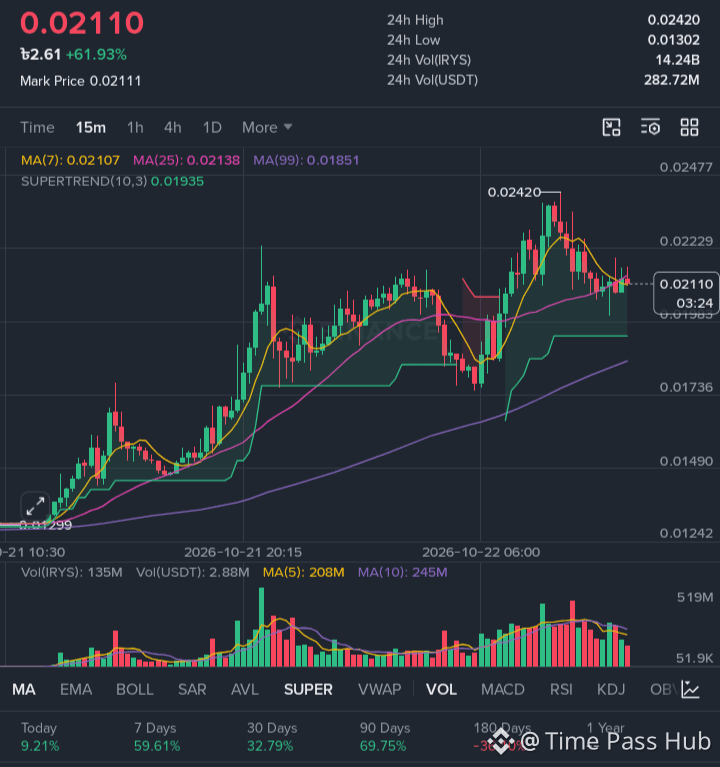
The $IRYS /USDT 15-minute chart shows a short-term pullback following a strong bullish rally.
Key Technical Observations$IRYS
Price Action & Trend: The asset is currently trading around 0.02110 USDT (+61.78% over 24h) after reaching a peak high of 0.02420 USDT. It is consolidating after a downward correction from the local top.
Moving Averages:
The MA(7) (0.02106) is near the current price level, acting as immediate support/resistance.
The price is sitting slightly below the MA(25) (0.02138), indicating short-term selling pressure/momentum slowing.
The long-term MA(99) (0.01851) remains well below, indicating the macro 24-hour trend remains significantly bullish.
Supertrend Indicator: The SUPERTREND(10,3) line sits at 0.01935 (green line below price), signalling that the broader short-term trend is still bullish as long as price stays above 0.01935.
Volume: Volume spiked during the initial surge to 0.02420 and has decreased during this consolidation phase, indicating reduced selling pressure at current levels.
Potential Scenarios
Bullish Rebound: If price holds above 0.02100 and reclaims 0.02138 (MA25), it may retest 0.02230 and potentially challenge the 0.02420 high.
Bearish Continuation / Correction: If price breaks below 0.02100, the next major support levels sit around 0.01935 (Supertrend level) and 0.01851 (MA99).
#Binance #crypto #trading #CryptoAnalysis #Write2Earn
$IRYS
{future}(IRYSUSDT)
The $IRYS /USDT 15-minute chart shows a short-term pullback following a strong bullish rally.
Key Technical Observations$IRYS
Price Action & Trend: The asset is currently trading around 0.02110 USDT (+61.78% over 24h) after reaching a peak high of 0.02420 USDT. It is consolidating after a downward correction from the local top.
Moving Averages:
The MA(7) (0.02106) is near the current price level, acting as immediate support/resistance.
The price is sitting slightly below the MA(25) (0.02138), indicating short-term selling pressure/momentum slowing.
The long-term MA(99) (0.01851) remains well below, indicating the macro 24-hour trend remains significantly bullish.
Supertrend Indicator: The SUPERTREND(10,3) line sits at 0.01935 (green line below price), signalling that the broader short-term trend is still bullish as long as price stays above 0.01935.
Volume: Volume spiked during the initial surge to 0.02420 and has decreased during this consolidation phase, indicating reduced selling pressure at current levels.
Potential Scenarios
Bullish Rebound: If price holds above 0.02100 and reclaims 0.02138 (MA25), it may retest 0.02230 and potentially challenge the 0.02420 high.
Bearish Continuation / Correction: If price breaks below 0.02100, the next major support levels sit around 0.01935 (Supertrend level) and 0.01851 (MA99).
#Binance #crypto #trading #CryptoAnalysis #Write2Earn
$IRYS
118
·
--
Bullish
See translation
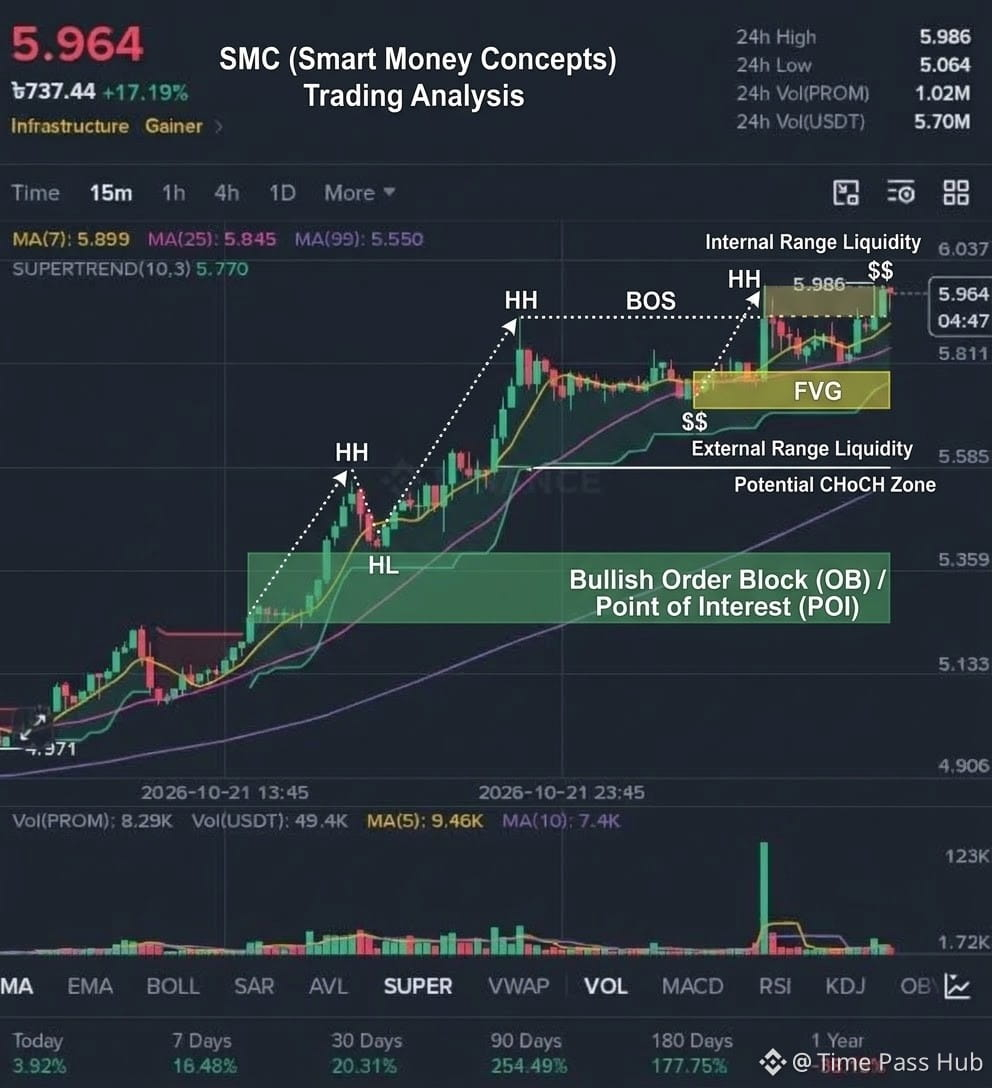
The provided 15-minute price chart for $PROM USDT shows a strong bullish trend currently testing recent resistance levels.
Key Technical Indicators & Summary$PROM
* Current Price: 5.964 USDT (+17.19% in 24h).
* Moving Averages (MA): The price is trading above MA(7) at 5.899, MA(25) at 5.845, and MA(99) at 5.550, showing short-term to medium-term bullish alignment.
* Supertrend (10,3): Currently at 5.770, giving a strong Buy signal and serving as a trailing support line.
* Key Levels:
* 24h High / Immediate Resistance: 5.986 USDT.
* Immediate Support: 5.899 USDT (MA 7) and 5.845 USDT (MA 25).
* Strong Support: 5.770 USDT (Supertrend).
* Volume: Spike in trading volume coincides with the upward price push toward the 24h high.
Short-Term Outlook
* Bullish Breakout Potential: A clean break and 15m candle close above 5.986 could open the door for testing the 6.037+ region.
* Pullback Scenario: If resistance holds, a minor pull-back toward the 5.850 – 5.900 range is likely to retest the moving averages before another upward leg.
#Binance #crypto #trading #CryptoAnalysis #Write2Earn
$PROM
{spot}(PROMUSDT)
The provided 15-minute price chart for $PROM USDT shows a strong bullish trend currently testing recent resistance levels.
Key Technical Indicators & Summary$PROM
* Current Price: 5.964 USDT (+17.19% in 24h).
* Moving Averages (MA): The price is trading above MA(7) at 5.899, MA(25) at 5.845, and MA(99) at 5.550, showing short-term to medium-term bullish alignment.
* Supertrend (10,3): Currently at 5.770, giving a strong Buy signal and serving as a trailing support line.
* Key Levels:
* 24h High / Immediate Resistance: 5.986 USDT.
* Immediate Support: 5.899 USDT (MA 7) and 5.845 USDT (MA 25).
* Strong Support: 5.770 USDT (Supertrend).
* Volume: Spike in trading volume coincides with the upward price push toward the 24h high.
Short-Term Outlook
* Bullish Breakout Potential: A clean break and 15m candle close above 5.986 could open the door for testing the 6.037+ region.
* Pullback Scenario: If resistance holds, a minor pull-back toward the 5.850 – 5.900 range is likely to retest the moving averages before another upward leg.
#Binance #crypto #trading #CryptoAnalysis #Write2Earn
$PROM
21
1
28
·
--
Bullish
See translation
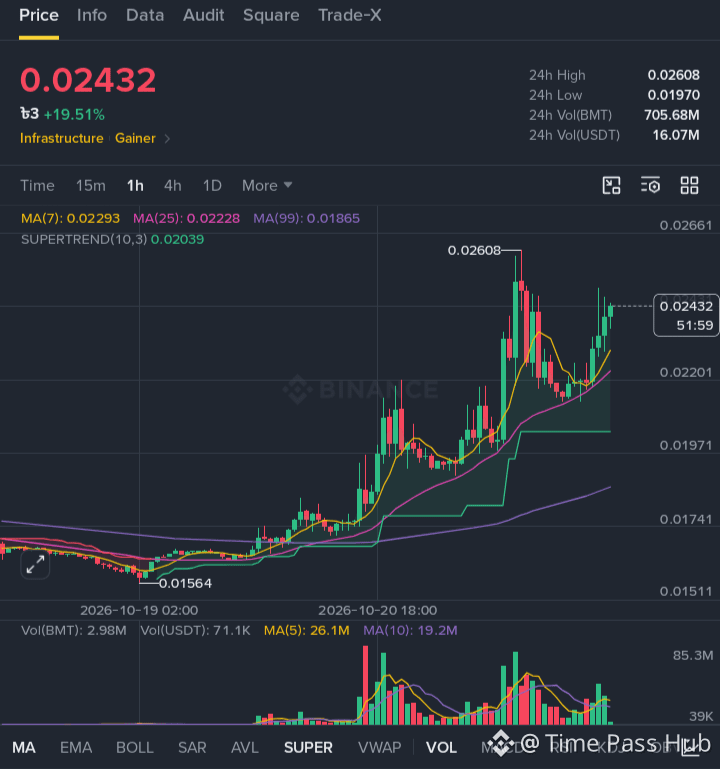
$BMT This 1-hour chart displays a strong bullish trend with recent consolidation, showing potential for retesting recent high levels if key support holds.$BMT
Key Technical Observations
* Current Price & Trend: Trading at 0.02428 (+19.25%). The price is well above all major Moving Averages (\text{MA}(7) = 0.02292, \text{MA}(25) = 0.02228, \text{MA}(99) = 0.01865), indicating a clear short-to-medium term uptrend.
* Supertrend Indicator: The Supertrend (10,3) is bullish at 0.02039 (green line below price), signaling strong underlying buying pressure.
* Resistance Levels:
* 0.02608: The recent local peak. A breakout above this level confirms continuation toward higher levels.
* Support Levels:
* 0.02292 – 0.02228: Immediate dynamic support provided by the MA(7) and MA(25) lines.
* 0.02039: Major trend reversal support marked by the Supertrend level.
* Volume Analysis: High volume spikes accompanied the initial rally toward 0.02608, while recent volume remains steady, supporting the current bounce off MA(25).
Potential Scenarios
* Bullish Continuation: Holding above 0.02290 could allow buyers to challenge resistance at 0.02608.
* Correction/Pullback: Failing to maintain current levels could pull the price back toward the 0.02228 – 0.02039 support zone before finding fresh demand. #Binance #crypto #Write2Earn #CryptoAnalysis #trading
$BMT
{spot}(BMTUSDT)
$BMT This 1-hour chart displays a strong bullish trend with recent consolidation, showing potential for retesting recent high levels if key support holds.$BMT
Key Technical Observations
* Current Price & Trend: Trading at 0.02428 (+19.25%). The price is well above all major Moving Averages (\text{MA}(7) = 0.02292, \text{MA}(25) = 0.02228, \text{MA}(99) = 0.01865), indicating a clear short-to-medium term uptrend.
* Supertrend Indicator: The Supertrend (10,3) is bullish at 0.02039 (green line below price), signaling strong underlying buying pressure.
* Resistance Levels:
* 0.02608: The recent local peak. A breakout above this level confirms continuation toward higher levels.
* Support Levels:
* 0.02292 – 0.02228: Immediate dynamic support provided by the MA(7) and MA(25) lines.
* 0.02039: Major trend reversal support marked by the Supertrend level.
* Volume Analysis: High volume spikes accompanied the initial rally toward 0.02608, while recent volume remains steady, supporting the current bounce off MA(25).
Potential Scenarios
* Bullish Continuation: Holding above 0.02290 could allow buyers to challenge resistance at 0.02608.
* Correction/Pullback: Failing to maintain current levels could pull the price back toward the 0.02228 – 0.02039 support zone before finding fresh demand. #Binance #crypto #Write2Earn #CryptoAnalysis #trading
$BMT
23
1
43
·
--
Bullish
See translation
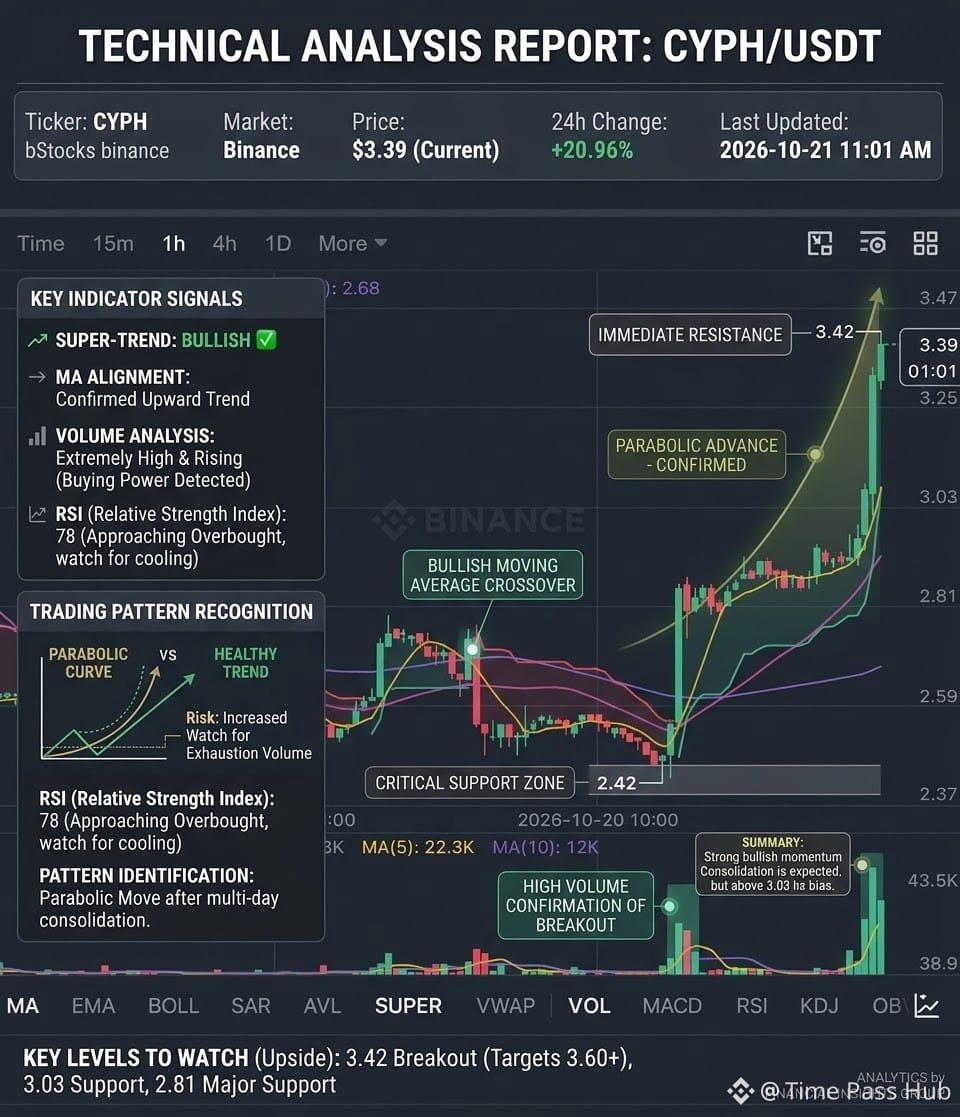
Here is the technical analysis report generated based on the $CYPHB /USDT chart you provided.
This analysis highlights several key aspects of the recent market activity:$CYPHB
Indicator Signals: The Super-Trend is confirmed Bullish, and the price action shows a confirmed upward trend with a Bullish Moving Average crossover.
Volume & RSI: There is a high-volume confirmation of the breakout, with a parabolic advance confirmed. However, the RSI is currently around 78, indicating the asset is approaching overbought territory and may need a cooling-off period.
Key Support & Resistance: The report identifies 3.42 as immediate resistance. Major support lies at 2.81 and 3.03.
#Binance #MarketAnalysis #crypto #Write2Earn #TrendingTopic $CYPHB
{spot}(CYPHBUSDT)
Here is the technical analysis report generated based on the $CYPHB /USDT chart you provided.
This analysis highlights several key aspects of the recent market activity:$CYPHB
Indicator Signals: The Super-Trend is confirmed Bullish, and the price action shows a confirmed upward trend with a Bullish Moving Average crossover.
Volume & RSI: There is a high-volume confirmation of the breakout, with a parabolic advance confirmed. However, the RSI is currently around 78, indicating the asset is approaching overbought territory and may need a cooling-off period.
Key Support & Resistance: The report identifies 3.42 as immediate resistance. Major support lies at 2.81 and 3.03.
#Binance #MarketAnalysis #crypto #Write2Earn #TrendingTopic $CYPHB
31
2
79
·
--
Bullish
See translation
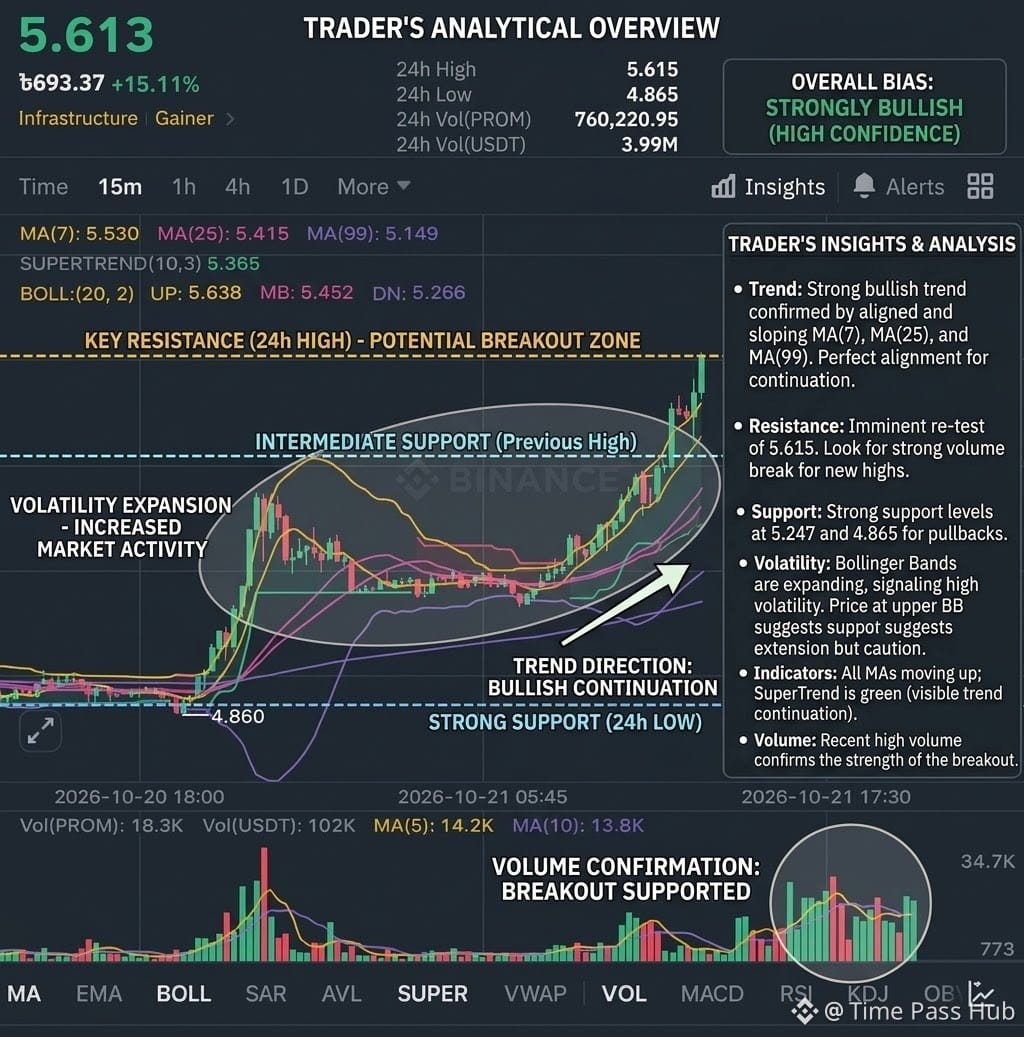
Market Sentiment $PROM
The overall bias is Strongly Bullish with high confidence, supported by significant buying volume and technical alignment.
Key Price Levels $PROM
Key Resistance (24h High): 5.615. This is a potential breakout zone. A strong volume break here could lead to new highs.
Intermediate Support: Found around previous highs.
Strong Support (24h Low): 4.860. This is a critical level to watch in case of a pullback.
Technical Indicators
Trend: A strong bullish continuation is confirmed. The Moving Averages (MA(7), MA(25), and MA(99)) are perfectly aligned and sloping upward, indicating long-term upward momentum.
SuperTrend: The indicator remains green, further confirming the visible trend continuation.
Volatility: The Bollinger Bands (BOLL) are expanding, indicating a volatility spike and increased market activity. While the price is riding the upper band, suggesting strong support, it also implies a moment for caution as it may be extended.
Volume: The breakout is supported by volume confirmation. Recent high trading volume validates the current price strength.
#Binance #analysis #TradingSignals #crypto #CryptoNews $PROM
{spot}(PROMUSDT)
Market Sentiment $PROM
The overall bias is Strongly Bullish with high confidence, supported by significant buying volume and technical alignment.
Key Price Levels $PROM
Key Resistance (24h High): 5.615. This is a potential breakout zone. A strong volume break here could lead to new highs.
Intermediate Support: Found around previous highs.
Strong Support (24h Low): 4.860. This is a critical level to watch in case of a pullback.
Technical Indicators
Trend: A strong bullish continuation is confirmed. The Moving Averages (MA(7), MA(25), and MA(99)) are perfectly aligned and sloping upward, indicating long-term upward momentum.
SuperTrend: The indicator remains green, further confirming the visible trend continuation.
Volatility: The Bollinger Bands (BOLL) are expanding, indicating a volatility spike and increased market activity. While the price is riding the upper band, suggesting strong support, it also implies a moment for caution as it may be extended.
Volume: The breakout is supported by volume confirmation. Recent high trading volume validates the current price strength.
#Binance #analysis #TradingSignals #crypto #CryptoNews $PROM
68
·
--
Bullish
See translation
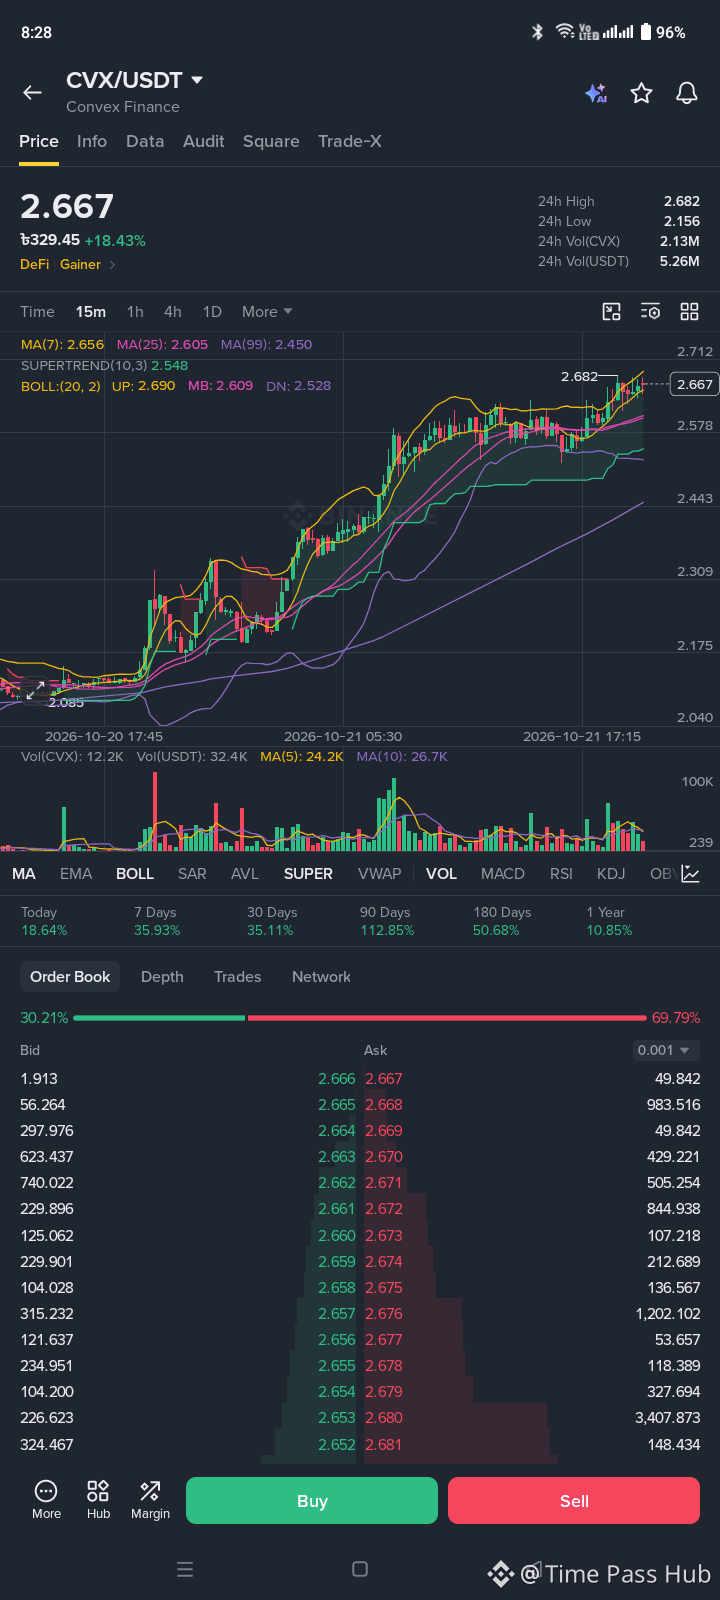
🚀 $CVX Strong Bullish Momentum! Is a Breakout Imminent?
$CVX is showing strong upward momentum on the 15m timeframe, currently trading around $2.670 (+19.30% gain)! 📈
Key Technical Observations:
🎯 24h High: $2.682 (Immediate Resistance)
🛡️ Supertrend & MB Support: Sitting around $2.54 – $2.60
📊 Price is hugging the upper Bollinger Band with standard moving averages (MA7 > MA25 > MA99) pointing upward.
If bulls push above $2.682 with healthy volume, we could see another impulse wave. Are you holding or taking profits here
#CryptoAnalysis #BinanceSquare #trading #Binance #Write2Earn
$CVX
{spot}(CVXUSDT)
🚀 $CVX Strong Bullish Momentum! Is a Breakout Imminent?
$CVX is showing strong upward momentum on the 15m timeframe, currently trading around $2.670 (+19.30% gain)! 📈
Key Technical Observations:
🎯 24h High: $2.682 (Immediate Resistance)
🛡️ Supertrend & MB Support: Sitting around $2.54 – $2.60
📊 Price is hugging the upper Bollinger Band with standard moving averages (MA7 > MA25 > MA99) pointing upward.
If bulls push above $2.682 with healthy volume, we could see another impulse wave. Are you holding or taking profits here
#CryptoAnalysis #BinanceSquare #trading #Binance #Write2Earn
$CVX
52
1
52
·
--
Bullish
See translation
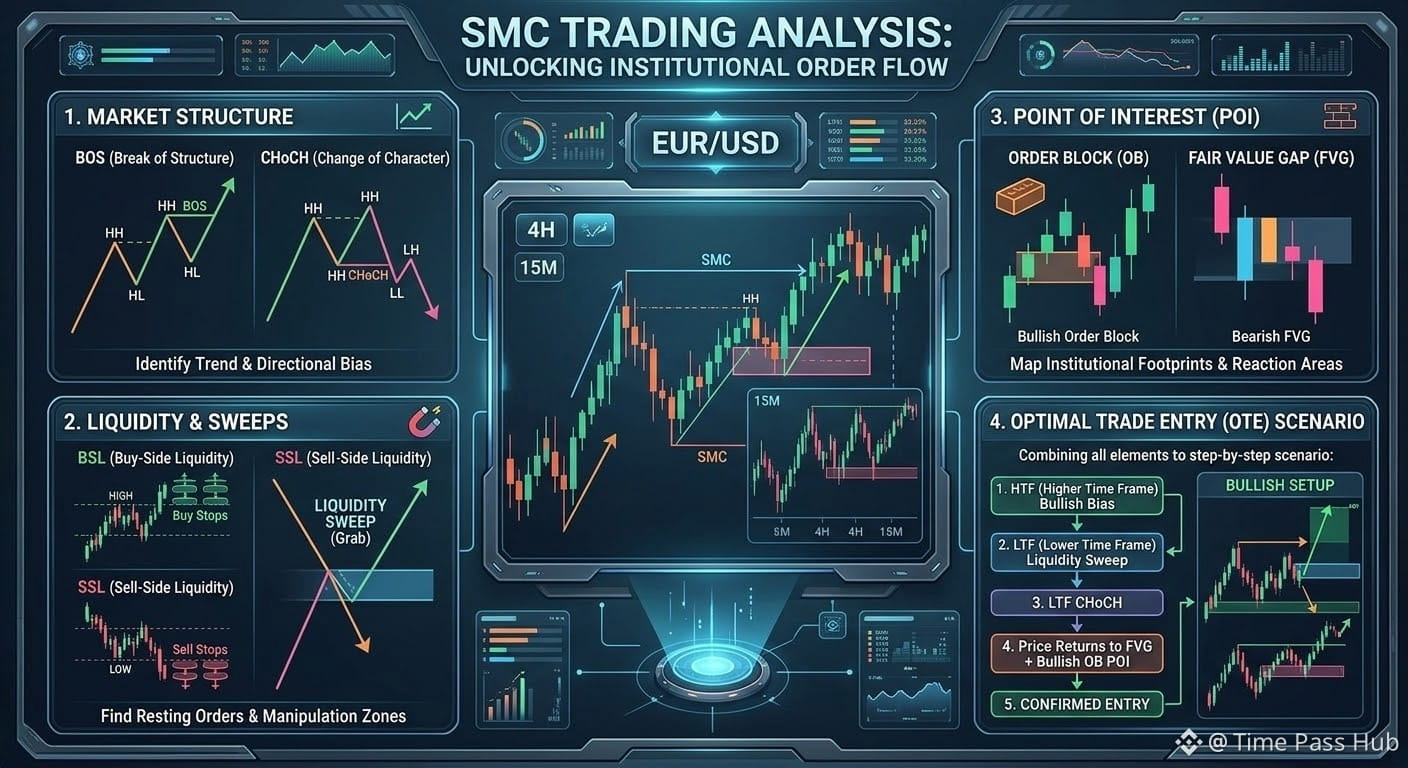
$NEAR The NEAR/USDT (15m) chart shows a strong bullish breakout reaching a high of 5.280, but price action is currently in a minor pull-back/consolidation phase around 5.239.
SMC (Smart Money Concepts) Breakdown
* Market Structure & Trend:$NEAR
* Bullish Shift / BOS (Break of Structure): A massive bullish impulse broke previous lower highs and resistance around the $4.994 – $5.100 zone, creating a clear Bullish BOS.
* Current Phase: The market is extended after testing the local top at 5.280 (24h High).
* Liquidity Analysis:
* Buy-side Liquidity (BSL): Resting above 5.280. A break and hold above this level targets further upside.
* Sell-side Liquidity (SSL): Located below the recent swing lows around 5.080 – 5.100 and deeper down at 4.994.
* Order Blocks (OB) & Fair Value Gaps (FVG):
* Premium Zone: Current price (5.239) is in the Premium area of the recent 15m leg. Entering long immediately carries a lower risk-to-reward ratio.
* Discount Demand Zone (Key OB / FVG): The $5.080 – $5.125 range acts as a prime Bullish Demand Zone (aligned with MA(25) and the Supertrend baseline at 5.083).
Trade Setup Scenarios
1. Bullish Retracement Entry (High Probability)
* Entry Zone: Wait for a pullback into the $5.080 – $5.120 demand zone / FVG.
* Confirmation: Look for lower timeframe (1m/5m) CHoCH (Change of Character) inside the demand zone.
* Stop-Loss (SL): Below $4.990 (invalidates the bullish structure).
* Take-Profit Targets (TP):
* TP1: $5.280 (24h High / Liquidity Sweep)
* TP2: $5.329 – $5.400
2. Aggressive Momentum Entry (Breakout)
* Entry: Only after a 15-minute body closure above $5.280 with strong volume.
* Stop-Loss (SL): Below $5.180.
* Target: $5.350 – $5.450.
> Risk Note: Price is currently trading in a short-term premium zone after an 11%+ surge. Chasing long positions at the top can lead to drawdowns if a liquidity sweep/pullback occurs toward $5.100 first. Always manage risk with proper position sizing.
#Binance #MarketAnalysis #crypto #trading #Write2Earn
$NEAR
{spot}(NEARUSDT)
$NEAR The NEAR/USDT (15m) chart shows a strong bullish breakout reaching a high of 5.280, but price action is currently in a minor pull-back/consolidation phase around 5.239.
SMC (Smart Money Concepts) Breakdown
* Market Structure & Trend:$NEAR
* Bullish Shift / BOS (Break of Structure): A massive bullish impulse broke previous lower highs and resistance around the $4.994 – $5.100 zone, creating a clear Bullish BOS.
* Current Phase: The market is extended after testing the local top at 5.280 (24h High).
* Liquidity Analysis:
* Buy-side Liquidity (BSL): Resting above 5.280. A break and hold above this level targets further upside.
* Sell-side Liquidity (SSL): Located below the recent swing lows around 5.080 – 5.100 and deeper down at 4.994.
* Order Blocks (OB) & Fair Value Gaps (FVG):
* Premium Zone: Current price (5.239) is in the Premium area of the recent 15m leg. Entering long immediately carries a lower risk-to-reward ratio.
* Discount Demand Zone (Key OB / FVG): The $5.080 – $5.125 range acts as a prime Bullish Demand Zone (aligned with MA(25) and the Supertrend baseline at 5.083).
Trade Setup Scenarios
1. Bullish Retracement Entry (High Probability)
* Entry Zone: Wait for a pullback into the $5.080 – $5.120 demand zone / FVG.
* Confirmation: Look for lower timeframe (1m/5m) CHoCH (Change of Character) inside the demand zone.
* Stop-Loss (SL): Below $4.990 (invalidates the bullish structure).
* Take-Profit Targets (TP):
* TP1: $5.280 (24h High / Liquidity Sweep)
* TP2: $5.329 – $5.400
2. Aggressive Momentum Entry (Breakout)
* Entry: Only after a 15-minute body closure above $5.280 with strong volume.
* Stop-Loss (SL): Below $5.180.
* Target: $5.350 – $5.450.
> Risk Note: Price is currently trading in a short-term premium zone after an 11%+ surge. Chasing long positions at the top can lead to drawdowns if a liquidity sweep/pullback occurs toward $5.100 first. Always manage risk with proper position sizing.
#Binance #MarketAnalysis #crypto #trading #Write2Earn
$NEAR
64
·
--
Bullish
See translation
🚨 $CVX Bulls Holding the Line Near Local Highs! 🚨
$CVX is currently trading at $2.582 after printing a strong 24h gain of +22.78%! Price recently topped out at $2.637 and is currently consolidating above key short-term moving averages.
📈 Quick Chart Breakdown (15m):
Immediate Resistance: $2.637
Primary Support Zone: $2.540 – $2.580
24h Volume: 9.46M CVX / 22.80M USDT
🎯 Market Sentiment: Bullish consolidation. Keep an eye on $2.637 breakout or a potential healthy retest near support before the next move.
#crypto #BinanceSquare #Binance #TradingSignals #analysis
$CVX
{spot}(CVXUSDT)
🚨 $CVX Bulls Holding the Line Near Local Highs! 🚨
$CVX is currently trading at $2.582 after printing a strong 24h gain of +22.78%! Price recently topped out at $2.637 and is currently consolidating above key short-term moving averages.
📈 Quick Chart Breakdown (15m):
Immediate Resistance: $2.637
Primary Support Zone: $2.540 – $2.580
24h Volume: 9.46M CVX / 22.80M USDT
🎯 Market Sentiment: Bullish consolidation. Keep an eye on $2.637 breakout or a potential healthy retest near support before the next move.
#crypto #BinanceSquare #Binance #TradingSignals #analysis
$CVX

48
1
48
See translation
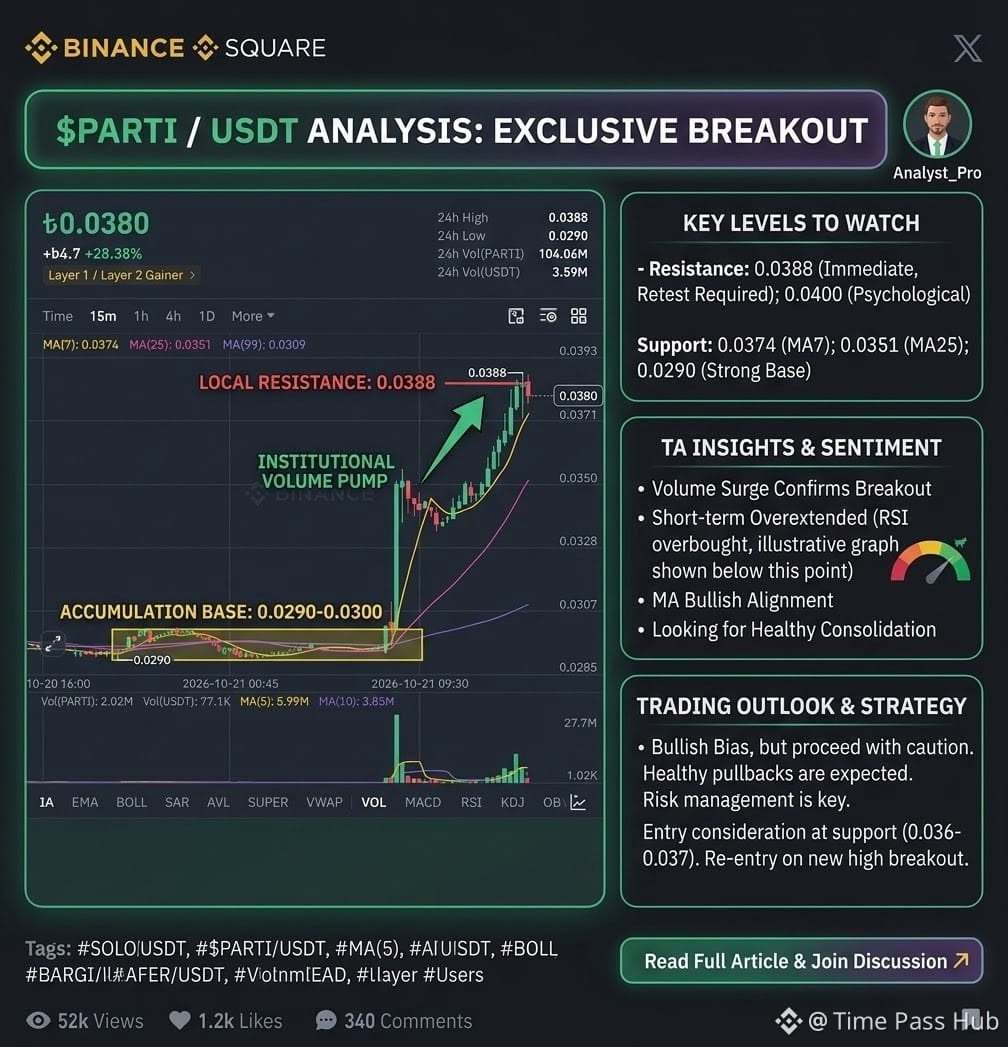
🚀 $PARTI USDT Explosive Breakout! +28%+ Gain! 🔥
$PARTI just made a massive vertical push from the 0.0290 low up to a local high of 0.0388!
📊 Key Technical Levels:
Current Price: ~0.0380
Immediate Resistance: 0.0388
Key Support (MA 7): ~0.0374
Major Support (MA 25): ~0.0351
📈 Analysis:
The massive surge in volume confirms strong buying momentum. While the short-term trend is heavily bullish, the RSI/KDJ indicators on lower timeframes show cooling off near resistance. A consolidation above 0.0370 could setup the next leg up towards 0.0400+.
⚠️ Strategy: Watch for a healthy retest or confirmation of support before chasing long positions. Maintain proper risk management!
What’s your take? Holding or taking profits here? 👇#Binance #CryptoAnalysis #Trading #BinanceSquare #Layer1
$PARTI
{spot}(PARTIUSDT)
🚀 $PARTI USDT Explosive Breakout! +28%+ Gain! 🔥
$PARTI just made a massive vertical push from the 0.0290 low up to a local high of 0.0388!
📊 Key Technical Levels:
Current Price: ~0.0380
Immediate Resistance: 0.0388
Key Support (MA 7): ~0.0374
Major Support (MA 25): ~0.0351
📈 Analysis:
The massive surge in volume confirms strong buying momentum. While the short-term trend is heavily bullish, the RSI/KDJ indicators on lower timeframes show cooling off near resistance. A consolidation above 0.0370 could setup the next leg up towards 0.0400+.
⚠️ Strategy: Watch for a healthy retest or confirmation of support before chasing long positions. Maintain proper risk management!
What’s your take? Holding or taking profits here? 👇#Binance #CryptoAnalysis #Trading #BinanceSquare #Layer1
$PARTI
87
·
--
Bullish
See translation
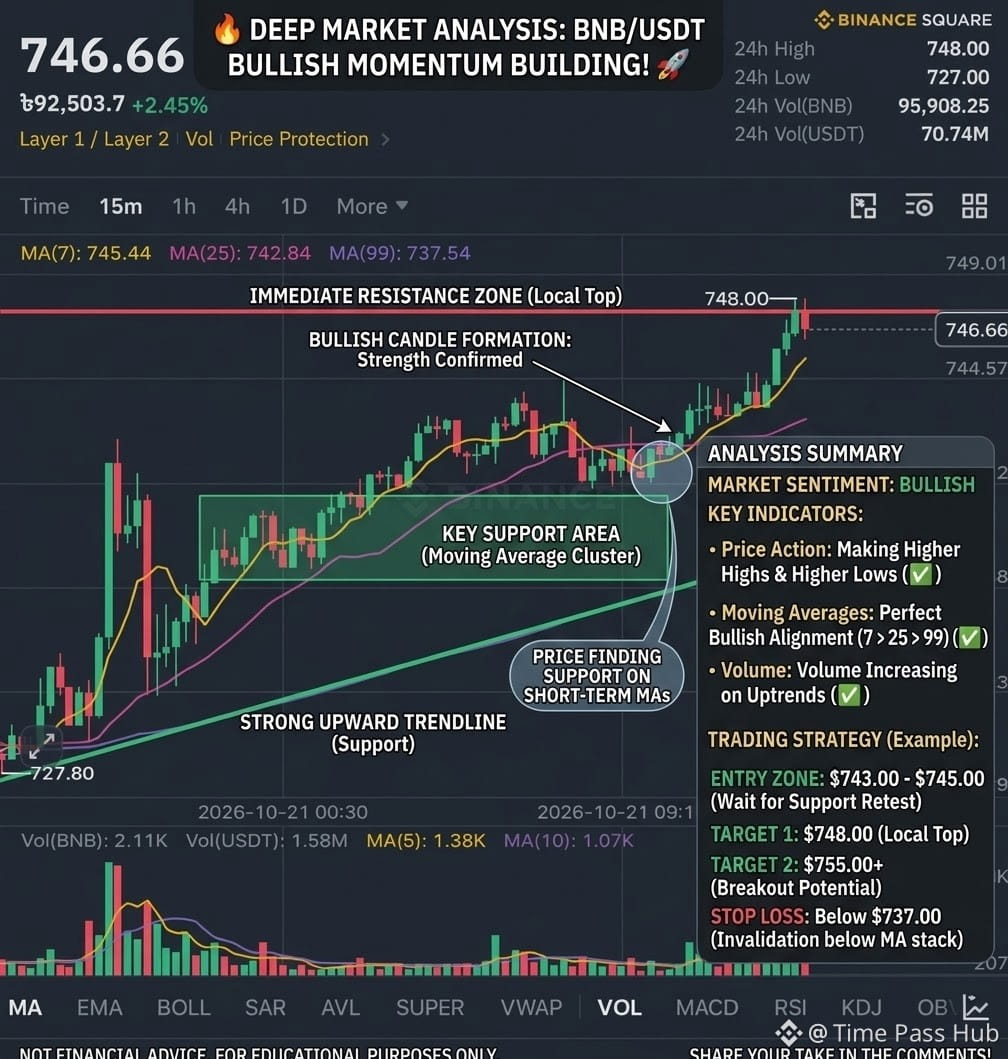
🚀 $BNB Bullish Momentum Building! Short-Term Analysis 📊
$BNB is showing strong upward momentum on the 15m chart, recently touching a 24h high of $748.00 before a slight pullback to around $746.66.
💡 Key Technical Highlights:
* Moving Averages: Price is holding firmly above the MA(7) ($745.44) and MA(25) ($742.84), confirming short-term bullish control.
* Support & Resistance:
* 🎯 Immediate Resistance: $748.00 (Local Top)
* 🛡️ Key Support: $742.00 – $745.00 zone
* Volume: Decent buying volume surge pushing prices higher from the $727.80 low.
🎯 Trading Setup Idea:
* Entry Zone: $743.00 – $746.00
* Target 1: $748.00
* Target 2: $755.00
* Stop Loss: $739.00
💬 Are you going Long on BNB here or waiting for a dip to retest support? Let us know below! 👇
#bnb #cryptotrading #BinanceSquare #TechnicalAnalysis #TradingSignal
$BNB
{spot}(BNBUSDT)
🚀 $BNB Bullish Momentum Building! Short-Term Analysis 📊
$BNB is showing strong upward momentum on the 15m chart, recently touching a 24h high of $748.00 before a slight pullback to around $746.66.
💡 Key Technical Highlights:
* Moving Averages: Price is holding firmly above the MA(7) ($745.44) and MA(25) ($742.84), confirming short-term bullish control.
* Support & Resistance:
* 🎯 Immediate Resistance: $748.00 (Local Top)
* 🛡️ Key Support: $742.00 – $745.00 zone
* Volume: Decent buying volume surge pushing prices higher from the $727.80 low.
🎯 Trading Setup Idea:
* Entry Zone: $743.00 – $746.00
* Target 1: $748.00
* Target 2: $755.00
* Stop Loss: $739.00
💬 Are you going Long on BNB here or waiting for a dip to retest support? Let us know below! 👇
#bnb #cryptotrading #BinanceSquare #TechnicalAnalysis #TradingSignal
$BNB
31
1
80
·
--
Bullish
See translation
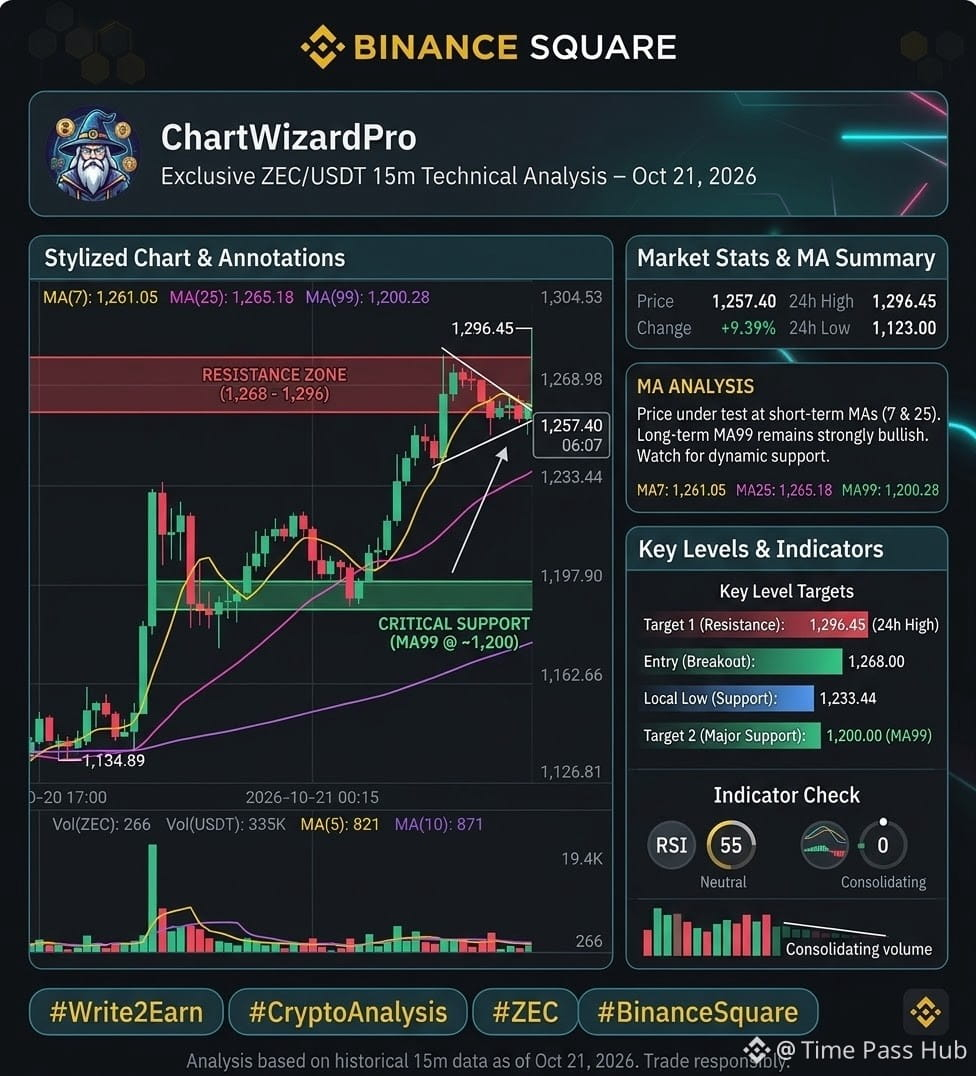
🚨 $ZEC Technical Update: Pullback or Continuation? 🚨
$ZEC recently surged to a 24h High of 1,296.45 USDT, showing a solid +9.39% gain! 📈
Looking at the 15m chart, the price is currently consolidating around 1,257.40 USDT:
🔹 MA(7): 1,261.05
🔹 MA(25): 1,265.18
🔹 MA(99) Support: 1,200.28
The short-term MAs (7 & 25) are flattening near current price levels, while the MA(99) around 1,200 USDT provides major underlying support.
📊 Key Levels to Watch:
🎯 Resistance: 1,265 – 1,296 USDT
🛡️ Support: 1,233 – 1,200 USDT
Are you holding $ZEC or waiting for a breakout confirmation? Drop your strategy below! 👇
#zec #CryptoAnalysis #BinanceSquare #trading #crypto
{spot}(ZECUSDT)
🚨 $ZEC Technical Update: Pullback or Continuation? 🚨
$ZEC recently surged to a 24h High of 1,296.45 USDT, showing a solid +9.39% gain! 📈
Looking at the 15m chart, the price is currently consolidating around 1,257.40 USDT:
🔹 MA(7): 1,261.05
🔹 MA(25): 1,265.18
🔹 MA(99) Support: 1,200.28
The short-term MAs (7 & 25) are flattening near current price levels, while the MA(99) around 1,200 USDT provides major underlying support.
📊 Key Levels to Watch:
🎯 Resistance: 1,265 – 1,296 USDT
🛡️ Support: 1,233 – 1,200 USDT
Are you holding $ZEC or waiting for a breakout confirmation? Drop your strategy below! 👇
#zec #CryptoAnalysis #BinanceSquare #trading #crypto
23
49
·
--
Bullish
See translation
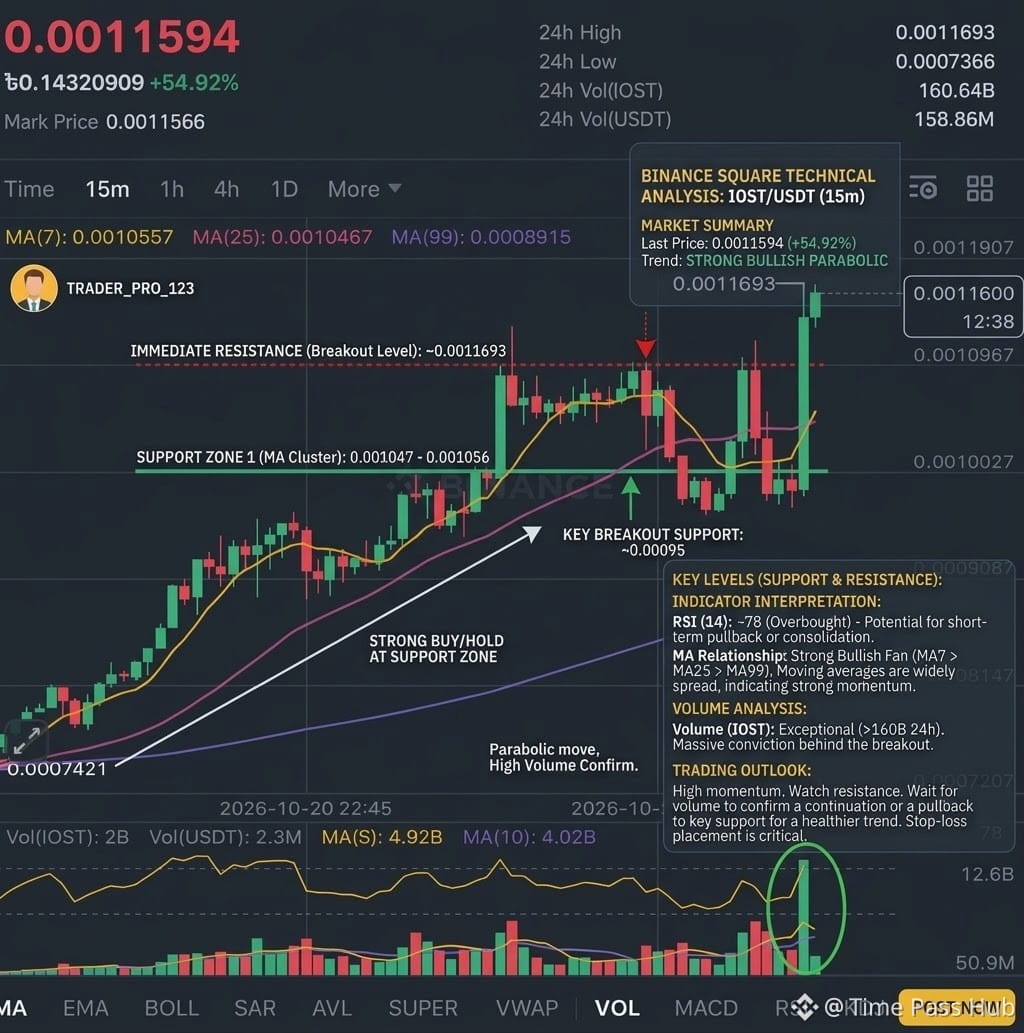
🚀 $IOST Bullish Momentum in Full Effect! (+54.92%)
$IOST has posted a massive bullish spike, pushing straight up to a local high of 0.0011693 with an impressive +54.92% gain in 24 hours! 📈🔥
📊 Technical Key Highlights (15m Chart):
* Current Price: ~0.0011594 USDT
* 24h High / Low: 0.0011693 / 0.0007366
* Volume Surge: 24h Vol (IOST) reached over 160.64B with a massive buyer volume spike confirming high market interest.
* Moving Averages:
* MA(7) [Yellow]: 0.0010557 — Short-term trend remains strongly bullish above this support line.
* MA(25) [Purple]: 0.0010467
* MA(99) [Blue]: 0.0008915 — Clear breakout far above long-term resistance.
🎯 Market Scenario & Setup:
* 🟢 Bullish Continuation: A solid close above 0.0011600 could push price discovery toward next target zones (0.001200+).
* 🟡 Pullback / Retest Zone: Look out for potential short-term pullbacks toward the 0.001050 – 0.001080 zone (MA7/MA25 level) for healthy consolidation before another leg up.
💬 What's your play on $IOST? Are you holding, taking profit, or looking for an entry on the dip? Share your thoughts in the comments! 👇
#BinanceSquare #cryptotrading #Write2Earn #TechnicalAnalysis #TradingSignal
$IOST
{spot}(IOSTUSDT)
🚀 $IOST Bullish Momentum in Full Effect! (+54.92%)
$IOST has posted a massive bullish spike, pushing straight up to a local high of 0.0011693 with an impressive +54.92% gain in 24 hours! 📈🔥
📊 Technical Key Highlights (15m Chart):
* Current Price: ~0.0011594 USDT
* 24h High / Low: 0.0011693 / 0.0007366
* Volume Surge: 24h Vol (IOST) reached over 160.64B with a massive buyer volume spike confirming high market interest.
* Moving Averages:
* MA(7) [Yellow]: 0.0010557 — Short-term trend remains strongly bullish above this support line.
* MA(25) [Purple]: 0.0010467
* MA(99) [Blue]: 0.0008915 — Clear breakout far above long-term resistance.
🎯 Market Scenario & Setup:
* 🟢 Bullish Continuation: A solid close above 0.0011600 could push price discovery toward next target zones (0.001200+).
* 🟡 Pullback / Retest Zone: Look out for potential short-term pullbacks toward the 0.001050 – 0.001080 zone (MA7/MA25 level) for healthy consolidation before another leg up.
💬 What's your play on $IOST ? Are you holding, taking profit, or looking for an entry on the dip? Share your thoughts in the comments! 👇
#BinanceSquare #cryptotrading #Write2Earn #TechnicalAnalysis #TradingSignal
$IOST
22
43
·
--
Bullish
See translation
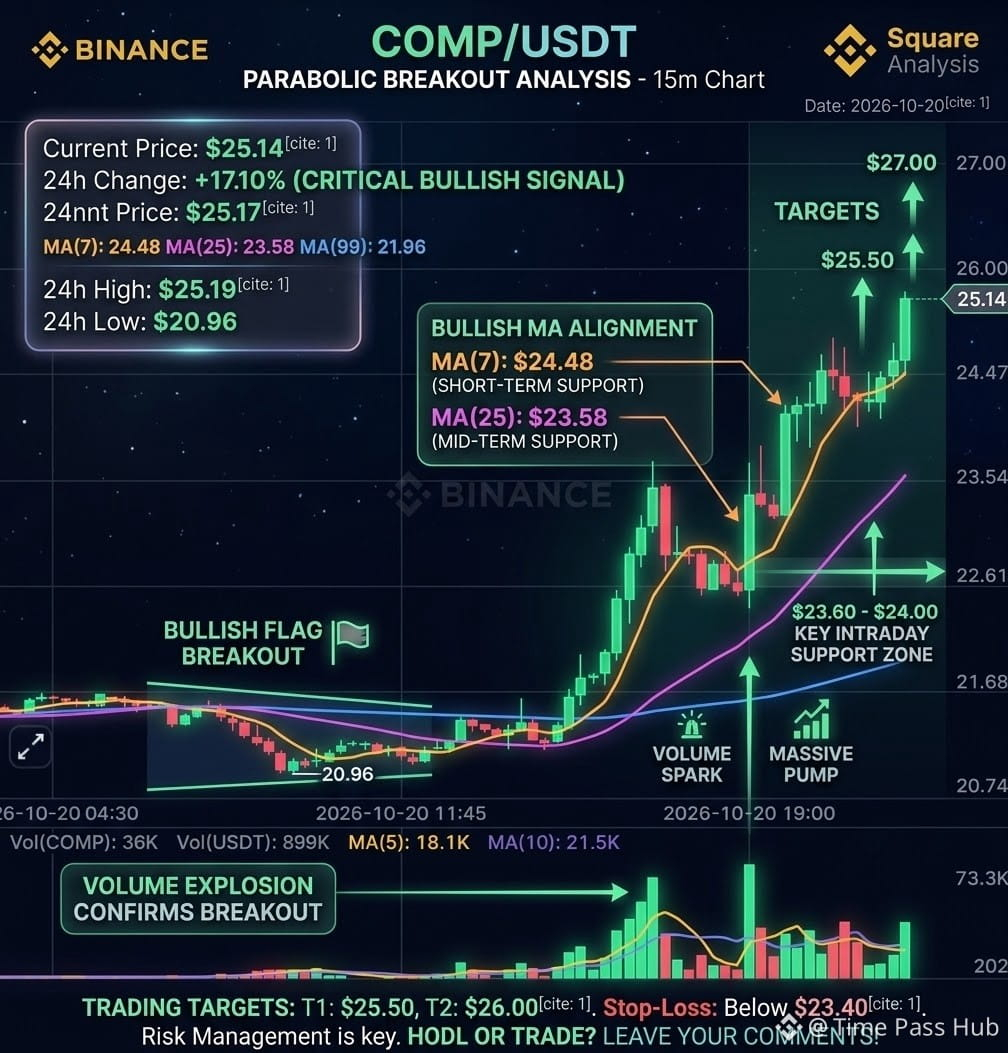
🚀 $COMP /USDT Massive Breakout Alert! 🔥
Bulls are taking full control on $COMP! The 15m chart shows a strong upward rally, pumping +17.10% and breaking out past key resistance levels to reach a high of $25.19.
📊 Key Technical Highlights:
Current Price: $25.14
Moving Averages (MA): MA(7) at $24.48 and MA(25) at $23.58 are trending sharply upward, indicating strong short-term bullish momentum.
Volume Spike: Significant green buying volume confirms strong market demand during this push.
Key Support Level: Around $23.50 – $24.00 (holding above this keeps the bullish trend intact).
💡 Market Outlook & Strategy:
$COMP is showing explosive momentum. Keep a close eye on the price action—if it consolidates above $25.00, we could see a continuation toward higher targets. However, watch out for minor pullbacks/retests near the $24.50 zone before entering.
Are you Holding or Trading right now? Let us know your targets below! 👇
#Binance #CryptoTrading #BinanceSquare #TechnicalAnalysis #CryptoNews
$COMP
{spot}(COMPUSDT)
🚀 $COMP /USDT Massive Breakout Alert! 🔥
Bulls are taking full control on $COMP ! The 15m chart shows a strong upward rally, pumping +17.10% and breaking out past key resistance levels to reach a high of $25.19.
📊 Key Technical Highlights:
Current Price: $25.14
Moving Averages (MA): MA(7) at $24.48 and MA(25) at $23.58 are trending sharply upward, indicating strong short-term bullish momentum.
Volume Spike: Significant green buying volume confirms strong market demand during this push.
Key Support Level: Around $23.50 – $24.00 (holding above this keeps the bullish trend intact).
💡 Market Outlook & Strategy:
$COMP is showing explosive momentum. Keep a close eye on the price action—if it consolidates above $25.00, we could see a continuation toward higher targets. However, watch out for minor pullbacks/retests near the $24.50 zone before entering.
Are you Holding or Trading right now? Let us know your targets below! 👇
#Binance #CryptoTrading #BinanceSquare #TechnicalAnalysis #CryptoNews
$COMP
61
76
·
--
Bullish
See translation
🔥 Green Candles Everywhere! Top Gainers Breakdown 🚀
Check out today’s top performers in the market:
1️⃣ $BMT : +25.76%
2️⃣ $IOST : +24.12%
3️⃣ $APR : +22.98%
Massive momentum across these tokens today! Are we seeing a continuous pump or a potential pullback coming next?
👇 Comment your prediction: Are you BULLISH 🐂 or BEARISH 🐻 on these right now?
#cryptotrading #Binance #CryptoNewss #TradingSignals #Write2Earn
{future}(APRUSDT)
🔥 Green Candles Everywhere! Top Gainers Breakdown 🚀
Check out today’s top performers in the market:
1️⃣ $BMT : +25.76%
2️⃣ $IOST : +24.12%
3️⃣ $APR : +22.98%
Massive momentum across these tokens today! Are we seeing a continuous pump or a potential pullback coming next?
👇 Comment your prediction: Are you BULLISH 🐂 or BEARISH 🐻 on these right now?
#cryptotrading #Binance #CryptoNewss #TradingSignals #Write2Earn

80
3
111
Log in to explore more content
Join global crypto users on Binance Square
⚡️ Get latest and useful information about crypto.
💬 Trusted by the world’s largest crypto exchange.
👍 Discover real insights from verified creators.
Email / Phone number