

Ade_Krypt
1.8k Posts

Ade_Krypt
Report
Block User
16 Following
2.2K+ Followers
4.2K+ Liked
Posts
All
Quotes
PINNED
·
--
See translation
$BTC Market Outlook
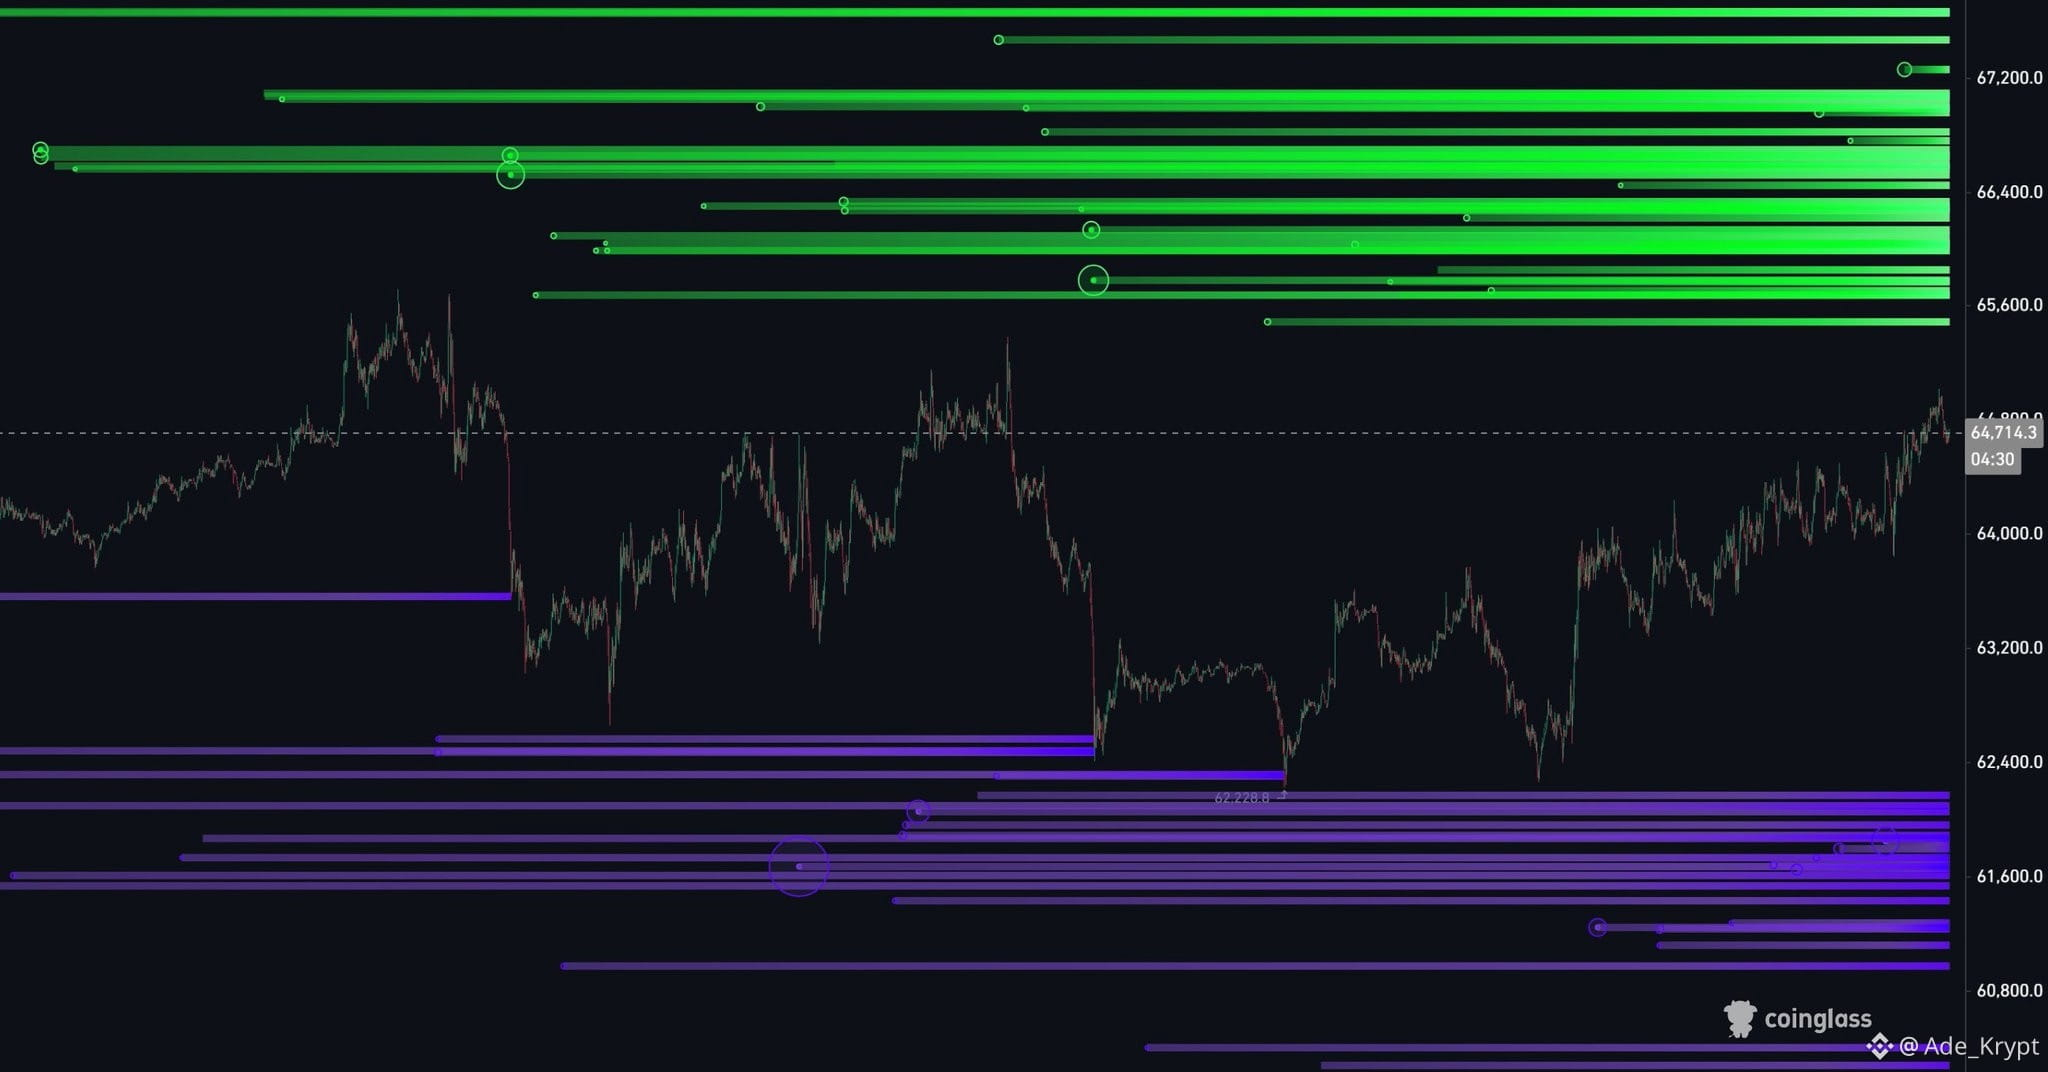
Bitcoin is steadily grinding higher and has now reached a key decision zone around 65k.
The last time price traded at this level, it was rejected and moved lower. I'm leaning toward a similar outcome unless $BTC can break and hold above the 65.2k–65.6k range.
A confirmed breakout above that resistance would invalidate the current bearish outlook, shift market structure to bullish, and likely trigger a wave of short liquidations. If that happens, BTC could rally toward the 67k–68k area over the coming days.
For now, I'm maintaining my short positions with clearly defined stop-loss levels above resistance. If price is rejected from this zone again, I expect increased volatility and a move toward 61.3k.
In short, Bitcoin is sitting at a major decision point. The next move will likely determine whether we see a drop to 61.3k or a breakout that pushes price into the 67k–68k mFVG zone.
#ChinaLaunchesBroadestTradeRetaliationOnUSFirms #ADPJulyPrivatePayrollsMissedExpectations
$BTC Market Outlook
Bitcoin is steadily grinding higher and has now reached a key decision zone around 65k.
The last time price traded at this level, it was rejected and moved lower. I'm leaning toward a similar outcome unless $BTC can break and hold above the 65.2k–65.6k range.
A confirmed breakout above that resistance would invalidate the current bearish outlook, shift market structure to bullish, and likely trigger a wave of short liquidations. If that happens, BTC could rally toward the 67k–68k area over the coming days.
For now, I'm maintaining my short positions with clearly defined stop-loss levels above resistance. If price is rejected from this zone again, I expect increased volatility and a move toward 61.3k.
In short, Bitcoin is sitting at a major decision point. The next move will likely determine whether we see a drop to 61.3k or a breakout that pushes price into the 67k–68k mFVG zone.
#ChinaLaunchesBroadestTradeRetaliationOnUSFirms #ADPJulyPrivatePayrollsMissedExpectations
Bitcoin is steadily grinding higher and has now reached a key decision zone around 65k.
The last time price traded at this level, it was rejected and moved lower. I'm leaning toward a similar outcome unless $BTC can break and hold above the 65.2k–65.6k range.
A confirmed breakout above that resistance would invalidate the current bearish outlook, shift market structure to bullish, and likely trigger a wave of short liquidations. If that happens, BTC could rally toward the 67k–68k area over the coming days.
For now, I'm maintaining my short positions with clearly defined stop-loss levels above resistance. If price is rejected from this zone again, I expect increased volatility and a move toward 61.3k.
In short, Bitcoin is sitting at a major decision point. The next move will likely determine whether we see a drop to 61.3k or a breakout that pushes price into the 67k–68k mFVG zone.
#ChinaLaunchesBroadestTradeRetaliationOnUSFirms #ADPJulyPrivatePayrollsMissedExpectations
24
1
149
434.7k
PINNED
·
--
Verified
See translation
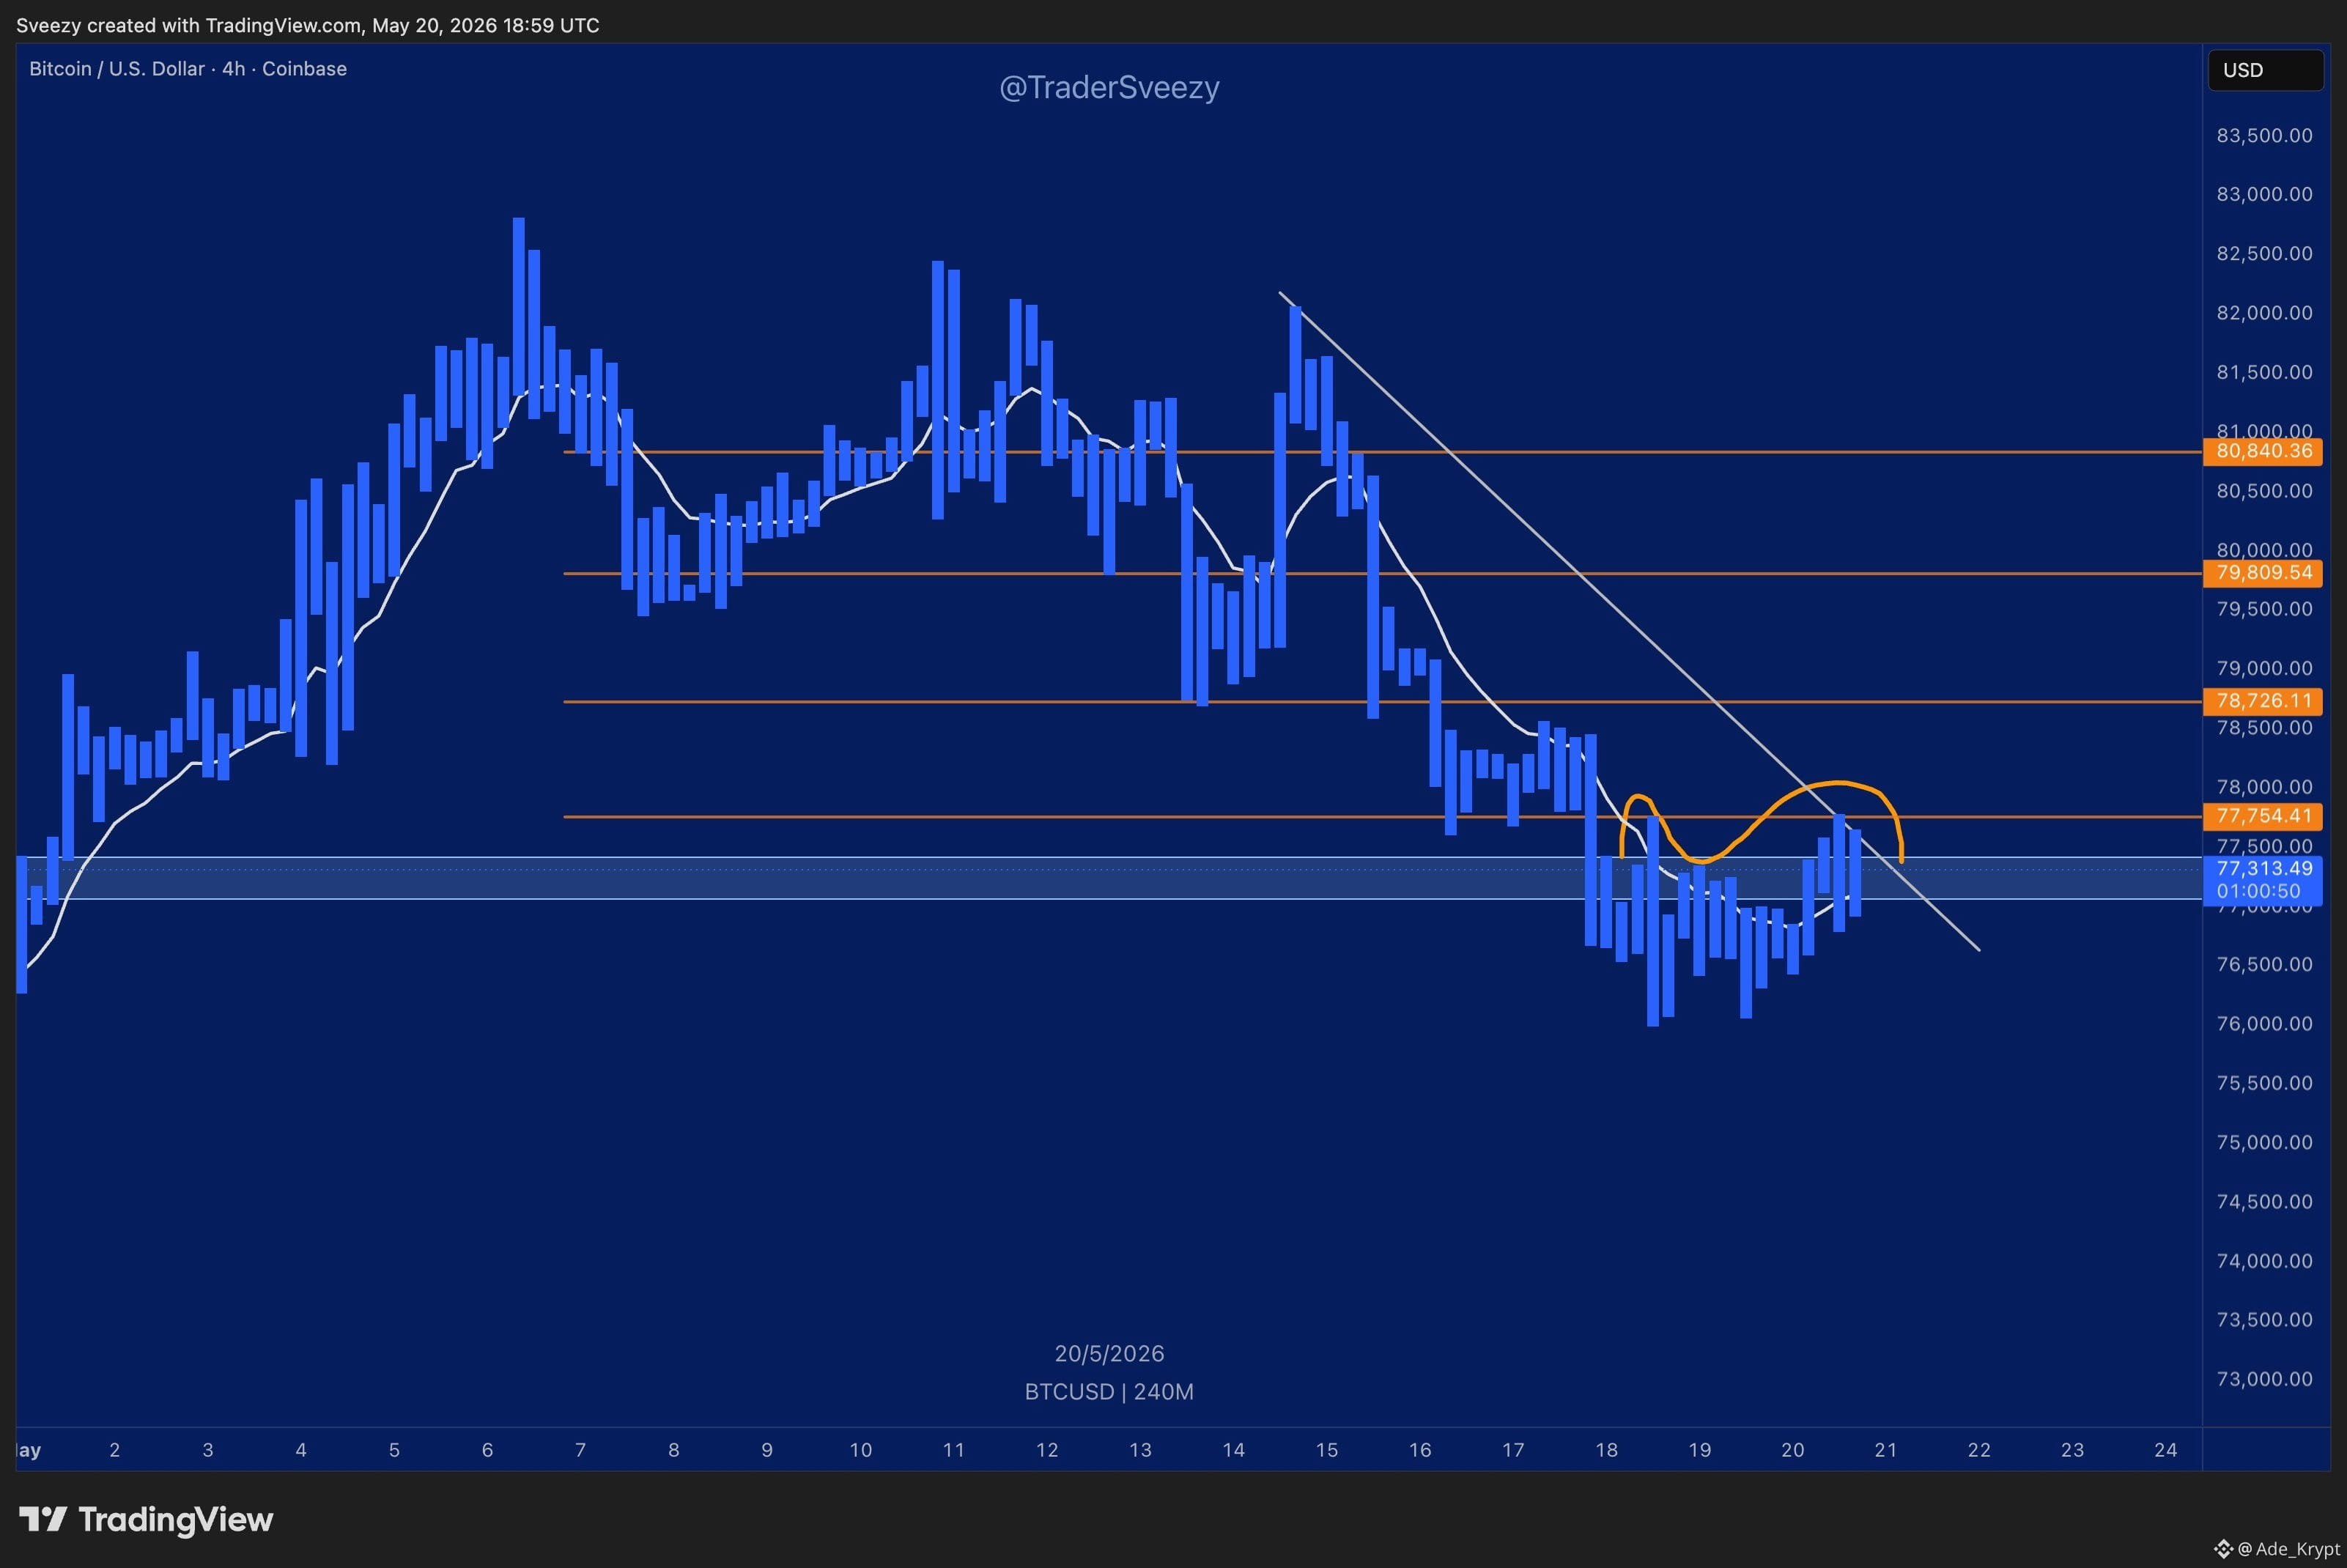
$BTC is still struggling around the $77.75k resistance zone.
At the moment, it’s limiting upside momentum, but what stands out is that sellers still haven’t managed to force a real pullback.
Price has been consolidating just below resistance for hours now.
Usually, when price keeps pressing under a resistance level without a strong rejection, it suggests momentum is building for a potential breakout.
If $BTC gets a clean move above $77.75k, there’s a good chance price accelerates into the liquidity sitting higher up.
For now, resistance remains intact, but with this kind of compression, it’s not a level I’d confidently short against.
#GoogleLaunchesGemini3.5Flash #Trump'sIranAttackDelayed
$BTC is still struggling around the $77.75k resistance zone.
At the moment, it’s limiting upside momentum, but what stands out is that sellers still haven’t managed to force a real pullback.
Price has been consolidating just below resistance for hours now.
Usually, when price keeps pressing under a resistance level without a strong rejection, it suggests momentum is building for a potential breakout.
If $BTC gets a clean move above $77.75k, there’s a good chance price accelerates into the liquidity sitting higher up.
For now, resistance remains intact, but with this kind of compression, it’s not a level I’d confidently short against.
#GoogleLaunchesGemini3.5Flash #Trump'sIranAttackDelayed
At the moment, it’s limiting upside momentum, but what stands out is that sellers still haven’t managed to force a real pullback.
Price has been consolidating just below resistance for hours now.
Usually, when price keeps pressing under a resistance level without a strong rejection, it suggests momentum is building for a potential breakout.
If $BTC gets a clean move above $77.75k, there’s a good chance price accelerates into the liquidity sitting higher up.
For now, resistance remains intact, but with this kind of compression, it’s not a level I’d confidently short against.
#GoogleLaunchesGemini3.5Flash #Trump'sIranAttackDelayed
41
19
193
746.1k
·
--
See translation
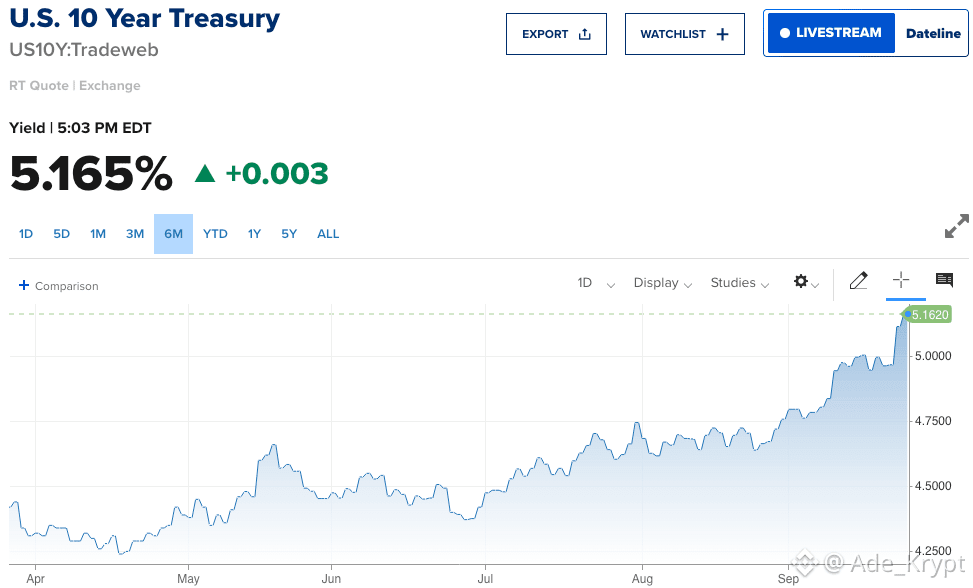
$BTC has absorbed billions in ETF inflows and still can’t break free from the $84K area.
That may be the most interesting part of the market right now.
US spot ETFs attracted roughly $2.65B over five sessions, while the 10Y Treasury yield climbed above 5.2%, its highest level since 2007.
$BTC has essentially been caught between both forces, hovering around $84K after briefly falling below $83K.
To me, this is a more meaningful test of ETF demand than watching inflows during a straightforward risk-on environment.
There’s clearly strong demand underneath BTC, but investors suddenly have a 5%+ alternative in Treasuries.
So far, neither side has taken control.
The bigger question is: how much ETF buying will BTC need before bond-market moves stop having such a strong influence?
#CircleMints500MUSDCOnSolana #BlackRockBuildsTokenizedPortfoliosForOndo
$BTC has absorbed billions in ETF inflows and still can’t break free from the $84K area.
That may be the most interesting part of the market right now.
US spot ETFs attracted roughly $2.65B over five sessions, while the 10Y Treasury yield climbed above 5.2%, its highest level since 2007.
$BTC has essentially been caught between both forces, hovering around $84K after briefly falling below $83K.
To me, this is a more meaningful test of ETF demand than watching inflows during a straightforward risk-on environment.
There’s clearly strong demand underneath BTC, but investors suddenly have a 5%+ alternative in Treasuries.
So far, neither side has taken control.
The bigger question is: how much ETF buying will BTC need before bond-market moves stop having such a strong influence?
#CircleMints500MUSDCOnSolana #BlackRockBuildsTokenizedPortfoliosForOndo
That may be the most interesting part of the market right now.
US spot ETFs attracted roughly $2.65B over five sessions, while the 10Y Treasury yield climbed above 5.2%, its highest level since 2007.
$BTC has essentially been caught between both forces, hovering around $84K after briefly falling below $83K.
To me, this is a more meaningful test of ETF demand than watching inflows during a straightforward risk-on environment.
There’s clearly strong demand underneath BTC, but investors suddenly have a 5%+ alternative in Treasuries.
So far, neither side has taken control.
The bigger question is: how much ETF buying will BTC need before bond-market moves stop having such a strong influence?
#CircleMints500MUSDCOnSolana #BlackRockBuildsTokenizedPortfoliosForOndo
BTC+0.35%
IEFETF+0.29%
19
5
57
75.1k
·
--
See translation
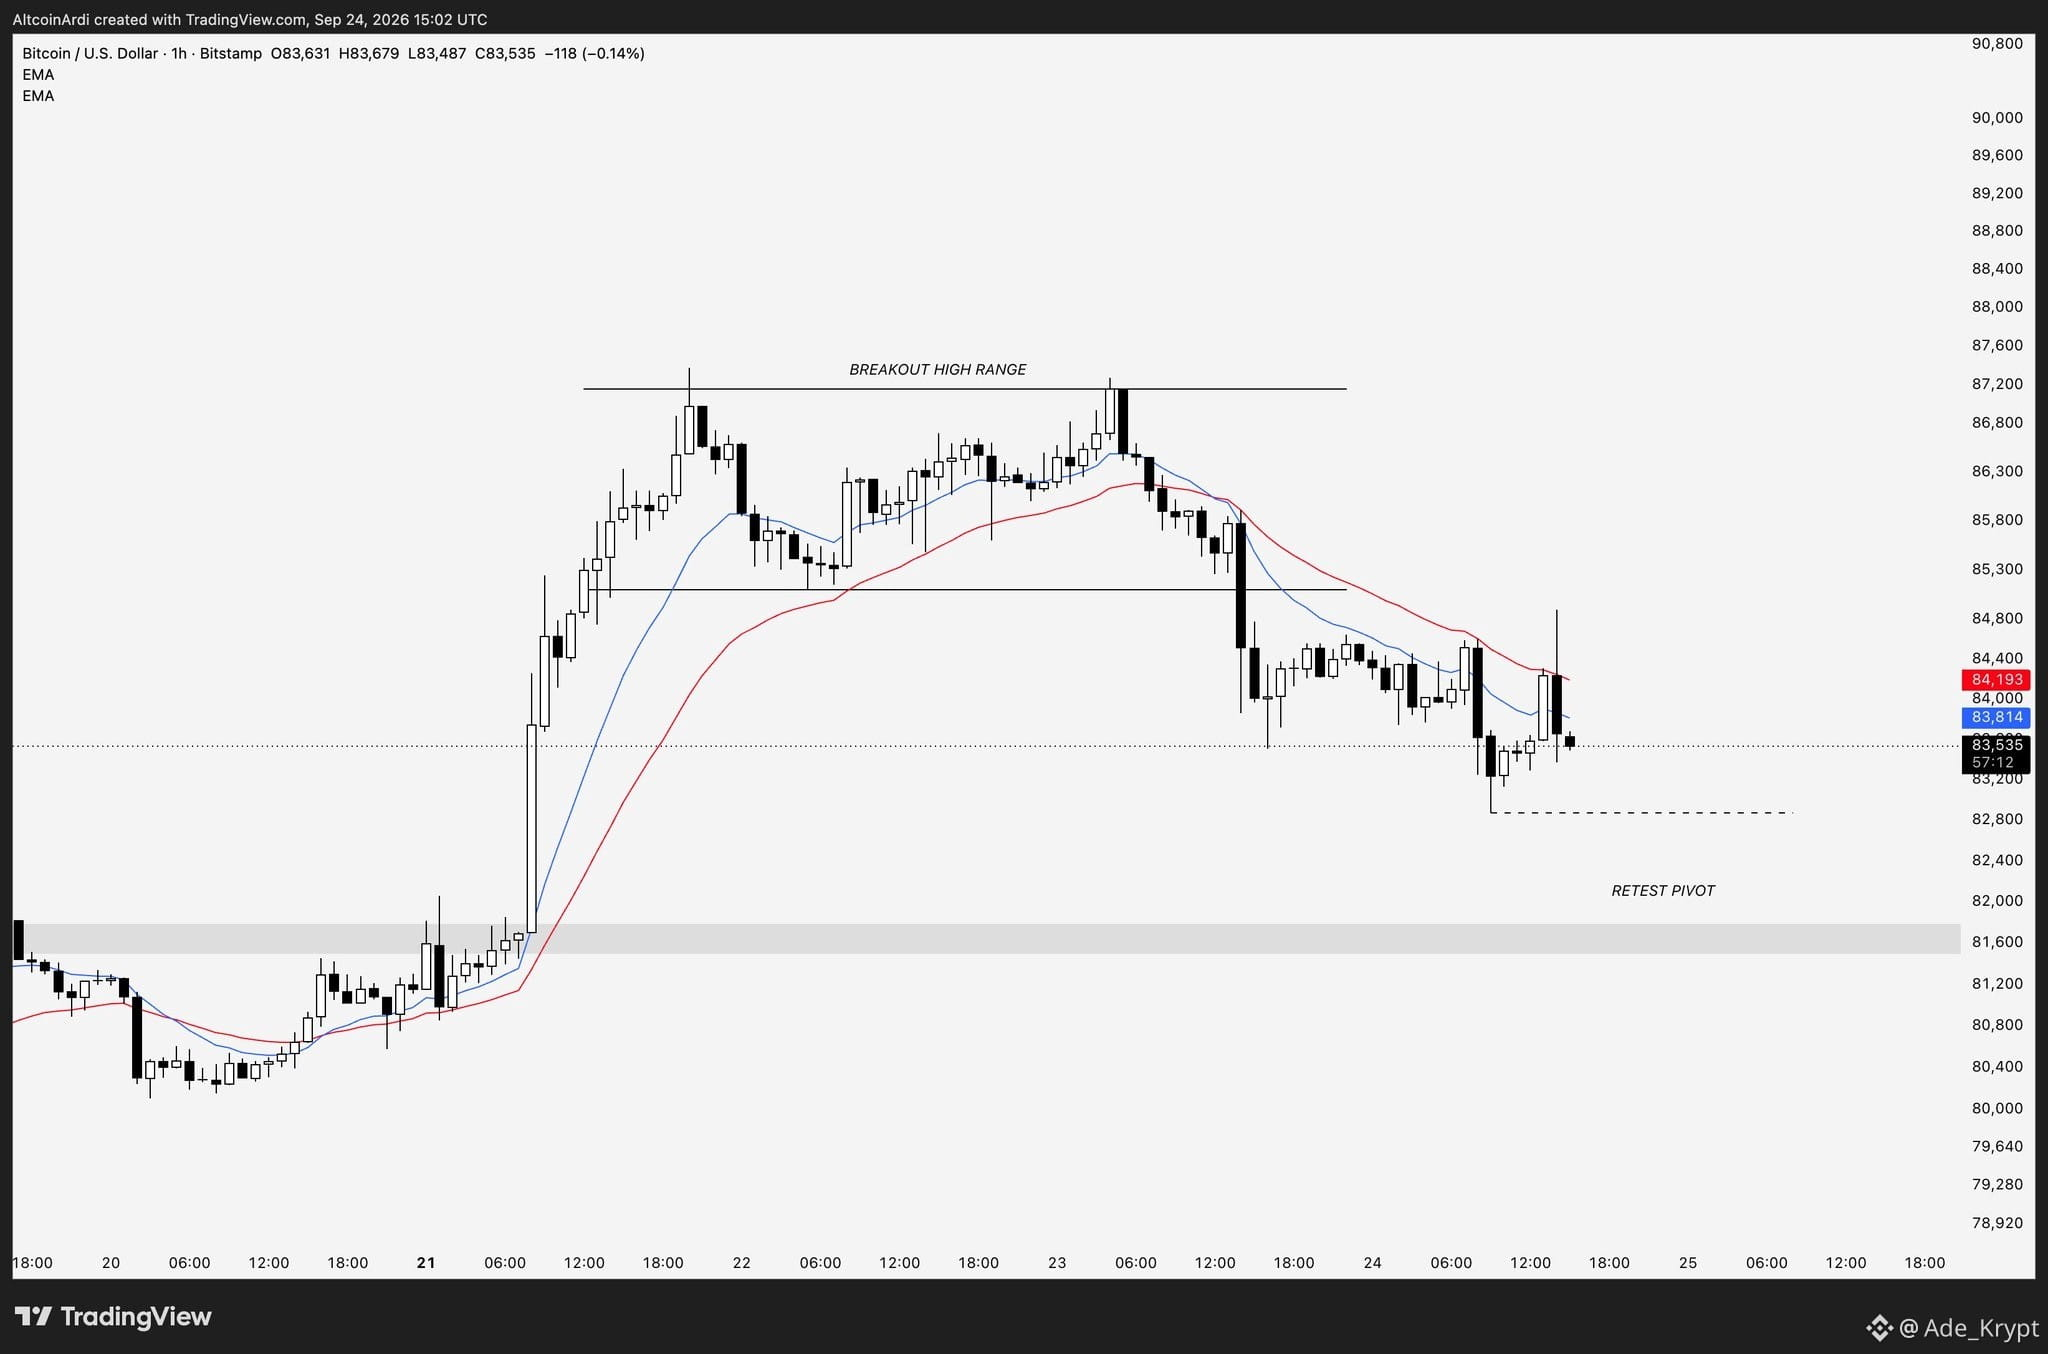
On the lower timeframes, $BTC is still struggling to regain acceptance toward the range highs.
For the bullish move to continue, reclaiming $85K remains the key first step.
As I mentioned yesterday, $81K–$83K is the liquidity zone I expect price to revisit before making another attempt at the highs.
Bitcoin has already started sweeping that area overnight, but until $85K is reclaimed, I’m watching $81.5K and the previous range breakout for a potential retest.
If that level holds, another leg higher could begin.
If it fails, a move back into the $70Ks becomes possible.
#BinanceWillListHyperliquid(HYPE) #US30YearYieldHighestSince2004
On the lower timeframes, $BTC is still struggling to regain acceptance toward the range highs.
For the bullish move to continue, reclaiming $85K remains the key first step.
As I mentioned yesterday, $81K–$83K is the liquidity zone I expect price to revisit before making another attempt at the highs.
Bitcoin has already started sweeping that area overnight, but until $85K is reclaimed, I’m watching $81.5K and the previous range breakout for a potential retest.
If that level holds, another leg higher could begin.
If it fails, a move back into the $70Ks becomes possible.
#BinanceWillListHyperliquid(HYPE) #US30YearYieldHighestSince2004
For the bullish move to continue, reclaiming $85K remains the key first step.
As I mentioned yesterday, $81K–$83K is the liquidity zone I expect price to revisit before making another attempt at the highs.
Bitcoin has already started sweeping that area overnight, but until $85K is reclaimed, I’m watching $81.5K and the previous range breakout for a potential retest.
If that level holds, another leg higher could begin.
If it fails, a move back into the $70Ks becomes possible.
#BinanceWillListHyperliquid(HYPE) #US30YearYieldHighestSince2004
188
·
--
See translation
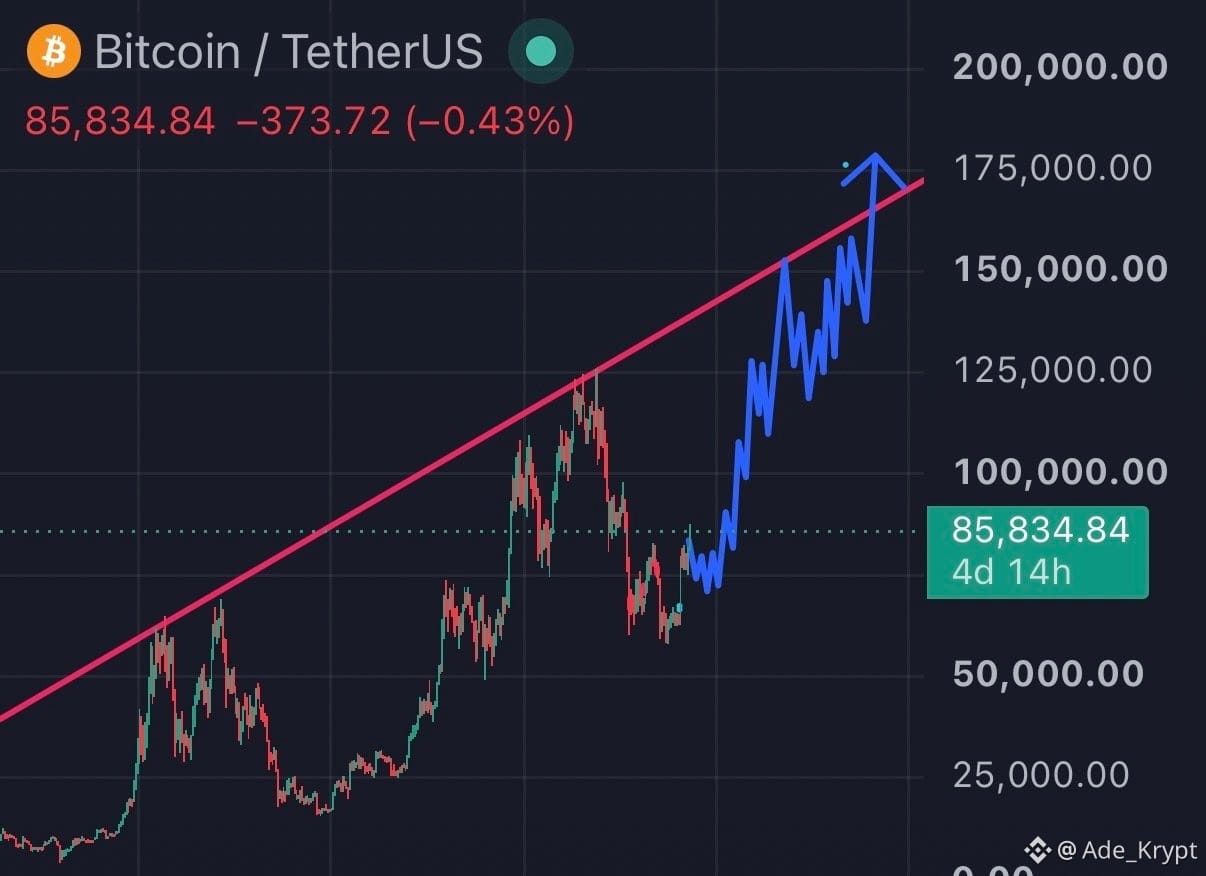
$BTC has been moving higher for almost four weeks now, and a lot of people seem to expect the rally to continue without any meaningful correction.
But remember, the narrative of an October bottom was being pushed heavily around the lows and throughout this entire move higher. Now that the rally has pushed bears into extreme despair, I wouldn’t be surprised to see some kind of pullback heading into October.
Looking at the downside liquidity, there’s a lot sitting below. Bulls are heavily positioned, greed is elevated, and markets rarely move in a straight line when sentiment gets this one-sided.
A healthy correction could shake out overleveraged bulls before the next major move higher.
Don’t lose sight of the bigger picture. Pullbacks can create better entries for longs and opportunities to accumulate more spot.
Wishing everyone prosperity and, as always, trade safely.
#AIStocksWhatNext #21SharesLaunchesEuropesFirstZcashETP
$BTC has been moving higher for almost four weeks now, and a lot of people seem to expect the rally to continue without any meaningful correction.
But remember, the narrative of an October bottom was being pushed heavily around the lows and throughout this entire move higher. Now that the rally has pushed bears into extreme despair, I wouldn’t be surprised to see some kind of pullback heading into October.
Looking at the downside liquidity, there’s a lot sitting below. Bulls are heavily positioned, greed is elevated, and markets rarely move in a straight line when sentiment gets this one-sided.
A healthy correction could shake out overleveraged bulls before the next major move higher.
Don’t lose sight of the bigger picture. Pullbacks can create better entries for longs and opportunities to accumulate more spot.
Wishing everyone prosperity and, as always, trade safely.
#AIStocksWhatNext #21SharesLaunchesEuropesFirstZcashETP
But remember, the narrative of an October bottom was being pushed heavily around the lows and throughout this entire move higher. Now that the rally has pushed bears into extreme despair, I wouldn’t be surprised to see some kind of pullback heading into October.
Looking at the downside liquidity, there’s a lot sitting below. Bulls are heavily positioned, greed is elevated, and markets rarely move in a straight line when sentiment gets this one-sided.
A healthy correction could shake out overleveraged bulls before the next major move higher.
Don’t lose sight of the bigger picture. Pullbacks can create better entries for longs and opportunities to accumulate more spot.
Wishing everyone prosperity and, as always, trade safely.
#AIStocksWhatNext #21SharesLaunchesEuropesFirstZcashETP
2
1.1k
·
--
See translation
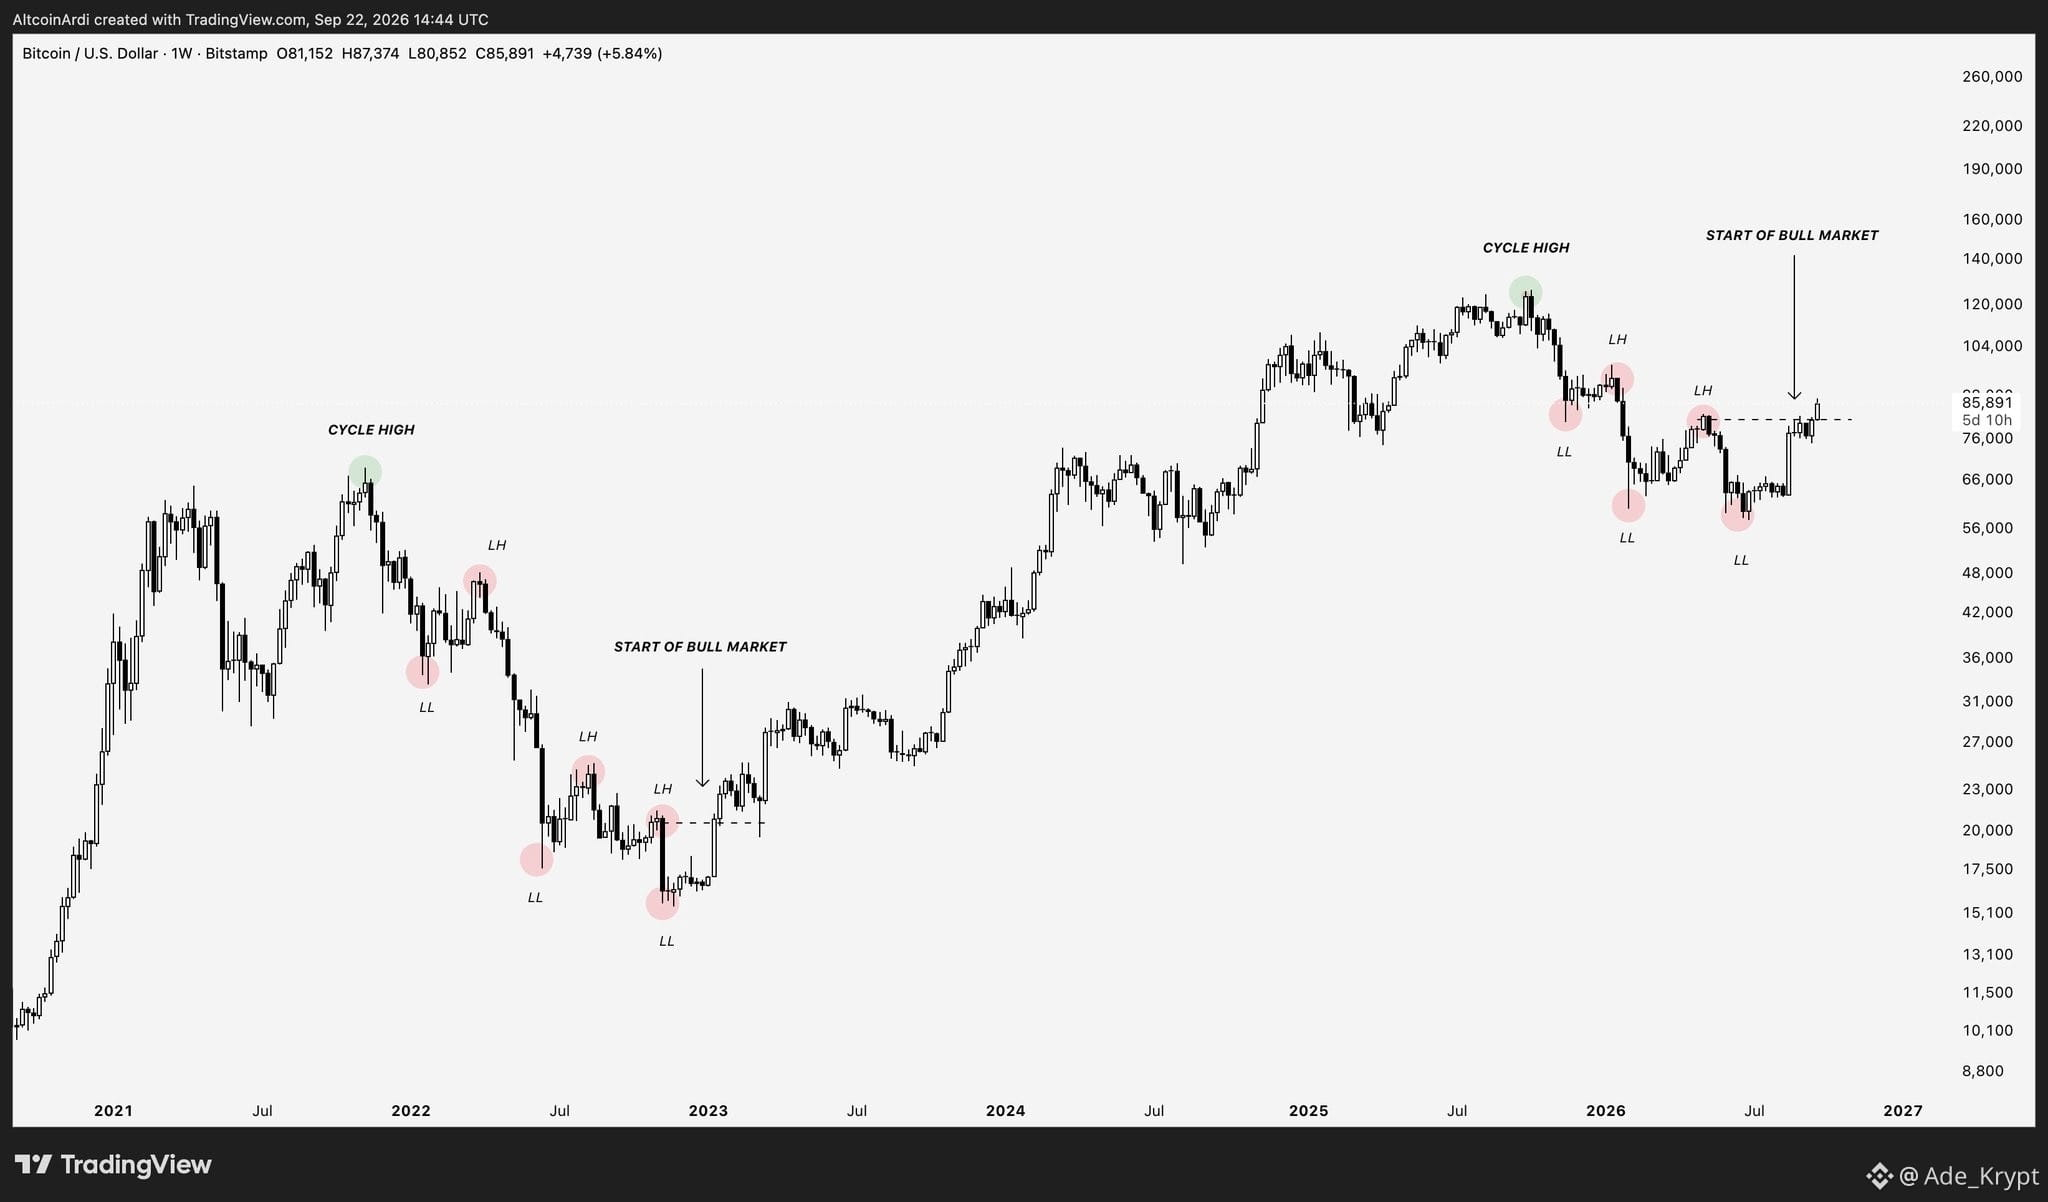
Breaking the $83K swing pivot doesn’t mean $BTC can never trade below $83K again.
We saw a similar setup after the 2022 bottom. Bitcoin broke the final lower high near $21K, signaling a shift in the bearish market structure, but later revisited that level.
The importance of reclaiming $83K was never about creating an untouchable support level.
It was about breaking the pattern of lower highs and lower lows that defined the previous bear market.
Bitcoin can still retest $83K or even dip below it without automatically returning to a bear market.
The key is whether it begins forming a new sustained sequence of lower highs and lower lows.
#AIStocksWhatNext #DogecoinRises15%
Breaking the $83K swing pivot doesn’t mean $BTC can never trade below $83K again.
We saw a similar setup after the 2022 bottom. Bitcoin broke the final lower high near $21K, signaling a shift in the bearish market structure, but later revisited that level.
The importance of reclaiming $83K was never about creating an untouchable support level.
It was about breaking the pattern of lower highs and lower lows that defined the previous bear market.
Bitcoin can still retest $83K or even dip below it without automatically returning to a bear market.
The key is whether it begins forming a new sustained sequence of lower highs and lower lows.
#AIStocksWhatNext #DogecoinRises15%
We saw a similar setup after the 2022 bottom. Bitcoin broke the final lower high near $21K, signaling a shift in the bearish market structure, but later revisited that level.
The importance of reclaiming $83K was never about creating an untouchable support level.
It was about breaking the pattern of lower highs and lower lows that defined the previous bear market.
Bitcoin can still retest $83K or even dip below it without automatically returning to a bear market.
The key is whether it begins forming a new sustained sequence of lower highs and lower lows.
#AIStocksWhatNext #DogecoinRises15%
1
1
1.2k
·
--
See translation
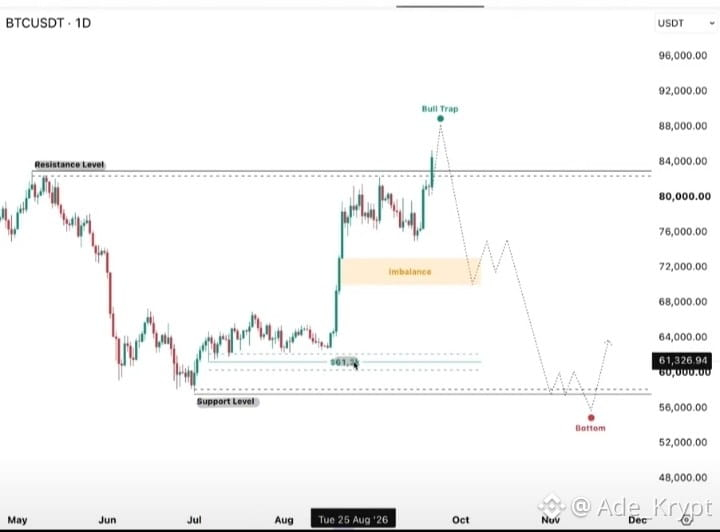
$BTC COULD BE SETTING UP FOR A MAJOR BULL TRAP.
Bitcoin is back near the $84K resistance zone that has rejected price multiple times, and this setup looks increasingly risky.
Sentiment is turning bullish again, while the broader macro picture remains uncertain. Liquidity is tightening, rate hikes are back on the table, and we still haven’t seen the kind of fear-driven event that often accompanies a major macro bottom.
Even if $BTC pushes above resistance, I’d remain cautious about calling it a confirmed breakout. A liquidity sweep above $83K–$85K could still turn into a trap.
Below, the $69K–$72K FVG remains an important imbalance, followed by major liquidity around $60K and the previous range lows.
My current roadmap:
$83K–$85K sweep → $70K FVG → $60K → ~$54K macro bottom.
The key is staying disciplined while everyone else becomes increasingly bullish.
I’ll continue tracking major macro events and market developments daily, so follow and turn on notifications to stay updated.
#XRPRises8% #ZetaChainVotesToMigrateZETAToSolana
$BTC COULD BE SETTING UP FOR A MAJOR BULL TRAP.
Bitcoin is back near the $84K resistance zone that has rejected price multiple times, and this setup looks increasingly risky.
Sentiment is turning bullish again, while the broader macro picture remains uncertain. Liquidity is tightening, rate hikes are back on the table, and we still haven’t seen the kind of fear-driven event that often accompanies a major macro bottom.
Even if $BTC pushes above resistance, I’d remain cautious about calling it a confirmed breakout. A liquidity sweep above $83K–$85K could still turn into a trap.
Below, the $69K–$72K FVG remains an important imbalance, followed by major liquidity around $60K and the previous range lows.
My current roadmap:
$83K–$85K sweep → $70K FVG → $60K → ~$54K macro bottom.
The key is staying disciplined while everyone else becomes increasingly bullish.
I’ll continue tracking major macro events and market developments daily, so follow and turn on notifications to stay updated.
#XRPRises8% #ZetaChainVotesToMigrateZETAToSolana
Bitcoin is back near the $84K resistance zone that has rejected price multiple times, and this setup looks increasingly risky.
Sentiment is turning bullish again, while the broader macro picture remains uncertain. Liquidity is tightening, rate hikes are back on the table, and we still haven’t seen the kind of fear-driven event that often accompanies a major macro bottom.
Even if $BTC pushes above resistance, I’d remain cautious about calling it a confirmed breakout. A liquidity sweep above $83K–$85K could still turn into a trap.
Below, the $69K–$72K FVG remains an important imbalance, followed by major liquidity around $60K and the previous range lows.
My current roadmap:
$83K–$85K sweep → $70K FVG → $60K → ~$54K macro bottom.
The key is staying disciplined while everyone else becomes increasingly bullish.
I’ll continue tracking major macro events and market developments daily, so follow and turn on notifications to stay updated.
#XRPRises8% #ZetaChainVotesToMigrateZETAToSolana
274
·
--
See translation
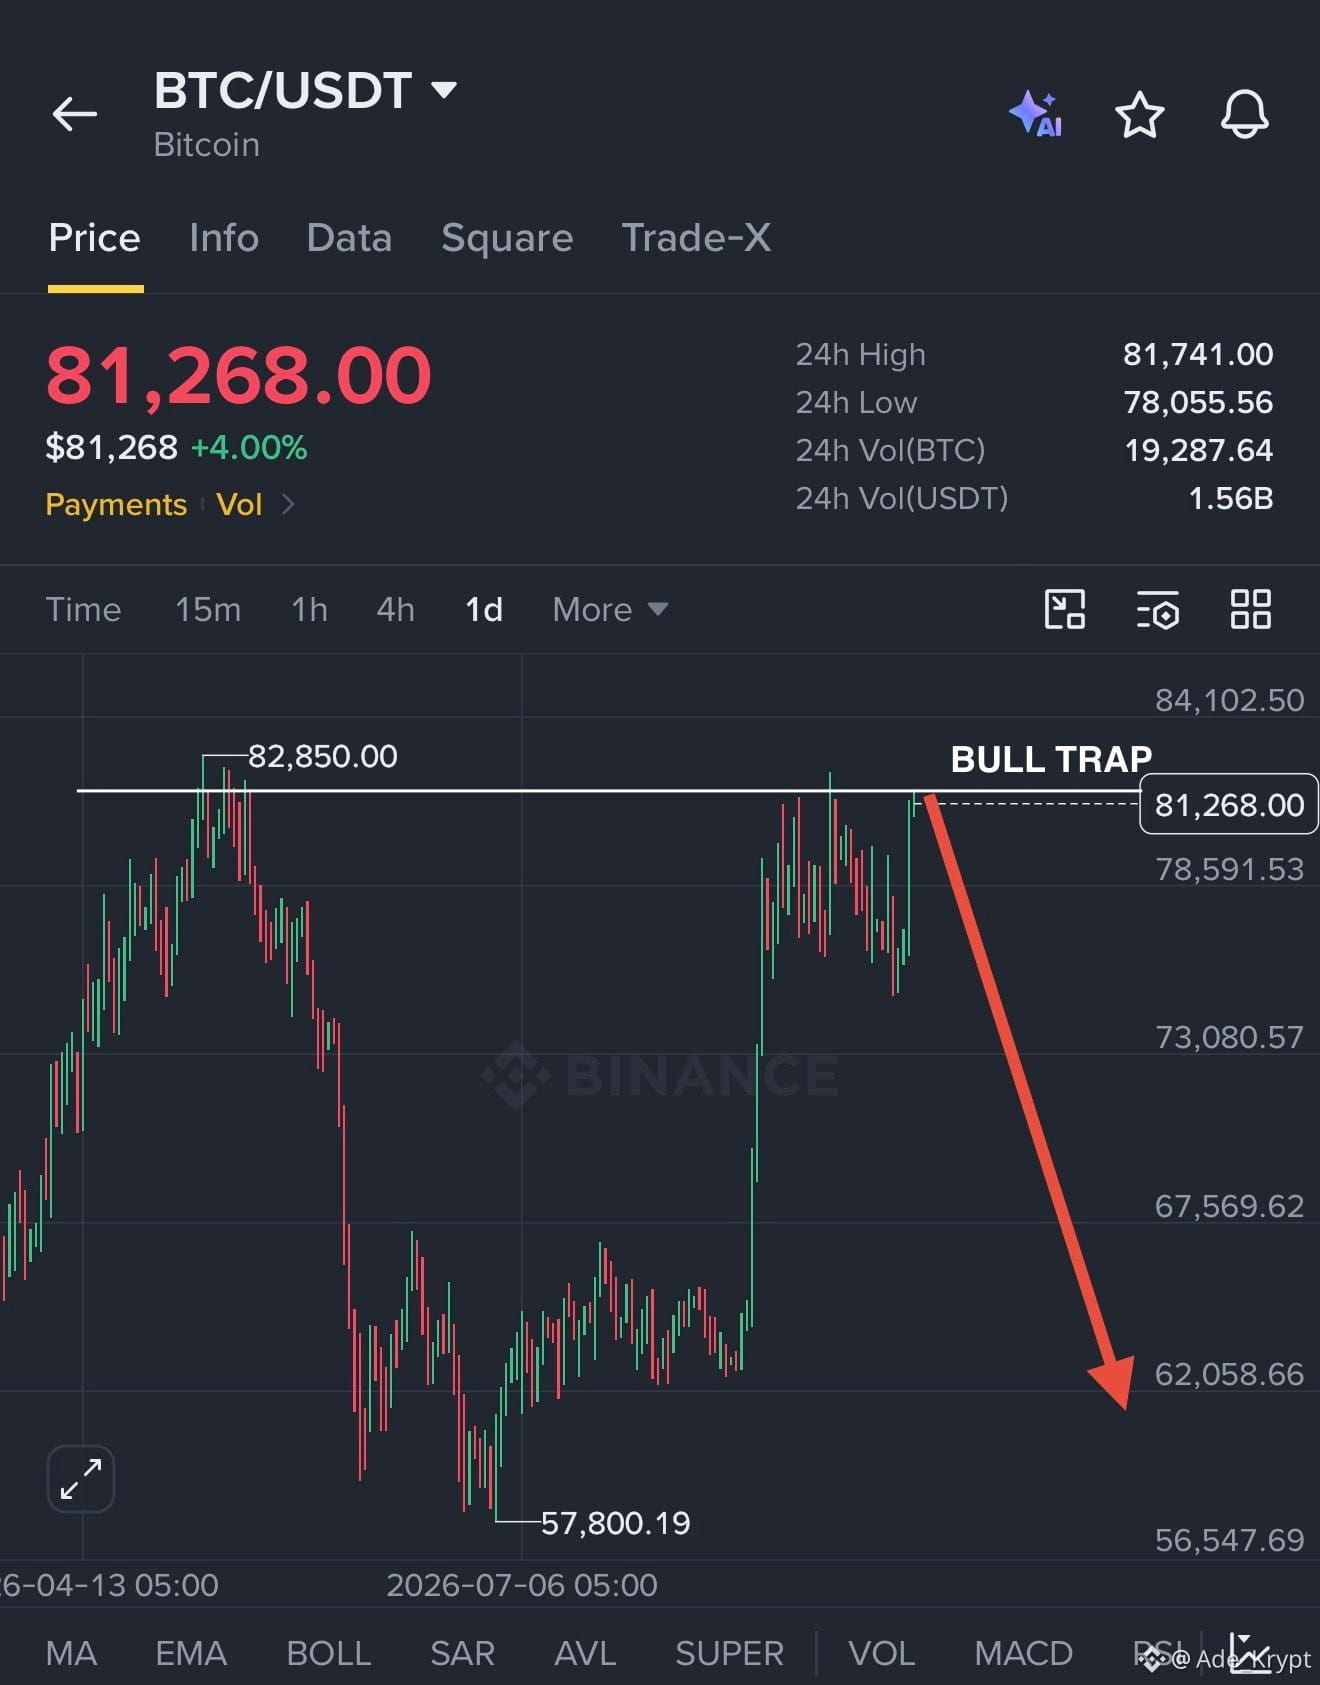
BITCOIN MAY BE ENTERING ANOTHER BULL TRAP
$BTC is now approaching the $82K–$83K resistance zone, an area where previous breakouts have repeatedly failed.
My outlook remains unchanged:
$78K → $70K → $62K → Bottom → $90K+
I’m still watching the $60K–$62K region as a potential bottom area before the next major move higher.
Stay patient, manage your risk, and don’t let leverage turn volatility into a costly mistake.
Bookmark this and revisit it later.
#BOJRaisesRatesTo31YearHigh #BTCBreaks80K
BITCOIN MAY BE ENTERING ANOTHER BULL TRAP
$BTC is now approaching the $82K–$83K resistance zone, an area where previous breakouts have repeatedly failed.
My outlook remains unchanged:
$78K → $70K → $62K → Bottom → $90K+
I’m still watching the $60K–$62K region as a potential bottom area before the next major move higher.
Stay patient, manage your risk, and don’t let leverage turn volatility into a costly mistake.
Bookmark this and revisit it later.
#BOJRaisesRatesTo31YearHigh #BTCBreaks80K
$BTC is now approaching the $82K–$83K resistance zone, an area where previous breakouts have repeatedly failed.
My outlook remains unchanged:
$78K → $70K → $62K → Bottom → $90K+
I’m still watching the $60K–$62K region as a potential bottom area before the next major move higher.
Stay patient, manage your risk, and don’t let leverage turn volatility into a costly mistake.
Bookmark this and revisit it later.
#BOJRaisesRatesTo31YearHigh #BTCBreaks80K
1
184
·
--
See translation
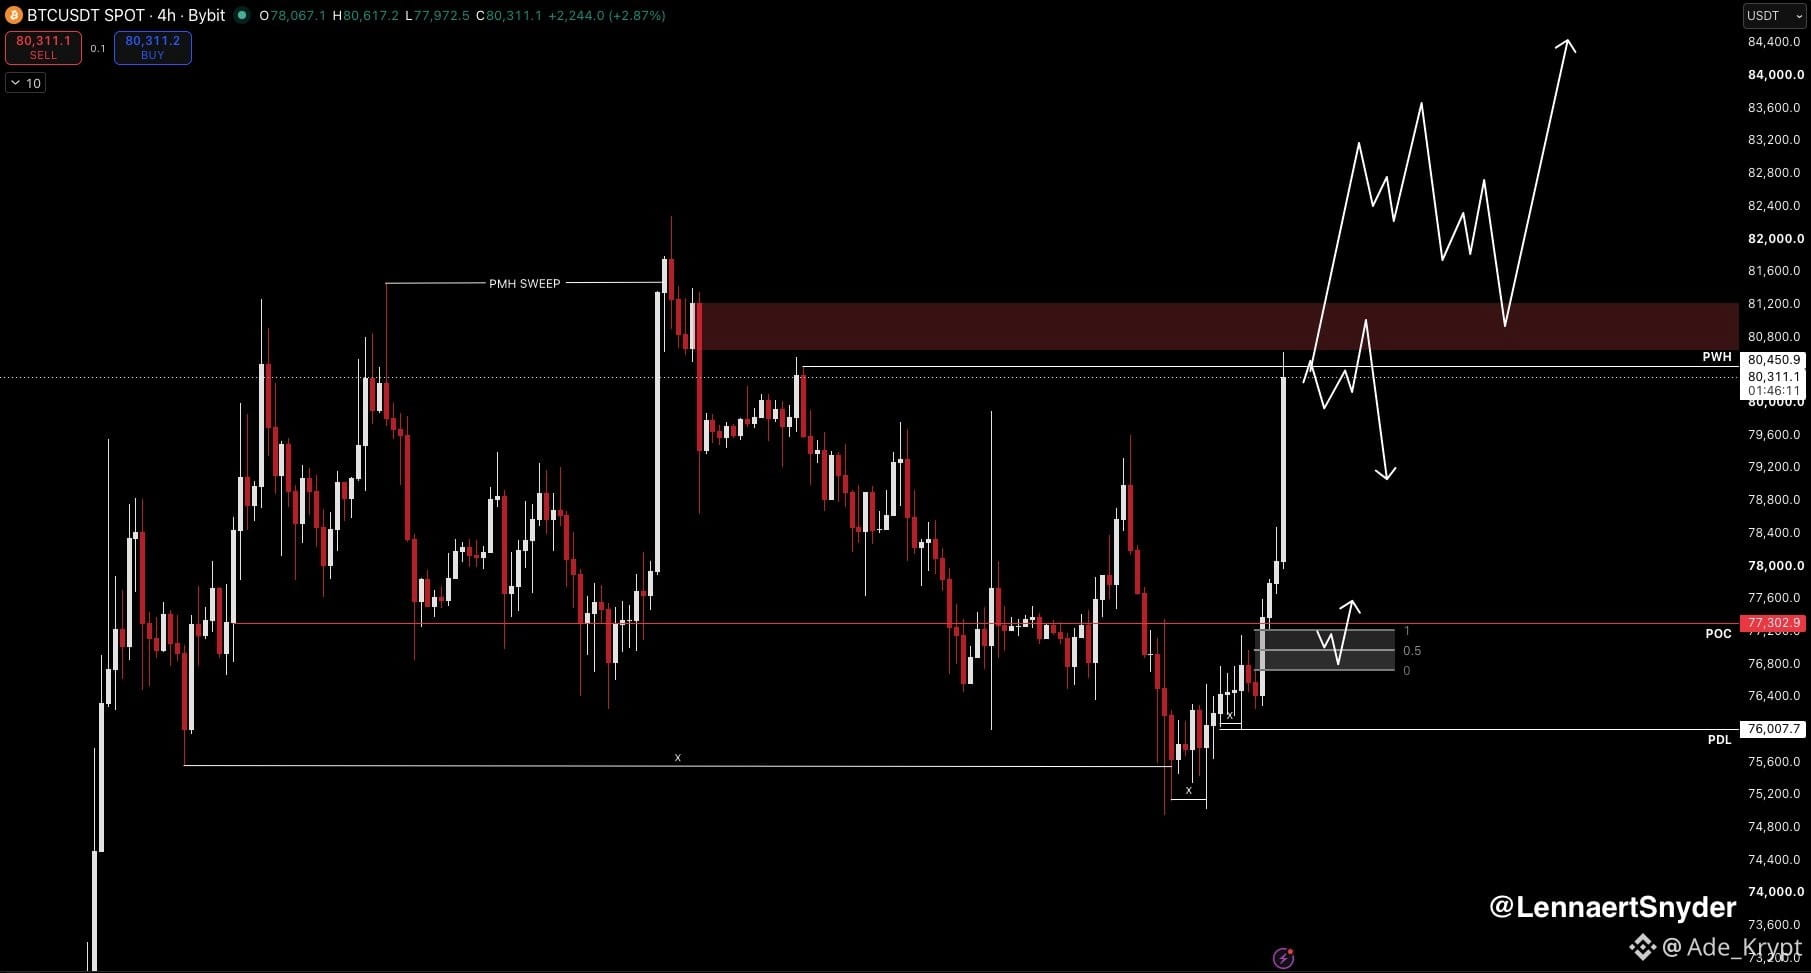
$BTC is showing serious strength during the NY session.
Bitcoin is pushing higher even as DXY strengthens, which means BTC is absorbing the dollar’s strength. That’s a notable sign of relative strength, and I like seeing this kind of aggressive price action.
Price has now reached my short POI, but there’s no trigger, so there’s no trade.
I understand the range-high thesis and why a short could make sense after a confirmed bearish trigger. If you’re taking that setup, I’d treat it as a short-term exhaustion trade against the trend. Wait for clear signs of exhaustion and a proper bearish confirmation.
Since the move toward $82K two weeks ago, my main focus has been finding quality long entries. $BTC has continued showing strength against DXY, suggesting buyers remain firmly in control.
This week already gave us two solid long opportunities. If you’re holding longs from good entries, I’d consider leaving a portion open as a runner.
The ideal scenario would be a clean breakout above the range high, followed by some consolidation and another opportunity to build longs at higher levels.
Stay reactive, manage risk properly, and adjust as market conditions change.
For now, let those longs do the heavy lifting. Have a great weekend ahead!
#BTCBreaks80K #比特币突破8万
$BTC is showing serious strength during the NY session.
Bitcoin is pushing higher even as DXY strengthens, which means BTC is absorbing the dollar’s strength. That’s a notable sign of relative strength, and I like seeing this kind of aggressive price action.
Price has now reached my short POI, but there’s no trigger, so there’s no trade.
I understand the range-high thesis and why a short could make sense after a confirmed bearish trigger. If you’re taking that setup, I’d treat it as a short-term exhaustion trade against the trend. Wait for clear signs of exhaustion and a proper bearish confirmation.
Since the move toward $82K two weeks ago, my main focus has been finding quality long entries. $BTC has continued showing strength against DXY, suggesting buyers remain firmly in control.
This week already gave us two solid long opportunities. If you’re holding longs from good entries, I’d consider leaving a portion open as a runner.
The ideal scenario would be a clean breakout above the range high, followed by some consolidation and another opportunity to build longs at higher levels.
Stay reactive, manage risk properly, and adjust as market conditions change.
For now, let those longs do the heavy lifting. Have a great weekend ahead!
#BTCBreaks80K #比特币突破8万
Bitcoin is pushing higher even as DXY strengthens, which means BTC is absorbing the dollar’s strength. That’s a notable sign of relative strength, and I like seeing this kind of aggressive price action.
Price has now reached my short POI, but there’s no trigger, so there’s no trade.
I understand the range-high thesis and why a short could make sense after a confirmed bearish trigger. If you’re taking that setup, I’d treat it as a short-term exhaustion trade against the trend. Wait for clear signs of exhaustion and a proper bearish confirmation.
Since the move toward $82K two weeks ago, my main focus has been finding quality long entries. $BTC has continued showing strength against DXY, suggesting buyers remain firmly in control.
This week already gave us two solid long opportunities. If you’re holding longs from good entries, I’d consider leaving a portion open as a runner.
The ideal scenario would be a clean breakout above the range high, followed by some consolidation and another opportunity to build longs at higher levels.
Stay reactive, manage risk properly, and adjust as market conditions change.
For now, let those longs do the heavy lifting. Have a great weekend ahead!
#BTCBreaks80K #比特币突破8万
1
229
·
--
See translation
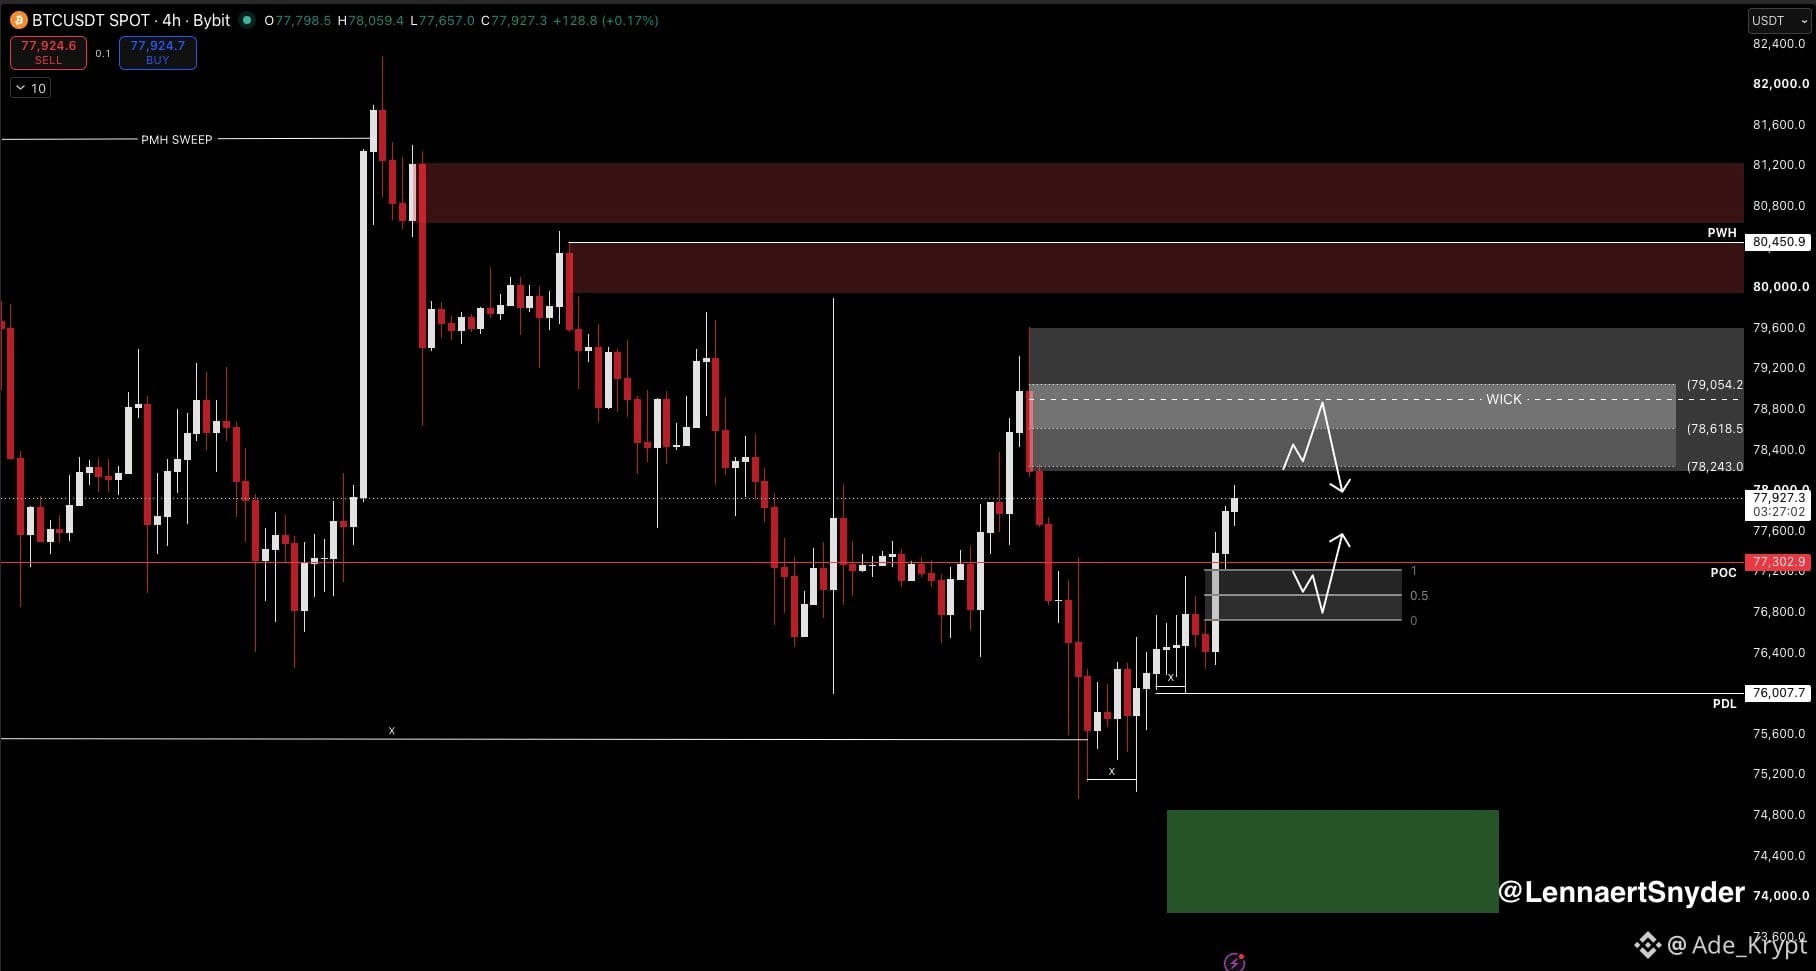
$BTC pumped to $78K and reached our final long target.
Very clean PA on Bitcoin. You can see how buyers and sellers were manipulated to fuel the move higher.
Jobless claims came in bearish → initial trap move up → sweep to wipe out early buyers and induce sellers → strong move higher that cleared out sellers while leaving late buyers behind.
If you’re not familiar with this inducement game, you’ll probably get chopped up. Better to wait for clear confirmation.
This week gave us 2 clean long entries that played out nicely. My hedge short got stopped, but the long more than compensated, which is exactly how I approach hedging.
For today, we already had a strong pump and are now retesting a HTF short POI.
After a move like this, I’m only interested in local shorts after a clear trigger.
The untouched wick remains a valid POI. I like the $78.6K–$78.8K region, but if the trigger comes earlier, I’m fine with taking it there.
I’m not chasing longs locally. My first intraday long POI would be a retest of the gap around $76.9K.
Overall, a very solid week.
#HKMAPlansWholesaleCBDCByYearEnd #BOJHikesRatesTo31YearHigh
$BTC pumped to $78K and reached our final long target.
Very clean PA on Bitcoin. You can see how buyers and sellers were manipulated to fuel the move higher.
Jobless claims came in bearish → initial trap move up → sweep to wipe out early buyers and induce sellers → strong move higher that cleared out sellers while leaving late buyers behind.
If you’re not familiar with this inducement game, you’ll probably get chopped up. Better to wait for clear confirmation.
This week gave us 2 clean long entries that played out nicely. My hedge short got stopped, but the long more than compensated, which is exactly how I approach hedging.
For today, we already had a strong pump and are now retesting a HTF short POI.
After a move like this, I’m only interested in local shorts after a clear trigger.
The untouched wick remains a valid POI. I like the $78.6K–$78.8K region, but if the trigger comes earlier, I’m fine with taking it there.
I’m not chasing longs locally. My first intraday long POI would be a retest of the gap around $76.9K.
Overall, a very solid week.
#HKMAPlansWholesaleCBDCByYearEnd #BOJHikesRatesTo31YearHigh
Very clean PA on Bitcoin. You can see how buyers and sellers were manipulated to fuel the move higher.
Jobless claims came in bearish → initial trap move up → sweep to wipe out early buyers and induce sellers → strong move higher that cleared out sellers while leaving late buyers behind.
If you’re not familiar with this inducement game, you’ll probably get chopped up. Better to wait for clear confirmation.
This week gave us 2 clean long entries that played out nicely. My hedge short got stopped, but the long more than compensated, which is exactly how I approach hedging.
For today, we already had a strong pump and are now retesting a HTF short POI.
After a move like this, I’m only interested in local shorts after a clear trigger.
The untouched wick remains a valid POI. I like the $78.6K–$78.8K region, but if the trigger comes earlier, I’m fine with taking it there.
I’m not chasing longs locally. My first intraday long POI would be a retest of the gap around $76.9K.
Overall, a very solid week.
#HKMAPlansWholesaleCBDCByYearEnd #BOJHikesRatesTo31YearHigh
1
180
·
--
See translation
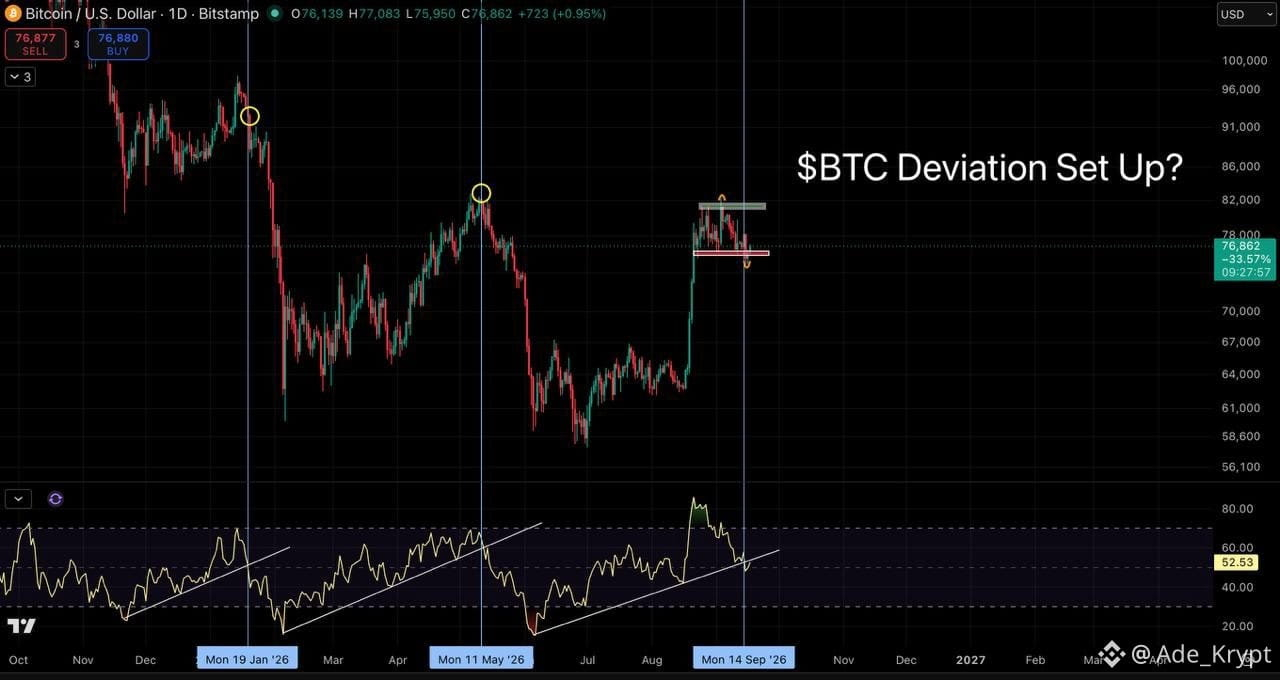
$BTC could be forming the deviation setup I mentioned yesterday .
After price broke below the RSI uptrend and lost the $76K support, we didn’t get the downside volatility I was expecting. That raised the possibility of a deviation, similar to what we saw when $BTC broke above $82K.
Now that price has reclaimed $76K, we could be seeing a similar setup unfold.
For now, this still looks like the same sideways consolidation range I’ve been watching for weeks.
Until we get a strong breakdown below $76K or a decisive breakout above $82K, the market remains neutral in this range.
I’m watching today’s daily close closely for confirmation.
#USWeeklyJoblessClaimsFallTo196K #HyperliquidUSDCSupplyOvertakesSolana
$BTC could be forming the deviation setup I mentioned yesterday .
After price broke below the RSI uptrend and lost the $76K support, we didn’t get the downside volatility I was expecting. That raised the possibility of a deviation, similar to what we saw when $BTC broke above $82K.
Now that price has reclaimed $76K, we could be seeing a similar setup unfold.
For now, this still looks like the same sideways consolidation range I’ve been watching for weeks.
Until we get a strong breakdown below $76K or a decisive breakout above $82K, the market remains neutral in this range.
I’m watching today’s daily close closely for confirmation.
#USWeeklyJoblessClaimsFallTo196K #HyperliquidUSDCSupplyOvertakesSolana
After price broke below the RSI uptrend and lost the $76K support, we didn’t get the downside volatility I was expecting. That raised the possibility of a deviation, similar to what we saw when $BTC broke above $82K.
Now that price has reclaimed $76K, we could be seeing a similar setup unfold.
For now, this still looks like the same sideways consolidation range I’ve been watching for weeks.
Until we get a strong breakdown below $76K or a decisive breakout above $82K, the market remains neutral in this range.
I’m watching today’s daily close closely for confirmation.
#USWeeklyJoblessClaimsFallTo196K #HyperliquidUSDCSupplyOvertakesSolana
1
979
·
--
See translation
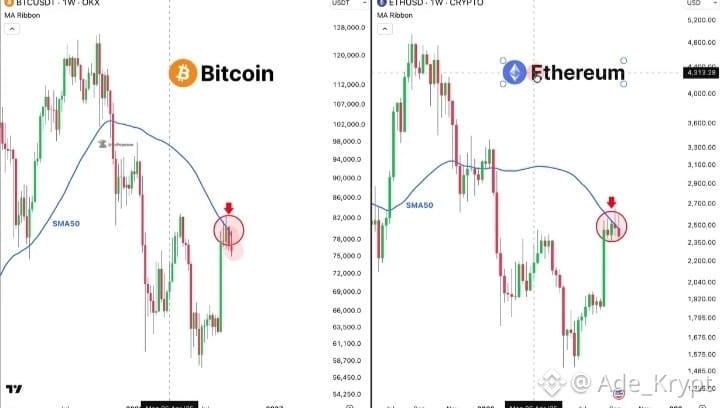
BITCOIN & ETHEREUM FACE REJECTION AT THE 50-WEEK MA
Both $BTC and $ETH are struggling to reclaim their 50-week moving averages, which continue to act as major resistance as several key macro catalysts approach.
Yesterday, September 15, the U.S. Senate failed to advance the CLARITY Act, removing one of the market’s major legislative catalysts.
Now, attention turns to the Fed’s rate decision and press conference today, September 16.
On September 18, the Bank of Japan will announce its policy decision, with any hawkish surprise potentially putting pressure on global markets through carry-trade unwinding.
Key dates:
• Sep 15 — CLARITY Act failed
• Sep 16 — Fed rate decision
• Sep 18 — BOJ policy meeting
With the 50-week MA still acting as overhead resistance, further downside remains possible if central banks deliver hawkish signals.
For bulls, a strong weekly close above the 50-week MA could be an important confirmation that the recovery is gaining strength.
#FedRateWatch #ZcashRises6%
BITCOIN & ETHEREUM FACE REJECTION AT THE 50-WEEK MA
Both $BTC and $ETH are struggling to reclaim their 50-week moving averages, which continue to act as major resistance as several key macro catalysts approach.
Yesterday, September 15, the U.S. Senate failed to advance the CLARITY Act, removing one of the market’s major legislative catalysts.
Now, attention turns to the Fed’s rate decision and press conference today, September 16.
On September 18, the Bank of Japan will announce its policy decision, with any hawkish surprise potentially putting pressure on global markets through carry-trade unwinding.
Key dates:
• Sep 15 — CLARITY Act failed
• Sep 16 — Fed rate decision
• Sep 18 — BOJ policy meeting
With the 50-week MA still acting as overhead resistance, further downside remains possible if central banks deliver hawkish signals.
For bulls, a strong weekly close above the 50-week MA could be an important confirmation that the recovery is gaining strength.
#FedRateWatch #ZcashRises6%
Both $BTC and $ETH are struggling to reclaim their 50-week moving averages, which continue to act as major resistance as several key macro catalysts approach.
Yesterday, September 15, the U.S. Senate failed to advance the CLARITY Act, removing one of the market’s major legislative catalysts.
Now, attention turns to the Fed’s rate decision and press conference today, September 16.
On September 18, the Bank of Japan will announce its policy decision, with any hawkish surprise potentially putting pressure on global markets through carry-trade unwinding.
Key dates:
• Sep 15 — CLARITY Act failed
• Sep 16 — Fed rate decision
• Sep 18 — BOJ policy meeting
With the 50-week MA still acting as overhead resistance, further downside remains possible if central banks deliver hawkish signals.
For bulls, a strong weekly close above the 50-week MA could be an important confirmation that the recovery is gaining strength.
#FedRateWatch #ZcashRises6%
343
·
--
See translation
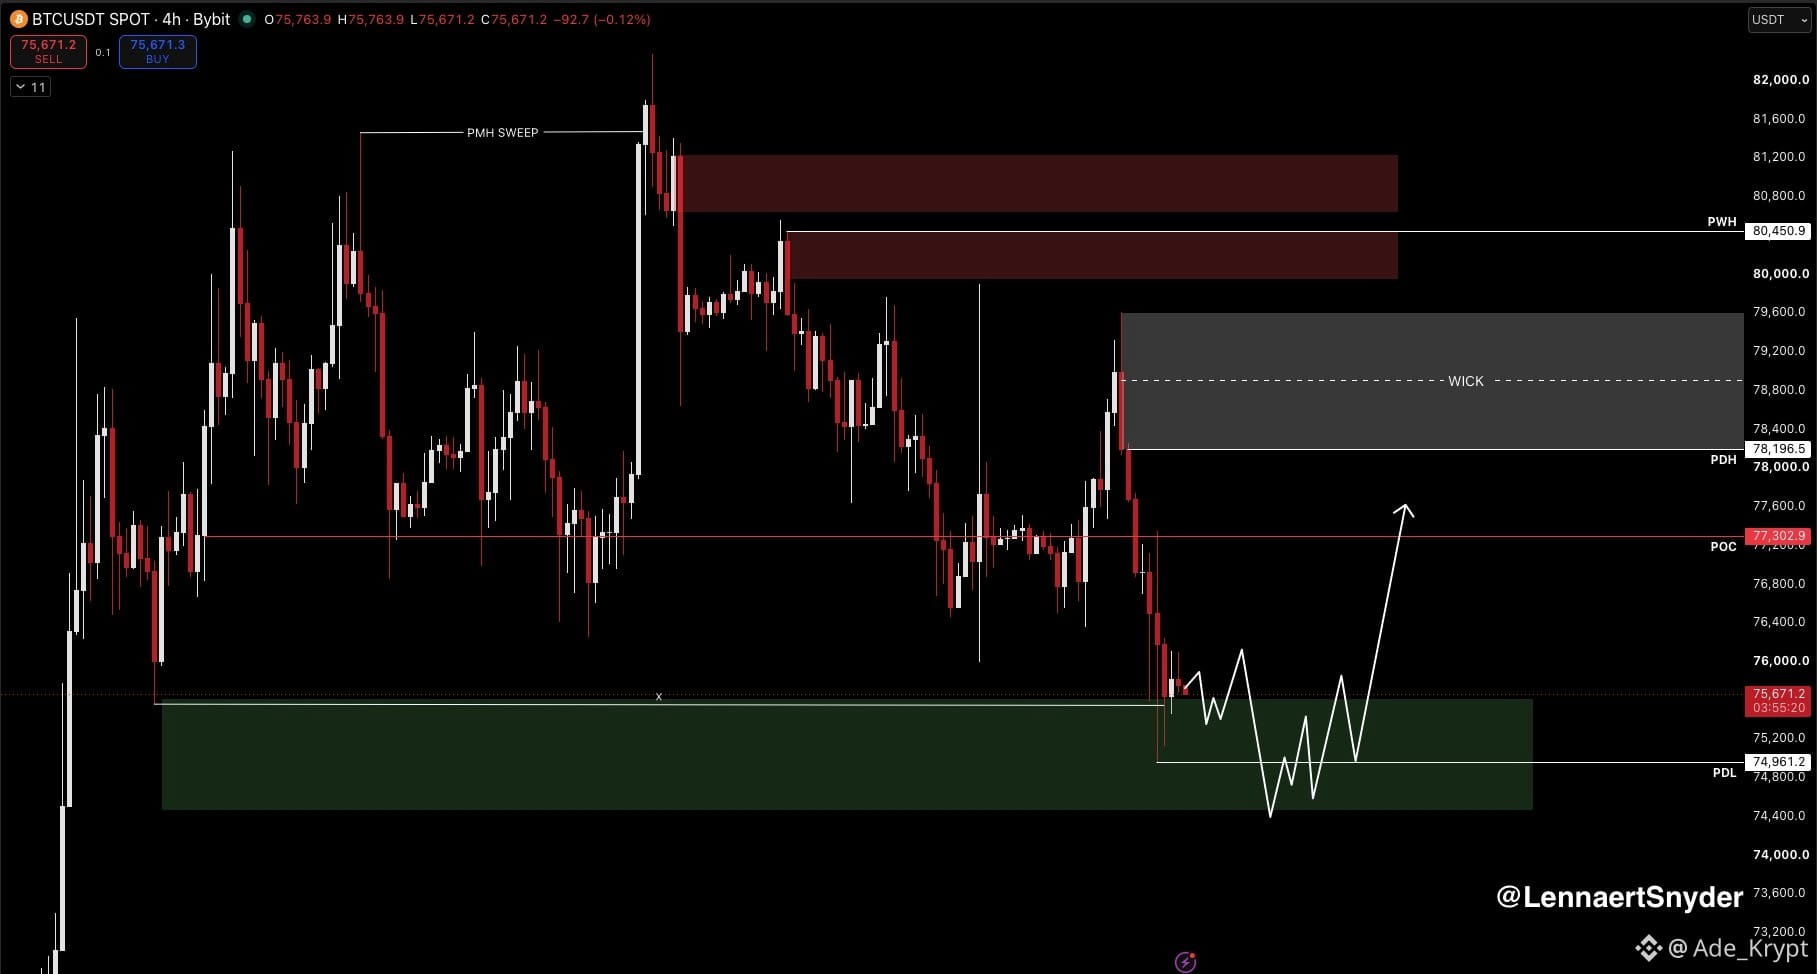
$BTC swept the $75.5K low following the failed CLARITY Act vote.
As mentioned yesterday, a bearish move below $75.5K was the reaction I was watching, and it has now played out.
With FOMC today, I’m not expecting much volatility before the announcement. Ideally, Bitcoin consolidates into the event, with the release triggering another liquidity sweep.
If that happens, I’ll be watching for a potential corrective move higher and a long setup.
The key is patience: let price action and spreads normalize after the release before entering.
For now, local scalps may be possible, but I’m not particularly interested. If you’re holding positions into FOMC, manage your risk accordingly.
#FedRateWatch #BitcoinFalls4%
$BTC swept the $75.5K low following the failed CLARITY Act vote.
As mentioned yesterday, a bearish move below $75.5K was the reaction I was watching, and it has now played out.
With FOMC today, I’m not expecting much volatility before the announcement. Ideally, Bitcoin consolidates into the event, with the release triggering another liquidity sweep.
If that happens, I’ll be watching for a potential corrective move higher and a long setup.
The key is patience: let price action and spreads normalize after the release before entering.
For now, local scalps may be possible, but I’m not particularly interested. If you’re holding positions into FOMC, manage your risk accordingly.
#FedRateWatch #BitcoinFalls4%
As mentioned yesterday, a bearish move below $75.5K was the reaction I was watching, and it has now played out.
With FOMC today, I’m not expecting much volatility before the announcement. Ideally, Bitcoin consolidates into the event, with the release triggering another liquidity sweep.
If that happens, I’ll be watching for a potential corrective move higher and a long setup.
The key is patience: let price action and spreads normalize after the release before entering.
For now, local scalps may be possible, but I’m not particularly interested. If you’re holding positions into FOMC, manage your risk accordingly.
#FedRateWatch #BitcoinFalls4%
212
·
--
See translation
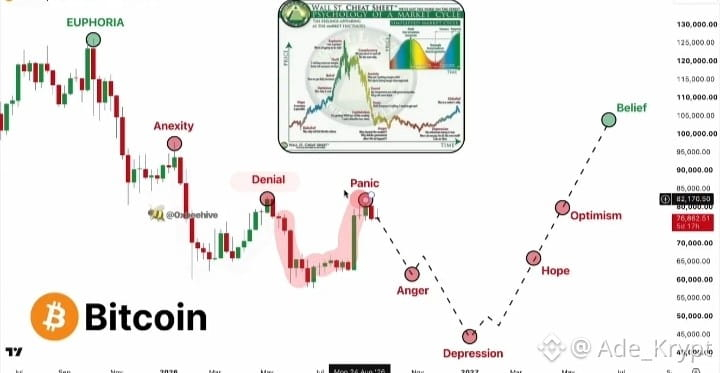
THE NEXT $BTC MOVE COULD GET INTERESTING
We’ve already seen the bounce. Now the real question is whether Bitcoin can sustain it.
At $77K–$78K, I’m still not convinced the downside is completely over.
The bigger catalyst I’m watching is the CLARITY Act.
The Senate is voting on the bill today, and the outcome could significantly influence market expectations around U.S. crypto regulation.
So I’m watching both sides:
• Can BTC maintain its current structure?
• Can CLARITY bring fresh demand back into the market?
If the downside comes first, the $60K–$50K zone becomes an area I’d watch closely.
And if sentiment resets there, a successful CLARITY vote could provide the catalyst for the next major move.
That possibility may not be fully priced in yet.
#FedRateWatch #StrategyMarketCapPassesFord
THE NEXT $BTC MOVE COULD GET INTERESTING
We’ve already seen the bounce. Now the real question is whether Bitcoin can sustain it.
At $77K–$78K, I’m still not convinced the downside is completely over.
The bigger catalyst I’m watching is the CLARITY Act.
The Senate is voting on the bill today, and the outcome could significantly influence market expectations around U.S. crypto regulation.
So I’m watching both sides:
• Can BTC maintain its current structure?
• Can CLARITY bring fresh demand back into the market?
If the downside comes first, the $60K–$50K zone becomes an area I’d watch closely.
And if sentiment resets there, a successful CLARITY vote could provide the catalyst for the next major move.
That possibility may not be fully priced in yet.
#FedRateWatch #StrategyMarketCapPassesFord
We’ve already seen the bounce. Now the real question is whether Bitcoin can sustain it.
At $77K–$78K, I’m still not convinced the downside is completely over.
The bigger catalyst I’m watching is the CLARITY Act.
The Senate is voting on the bill today, and the outcome could significantly influence market expectations around U.S. crypto regulation.
So I’m watching both sides:
• Can BTC maintain its current structure?
• Can CLARITY bring fresh demand back into the market?
If the downside comes first, the $60K–$50K zone becomes an area I’d watch closely.
And if sentiment resets there, a successful CLARITY vote could provide the catalyst for the next major move.
That possibility may not be fully priced in yet.
#FedRateWatch #StrategyMarketCapPassesFord
277
·
--
See translation
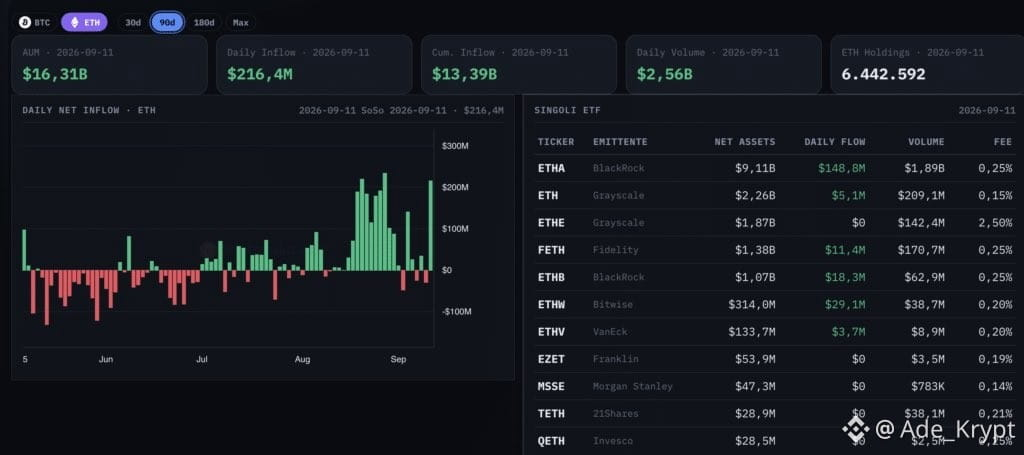
$ETH ETFs saw $216.4M in inflows last Friday, marking their strongest day since August 27.
Meanwhile, $BTC ETFs recorded their fourth consecutive day of outflows during the same session.
BlackRock also purchased $250M worth of ETH directly that day, separate from ETF activity.
On-chain activity is picking up too, with transactions above $1M rising 14% in just 24 hours.
Three bullish signals appearing almost simultaneously.
But the chart remains uncertain. $ETH formed a weekly doji with little real body, sitting directly around the 50-week SMA after rejecting the $2,450 resistance level.
After a 32.6% rally in August, could ETH be setting up for a reversal?
#AnthropicCEOCallsForAISlowdown
#BitcoinThirdSingleBlockReorgInFourWeeks
$ETH ETFs saw $216.4M in inflows last Friday, marking their strongest day since August 27.
Meanwhile, $BTC ETFs recorded their fourth consecutive day of outflows during the same session.
BlackRock also purchased $250M worth of ETH directly that day, separate from ETF activity.
On-chain activity is picking up too, with transactions above $1M rising 14% in just 24 hours.
Three bullish signals appearing almost simultaneously.
But the chart remains uncertain. $ETH formed a weekly doji with little real body, sitting directly around the 50-week SMA after rejecting the $2,450 resistance level.
After a 32.6% rally in August, could ETH be setting up for a reversal?
#AnthropicCEOCallsForAISlowdown
#BitcoinThirdSingleBlockReorgInFourWeeks
Meanwhile, $BTC ETFs recorded their fourth consecutive day of outflows during the same session.
BlackRock also purchased $250M worth of ETH directly that day, separate from ETF activity.
On-chain activity is picking up too, with transactions above $1M rising 14% in just 24 hours.
Three bullish signals appearing almost simultaneously.
But the chart remains uncertain. $ETH formed a weekly doji with little real body, sitting directly around the 50-week SMA after rejecting the $2,450 resistance level.
After a 32.6% rally in August, could ETH be setting up for a reversal?
#AnthropicCEOCallsForAISlowdown
#BitcoinThirdSingleBlockReorgInFourWeeks
192
·
--
See translation
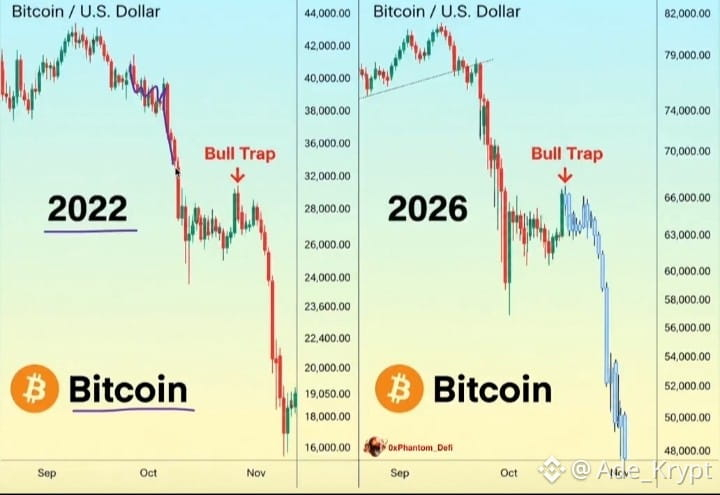
BITCOIN COULD BE 25 DAYS AWAY FROM FULL CAPITULATION
The $79K bull trap I warned about appears to have played out.
Now, $BTC
is showing a structure that looks uncomfortably similar to the setup that led to the brutal 2022 selloff.
If this pattern continues to repeat, Bitcoin could potentially fall below $50K within the next 25 days.
Not next year.
Not eventually.
25 days.
The sequence is simple:
Bull trap → Distribution → Breakdown → Capitulation
$79K was the trap.
$48K could be where the real panic begins.
And the most dangerous part? Every bounce along the way could convince traders that the bottom is already in.
Bookmark this.
If $BTC trades below $50K, come back to this post.
I’ll be watching the structure closely and sharing my levels when I believe the risk/reward starts making sense.
Don’t confuse every bounce with a confirmed bottom.
#SECReceivesGrayscaleLitecoinTrustETFFiling #US10YearTreasuryYieldNears5%
BITCOIN COULD BE 25 DAYS AWAY FROM FULL CAPITULATION
The $79K bull trap I warned about appears to have played out.
Now, $BTC
is showing a structure that looks uncomfortably similar to the setup that led to the brutal 2022 selloff.
If this pattern continues to repeat, Bitcoin could potentially fall below $50K within the next 25 days.
Not next year.
Not eventually.
25 days.
The sequence is simple:
Bull trap → Distribution → Breakdown → Capitulation
$79K was the trap.
$48K could be where the real panic begins.
And the most dangerous part? Every bounce along the way could convince traders that the bottom is already in.
Bookmark this.
If $BTC trades below $50K, come back to this post.
I’ll be watching the structure closely and sharing my levels when I believe the risk/reward starts making sense.
Don’t confuse every bounce with a confirmed bottom.
#SECReceivesGrayscaleLitecoinTrustETFFiling #US10YearTreasuryYieldNears5%
The $79K bull trap I warned about appears to have played out.
Now, $BTC
is showing a structure that looks uncomfortably similar to the setup that led to the brutal 2022 selloff.
If this pattern continues to repeat, Bitcoin could potentially fall below $50K within the next 25 days.
Not next year.
Not eventually.
25 days.
The sequence is simple:
Bull trap → Distribution → Breakdown → Capitulation
$79K was the trap.
$48K could be where the real panic begins.
And the most dangerous part? Every bounce along the way could convince traders that the bottom is already in.
Bookmark this.
If $BTC trades below $50K, come back to this post.
I’ll be watching the structure closely and sharing my levels when I believe the risk/reward starts making sense.
Don’t confuse every bounce with a confirmed bottom.
#SECReceivesGrayscaleLitecoinTrustETFFiling #US10YearTreasuryYieldNears5%
1
1
252
·
--
See translation
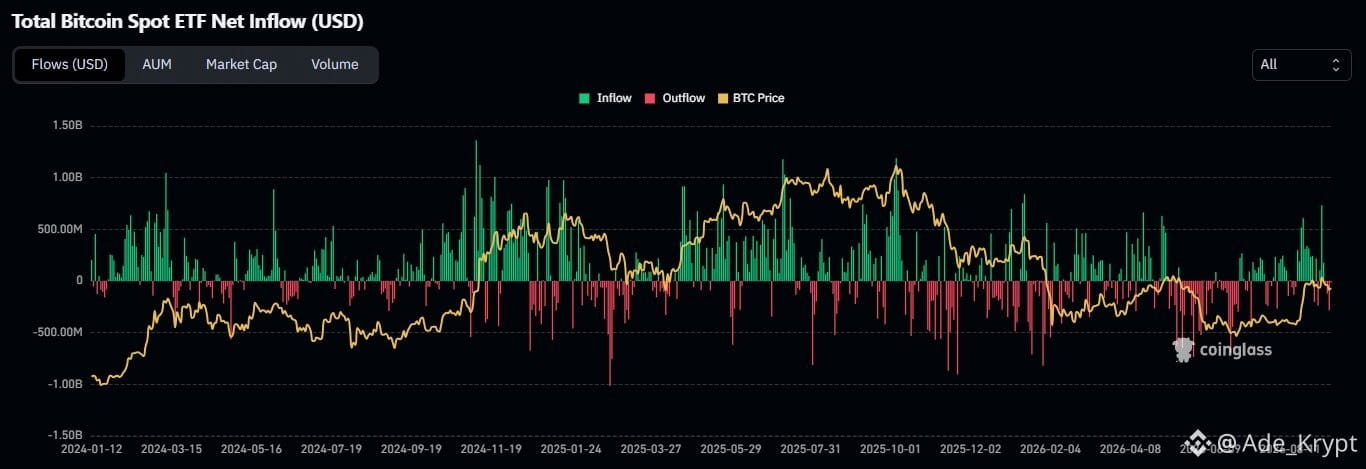
Spot Bitcoin ETF demand appears to be picking up again.
Recent data shows one of the strongest daily inflow sessions in months, yet $BTC price has barely reacted so far.
That divergence is worth monitoring. It could indicate renewed institutional accumulation while the broader market remains cautious. Still, one strong inflow day isn’t enough to confirm a trend.
If positive ETF flows continue over the coming trading sessions, Bitcoin could gain the demand needed for its next meaningful move.
#SECReceivesGrayscaleLitecoinTrustETFFiling #US10YearTreasuryYieldNears5%
Spot Bitcoin ETF demand appears to be picking up again.
Recent data shows one of the strongest daily inflow sessions in months, yet $BTC price has barely reacted so far.
That divergence is worth monitoring. It could indicate renewed institutional accumulation while the broader market remains cautious. Still, one strong inflow day isn’t enough to confirm a trend.
If positive ETF flows continue over the coming trading sessions, Bitcoin could gain the demand needed for its next meaningful move.
#SECReceivesGrayscaleLitecoinTrustETFFiling #US10YearTreasuryYieldNears5%
Recent data shows one of the strongest daily inflow sessions in months, yet $BTC price has barely reacted so far.
That divergence is worth monitoring. It could indicate renewed institutional accumulation while the broader market remains cautious. Still, one strong inflow day isn’t enough to confirm a trend.
If positive ETF flows continue over the coming trading sessions, Bitcoin could gain the demand needed for its next meaningful move.
#SECReceivesGrayscaleLitecoinTrustETFFiling #US10YearTreasuryYieldNears5%
1
317
·
--
See translation
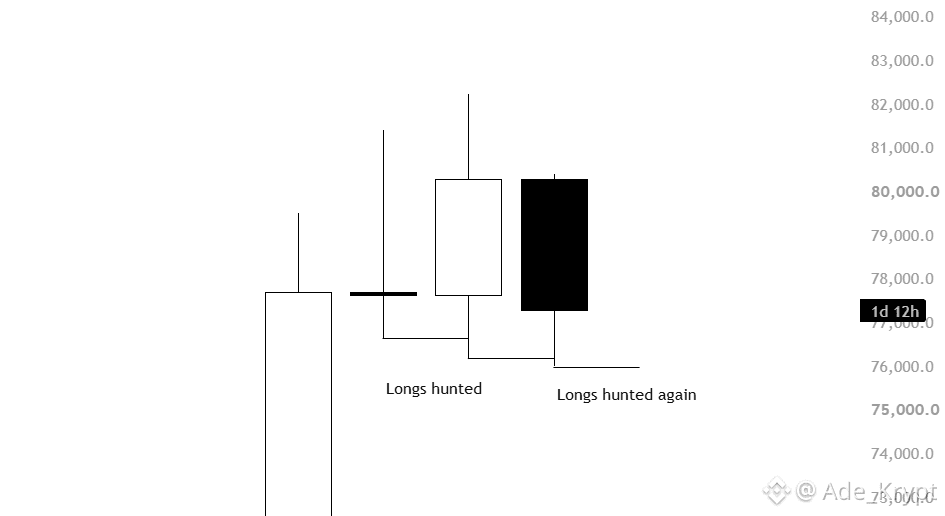
Despite the LTF chop on $BTC , the market has consistently been hunting longs below previous lows.
So the bigger question is: why keep targeting the same side?
When one side is repeatedly swept, there’s often a reason. The market may be clearing liquidity, reducing leverage, and slowly destroying confidence in longs.
Eventually, traders become conditioned to expect every dip below the lows to lead to another breakdown.
And that’s when things can change.
The final sweep can become the local bottom, followed by an expansion back toward the highs.
The idea is simple: make the eventual winning side as uncomfortable as possible. Shake them out, destroy conviction, and make them believe they’re wrong.
Repeatedly sweeping the lows after a strong impulse is exactly how that setup can develop.
#USBankCompletesCrossBorderPaymentPilotOnStellar #EtherRalliesAsBearishBetsLiquidate
Despite the LTF chop on $BTC , the market has consistently been hunting longs below previous lows.
So the bigger question is: why keep targeting the same side?
When one side is repeatedly swept, there’s often a reason. The market may be clearing liquidity, reducing leverage, and slowly destroying confidence in longs.
Eventually, traders become conditioned to expect every dip below the lows to lead to another breakdown.
And that’s when things can change.
The final sweep can become the local bottom, followed by an expansion back toward the highs.
The idea is simple: make the eventual winning side as uncomfortable as possible. Shake them out, destroy conviction, and make them believe they’re wrong.
Repeatedly sweeping the lows after a strong impulse is exactly how that setup can develop.
#USBankCompletesCrossBorderPaymentPilotOnStellar #EtherRalliesAsBearishBetsLiquidate
So the bigger question is: why keep targeting the same side?
When one side is repeatedly swept, there’s often a reason. The market may be clearing liquidity, reducing leverage, and slowly destroying confidence in longs.
Eventually, traders become conditioned to expect every dip below the lows to lead to another breakdown.
And that’s when things can change.
The final sweep can become the local bottom, followed by an expansion back toward the highs.
The idea is simple: make the eventual winning side as uncomfortable as possible. Shake them out, destroy conviction, and make them believe they’re wrong.
Repeatedly sweeping the lows after a strong impulse is exactly how that setup can develop.
#USBankCompletesCrossBorderPaymentPilotOnStellar #EtherRalliesAsBearishBetsLiquidate
149
·
--
See translation
$BTC shorts are up 2,000 points back-to-back W’s .
TP2 hit, locking in another 30% as the trade reaches around 3.7R. Now we wait patiently for the $76K area.
The plan played out almost perfectly. We called the $77K long, then flipped short around $79.5K , all in the same day.
No need to overcomplicate it. Everything was called live, and that’s what matters most.
Another solid trade secured. I hope you either caught the move or took something useful from the process.
Back to back W’s. Let’s keep it rolling.
#CPIWatch #BNBTops730USDT
$BTC shorts are up 2,000 points back-to-back W’s .
TP2 hit, locking in another 30% as the trade reaches around 3.7R. Now we wait patiently for the $76K area.
The plan played out almost perfectly. We called the $77K long, then flipped short around $79.5K , all in the same day.
No need to overcomplicate it. Everything was called live, and that’s what matters most.
Another solid trade secured. I hope you either caught the move or took something useful from the process.
Back to back W’s. Let’s keep it rolling.
#CPIWatch #BNBTops730USDT
TP2 hit, locking in another 30% as the trade reaches around 3.7R. Now we wait patiently for the $76K area.
The plan played out almost perfectly. We called the $77K long, then flipped short around $79.5K , all in the same day.
No need to overcomplicate it. Everything was called live, and that’s what matters most.
Another solid trade secured. I hope you either caught the move or took something useful from the process.
Back to back W’s. Let’s keep it rolling.
#CPIWatch #BNBTops730USDT

214
·
--
See translation
$BTC is hovering around the $76.2K previous weekly low ahead of CPI.
Honestly, this range feels pretty dead, and I expect that to continue until the CPI release.
Bitcoin is building liquidity around $76.2K, while this bounce doesn’t look very convincing. OI suggests the last dump attracted plenty of shorts, and the current move higher appears largely driven by aggressive short covering.
For today, I’m watching two scenarios after CPI (08:30 ET).
First, a sweep of the $76.2K PWL that triggers more selling and liquidates longs. I’ll look for long setups if this happens.
The second, and my preferred scenario, is a sharp CPI-driven wick below $75.5K. That could flush remaining buyers and create the liquidity needed for stronger higher-timeframe longs.
The $80K–$81K short POIs remain valid, but I don’t expect BTC to reach them today.
#CPIWatch #CLARITYActRevisionToRuleNonDeFiControllers
$BTC is hovering around the $76.2K previous weekly low ahead of CPI.
Honestly, this range feels pretty dead, and I expect that to continue until the CPI release.
Bitcoin is building liquidity around $76.2K, while this bounce doesn’t look very convincing. OI suggests the last dump attracted plenty of shorts, and the current move higher appears largely driven by aggressive short covering.
For today, I’m watching two scenarios after CPI (08:30 ET).
First, a sweep of the $76.2K PWL that triggers more selling and liquidates longs. I’ll look for long setups if this happens.
The second, and my preferred scenario, is a sharp CPI-driven wick below $75.5K. That could flush remaining buyers and create the liquidity needed for stronger higher-timeframe longs.
The $80K–$81K short POIs remain valid, but I don’t expect BTC to reach them today.
#CPIWatch #CLARITYActRevisionToRuleNonDeFiControllers
Honestly, this range feels pretty dead, and I expect that to continue until the CPI release.
Bitcoin is building liquidity around $76.2K, while this bounce doesn’t look very convincing. OI suggests the last dump attracted plenty of shorts, and the current move higher appears largely driven by aggressive short covering.
For today, I’m watching two scenarios after CPI (08:30 ET).
First, a sweep of the $76.2K PWL that triggers more selling and liquidates longs. I’ll look for long setups if this happens.
The second, and my preferred scenario, is a sharp CPI-driven wick below $75.5K. That could flush remaining buyers and create the liquidity needed for stronger higher-timeframe longs.
The $80K–$81K short POIs remain valid, but I don’t expect BTC to reach them today.
#CPIWatch #CLARITYActRevisionToRuleNonDeFiControllers

226
Log in to explore more content
Join global crypto users on Binance Square
⚡️ Get latest and useful information about crypto.
💬 Trusted by the world’s largest crypto exchange.
👍 Discover real insights from verified creators.
Email / Phone number
Trending Topics
CircleMints500MUSDCOnSolana
128,819 views
2,484 Discussing
#circlemints500musdconsolana
🚨 CIRCLE MINTS $500M USDC ON SOLANA — LIQUIDITY SIGNAL TO WATCH
Circle has minted a combined 500 million USDC on Solana across two transactions, with each transaction creating 250 million USDC.
The activity highlights continued demand for dollar-denominated liquidity on Solana, where USDC is natively supported by Circle.
KEY DETAILS
• $500M USDC minted
• Split into 2 × $250M transactions
• Network: Solana
• USDC is Circle’s dollar-backed stablecoin
• Latest activity occurred around Sept. 25–26, 2026
WHY IT MATTERS
Large stablecoin mints can increase the amount of liquidity available for trading, DeFi, payments and other on-chain activity.
However, a mint does not automatically mean $500M has entered crypto markets or will immediately flow into SOL. Circle explains that on Solana, pre-minted USDC can be held before being authorized into circulation.
So the key question for traders is what happens next:
Will this newly created USDC move toward exchanges, DeFi protocols or other Solana-based applications?
For now, the mint itself is confirmed — the eventual destination of the liquidity remains the part to watch.
$AMP $RARE $QNT
顾清妍
·1 Likes
·3.8k views
PolymarketBankFailureBetsDrawFDICConcern
116,368 views
2,067 Discussing
BlackRockBuildsTokenizedPortfoliosForOndo
112,553 views
1,473 Discussing