

#amd
amd
263,782 views
2,306 Discussing
Hot
Latest

·
--
Bullish
See translation
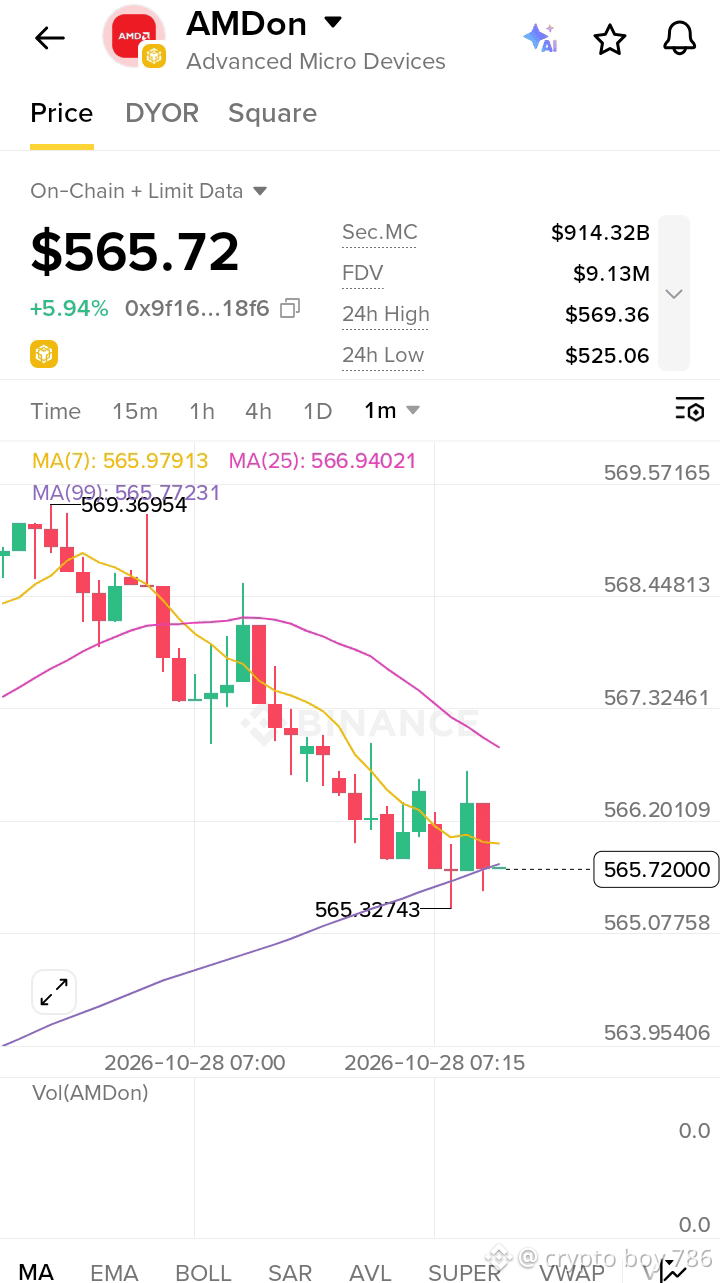
$AMD is making a strong move, trading at $566.40 with an impressive gain of 5.96%. Semiconductor stocks remain in focus as demand for AI computing and advanced chips continues to shape the technology sector. Will AMD keep climbing?
$AMD
{future}(AMDUSDT)
#OSMOPlansToBurn100MTokensFromCommunityPool #BitmineAdds10452ETH #OSMOPlansToBurn100MTokensFromCommunityPool
#AMD #Semiconductors
$AMD is making a strong move, trading at $566.40 with an impressive gain of 5.96%. Semiconductor stocks remain in focus as demand for AI computing and advanced chips continues to shape the technology sector. Will AMD keep climbing?
$AMD
#OSMOPlansToBurn100MTokensFromCommunityPool #BitmineAdds10452ETH #OSMOPlansToBurn100MTokensFromCommunityPool
#AMD #Semiconductors
$AMD
#OSMOPlansToBurn100MTokensFromCommunityPool #BitmineAdds10452ETH #OSMOPlansToBurn100MTokensFromCommunityPool
#AMD #Semiconductors
1
93



·
--
Bullish
Partly True
See translation
$AMD.US Buyers Defending the Base 😲
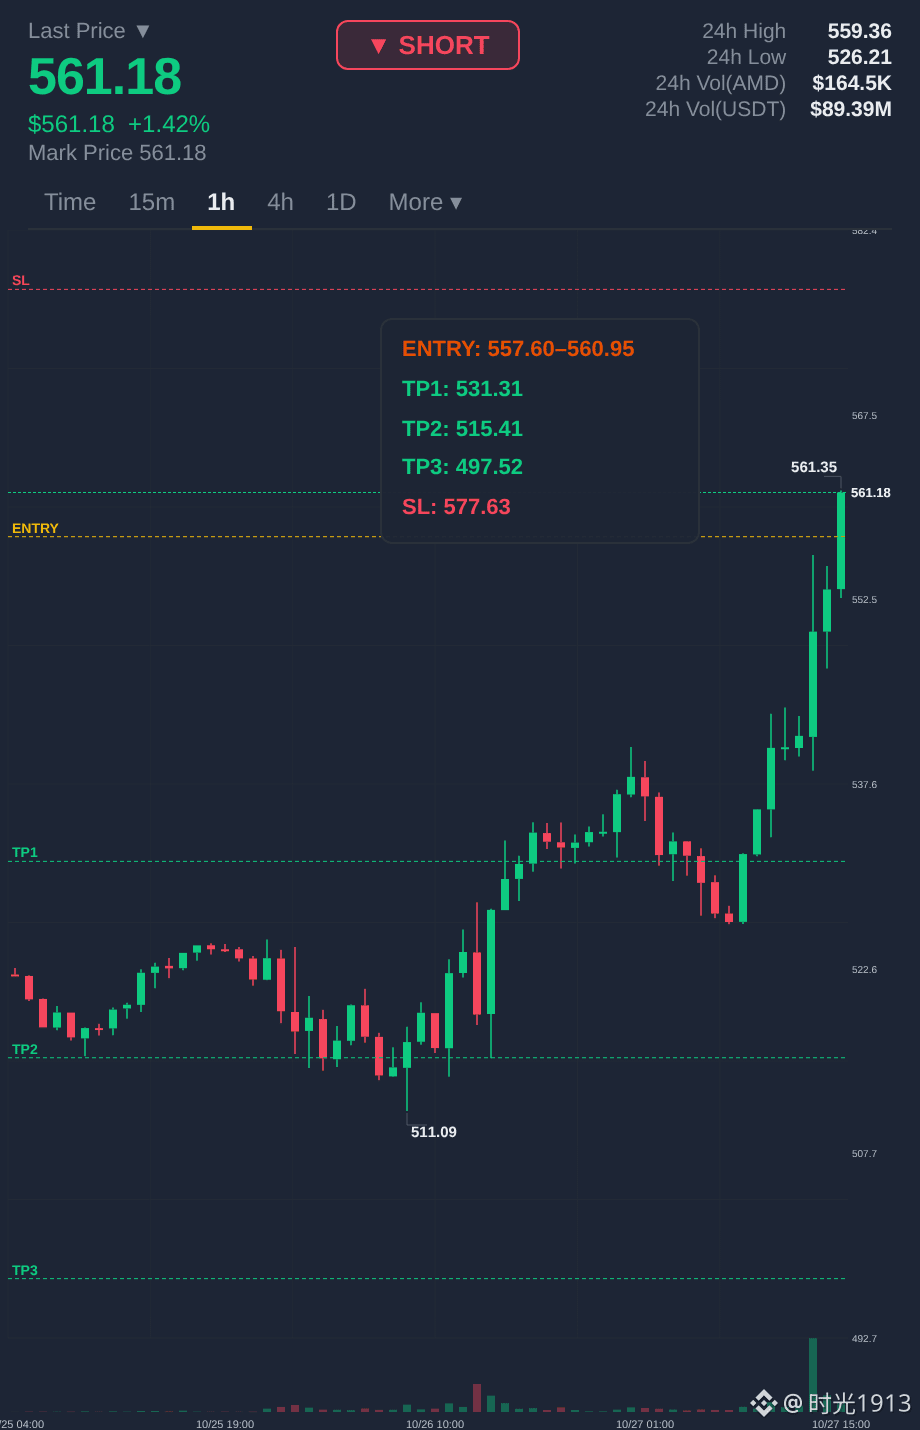
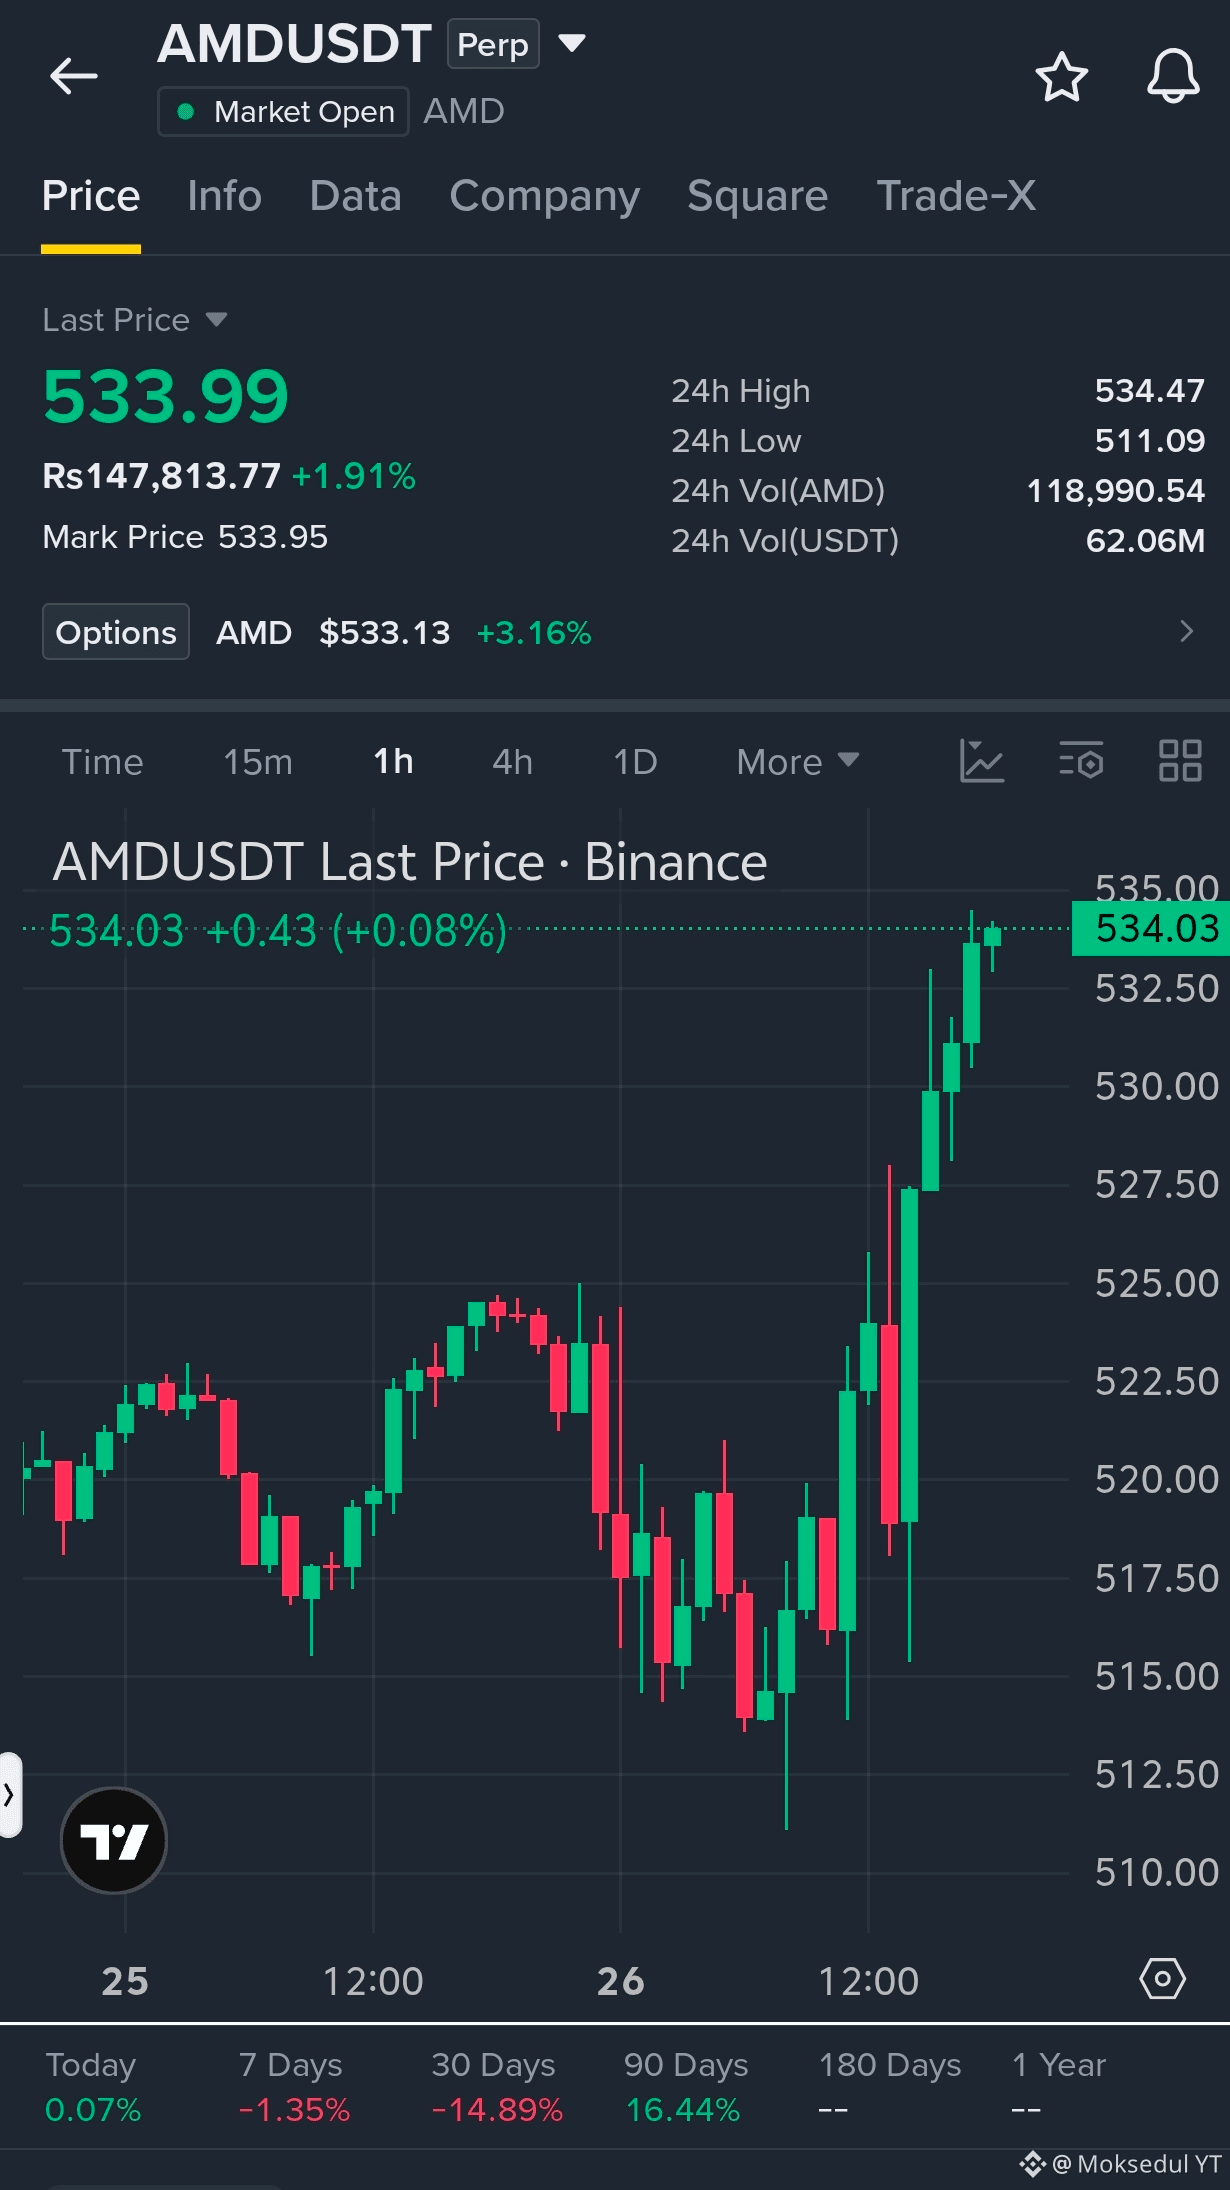
#AMD has kept its base intact above $511.09 and is now trading above $533.99. Sellers are losing grip on the structure.
A sustained move above $534.47 would confirm the next move higher.
Entry: $526.00–$533.99
TP1: $545.00
TP2: $558.00
TP3: $575.00
SL: $515.00
Buy and Trade
{stock_us}(AMD.US)
$AMD
{future}(AMDUSDT)
$BULLA
{future}(BULLAUSDT)
$AMD.US Buyers Defending the Base 😲
#AMD has kept its base intact above $511.09 and is now trading above $533.99. Sellers are losing grip on the structure.
A sustained move above $534.47 would confirm the next move higher.
Entry: $526.00–$533.99
TP1: $545.00
TP2: $558.00
TP3: $575.00
SL: $515.00
Buy and Trade
$AMD
$BULLA
#AMD has kept its base intact above $511.09 and is now trading above $533.99. Sellers are losing grip on the structure.
A sustained move above $534.47 would confirm the next move higher.
Entry: $526.00–$533.99
TP1: $545.00
TP2: $558.00
TP3: $575.00
SL: $515.00
Buy and Trade
$AMD
$BULLA
BULLA-38.54%
AMDUS+1.56%
3
652

·
--
Verified
See translation
$AMD The Hidden Cost of Covered Calls
AMD started the year around $214 and closed Friday near $517. That kind of move shows how expensive selling covered calls can become when a stock rallies hard.
Imagine buying 100 shares near $192 in early February and selling an April $220 covered call for a $10 premium per share. You collect $1,000 upfront.
But when AMD reaches $278 by April 17, your shares are called away at $220. You keep the premium, but you miss out on everything above your strike price.
Then AMD climbs further, eventually reaching $658 earlier this month.
At that peak, the difference between the market price and your $220 strike was $438 per share — or $43,800 in potential upside across 100 shares.
Even after the pullback, the gap remains substantial.
Now consider the other side of the trade. Covered calls offer only limited downside protection. If AMD falls, that $10 premium cushions the loss by just $10 per share. It doesn't prevent a much larger decline.
The takeaway: Covered calls can generate income in sideways markets, but they come with a trade-off. Your upside is capped, while most of the downside risk remains yours.
When a stock makes a powerful move, that trade-off can become very expensive.
#AMD
136


·
--
$AMD #AMD
Unusual Movement Alert: Long Alert | AMD
AMD on the 15m chart shows a 1h bullish move to watch, with 1h volume starting to pick up.
Key signals: Strong 1h candle body and higher close / Break above 1h 20-period high / Break above 1h 55-period high / 1h above VWAP / 1h above EMA8/20 / Bullish GMMA
1h trading volume: 0.8x
24h trading volume: 104.2M USDT
Funding rate: +0.0000% (longs and shorts balanced)
Score: 9/12
Key short-term level: Breakout level 571.97
Support level: 559.21
Upside levels to watch: 629.17 / 686.36
Technical tracking only. Manage risk carefully.
188

·
--
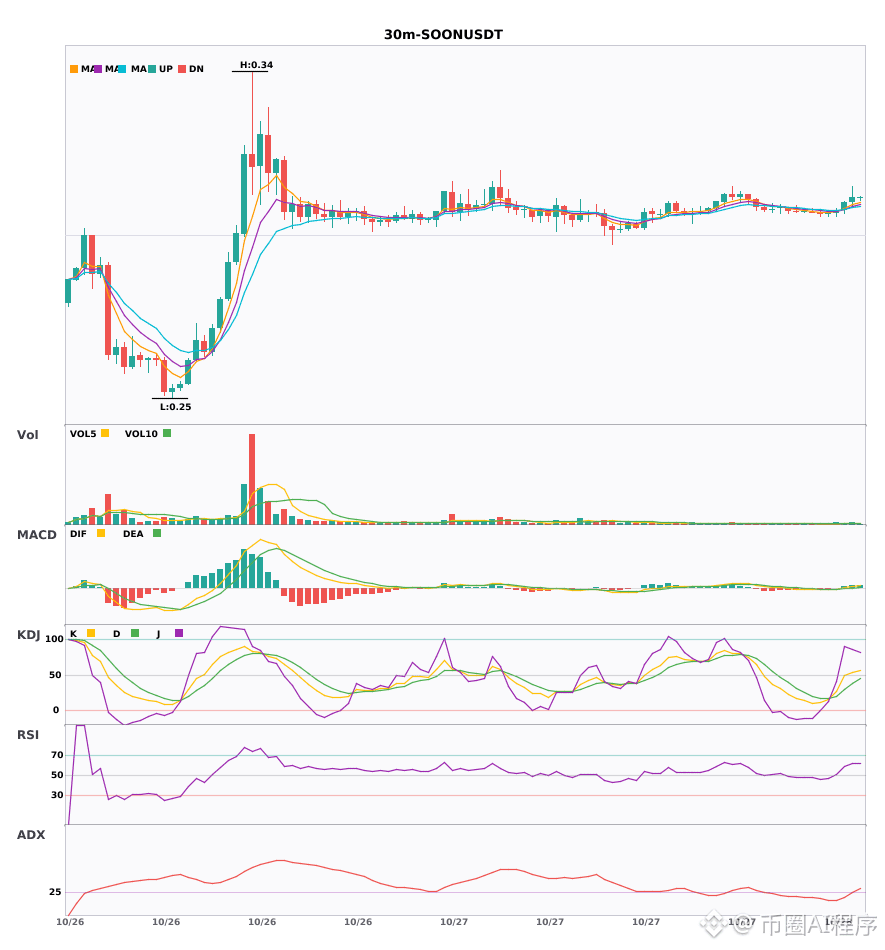
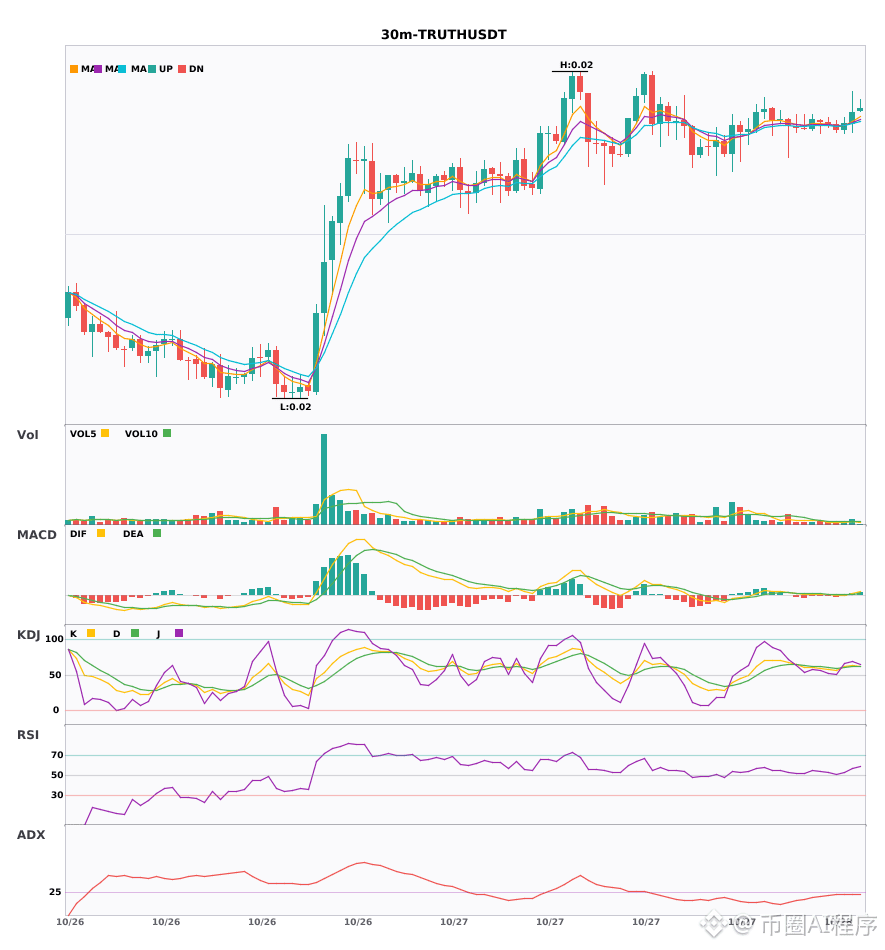
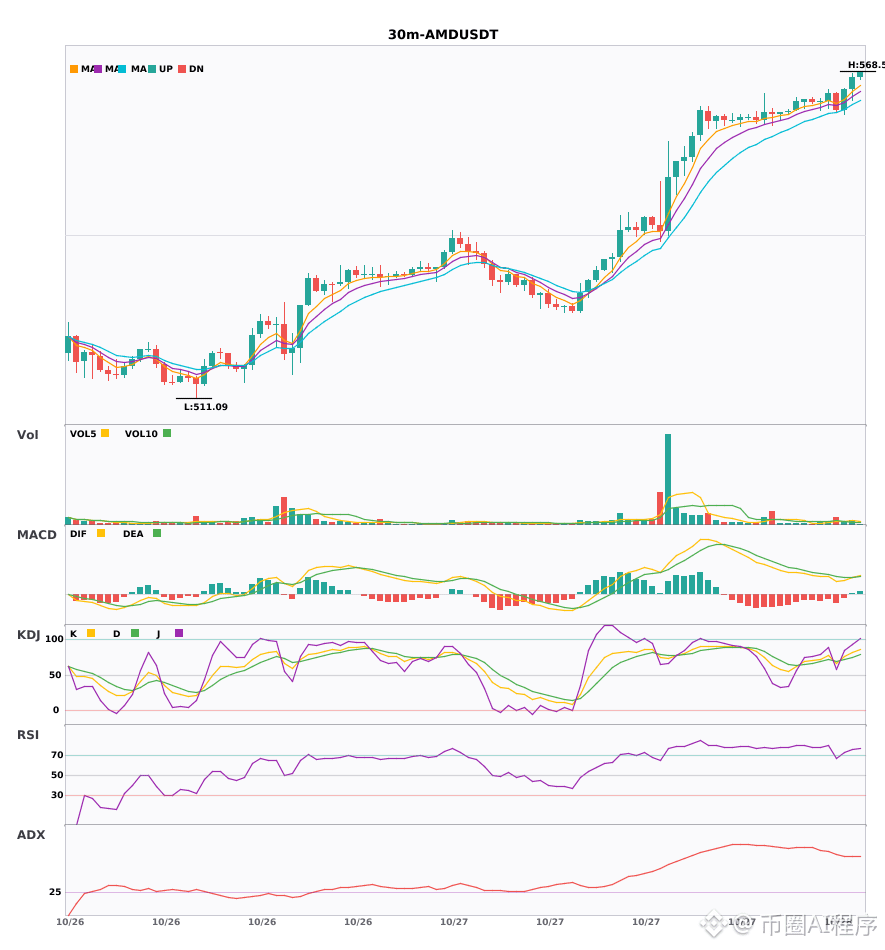
Multi-timeframe confluence: $SOON / $TRUTH / $AMD strengthening on the 30-minute chart; 4-hour bullish trend confirmed 🔥
════════════════════
🔴 $SOON 30-minute bullish signal
⚠️ Technical analysis: 4-hour bullish confluence confirmed | 30-minute entry: MACD bullish, trend strengthening, momentum increasing | EMA5 > EMA8 > EMA13, bullish alignment | Volume increased (2.3x)
════════════════════
🔴 $TRUTH 30-minute bullish signal
⚠️ Technical analysis: 4-hour bullish confluence confirmed | 30-minute entry: MACD golden cross above zero, bullish momentum releasing | EMA5 crossed above EMA8, short-term trend turning bullish | KDJ trending strongly, bulls in control (K: 64.0, D: 61.2) | Volume normal (1.4x)
════════════════════
🔴 $AMD 30-minute bullish signal
⚠️ Technical analysis: 4-hour bullish confluence confirmed | 30-minute entry: MACD golden cross above zero, bullish momentum releasing | EMA5 > EMA8 > EMA13, bullish alignment | KDJ trending strongly, bulls in control (K: 80.8, D: 74.7) | Volume increased (1.6x)
════════════════════
🔔 Follow for real-time market updates 🔔
#多周期共振 #SOON #TRUTH #AMD
📌 When trading, check whether the candlestick pattern matches
════════════════════
🔴 $SOON 30-minute bullish signal
⚠️ Technical analysis: 4-hour bullish confluence confirmed | 30-minute entry: MACD bullish, trend strengthening, momentum increasing | EMA5 > EMA8 > EMA13, bullish alignment | Volume increased (2.3x)
════════════════════
🔴 $TRUTH 30-minute bullish signal
⚠️ Technical analysis: 4-hour bullish confluence confirmed | 30-minute entry: MACD golden cross above zero, bullish momentum releasing | EMA5 crossed above EMA8, short-term trend turning bullish | KDJ trending strongly, bulls in control (K: 64.0, D: 61.2) | Volume normal (1.4x)
════════════════════
🔴 $AMD 30-minute bullish signal
⚠️ Technical analysis: 4-hour bullish confluence confirmed | 30-minute entry: MACD golden cross above zero, bullish momentum releasing | EMA5 > EMA8 > EMA13, bullish alignment | KDJ trending strongly, bulls in control (K: 80.8, D: 74.7) | Volume increased (1.6x)
════════════════════
🔔 Follow for real-time market updates 🔔
#多周期共振 #SOON #TRUTH #AMD
📌 When trading, check whether the candlestick pattern matches
31

·
--
October 28, 2026 08:19
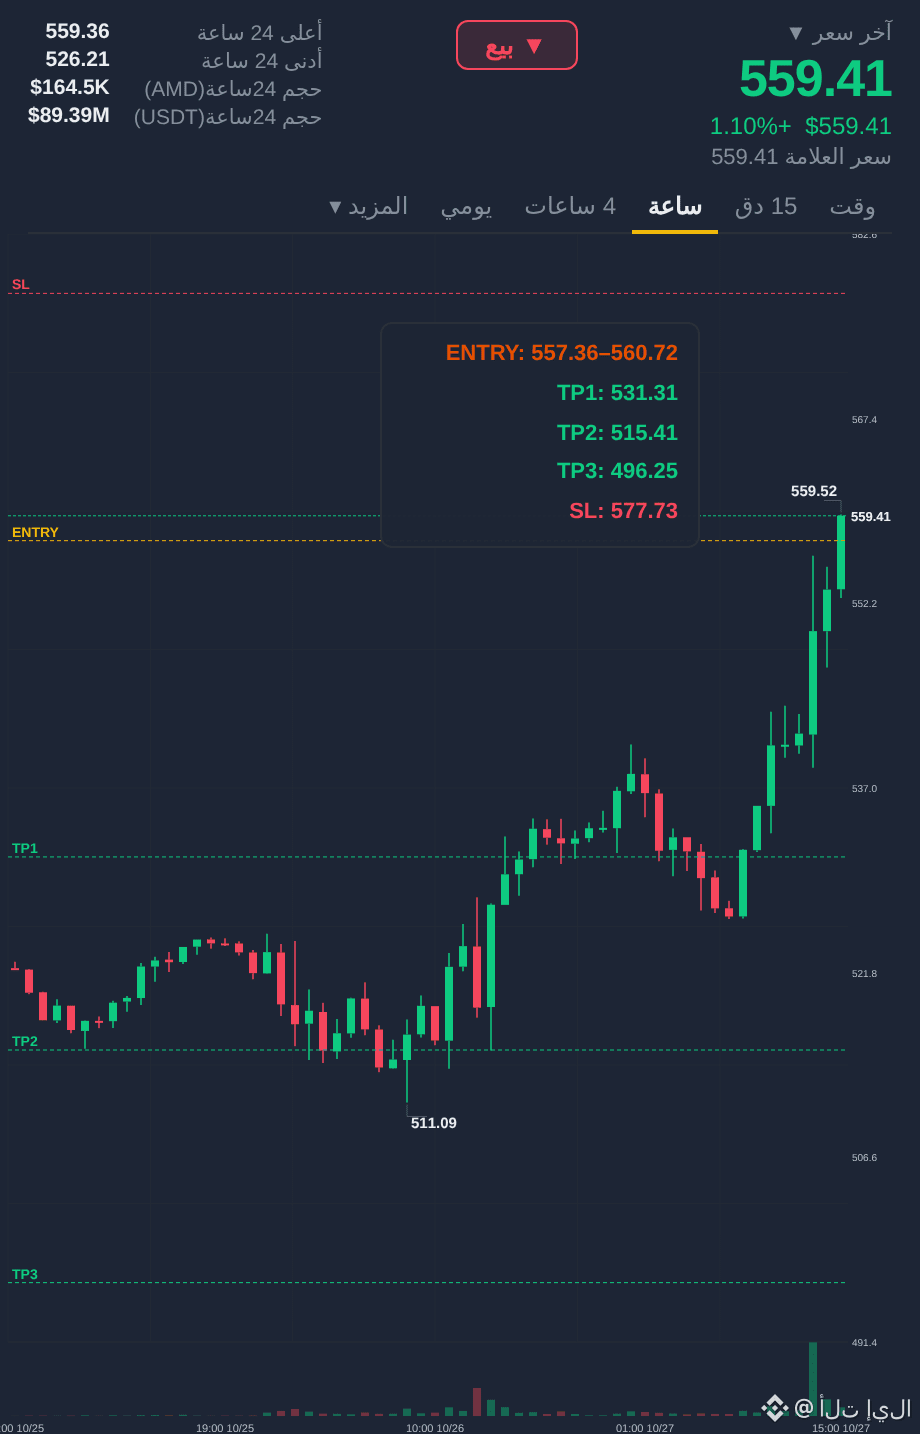
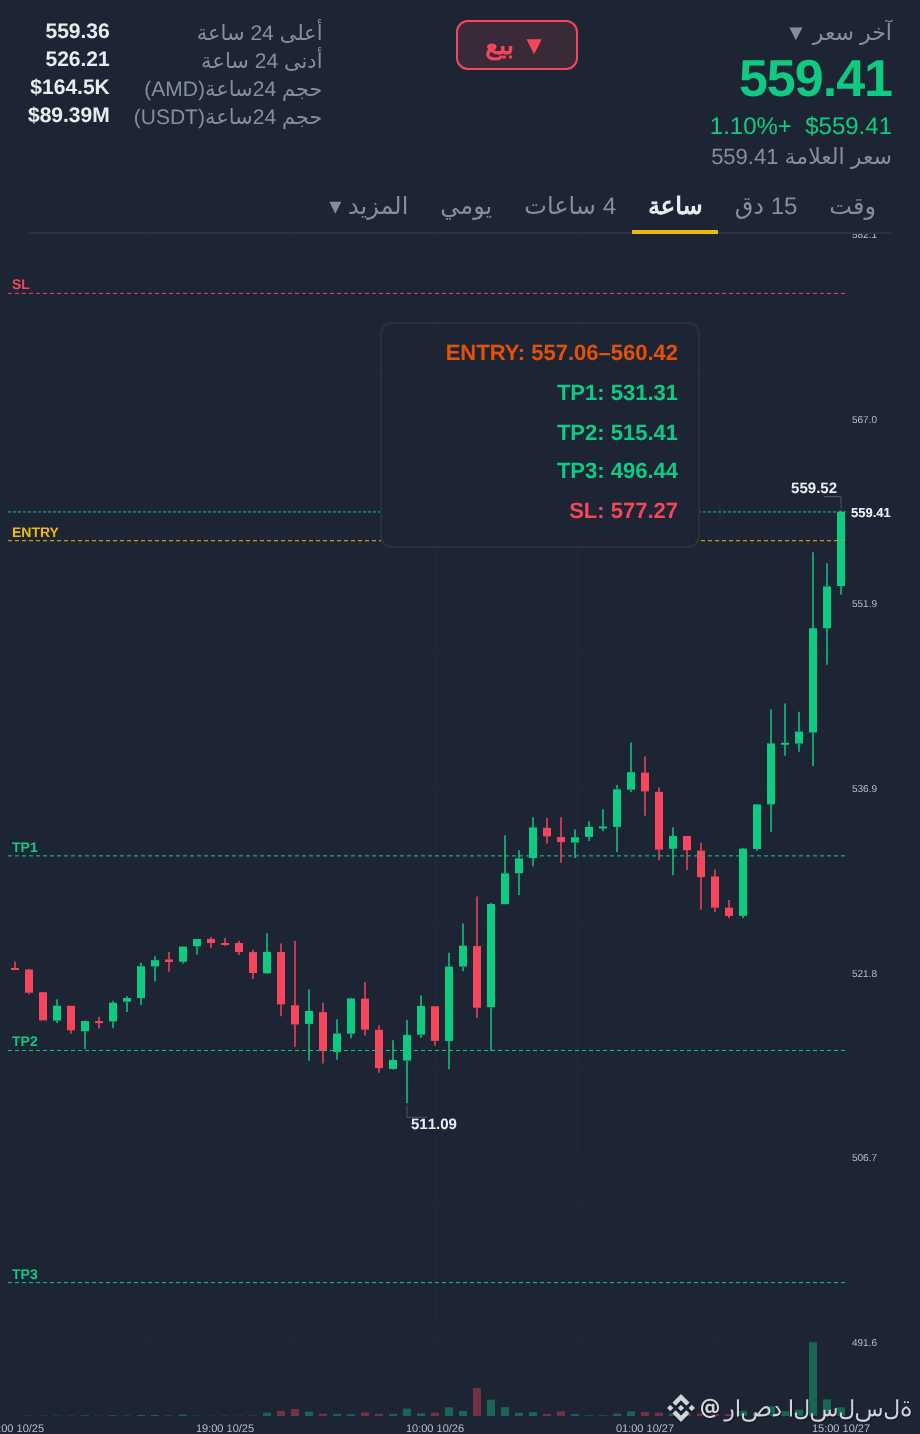
$AMD Current price: 562.06. Key levels first:
· Key resistance above: 568.84 (untested · +1.21% away)
· Key support below: 525.88 (untested · -6.44% away)
· Support zone below: 543.47-558.13, midpoint 550.8
· Bullish support band: 525.88-532.24
· Bearish resistance band: 550.29-568.84
Current capital flow is positive (strong inflow).
Structure outlook: The current price is in the bullish zone. Prefer to wait/watch · look for support around $554-$558 before going long; don't chase longs within the zone.
My view: Cautiously bullish; wait and see for now—no need to rush in.
Execution reference: Stop 555.56, target 563.62.
Recorded on October 28, 2026
For reference only; this is not investment advice. You are responsible for your own profits and losses.
I'll note this here and review once it plays out.
$AMD #资金流向 #ETH #交易笔记 #AMD



·
--
The compute arms race is heating up: chipmakers are starting to lock in customers with real money.
As reported by PANews, good.box, and others, AMD plans to invest around $1 billion in Meta and advance a strategic partnership, providing computing power for Meta’s superintelligence infrastructure. EPYC processors will support workloads related to Meta’s Muse AI agents.
How to read this: It’s a supply-and-demand tie-up, not a one-sided bet that one particular model will win. Capital spending and delivery schedules will still determine how quickly things get implemented. What’s more worth watching is whether orders materialize, the pace of data center power-ups, and how this reshapes the supply landscape for GPUs and CPUs. For most people, the more practical takeaway is to treat “big tech locking in compute together” as a barometer of AI capital spending—not to mistake partnership news for a guaranteed short-term investment opportunity.
#AMD #Meta #AI算力 #AIagents
7

AMD invests $1 billion in Meta to provide computing support for Muse AI agents. AMD will...
AMD invests $1 billion in Meta to provide powerful computing support for Muse AI agents, as the two companies work together to build superintelligence infrastructure. EPYC processors will be a powerful ally for Muse AI. Technical analysts believe this will have a far-reaching impact on the AI field.#AMD #Meta #MuseAI
AMD invests $1 billion in Meta to provide powerful computing support for Muse AI agents, as the two companies work together to build superintelligence infrastructure. EPYC processors will be a powerful ally for Muse AI. Technical analysts believe this will have a far-reaching impact on the AI field.#AMD #Meta #MuseAI

·
--
Article
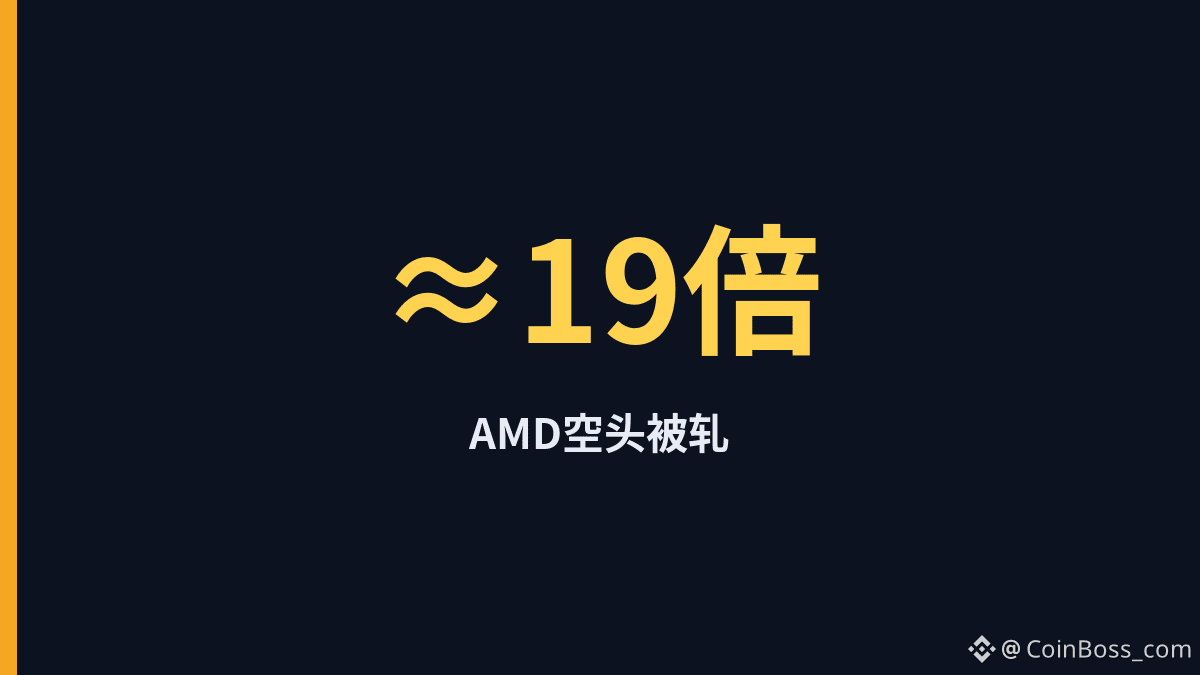
AMD rose 3.5%, but short liquidations were nearly 19 times higherAMD rose 3.5%, with about $28,000 in short liquidations versus just $1,500 in long liquidations—shorts were liquidated at about 19 times the rate.
Prices: Binance around 530.83 (+3.464%), OKX around 530.81 (+3.478%). About 10 related liquidations.
The price is still climbing, while short liquidations have reached nearly 19 times long liquidations—this looks more like a short squeeze than a two-sided wash trade.
#AMD #TradFi #爆仓 #USStocks
With a 3.5% rise and nearly 19 times more short liquidations, which do you believe: a short squeeze or a cascade of leveraged short liquidations?
View in real time: https://www.coinboss.com/tradfi-liquidations
AMD rose 3.5%, but short liquidations were nearly 19 times higher
AMD rose 3.5%, with about $28,000 in short liquidations versus just $1,500 in long liquidations—shorts were liquidated at about 19 times the rate.
Prices: Binance around 530.83 (+3.464%), OKX around 530.81 (+3.478%). About 10 related liquidations.
The price is still climbing, while short liquidations have reached nearly 19 times long liquidations—this looks more like a short squeeze than a two-sided wash trade.
#AMD #TradFi #爆仓 #USStocks
With a 3.5% rise and nearly 19 times more short liquidations, which do you believe: a short squeeze or a cascade of leveraged short liquidations?
View in real time: https://www.coinboss.com/tradfi-liquidations
1

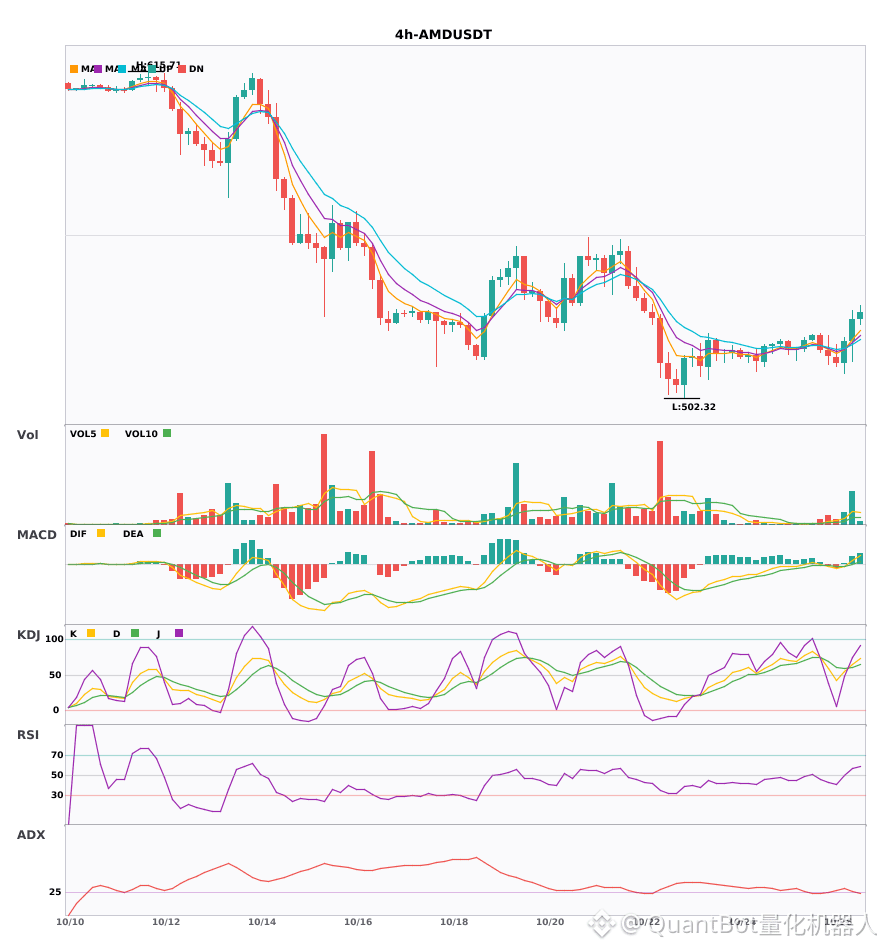
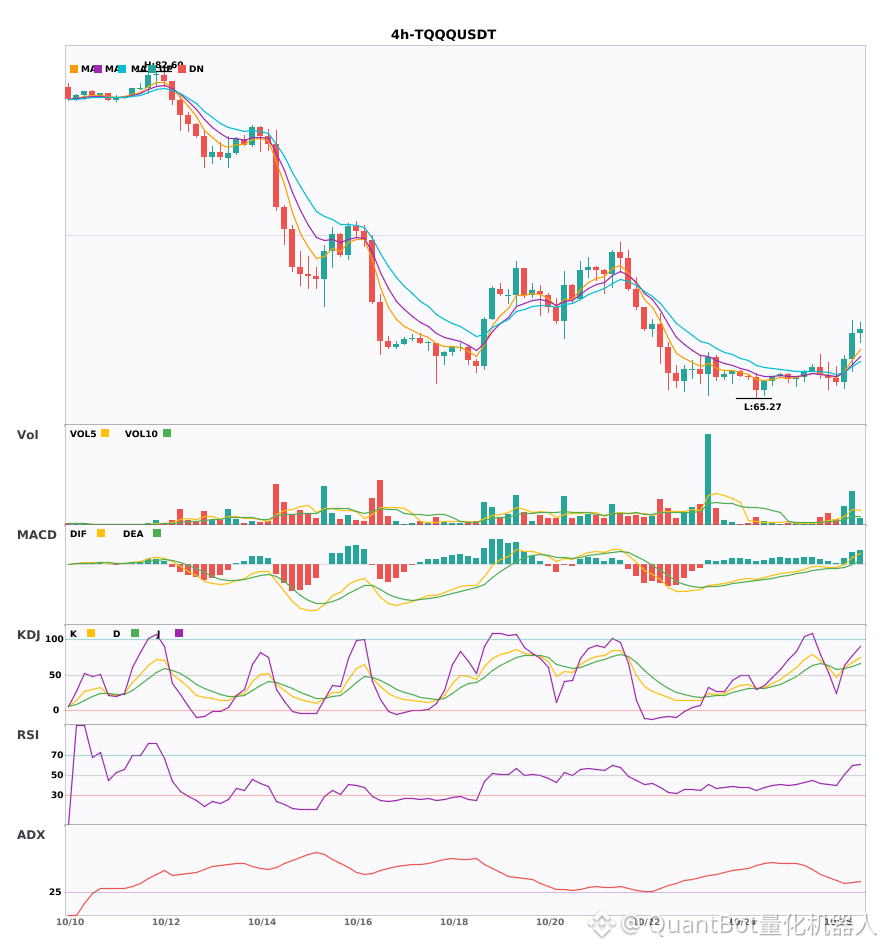
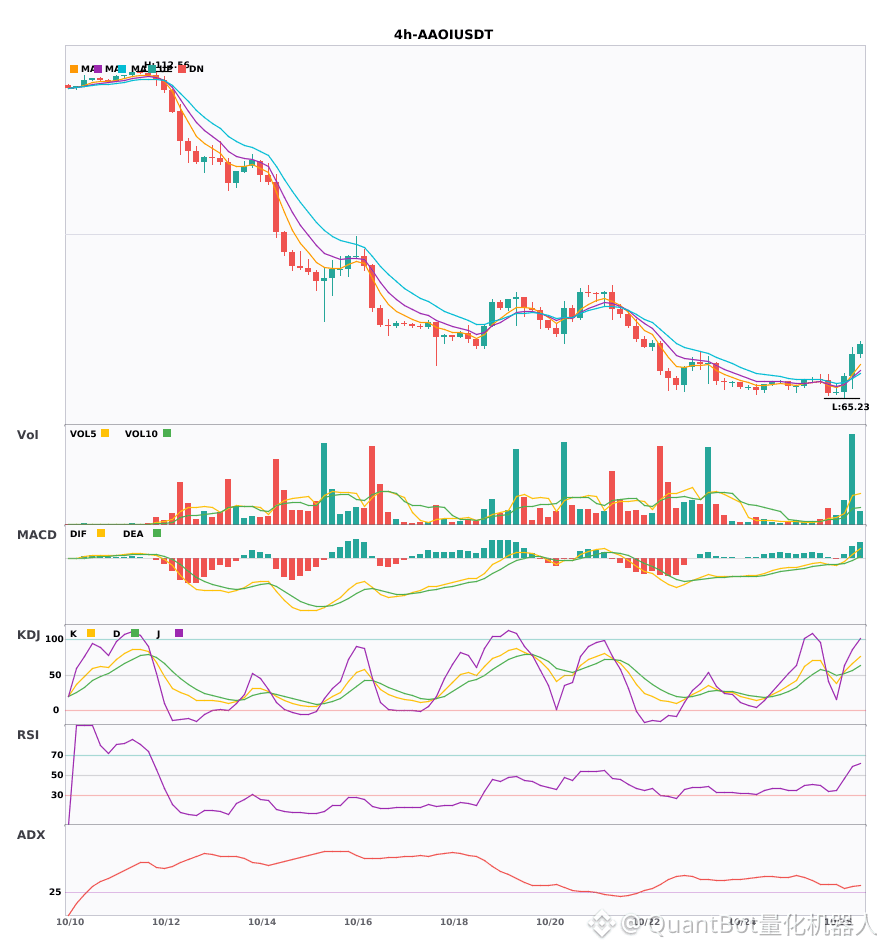
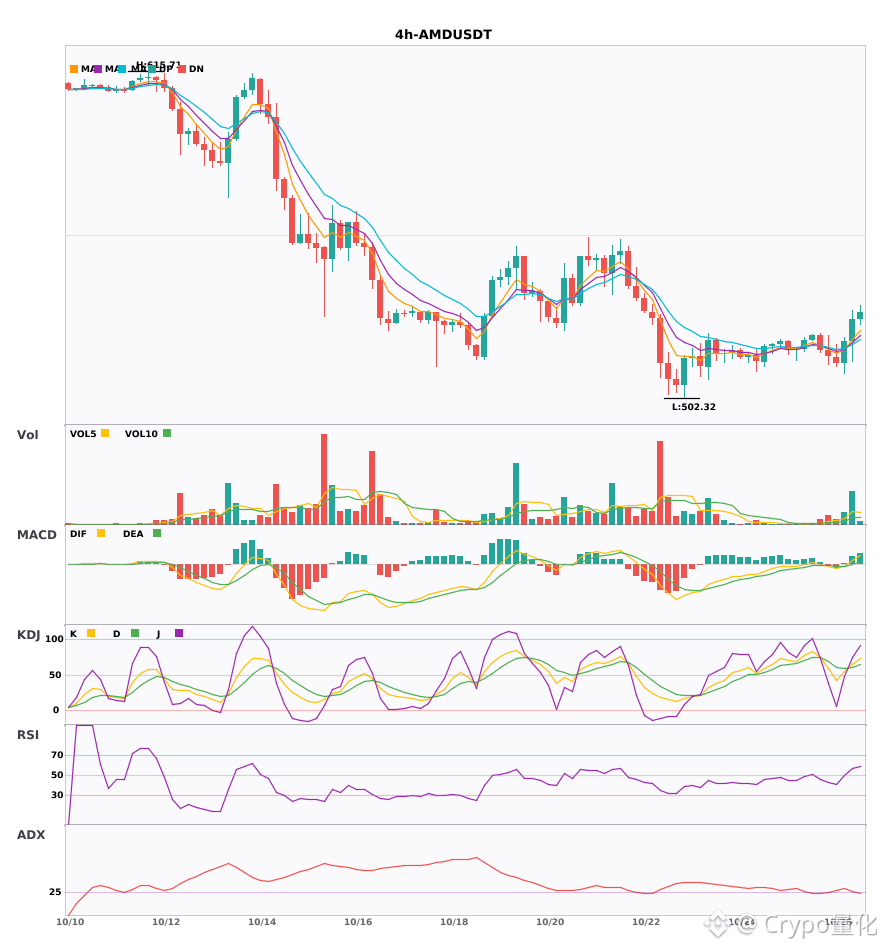
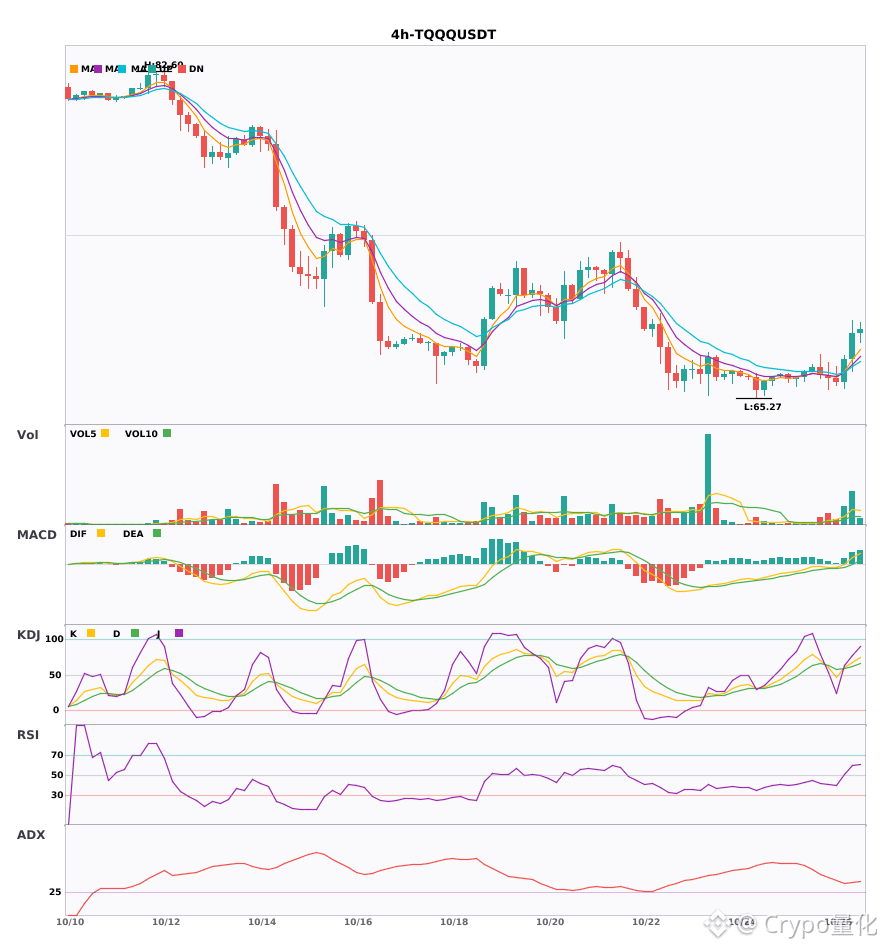
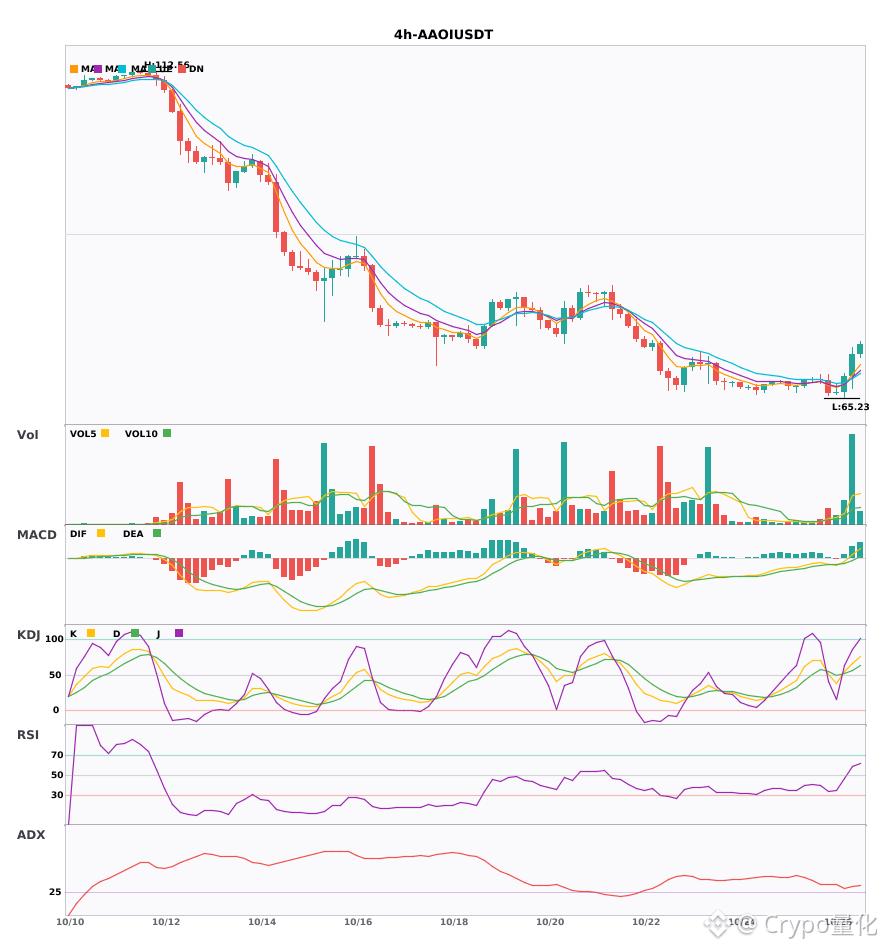
$AMD / $TQQQ / $AAOI 4-hour technical alignment is strengthening in sync, who has the greater explosive potential?
📈 $AMD | 4-hour bullish signal
━━━━━━━━━━━━━━━━━━
Technical analysis: ADX(27) trend is forming, tradable | MACDDIF breaks above the zero line, trend turns bullish | EMA5 crosses above EMA8, short-term turns bullish | KDJ golden cross, short-term bullish (K is 65.3 D is 60.8) | Volume surge (4.7x)
Price change: 1.4600%
📈 $TQQQ | 4-hour bullish signal
━━━━━━━━━━━━━━━━━━
Technical analysis: ADX(36) clear trending market | MACDDIF breaks above the zero line, trend turns bullish | EMA5 is greater than EMA8 and greater than EMA13, bullish alignment | KDJ strong upward movement, bulls in control (K is 67.0 D is 61.6) | Volume surge (4.0x)
Price change: 1.9700%
📈 $AAOI | 4-hour bullish signal
━━━━━━━━━━━━━━━━━━
Technical analysis: ADX(31) clear trending market | MACDDIF breaks above the zero line, trend turns bullish | EMA5 is greater than EMA8 and greater than EMA13, bullish alignment | KDJ strong upward movement, bulls in control (K is 66.2 D is 56.4) | Volume surge (5.6x)
Price change: 4.6700%
━━━━━━━━━━━━━━━━━━
#技术分析 #AMD #TQQQ #AAOI
📌 The above content is for reference only and does not constitute investment advice
11

·
--
$AMD / $TQQQ / $AAOI 4 hours of resonance turning bullish, bullish signals appearing at the same time 🔥
════════════════════
🔴 $AMD 4 hours bullish signal
⚠️Technical side: ADX(27) trend is forming, can participate | MACDDIF breaks above the zero axis, trend turns bullish | EMA5 crosses above EMA8, short-term turns bullish | KDJ golden cross, short-term bullish (K=65.3 D=60.8) | Volume surge (4.7x)
════════════════════
🔴 $TQQQ 4 hours bullish signal
⚠️Technical side: ADX(36) obvious trend market | MACDDIF breaks above the zero axis, trend turns bullish | EMA5 greater than EMA8 greater than EMA13 bullish alignment | KDJ running strongly, bulls have the upper hand (K=67.0 D=61.6) | Volume surge (4.0x)
════════════════════
🔴 $AAOI 4 hours bullish signal
⚠️Technical side: ADX(31) obvious trend market | MACDDIF breaks above the zero axis, trend turns bullish | EMA5 greater than EMA8 greater than EMA13 bullish alignment | KDJ running strongly, bulls have the upper hand (K=66.2 D=56.4) | Volume surge (5.6x)
════════════════════
🔔 Follow to get the latest market changes first-hand 🔔
#技术分析 #AMD #TQQQ #AAOI
📌 When trading, pay attention to whether the candlestick pattern is in line
════════════════════
🔴 $AMD 4 hours bullish signal
⚠️Technical side: ADX(27) trend is forming, can participate | MACDDIF breaks above the zero axis, trend turns bullish | EMA5 crosses above EMA8, short-term turns bullish | KDJ golden cross, short-term bullish (K=65.3 D=60.8) | Volume surge (4.7x)
════════════════════
🔴 $TQQQ 4 hours bullish signal
⚠️Technical side: ADX(36) obvious trend market | MACDDIF breaks above the zero axis, trend turns bullish | EMA5 greater than EMA8 greater than EMA13 bullish alignment | KDJ running strongly, bulls have the upper hand (K=67.0 D=61.6) | Volume surge (4.0x)
════════════════════
🔴 $AAOI 4 hours bullish signal
⚠️Technical side: ADX(31) obvious trend market | MACDDIF breaks above the zero axis, trend turns bullish | EMA5 greater than EMA8 greater than EMA13 bullish alignment | KDJ running strongly, bulls have the upper hand (K=66.2 D=56.4) | Volume surge (5.6x)
════════════════════
🔔 Follow to get the latest market changes first-hand 🔔
#技术分析 #AMD #TQQQ #AAOI
📌 When trading, pay attention to whether the candlestick pattern is in line
28
·
--
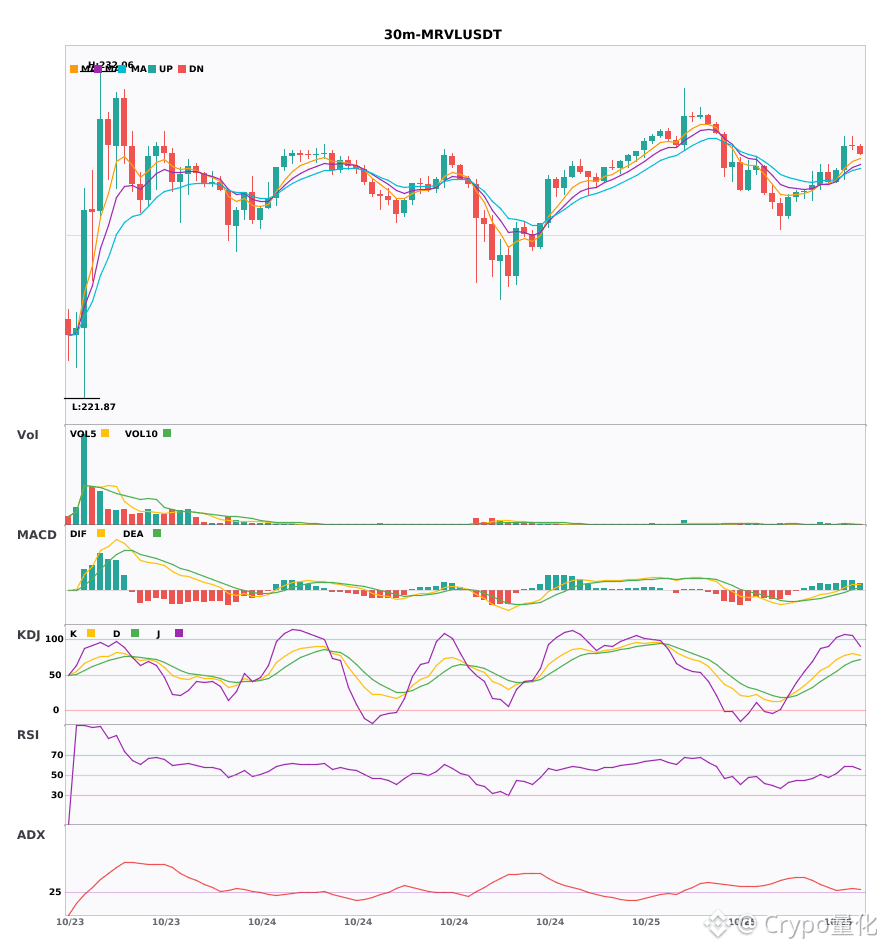
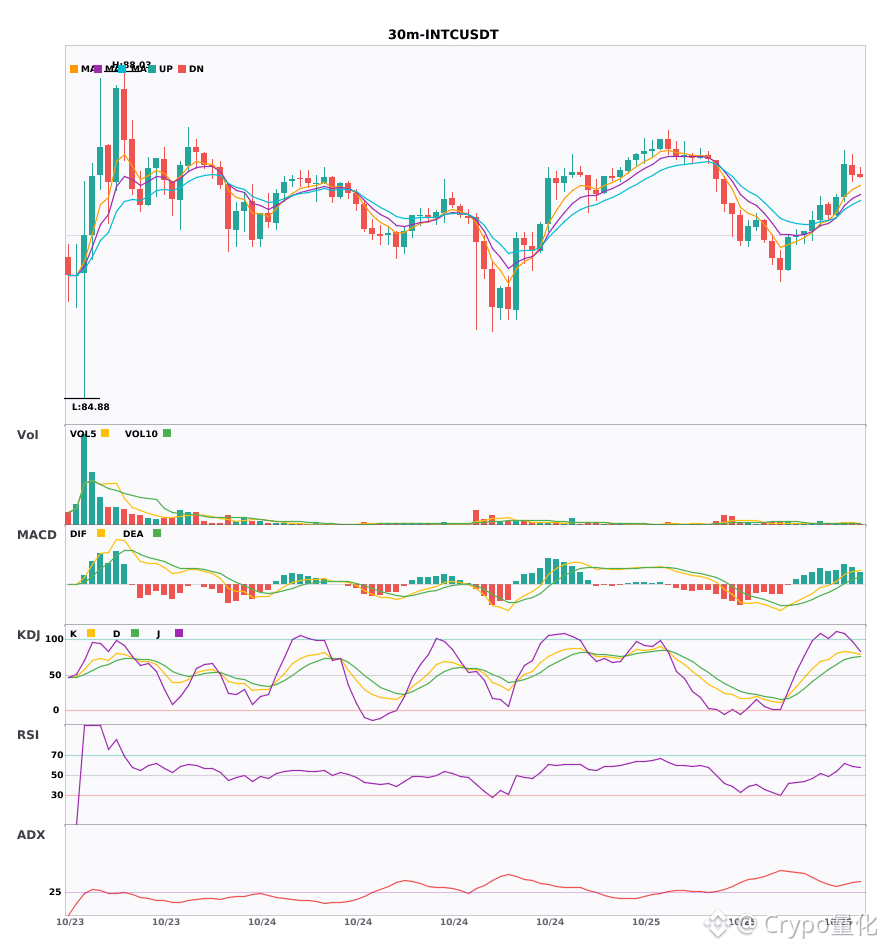
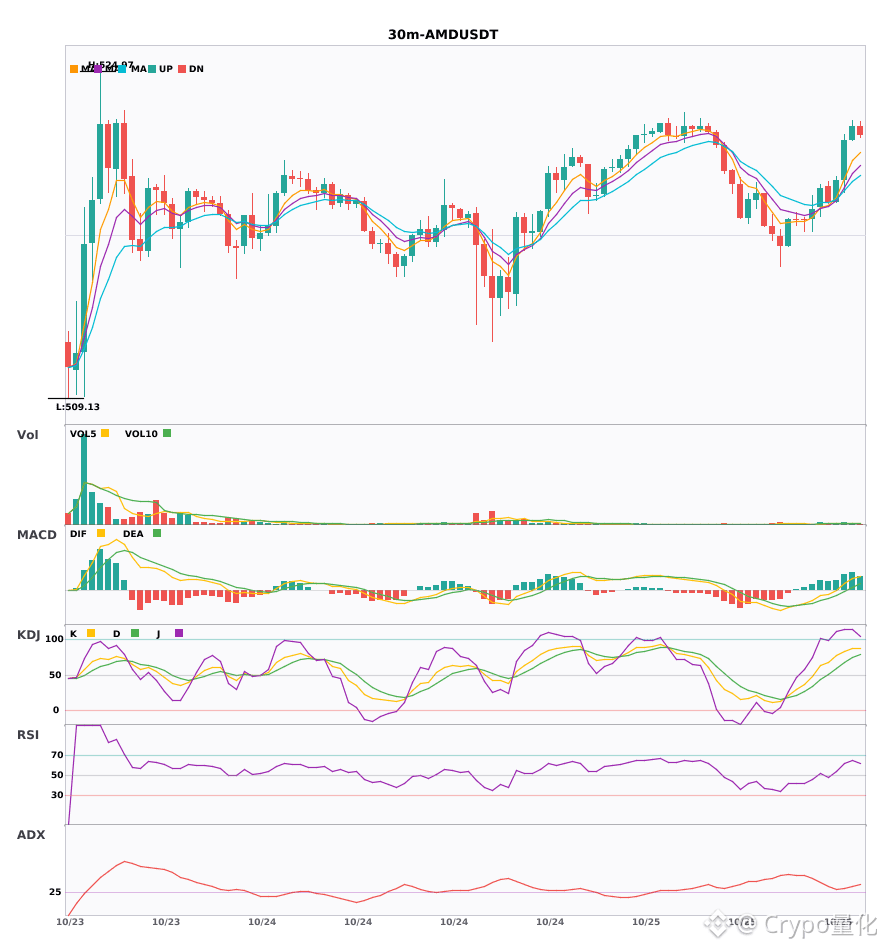
$MRVL / $INTC / $AMD — Technical indicators are strengthening in sync on the 30-minute chart. Which has the greatest breakout potential? 🔥
════════════════════
🔴 $MRVL — 30-minute bullish signals
⚠️ Technicals: ADX (29): Trend is forming; potential entry | MACD DIF breaks above the zero line, signaling a bullish trend | EMA5 > EMA8 > EMA13: bullish alignment | KDJ is strong, with bulls in control (K = 77.4, D = 62.6) | Volume increased (1.6x)
════════════════════
🔴 $INTC — 30-minute bullish signals
⚠️ Technicals: ADX (37): Clear trending market | MACD is bullish, with a strong trend and increasing momentum | EMA5 > EMA8 > EMA13: bullish alignment | KDJ is strong, with bulls in control (K = 83.3, D = 71.1) | Volume increased (1.6x)
════════════════════
🔴 $AMD — 30-minute bullish signals
⚠️ Technicals: ADX (31): Clear trending market | MACD is bullish, with a strong trend and increasing momentum | EMA5 > EMA8 > EMA13: bullish alignment | KDJ is strong, with bulls in control (K = 83.1, D = 67.5) | Volume increased (1.9x)
════════════════════
🔔 Follow for the latest market movements 🔔
#技术分析 #MRVL #INTC #AMD
📌 When trading, watch for whether the candlestick pattern confirms the signal.
════════════════════
🔴 $MRVL — 30-minute bullish signals
⚠️ Technicals: ADX (29): Trend is forming; potential entry | MACD DIF breaks above the zero line, signaling a bullish trend | EMA5 > EMA8 > EMA13: bullish alignment | KDJ is strong, with bulls in control (K = 77.4, D = 62.6) | Volume increased (1.6x)
════════════════════
🔴 $INTC — 30-minute bullish signals
⚠️ Technicals: ADX (37): Clear trending market | MACD is bullish, with a strong trend and increasing momentum | EMA5 > EMA8 > EMA13: bullish alignment | KDJ is strong, with bulls in control (K = 83.3, D = 71.1) | Volume increased (1.6x)
════════════════════
🔴 $AMD — 30-minute bullish signals
⚠️ Technicals: ADX (31): Clear trending market | MACD is bullish, with a strong trend and increasing momentum | EMA5 > EMA8 > EMA13: bullish alignment | KDJ is strong, with bulls in control (K = 83.1, D = 67.5) | Volume increased (1.9x)
════════════════════
🔔 Follow for the latest market movements 🔔
#技术分析 #MRVL #INTC #AMD
📌 When trading, watch for whether the candlestick pattern confirms the signal.
13
·
--
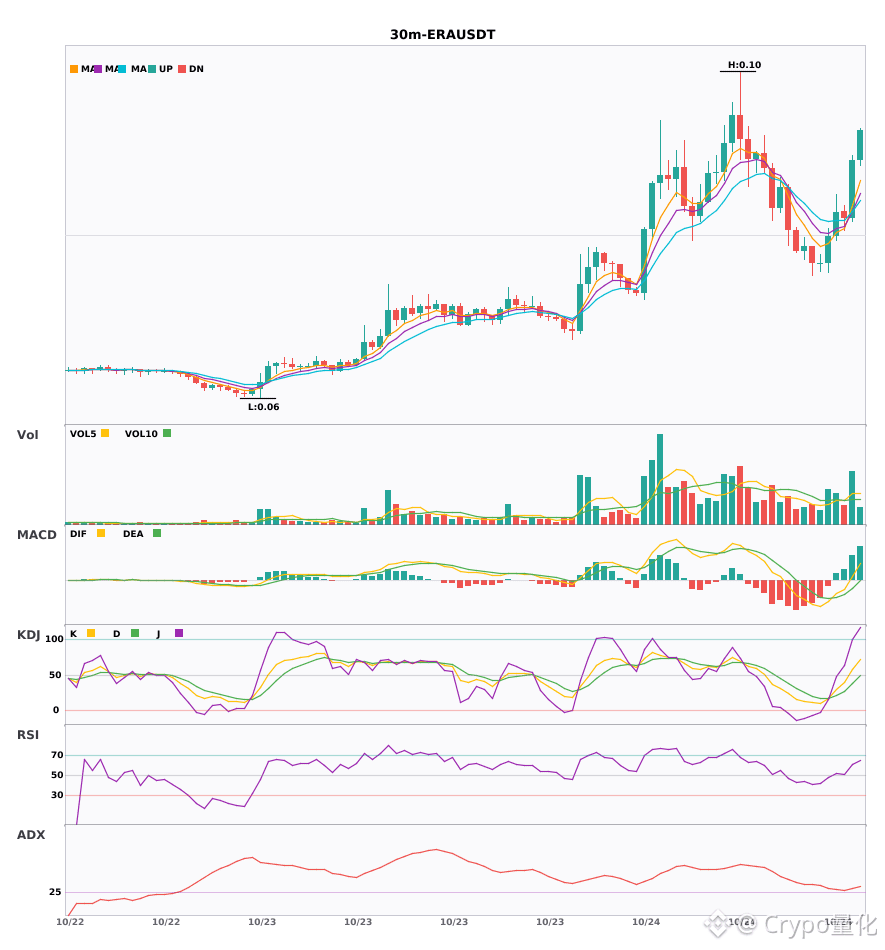
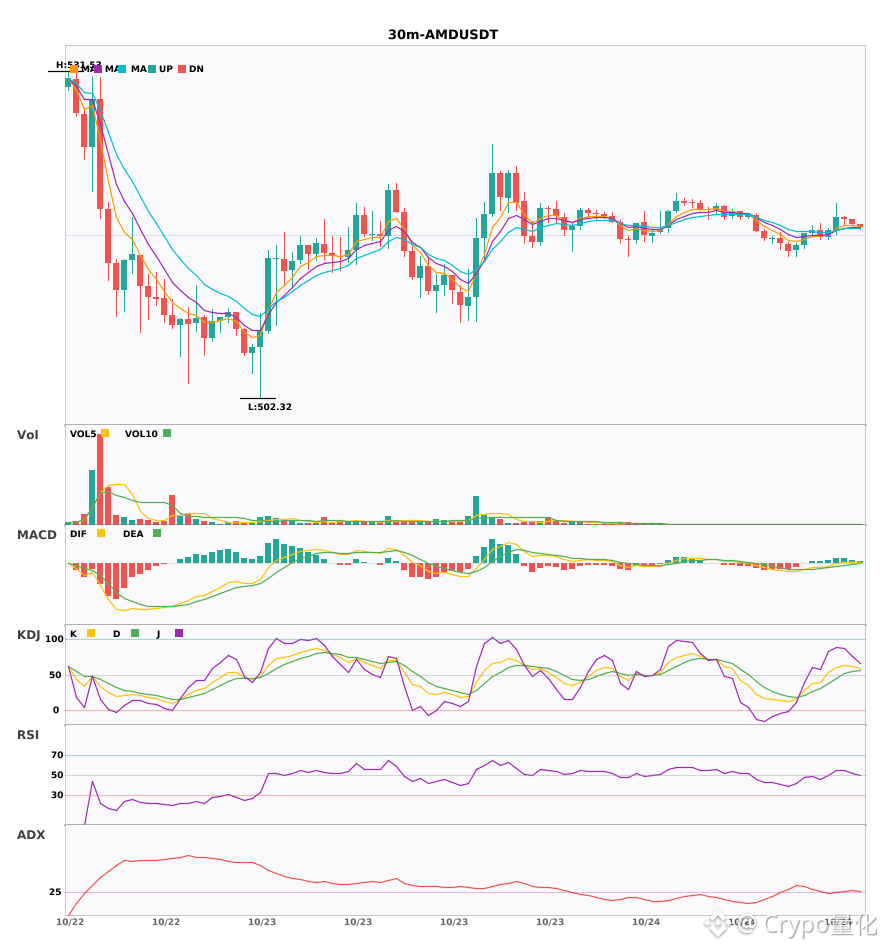
Two 30-minute bullish signals have appeared simultaneously: $ERA / $AMD🔥
════════════════════
🔴 $ERA 30-minute bullish signal
⚠️ Technicals: ADX (30) — trend is forming; potential opportunity to participate | MACD DIF breaks above the zero line, turning the trend bullish | EMA5 crosses above EMA8, turning short-term momentum bullish | Volume expands (2.0x)
════════════════════
🔴 $AMD 30-minute bullish signal
⚠️ Technicals: ADX (29) — trend is forming; potential opportunity to participate | MACD is bullish; trend is relatively strong, but momentum is weakening | EMA5 > EMA8 > EMA13, bullish alignment | KDJ is trending strongly, with bulls in control (K: 63.3, D: 51.6) | Volume expands (1.8x)
════════════════════
🔔 Follow for the latest market movements 🔔
#技术分析 #ERA #AMD
📌 When trading, pay attention to whether the candlestick pattern meets your criteria
Two 30-minute bullish signals have appeared simultaneously: $ERA / $AMD 🔥
════════════════════
🔴 $ERA 30-minute bullish signal
⚠️ Technicals: ADX (30) — trend is forming; potential opportunity to participate | MACD DIF breaks above the zero line, turning the trend bullish | EMA5 crosses above EMA8, turning short-term momentum bullish | Volume expands (2.0x)
════════════════════
🔴 $AMD 30-minute bullish signal
⚠️ Technicals: ADX (29) — trend is forming; potential opportunity to participate | MACD is bullish; trend is relatively strong, but momentum is weakening | EMA5 > EMA8 > EMA13, bullish alignment | KDJ is trending strongly, with bulls in control (K: 63.3, D: 51.6) | Volume expands (1.8x)
════════════════════
🔔 Follow for the latest market movements 🔔
#技术分析 #ERA #AMD
📌 When trading, pay attention to whether the candlestick pattern meets your criteria
════════════════════
🔴 $ERA 30-minute bullish signal
⚠️ Technicals: ADX (30) — trend is forming; potential opportunity to participate | MACD DIF breaks above the zero line, turning the trend bullish | EMA5 crosses above EMA8, turning short-term momentum bullish | Volume expands (2.0x)
════════════════════
🔴 $AMD 30-minute bullish signal
⚠️ Technicals: ADX (29) — trend is forming; potential opportunity to participate | MACD is bullish; trend is relatively strong, but momentum is weakening | EMA5 > EMA8 > EMA13, bullish alignment | KDJ is trending strongly, with bulls in control (K: 63.3, D: 51.6) | Volume expands (1.8x)
════════════════════
🔔 Follow for the latest market movements 🔔
#技术分析 #ERA #AMD
📌 When trading, pay attention to whether the candlestick pattern meets your criteria
3

See translation
The Quiet Bounce That Hinted Buyers Aren’t Fully Done with #AMD 🤔
AMD was swept into the broader AI-chip selloff alongside Nvidia as financing costs and capex worries hit the entire infrastructure trade. Investors treated it as one of the clearest public alternatives to Nvidia, so the pullback directly tested its data-center growth story.
{spot}(AMDBUSDT)
{spot}(NVDABUSDT)
Yet the official ticker showed a modest 0.41% rebound to $510.99, suggesting some buyers stepped in after the weakness. The next catalysts remain customer adoption, accelerator supply, and cloud-capex plans that will decide whether AI spending fears ease or keep pressure on valuations.
$AMD $NVDA $NVDAB #CoinVahini #AIChips #Semiconductors
The Quiet Bounce That Hinted Buyers Aren’t Fully Done with #AMD 🤔
AMD was swept into the broader AI-chip selloff alongside Nvidia as financing costs and capex worries hit the entire infrastructure trade. Investors treated it as one of the clearest public alternatives to Nvidia, so the pullback directly tested its data-center growth story.
Yet the official ticker showed a modest 0.41% rebound to $510.99, suggesting some buyers stepped in after the weakness. The next catalysts remain customer adoption, accelerator supply, and cloud-capex plans that will decide whether AI spending fears ease or keep pressure on valuations.
$AMD $NVDA $NVDAB #CoinVahini #AIChips #Semiconductors
3

·
--
Bearish
See translation
AMD is around $507.93, down about 6.6% today.
The AI opportunity is still real: AMD’s data-center revenue more than doubled year over year last quarter. But after a sharp drop from its October high, traders may want proof that growth can keep accelerating. Next earnings are November 3.
My lean: cautiously BEARISH into earnings—the chart needs to stabilize before I’d call this dip a clear buying opportunity.
Would you buy the pullback, or wait for AMD’s results?
#AMD #Aİ #Semiconductors #TechStocks #stockmark
69

·
--
See translation
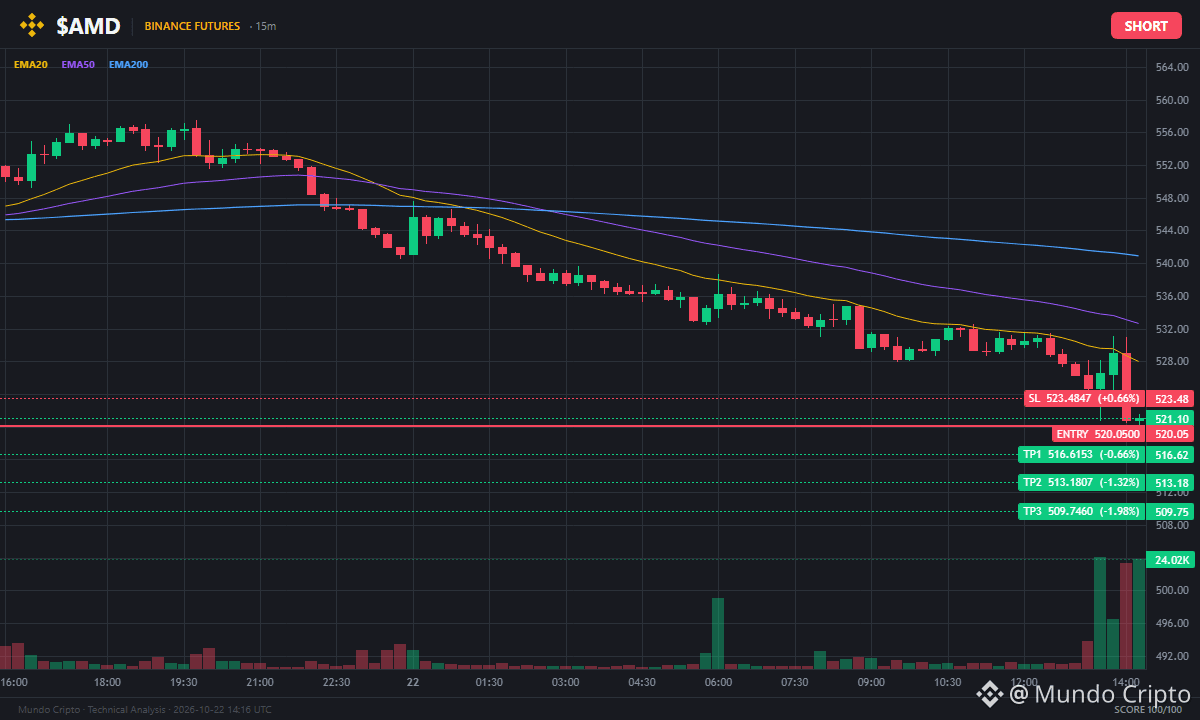
📉 SHORT SETUP — $AMD
Buyers unable to defend key levels. The breakdown is in play.
Entry: $518.75 - $521.35
TP: $516.62 - $513.18 - $509.75 - $506.31 - $501.16 - $492.57
SL: $523.48
Risk management is everything. Not financial advice.
#AMD #MundoCripto #Crypto #Trading
📉 SHORT SETUP — $AMD
Buyers unable to defend key levels. The breakdown is in play.
Entry: $518.75 - $521.35
TP: $516.62 - $513.18 - $509.75 - $506.31 - $501.16 - $492.57
SL: $523.48
Risk management is everything. Not financial advice.
#AMD #MundoCripto #Crypto #Trading
Buyers unable to defend key levels. The breakdown is in play.
Entry: $518.75 - $521.35
TP: $516.62 - $513.18 - $509.75 - $506.31 - $501.16 - $492.57
SL: $523.48
Risk management is everything. Not financial advice.
#AMD #MundoCripto #Crypto #Trading
265
Log in to explore more content
Join global crypto users on Binance Square
⚡️ Get latest and useful information about crypto.
💬 Trusted by the world’s largest crypto exchange.
👍 Discover real insights from verified creators.
Email / Phone number
Trending Topics
1
#CanMicrosoftDeliverOnAI
214,106 views
1,816 Discussing
2
#CanGoogleDefindItsCore
118,960 views
1,328 Discussing
3
#EarningsSeason
5.8M views
27,776 Discussing
4
#DatavaultAICantWithdrawBitcoinFromBiconomy
170 views
26 Discussing
5
#FOMCWatch
9.2M views
29,032 Discussing
6
#HKPlacesTokenizedFundSecondaryTradingUnderETFLikeFramework
427 views
24 Discussing
7
#USGovSellsFTXLinkedAnthropicSharesFor$627M
701 views
27 Discussing
8
#MoodysAssignsRLUSDA2LongTermDepositRating
5,031 views
191 Discussing
9
#SKHynixUnveils$45BShareholderReturns
1,002 views
24 Discussing
10
#OSMOPlansToBurn100MTokensFromCommunityPool
13,123 views
366 Discussing