
#technicalanalysiss
technicalanalysiss
1.1M views
4,088 Discussing
Hot
Latest

·
--
See translation
$BTC
BTC/USDT MARKET OUTLOOK: BEARS ARE PRESSURING BITCOIN, BUT THE WEEKLY TREND REMAINS INTERESTING!
Market date: November 7, 2026
Asset: Bitcoin (BTC/USDT)
Reference price: $76,042
1. Market structure
Bitcoin is showing mixed signals across different timeframes.
The 4-hour chart has a strong bearish bias, while the daily outlook is neutral and the weekly trend remains bullish.
This suggests that short-term sellers are in control, but the broader market has not completely lost its bullish structure.
2. Technical indicators
- Daily RSI: 38.7
- 4H RSI: 40.3
- Daily trend: Neutral
- 4H trend: Bearish
- Weekly trend: Bullish
Momentum is relatively weak, so buyers need to demonstrate renewed strength before a sustained recovery can be confirmed.
3. Important support and resistance
Resistance levels:
- R1: $76,365
- R2: $78,174
- R3: $79,692
Support levels:
- S1: $74,850
- S2: $73,238
- S3: $70,161
4. My trading strategy
BEARISH SCENARIO 📉
If BTC breaks below $74,850 on a daily closing basis and fails to reclaim that level, further downside towards $73,238 becomes possible.
BULLISH SCENARIO 📈
If Bitcoin closes above $76,365 and successfully retests that level as support, buyers could target $78,174 and potentially $79,692.
5. My market conclusion
I am currently watching the $74,850 support and $76,365 resistance zones.
I prefer waiting for confirmation instead of entering trades based on emotions.
The market is presenting opportunities, but risk management remains essential.
Let's discuss:
Do you think Bitcoin will reclaim $76,365 and move higher, or will sellers push BTC below $74,850?
Share your analysis in the comments.
#BTCUSDT.P #CryptoAnalysis📈📉🐋📅🚀 #BinanceSquare #TechnicalAnalysiss #cryptotrading
$BTC
BTC/USDT MARKET OUTLOOK: BEARS ARE PRESSURING BITCOIN, BUT THE WEEKLY TREND REMAINS INTERESTING!
Market date: November 7, 2026
Asset: Bitcoin (BTC/USDT)
Reference price: $76,042
1. Market structure
Bitcoin is showing mixed signals across different timeframes.
The 4-hour chart has a strong bearish bias, while the daily outlook is neutral and the weekly trend remains bullish.
This suggests that short-term sellers are in control, but the broader market has not completely lost its bullish structure.
2. Technical indicators
- Daily RSI: 38.7
- 4H RSI: 40.3
- Daily trend: Neutral
- 4H trend: Bearish
- Weekly trend: Bullish
Momentum is relatively weak, so buyers need to demonstrate renewed strength before a sustained recovery can be confirmed.
3. Important support and resistance
Resistance levels:
- R1: $76,365
- R2: $78,174
- R3: $79,692
Support levels:
- S1: $74,850
- S2: $73,238
- S3: $70,161
4. My trading strategy
BEARISH SCENARIO 📉
If BTC breaks below $74,850 on a daily closing basis and fails to reclaim that level, further downside towards $73,238 becomes possible.
BULLISH SCENARIO 📈
If Bitcoin closes above $76,365 and successfully retests that level as support, buyers could target $78,174 and potentially $79,692.
5. My market conclusion
I am currently watching the $74,850 support and $76,365 resistance zones.
I prefer waiting for confirmation instead of entering trades based on emotions.
The market is presenting opportunities, but risk management remains essential.
Let's discuss:
Do you think Bitcoin will reclaim $76,365 and move higher, or will sellers push BTC below $74,850?
Share your analysis in the comments.
#BTCUSDT.P #CryptoAnalysis📈📉🐋📅🚀 #BinanceSquare #TechnicalAnalysiss #cryptotrading
BTC/USDT MARKET OUTLOOK: BEARS ARE PRESSURING BITCOIN, BUT THE WEEKLY TREND REMAINS INTERESTING!
Market date: November 7, 2026
Asset: Bitcoin (BTC/USDT)
Reference price: $76,042
1. Market structure
Bitcoin is showing mixed signals across different timeframes.
The 4-hour chart has a strong bearish bias, while the daily outlook is neutral and the weekly trend remains bullish.
This suggests that short-term sellers are in control, but the broader market has not completely lost its bullish structure.
2. Technical indicators
- Daily RSI: 38.7
- 4H RSI: 40.3
- Daily trend: Neutral
- 4H trend: Bearish
- Weekly trend: Bullish
Momentum is relatively weak, so buyers need to demonstrate renewed strength before a sustained recovery can be confirmed.
3. Important support and resistance
Resistance levels:
- R1: $76,365
- R2: $78,174
- R3: $79,692
Support levels:
- S1: $74,850
- S2: $73,238
- S3: $70,161
4. My trading strategy
BEARISH SCENARIO 📉
If BTC breaks below $74,850 on a daily closing basis and fails to reclaim that level, further downside towards $73,238 becomes possible.
BULLISH SCENARIO 📈
If Bitcoin closes above $76,365 and successfully retests that level as support, buyers could target $78,174 and potentially $79,692.
5. My market conclusion
I am currently watching the $74,850 support and $76,365 resistance zones.
I prefer waiting for confirmation instead of entering trades based on emotions.
The market is presenting opportunities, but risk management remains essential.
Let's discuss:
Do you think Bitcoin will reclaim $76,365 and move higher, or will sellers push BTC below $74,850?
Share your analysis in the comments.
#BTCUSDT.P #CryptoAnalysis📈📉🐋📅🚀 #BinanceSquare #TechnicalAnalysiss #cryptotrading
49

See translation
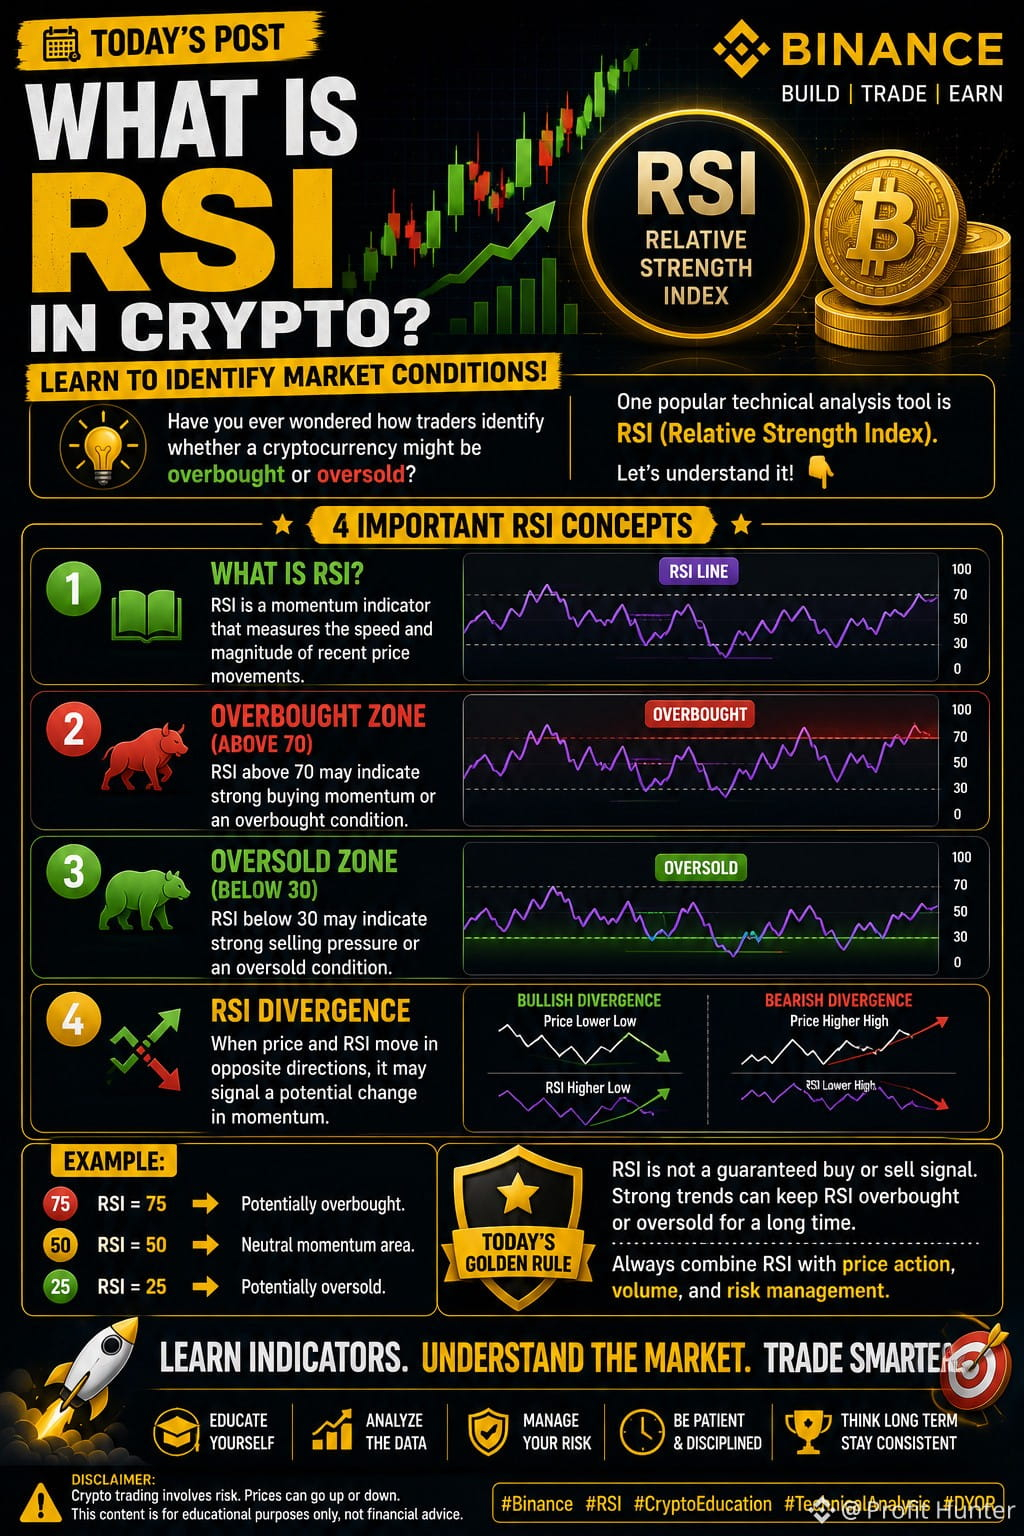
📊 WHAT IS RSI IN CRYPTO? LEARN TO IDENTIFY MARKET CONDITIONS!
Have you ever wondered how traders identify whether a cryptocurrency might be overbought or oversold?
One popular technical analysis tool is RSI (Relative Strength Index).
Let's understand it! 👇
🔥 4 IMPORTANT RSI CONCEPTS:
🔹 1. What Is RSI?
RSI is a momentum indicator that measures the speed and magnitude of recent price movements.
🔹 2. Overbought Zone (Above 70)
RSI above 70 may indicate strong buying momentum or an overbought condition.
🔹 3. Oversold Zone (Below 30)
RSI below 30 may indicate strong selling pressure or an oversold condition.
🔹 4. RSI Divergence
When price and RSI move in opposite directions, it may signal a potential change in momentum.
💡 EXAMPLE:
- RSI = 75 → Potentially overbought.
- RSI = 50 → Neutral momentum area.
- RSI = 25 → Potentially oversold.
⚠️ TODAY'S GOLDEN RULE:
RSI is not a guaranteed buy or sell signal. Strong trends can keep RSI overbought or oversold for a long time.
Always combine RSI with price action, volume, and risk management.
🚀 Learn Indicators. Understand the Market. Trade Smarter!
#TechnicalAnalysiss #CryptoEducation #tradingtips #learncrypto
📊 WHAT IS RSI IN CRYPTO? LEARN TO IDENTIFY MARKET CONDITIONS!
Have you ever wondered how traders identify whether a cryptocurrency might be overbought or oversold?
One popular technical analysis tool is RSI (Relative Strength Index).
Let's understand it! 👇
🔥 4 IMPORTANT RSI CONCEPTS:
🔹 1. What Is RSI?
RSI is a momentum indicator that measures the speed and magnitude of recent price movements.
🔹 2. Overbought Zone (Above 70)
RSI above 70 may indicate strong buying momentum or an overbought condition.
🔹 3. Oversold Zone (Below 30)
RSI below 30 may indicate strong selling pressure or an oversold condition.
🔹 4. RSI Divergence
When price and RSI move in opposite directions, it may signal a potential change in momentum.
💡 EXAMPLE:
- RSI = 75 → Potentially overbought.
- RSI = 50 → Neutral momentum area.
- RSI = 25 → Potentially oversold.
⚠️ TODAY'S GOLDEN RULE:
RSI is not a guaranteed buy or sell signal. Strong trends can keep RSI overbought or oversold for a long time.
Always combine RSI with price action, volume, and risk management.
🚀 Learn Indicators. Understand the Market. Trade Smarter!
#TechnicalAnalysiss #CryptoEducation #tradingtips #learncrypto
Have you ever wondered how traders identify whether a cryptocurrency might be overbought or oversold?
One popular technical analysis tool is RSI (Relative Strength Index).
Let's understand it! 👇
🔥 4 IMPORTANT RSI CONCEPTS:
🔹 1. What Is RSI?
RSI is a momentum indicator that measures the speed and magnitude of recent price movements.
🔹 2. Overbought Zone (Above 70)
RSI above 70 may indicate strong buying momentum or an overbought condition.
🔹 3. Oversold Zone (Below 30)
RSI below 30 may indicate strong selling pressure or an oversold condition.
🔹 4. RSI Divergence
When price and RSI move in opposite directions, it may signal a potential change in momentum.
💡 EXAMPLE:
- RSI = 75 → Potentially overbought.
- RSI = 50 → Neutral momentum area.
- RSI = 25 → Potentially oversold.
⚠️ TODAY'S GOLDEN RULE:
RSI is not a guaranteed buy or sell signal. Strong trends can keep RSI overbought or oversold for a long time.
Always combine RSI with price action, volume, and risk management.
🚀 Learn Indicators. Understand the Market. Trade Smarter!
#TechnicalAnalysiss #CryptoEducation #tradingtips #learncrypto
69

·
--
Bearish
Holding $BNB 4.7 USDT
See translation
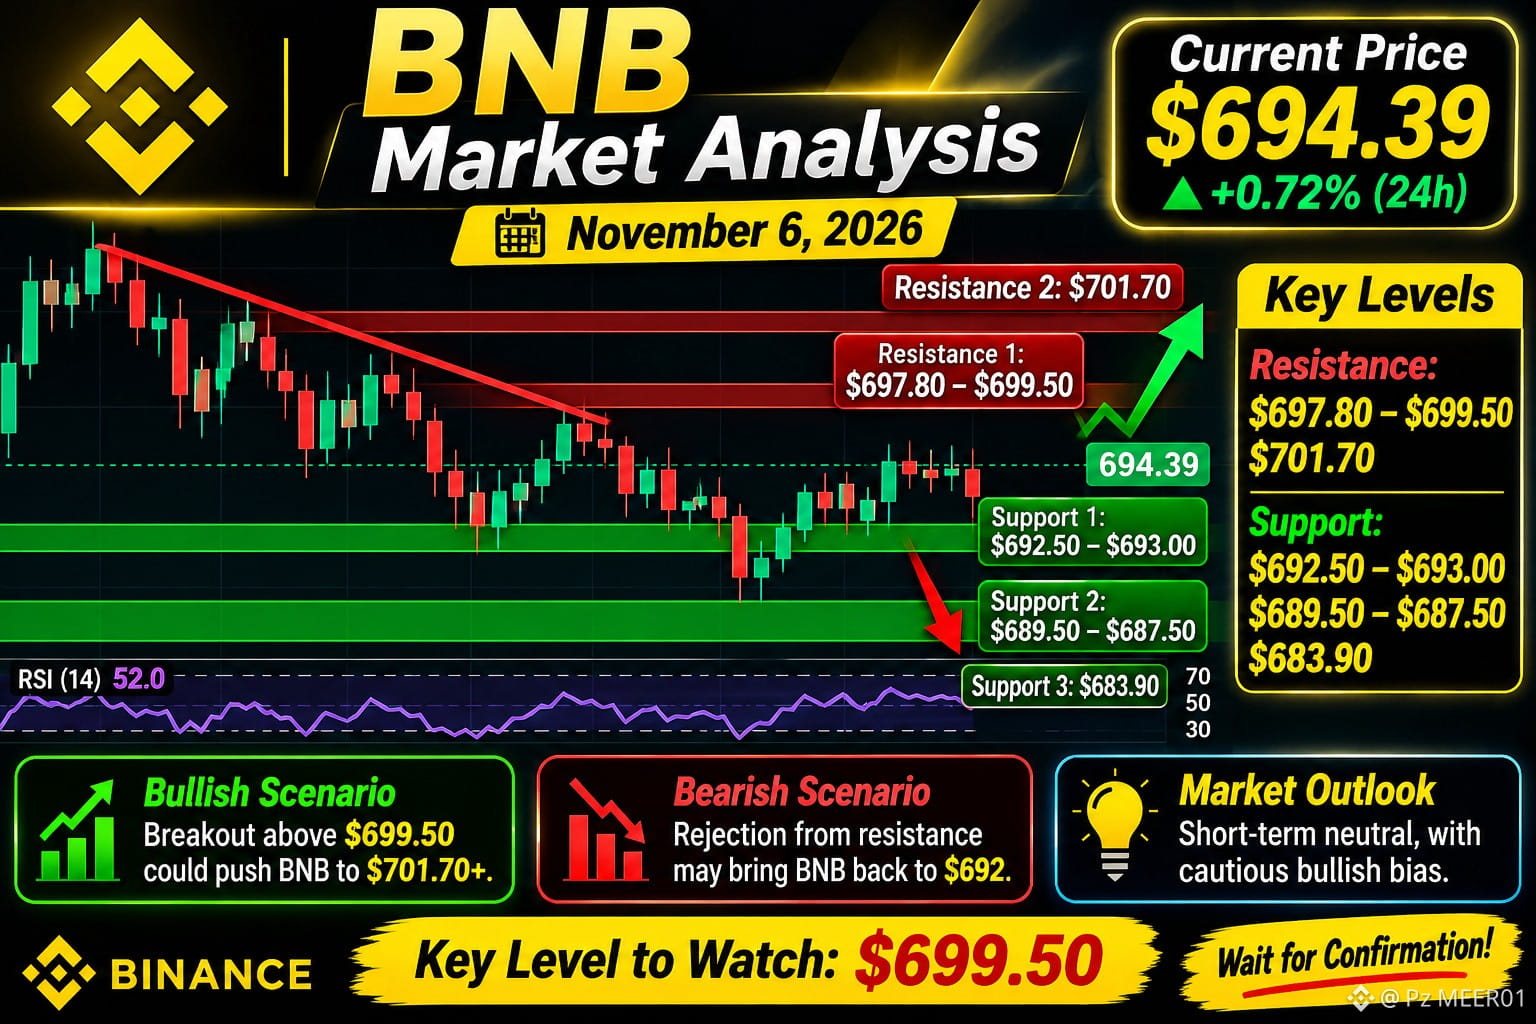
📊 $BNB Market Analysis | November 6, 2026
Current Price: $694.39
$BNB is showing short-term recovery, but buyers still need to overcome key resistance before a stronger bullish move can be confirmed.
Key Resistance:
- $697.80 – $699.50
- $701.70
Key Support:
- $692.50 – $693.00
- $689.50 – $687.50
- $683.90
Market Outlook:
A breakout above $699.50 could open the way toward $701.70 and higher levels. However, rejection from resistance may push $BNB back toward $692 and $689 support.
Technical View: Short-term neutral, with a cautious bearish bias on the 4H timeframe. RSI readings are around 47 (15m), 52 (1H), and 46 (4H).
Key Level to Watch: $699.50
Wait for a confirmed breakout or breakdown before taking a position.
#BNB #Binance #CryptoAnalysis #TechnicalAnalysiss
{spot}(BNBUSDT)
📊 $BNB Market Analysis | November 6, 2026
Current Price: $694.39
$BNB is showing short-term recovery, but buyers still need to overcome key resistance before a stronger bullish move can be confirmed.
Key Resistance:
- $697.80 – $699.50
- $701.70
Key Support:
- $692.50 – $693.00
- $689.50 – $687.50
- $683.90
Market Outlook:
A breakout above $699.50 could open the way toward $701.70 and higher levels. However, rejection from resistance may push $BNB back toward $692 and $689 support.
Technical View: Short-term neutral, with a cautious bearish bias on the 4H timeframe. RSI readings are around 47 (15m), 52 (1H), and 46 (4H).
Key Level to Watch: $699.50
Wait for a confirmed breakout or breakdown before taking a position.
#BNB #Binance #CryptoAnalysis #TechnicalAnalysiss
Current Price: $694.39
$BNB is showing short-term recovery, but buyers still need to overcome key resistance before a stronger bullish move can be confirmed.
Key Resistance:
- $697.80 – $699.50
- $701.70
Key Support:
- $692.50 – $693.00
- $689.50 – $687.50
- $683.90
Market Outlook:
A breakout above $699.50 could open the way toward $701.70 and higher levels. However, rejection from resistance may push $BNB back toward $692 and $689 support.
Technical View: Short-term neutral, with a cautious bearish bias on the 4H timeframe. RSI readings are around 47 (15m), 52 (1H), and 46 (4H).
Key Level to Watch: $699.50
Wait for a confirmed breakout or breakdown before taking a position.
#BNB #Binance #CryptoAnalysis #TechnicalAnalysiss
54

·
--
Article
See translation
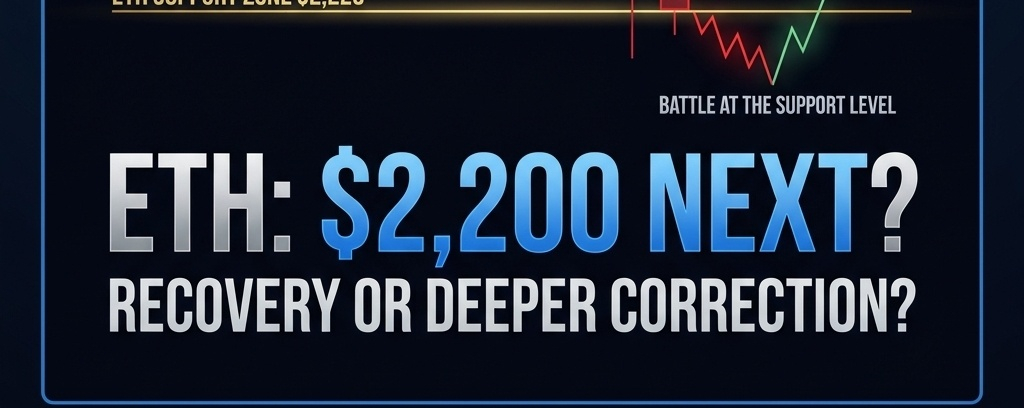
ETH Drops Below $2,250: Is Ethereum Heading for Another Major Test?Ethereum is facing renewed selling pressure.
At the time of the provided Binance chart screenshots, ETH was trading near $2,247.50, down approximately 6.75% in 24 hours.
The bigger concern is that weakness is visible across all four major timeframes: 15-minute, 1-hour, 4-hour and daily.
But does this correction create another opportunity for buyers, or should traders prepare for further downside?
1. 15-Minute Chart: Short-Term Buyers Under Pressure
Moving averages:
MA7: $2,255.80MA25: $2,278.48MA99: $2,384.66
ETH is trading below all three moving averages. Even a short-term recovery needs to reclaim the $2,255–$2,278 area before momentum can improve.
2. 1-Hour Chart: Bearish Structure Continues
Moving averages:
MA7: $2,268.58MA25: $2,377.45MA99: $2,312.30
The price remains below all three averages, suggesting sellers still have the advantage.
A recovery above $2,268 would be an early sign of stabilization, while $2,312–$2,377 remains a more important resistance region.
3. 4-Hour Chart: A Critical Technical Test
Moving averages:
MA7: $2,349.77MA25: $2,309.56MA99: $2,335.39
ETH is significantly below all three moving averages.
This is an important warning because the 4-hour structure has weakened. Buyers need to reclaim the $2,310–$2,350 region to improve the outlook.
4. Daily Chart: The Bigger Trend Needs Repair
Moving averages:
MA7: $2,282.34MA25: $2,364.24MA99: $2,366.20
The daily chart also shows ETH below all three moving averages.
This suggests that the current weakness is not limited to a few short-term candles. A stronger recovery will require buyers to reclaim important daily resistance levels.
Key ETH Levels to Watch
Support zones:
$2,236–$2,226$2,174$2,144
Resistance zones:
$2,255–$2,278$2,309–$2,366$2,384
A sustained break below $2,226 could expose the lower support levels.
On the other hand, reclaiming $2,278 and then $2,310 with stronger buying volume could indicate an improving recovery attempt.
What Should ETH Traders Watch Now?
The four-timeframe picture currently favors caution.
A falling price does not automatically mean it is time to buy, and a recovery candle does not automatically confirm a reversal.
The next important development is whether buyers can defend the $2,226 area and reclaim short-term moving averages.
Community question:
Is ETH preparing for a recovery, or could $2,200 become the next major test?
Are you watching for a bounce or waiting for stronger confirmation?
Share your analysis below.
Disclaimer: This article is based on the Binance chart screenshots provided, not live market data. It is for educational purposes only and is not financial advice. Cryptocurrency trading involves significant risk.
#Ethereum #ETH #BinancePick #CryptoAnalysis #Bitcoin #Altcoins #TrendingTopic #farcamcrypto #TechnicalAnalysiss
ETH Drops Below $2,250: Is Ethereum Heading for Another Major Test?
Ethereum is facing renewed selling pressure.
At the time of the provided Binance chart screenshots, ETH was trading near $2,247.50, down approximately 6.75% in 24 hours.
The bigger concern is that weakness is visible across all four major timeframes: 15-minute, 1-hour, 4-hour and daily.
But does this correction create another opportunity for buyers, or should traders prepare for further downside?
1. 15-Minute Chart: Short-Term Buyers Under Pressure
Moving averages:
MA7: $2,255.80MA25: $2,278.48MA99: $2,384.66
ETH is trading below all three moving averages. Even a short-term recovery needs to reclaim the $2,255–$2,278 area before momentum can improve.
2. 1-Hour Chart: Bearish Structure Continues
Moving averages:
MA7: $2,268.58MA25: $2,377.45MA99: $2,312.30
The price remains below all three averages, suggesting sellers still have the advantage.
A recovery above $2,268 would be an early sign of stabilization, while $2,312–$2,377 remains a more important resistance region.
3. 4-Hour Chart: A Critical Technical Test
Moving averages:
MA7: $2,349.77MA25: $2,309.56MA99: $2,335.39
ETH is significantly below all three moving averages.
This is an important warning because the 4-hour structure has weakened. Buyers need to reclaim the $2,310–$2,350 region to improve the outlook.
4. Daily Chart: The Bigger Trend Needs Repair
Moving averages:
MA7: $2,282.34MA25: $2,364.24MA99: $2,366.20
The daily chart also shows ETH below all three moving averages.
This suggests that the current weakness is not limited to a few short-term candles. A stronger recovery will require buyers to reclaim important daily resistance levels.
Key ETH Levels to Watch
Support zones:
$2,236–$2,226$2,174$2,144
Resistance zones:
$2,255–$2,278$2,309–$2,366$2,384
A sustained break below $2,226 could expose the lower support levels.
On the other hand, reclaiming $2,278 and then $2,310 with stronger buying volume could indicate an improving recovery attempt.
What Should ETH Traders Watch Now?
The four-timeframe picture currently favors caution.
A falling price does not automatically mean it is time to buy, and a recovery candle does not automatically confirm a reversal.
The next important development is whether buyers can defend the $2,226 area and reclaim short-term moving averages.
Community question:
Is ETH preparing for a recovery, or could $2,200 become the next major test?
Are you watching for a bounce or waiting for stronger confirmation?
Share your analysis below.
Disclaimer: This article is based on the Binance chart screenshots provided, not live market data. It is for educational purposes only and is not financial advice. Cryptocurrency trading involves significant risk.
#Ethereum #ETH #BinancePick #CryptoAnalysis #Bitcoin #Altcoins #TrendingTopic #farcamcrypto #TechnicalAnalysiss
At the time of the provided Binance chart screenshots, ETH was trading near $2,247.50, down approximately 6.75% in 24 hours.
The bigger concern is that weakness is visible across all four major timeframes: 15-minute, 1-hour, 4-hour and daily.
But does this correction create another opportunity for buyers, or should traders prepare for further downside?
1. 15-Minute Chart: Short-Term Buyers Under Pressure
Moving averages:
MA7: $2,255.80MA25: $2,278.48MA99: $2,384.66
ETH is trading below all three moving averages. Even a short-term recovery needs to reclaim the $2,255–$2,278 area before momentum can improve.
2. 1-Hour Chart: Bearish Structure Continues
Moving averages:
MA7: $2,268.58MA25: $2,377.45MA99: $2,312.30
The price remains below all three averages, suggesting sellers still have the advantage.
A recovery above $2,268 would be an early sign of stabilization, while $2,312–$2,377 remains a more important resistance region.
3. 4-Hour Chart: A Critical Technical Test
Moving averages:
MA7: $2,349.77MA25: $2,309.56MA99: $2,335.39
ETH is significantly below all three moving averages.
This is an important warning because the 4-hour structure has weakened. Buyers need to reclaim the $2,310–$2,350 region to improve the outlook.
4. Daily Chart: The Bigger Trend Needs Repair
Moving averages:
MA7: $2,282.34MA25: $2,364.24MA99: $2,366.20
The daily chart also shows ETH below all three moving averages.
This suggests that the current weakness is not limited to a few short-term candles. A stronger recovery will require buyers to reclaim important daily resistance levels.
Key ETH Levels to Watch
Support zones:
$2,236–$2,226$2,174$2,144
Resistance zones:
$2,255–$2,278$2,309–$2,366$2,384
A sustained break below $2,226 could expose the lower support levels.
On the other hand, reclaiming $2,278 and then $2,310 with stronger buying volume could indicate an improving recovery attempt.
What Should ETH Traders Watch Now?
The four-timeframe picture currently favors caution.
A falling price does not automatically mean it is time to buy, and a recovery candle does not automatically confirm a reversal.
The next important development is whether buyers can defend the $2,226 area and reclaim short-term moving averages.
Community question:
Is ETH preparing for a recovery, or could $2,200 become the next major test?
Are you watching for a bounce or waiting for stronger confirmation?
Share your analysis below.
Disclaimer: This article is based on the Binance chart screenshots provided, not live market data. It is for educational purposes only and is not financial advice. Cryptocurrency trading involves significant risk.
#Ethereum #ETH #BinancePick #CryptoAnalysis #Bitcoin #Altcoins #TrendingTopic #farcamcrypto #TechnicalAnalysiss
63

See translation
📊 Crypto Market Insight | Trade with Patience
🚀 A breakout is not always a buying opportunity!
Many traders enter a position as soon as price breaks resistance, but sometimes the breakout turns into a false move.
Before entering a trade, always check:
🔹 Candle closing above resistance
🔹 Volume confirmation
🔹 Retest of the breakout level
🔹 Overall market trend
💡 My Trading View: Patience and confirmation are more important than chasing fast price movements.
❓ Question for Traders:
Do you prefer buying immediately after a breakout or waiting for a retest?
Share your strategy in the comments! 👇
#BinanceSquareFamily #CryptoTrading. #TechnicalAnalysiss #tradingStrategy #CryptoCommunity
📊 Crypto Market Insight | Trade with Patience
🚀 A breakout is not always a buying opportunity!
Many traders enter a position as soon as price breaks resistance, but sometimes the breakout turns into a false move.
Before entering a trade, always check:
🔹 Candle closing above resistance
🔹 Volume confirmation
🔹 Retest of the breakout level
🔹 Overall market trend
💡 My Trading View: Patience and confirmation are more important than chasing fast price movements.
❓ Question for Traders:
Do you prefer buying immediately after a breakout or waiting for a retest?
Share your strategy in the comments! 👇
#BinanceSquareFamily #CryptoTrading. #TechnicalAnalysiss #tradingStrategy #CryptoCommunity
🚀 A breakout is not always a buying opportunity!
Many traders enter a position as soon as price breaks resistance, but sometimes the breakout turns into a false move.
Before entering a trade, always check:
🔹 Candle closing above resistance
🔹 Volume confirmation
🔹 Retest of the breakout level
🔹 Overall market trend
💡 My Trading View: Patience and confirmation are more important than chasing fast price movements.
❓ Question for Traders:
Do you prefer buying immediately after a breakout or waiting for a retest?
Share your strategy in the comments! 👇
#BinanceSquareFamily #CryptoTrading. #TechnicalAnalysiss #tradingStrategy #CryptoCommunity
59

·
--
See translation
🚨 ADA/USDT — MAJOR BULLISH RECOVERY SETUP? 🚀
Cardano is on my radar!
📊 TECHNICAL STRATEGY:
🟢 Wait for resistance breakout.
🟢 Confirm with strong volume.
🟢 Look for bullish MACD crossover.
🟢 RSI recovery above 50.
🟢 Enter only after successful retest.
🎯 Multiple upside targets based on risk/reward.
🛑 Strict stop-loss below confirmed swing support.
Smart traders wait for confirmation. Don't chase pumps!
Are you bullish or bearish on $ADA?
#ADA #Cardano #Binance #cryptotrading #Altcoins! #TechnicalAnalysiss
🚨 ADA/USDT — MAJOR BULLISH RECOVERY SETUP? 🚀
Cardano is on my radar!
📊 TECHNICAL STRATEGY:
🟢 Wait for resistance breakout.
🟢 Confirm with strong volume.
🟢 Look for bullish MACD crossover.
🟢 RSI recovery above 50.
🟢 Enter only after successful retest.
🎯 Multiple upside targets based on risk/reward.
🛑 Strict stop-loss below confirmed swing support.
Smart traders wait for confirmation. Don't chase pumps!
Are you bullish or bearish on $ADA?
#ADA #Cardano #Binance #cryptotrading #Altcoins! #TechnicalAnalysiss
Cardano is on my radar!
📊 TECHNICAL STRATEGY:
🟢 Wait for resistance breakout.
🟢 Confirm with strong volume.
🟢 Look for bullish MACD crossover.
🟢 RSI recovery above 50.
🟢 Enter only after successful retest.
🎯 Multiple upside targets based on risk/reward.
🛑 Strict stop-loss below confirmed swing support.
Smart traders wait for confirmation. Don't chase pumps!
Are you bullish or bearish on $ADA?
#ADA #Cardano #Binance #cryptotrading #Altcoins! #TechnicalAnalysiss
1
212

·
--
See translation
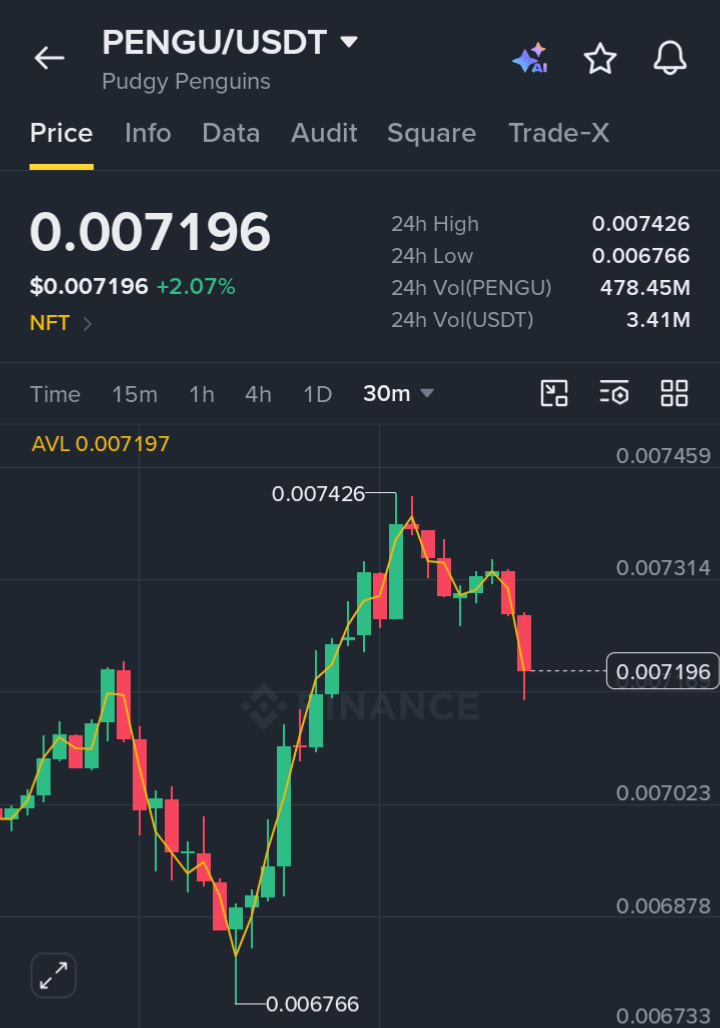
$PENGU/USDT BULLISH REVERSAL $PENGU
Entry Range: $0.007100 - $0.007200
TP1: $0.007350
TP2: $0.007550
TP3: $0.007800
SL: $0.006650
#PENGU #cryptotrading #TechnicalAnalysiss #BinanceSquareFamily #CryptoSignals
$PENGU /USDT BULLISH REVERSAL $PENGU
Entry Range: $0.007100 - $0.007200
TP1: $0.007350
TP2: $0.007550
TP3: $0.007800
SL: $0.006650
#PENGU #cryptotrading #TechnicalAnalysiss #BinanceSquareFamily #CryptoSignals
Entry Range: $0.007100 - $0.007200
TP1: $0.007350
TP2: $0.007550
TP3: $0.007800
SL: $0.006650
#PENGU #cryptotrading #TechnicalAnalysiss #BinanceSquareFamily #CryptoSignals
1
337

See translation
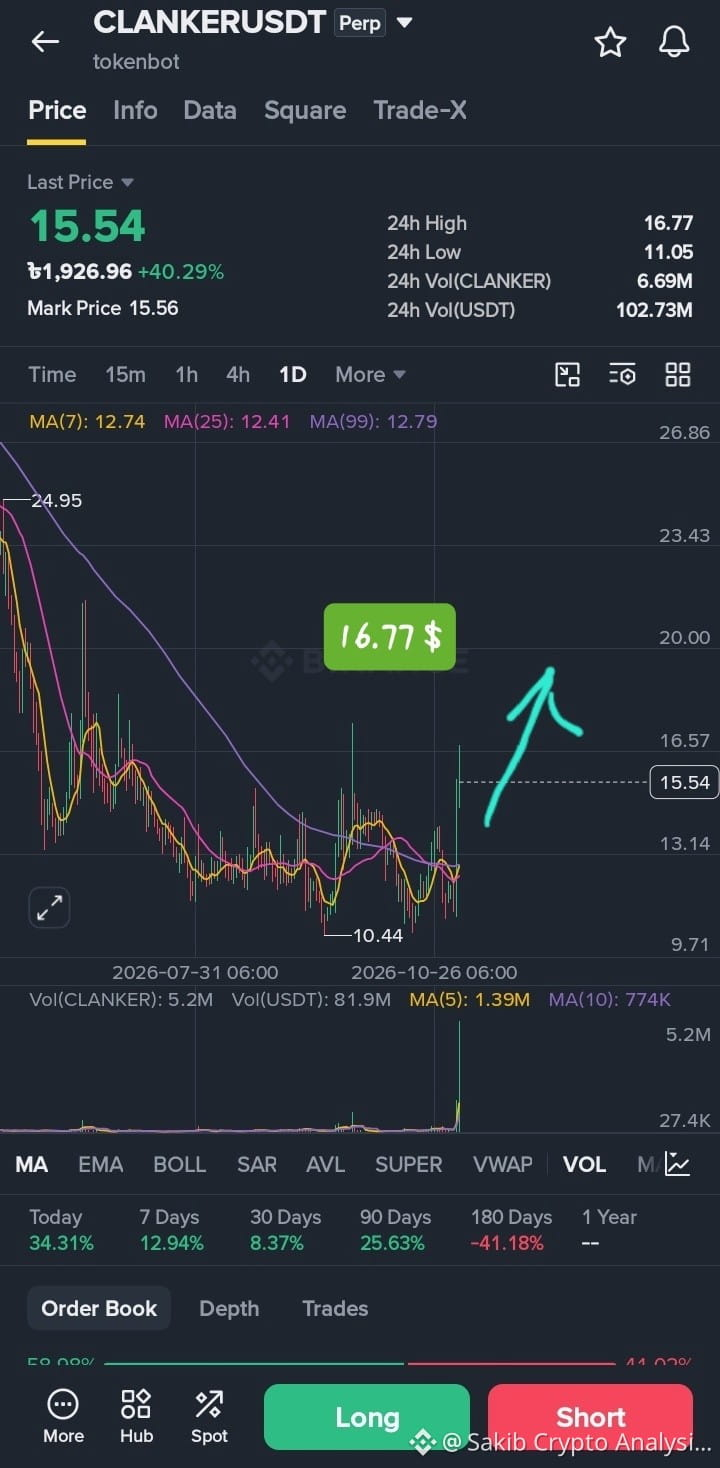
🚨 $CLANKER /USDT BREAKOUT CONFIRMED! THE BULLS ARE UNLEASHED! 😱
The long period of boring sideways consolidation is officially over! CLANKER has triggered a massive breakout on the daily (1D) chart, currently trading at $15.54 (+40.29%)! 🚀
📉 Technical Analysis (What’s happening?):
1. Massive Volume Spike: Look at the bottom of the chart—a huge volume peak has appeared. Smart money and big buyers are aggressively entering the market.
2. Resistance Smashed: The price was trapped between $10.44 and $13.14 for weeks. Today, it completely shattered that range with a powerful bullish candle.
3. MA Ribbons Crossed: The price is now trading safely above the MA(7), MA(25), and MA(99). This is a textbook signal of a strong, confirmed uptrend.
Next Potential Move:
If the daily candle closes above this breakout zone, our immediate target is $16.77 (24h High), followed by the next major psychological resistance levels.
Risk Warning: In high-volume breakouts like this, avoid FOMO (Fear Of Missing Out). Always practice proper risk management and use a tight stop-loss.
Are you riding this breakout right now, or waiting for a retest? Drop your thoughts below! 👇
#cryptotrading #ClankerPump
{future}(CLANKERUSDT)
{spot}(PEPEUSDT)
{spot}(ETHUSDT)
#BinanceSquare #TechnicalAnalysiss #bullish
🚨 $CLANKER /USDT BREAKOUT CONFIRMED! THE BULLS ARE UNLEASHED! 😱
The long period of boring sideways consolidation is officially over! CLANKER has triggered a massive breakout on the daily (1D) chart, currently trading at $15.54 (+40.29%)! 🚀
📉 Technical Analysis (What’s happening?):
1. Massive Volume Spike: Look at the bottom of the chart—a huge volume peak has appeared. Smart money and big buyers are aggressively entering the market.
2. Resistance Smashed: The price was trapped between $10.44 and $13.14 for weeks. Today, it completely shattered that range with a powerful bullish candle.
3. MA Ribbons Crossed: The price is now trading safely above the MA(7), MA(25), and MA(99). This is a textbook signal of a strong, confirmed uptrend.
Next Potential Move:
If the daily candle closes above this breakout zone, our immediate target is $16.77 (24h High), followed by the next major psychological resistance levels.
Risk Warning: In high-volume breakouts like this, avoid FOMO (Fear Of Missing Out). Always practice proper risk management and use a tight stop-loss.
Are you riding this breakout right now, or waiting for a retest? Drop your thoughts below! 👇
#cryptotrading #ClankerPump
#BinanceSquare #TechnicalAnalysiss #bullish
The long period of boring sideways consolidation is officially over! CLANKER has triggered a massive breakout on the daily (1D) chart, currently trading at $15.54 (+40.29%)! 🚀
📉 Technical Analysis (What’s happening?):
1. Massive Volume Spike: Look at the bottom of the chart—a huge volume peak has appeared. Smart money and big buyers are aggressively entering the market.
2. Resistance Smashed: The price was trapped between $10.44 and $13.14 for weeks. Today, it completely shattered that range with a powerful bullish candle.
3. MA Ribbons Crossed: The price is now trading safely above the MA(7), MA(25), and MA(99). This is a textbook signal of a strong, confirmed uptrend.
Next Potential Move:
If the daily candle closes above this breakout zone, our immediate target is $16.77 (24h High), followed by the next major psychological resistance levels.
Risk Warning: In high-volume breakouts like this, avoid FOMO (Fear Of Missing Out). Always practice proper risk management and use a tight stop-loss.
Are you riding this breakout right now, or waiting for a retest? Drop your thoughts below! 👇
#cryptotrading #ClankerPump
#BinanceSquare #TechnicalAnalysiss #bullish
2
378

·
--
See translation
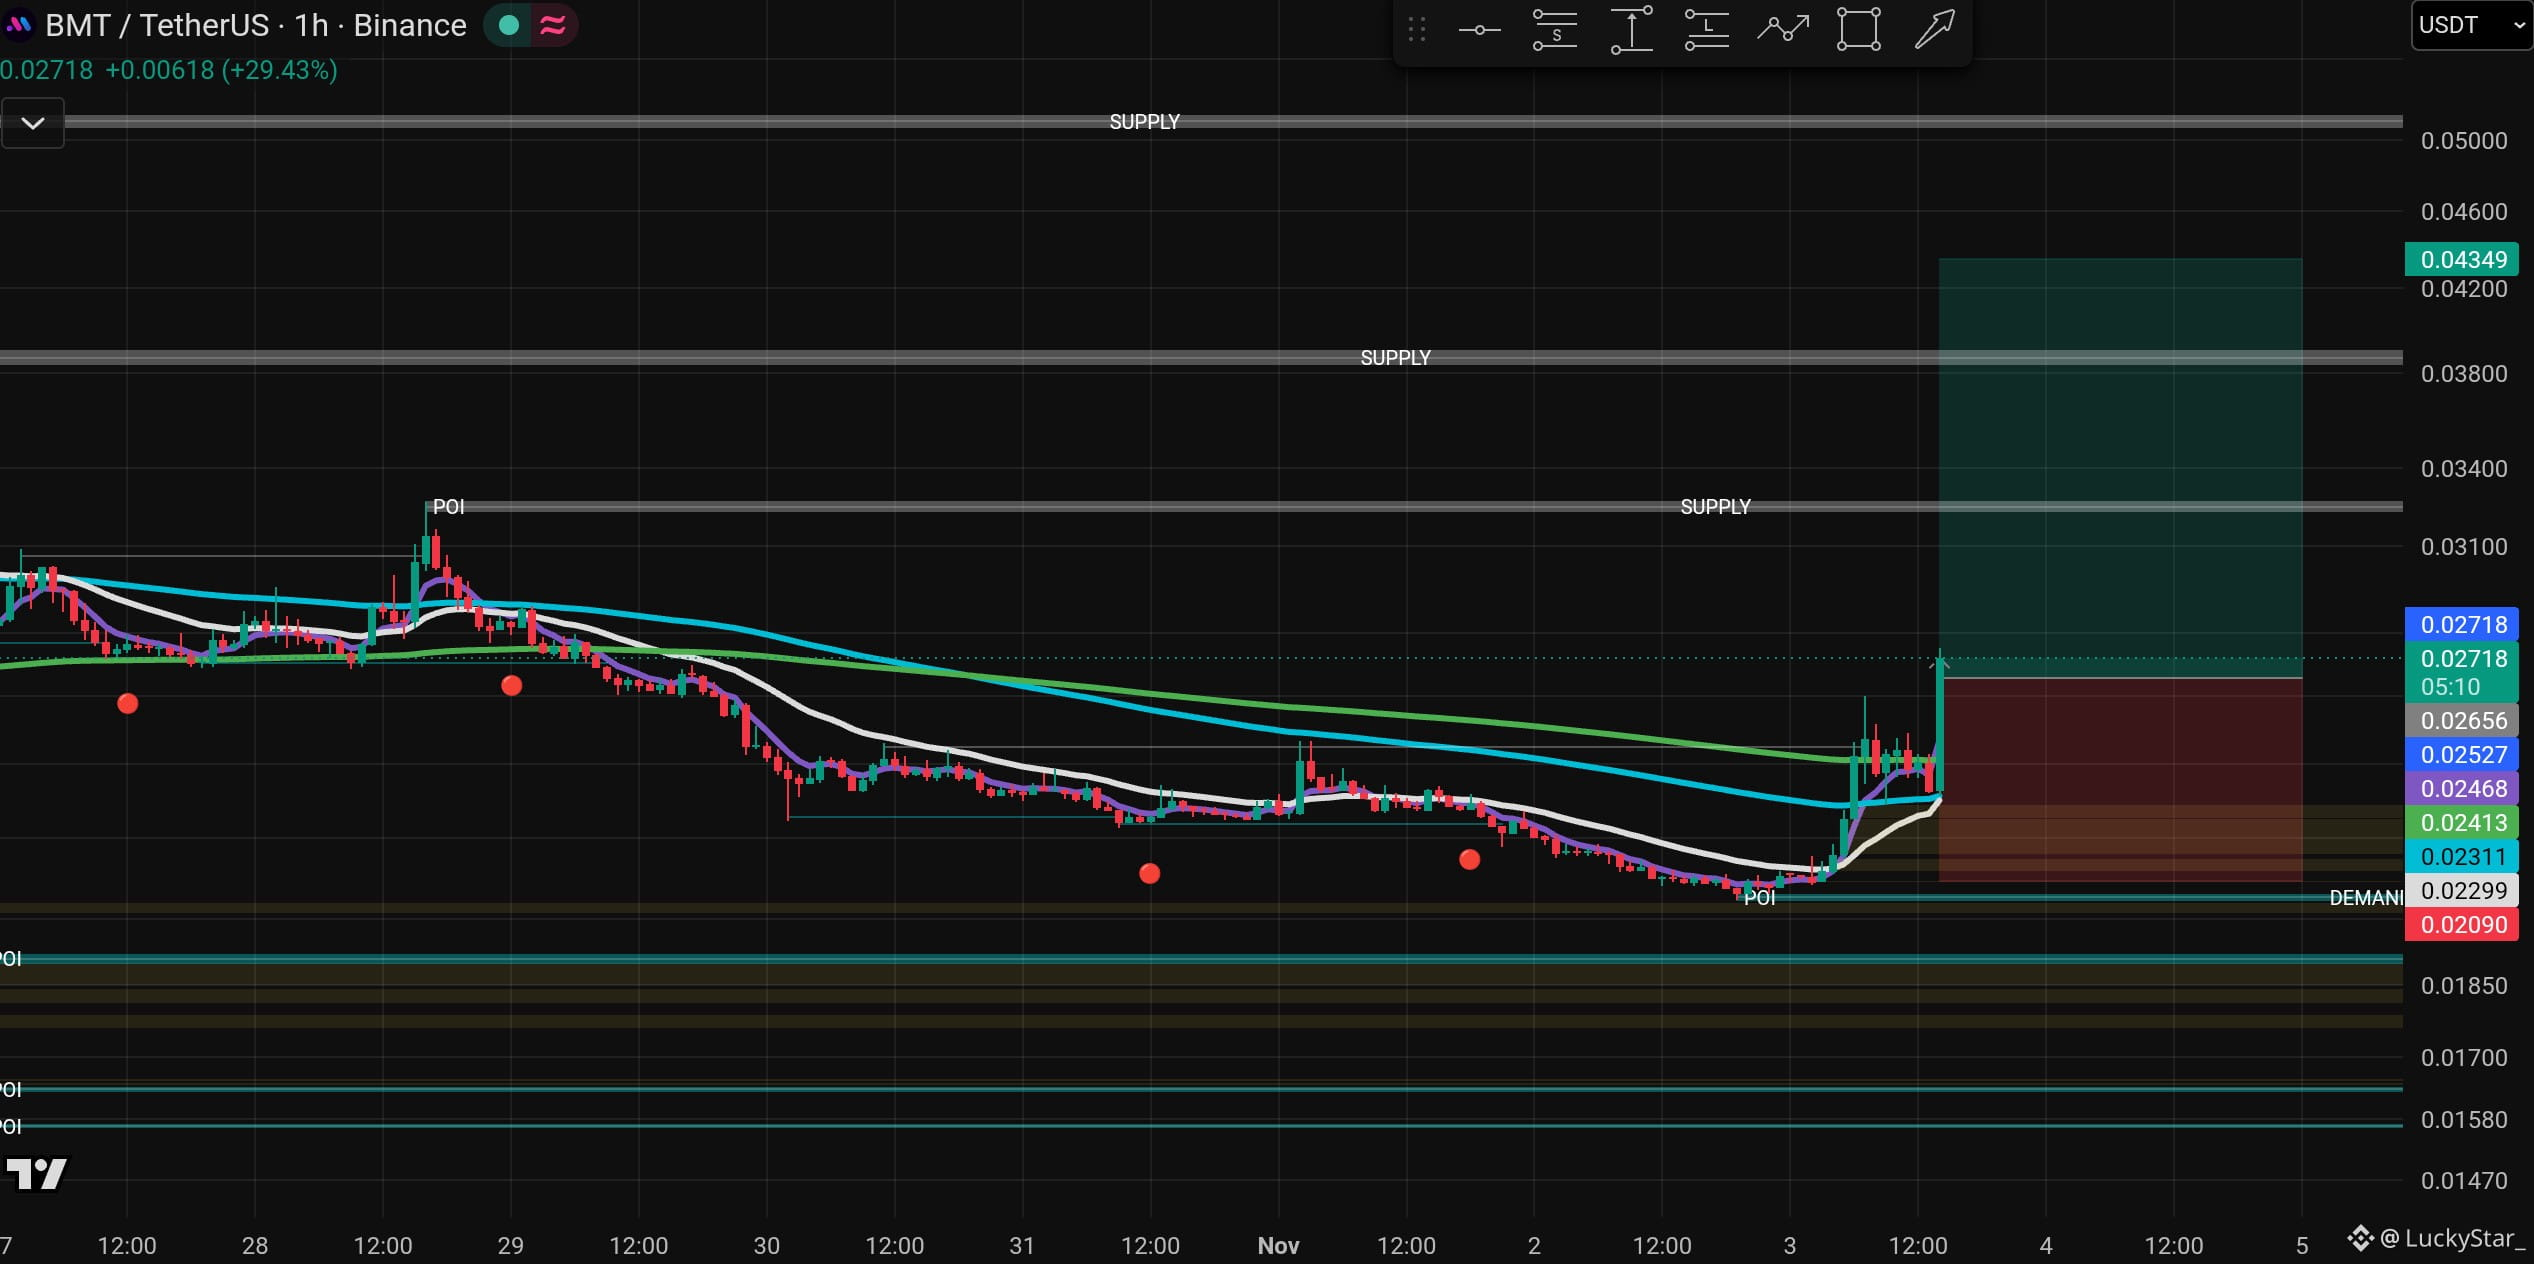
$BMT
{future}(BMTUSDT)
Why now?
- This is a trend strategy
The price is holding a key support zone and is gradually recovering.
READY FOR A NEW UPWARD MOVE?
BUYERS ARE STARTING TO INCREASE THEIR PRESSURE.
#BMTAnalysis #crypto #TechnicalAnalysiss
$BMT
Why now?
- This is a trend strategy
The price is holding a key support zone and is gradually recovering.
READY FOR A NEW UPWARD MOVE?
BUYERS ARE STARTING TO INCREASE THEIR PRESSURE.
#BMTAnalysis #crypto #TechnicalAnalysiss
Why now?
- This is a trend strategy
The price is holding a key support zone and is gradually recovering.
READY FOR A NEW UPWARD MOVE?
BUYERS ARE STARTING TO INCREASE THEIR PRESSURE.
#BMTAnalysis #crypto #TechnicalAnalysiss
16

·
--
Bullish
See translation
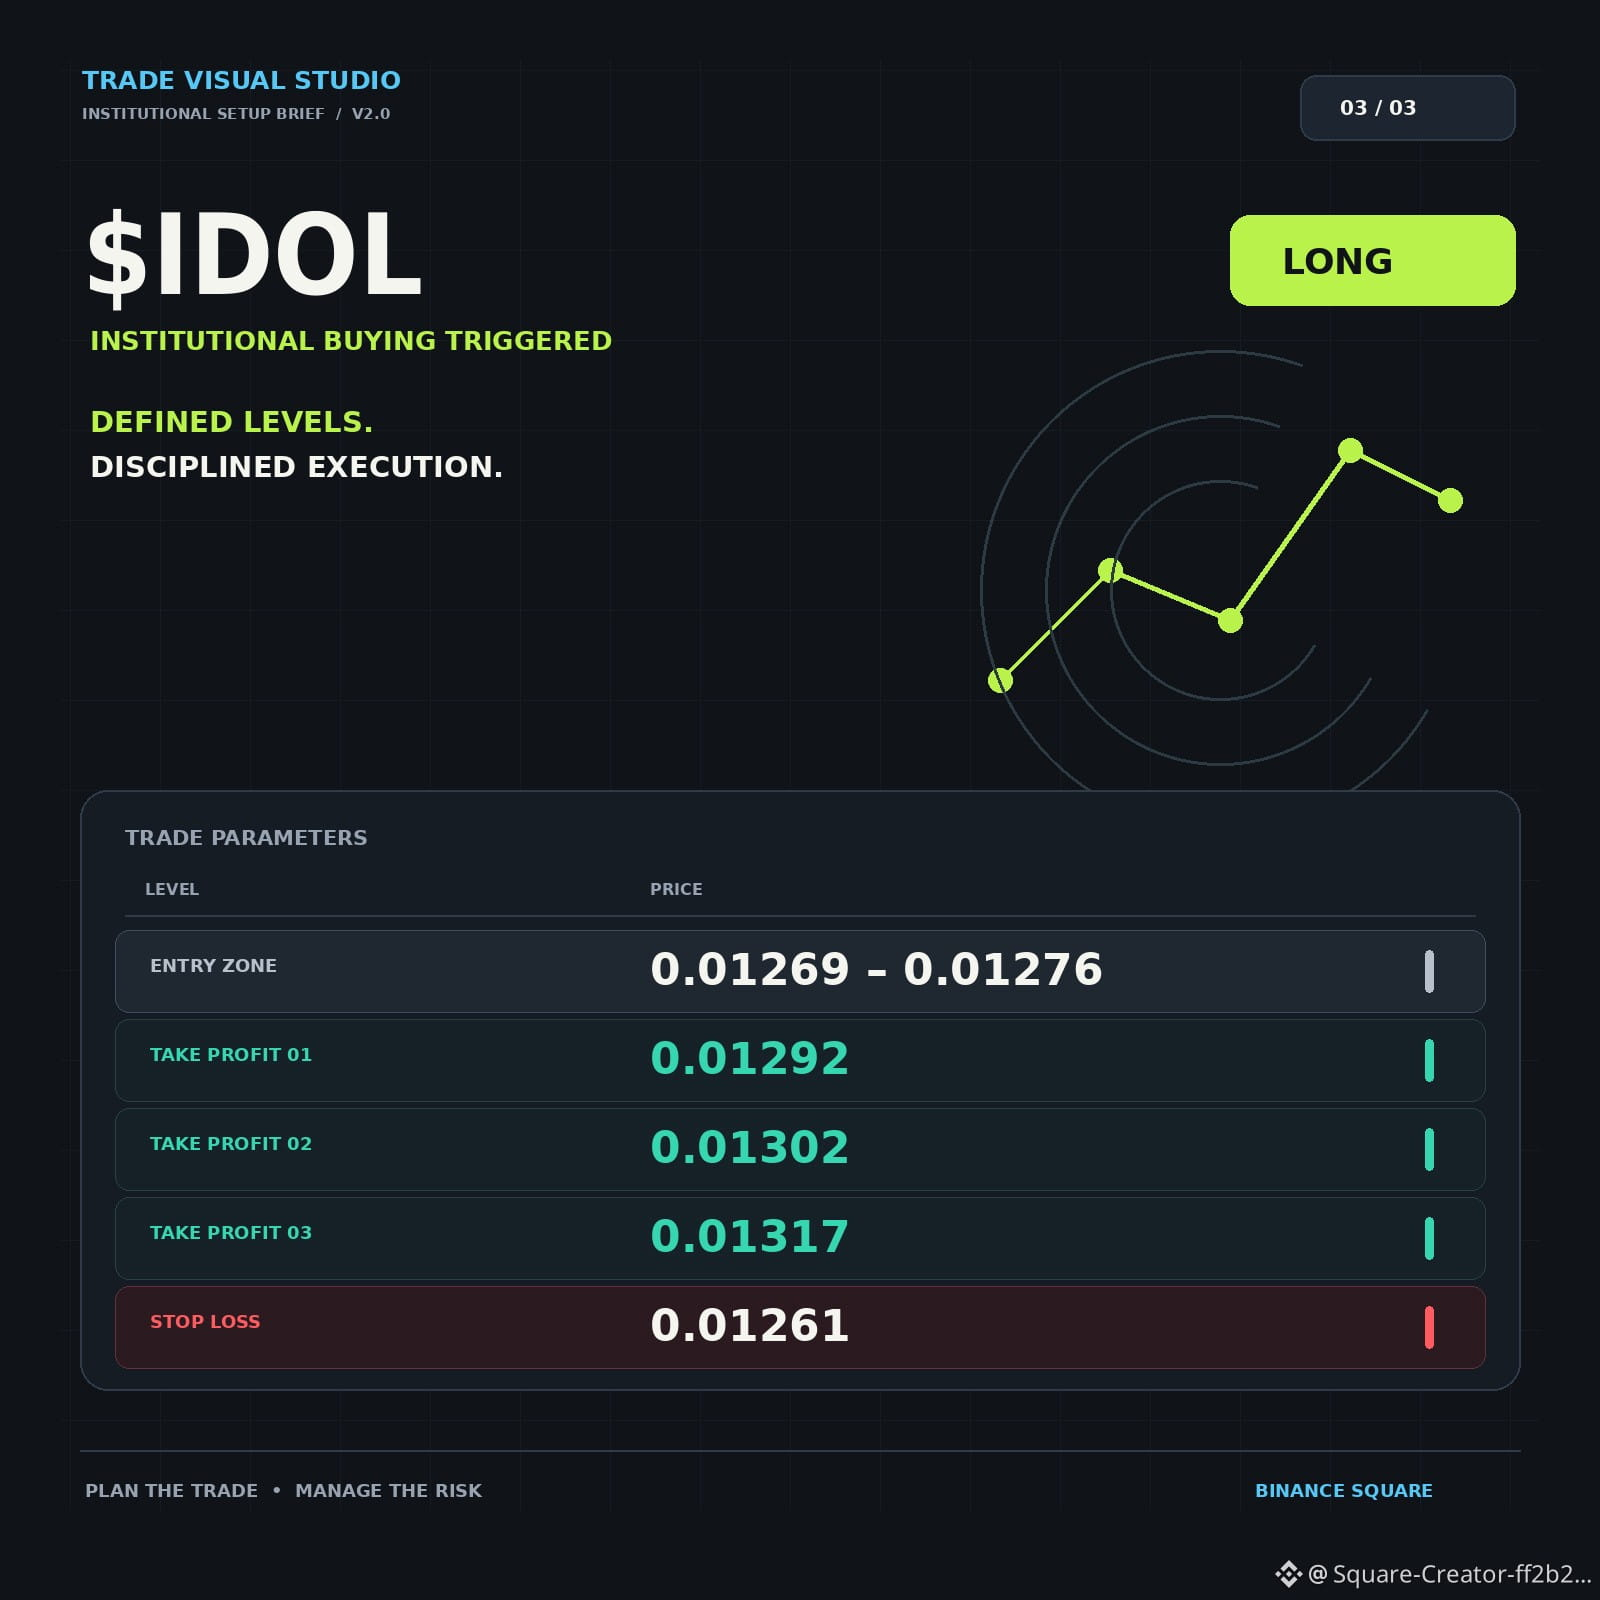
👀 Three setups. Three different market stories. One watchlist.
Here's what I'm tracking:
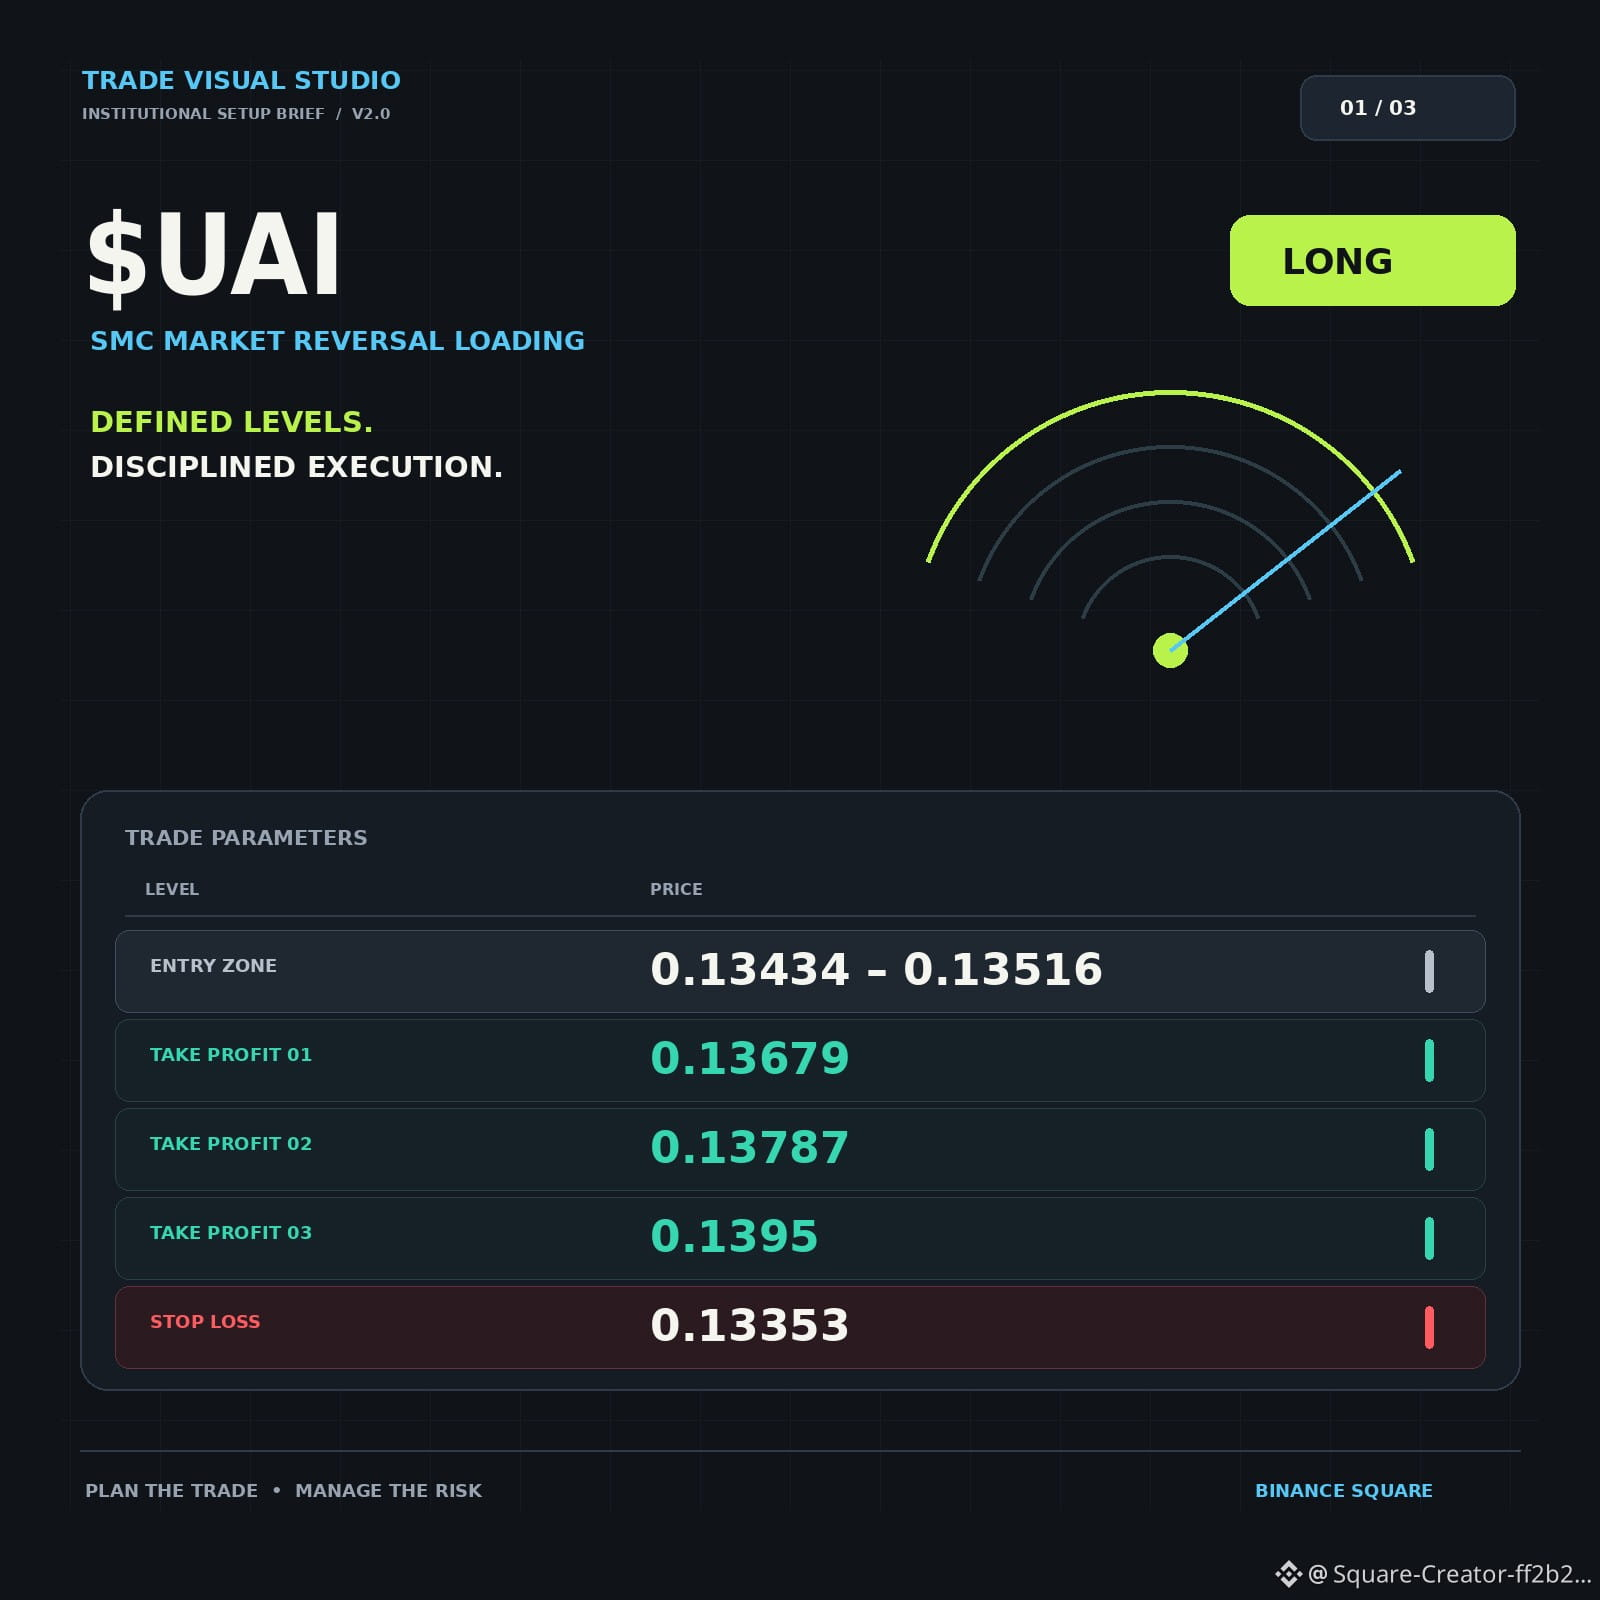
🟢 UAI — SMC Market Reversal
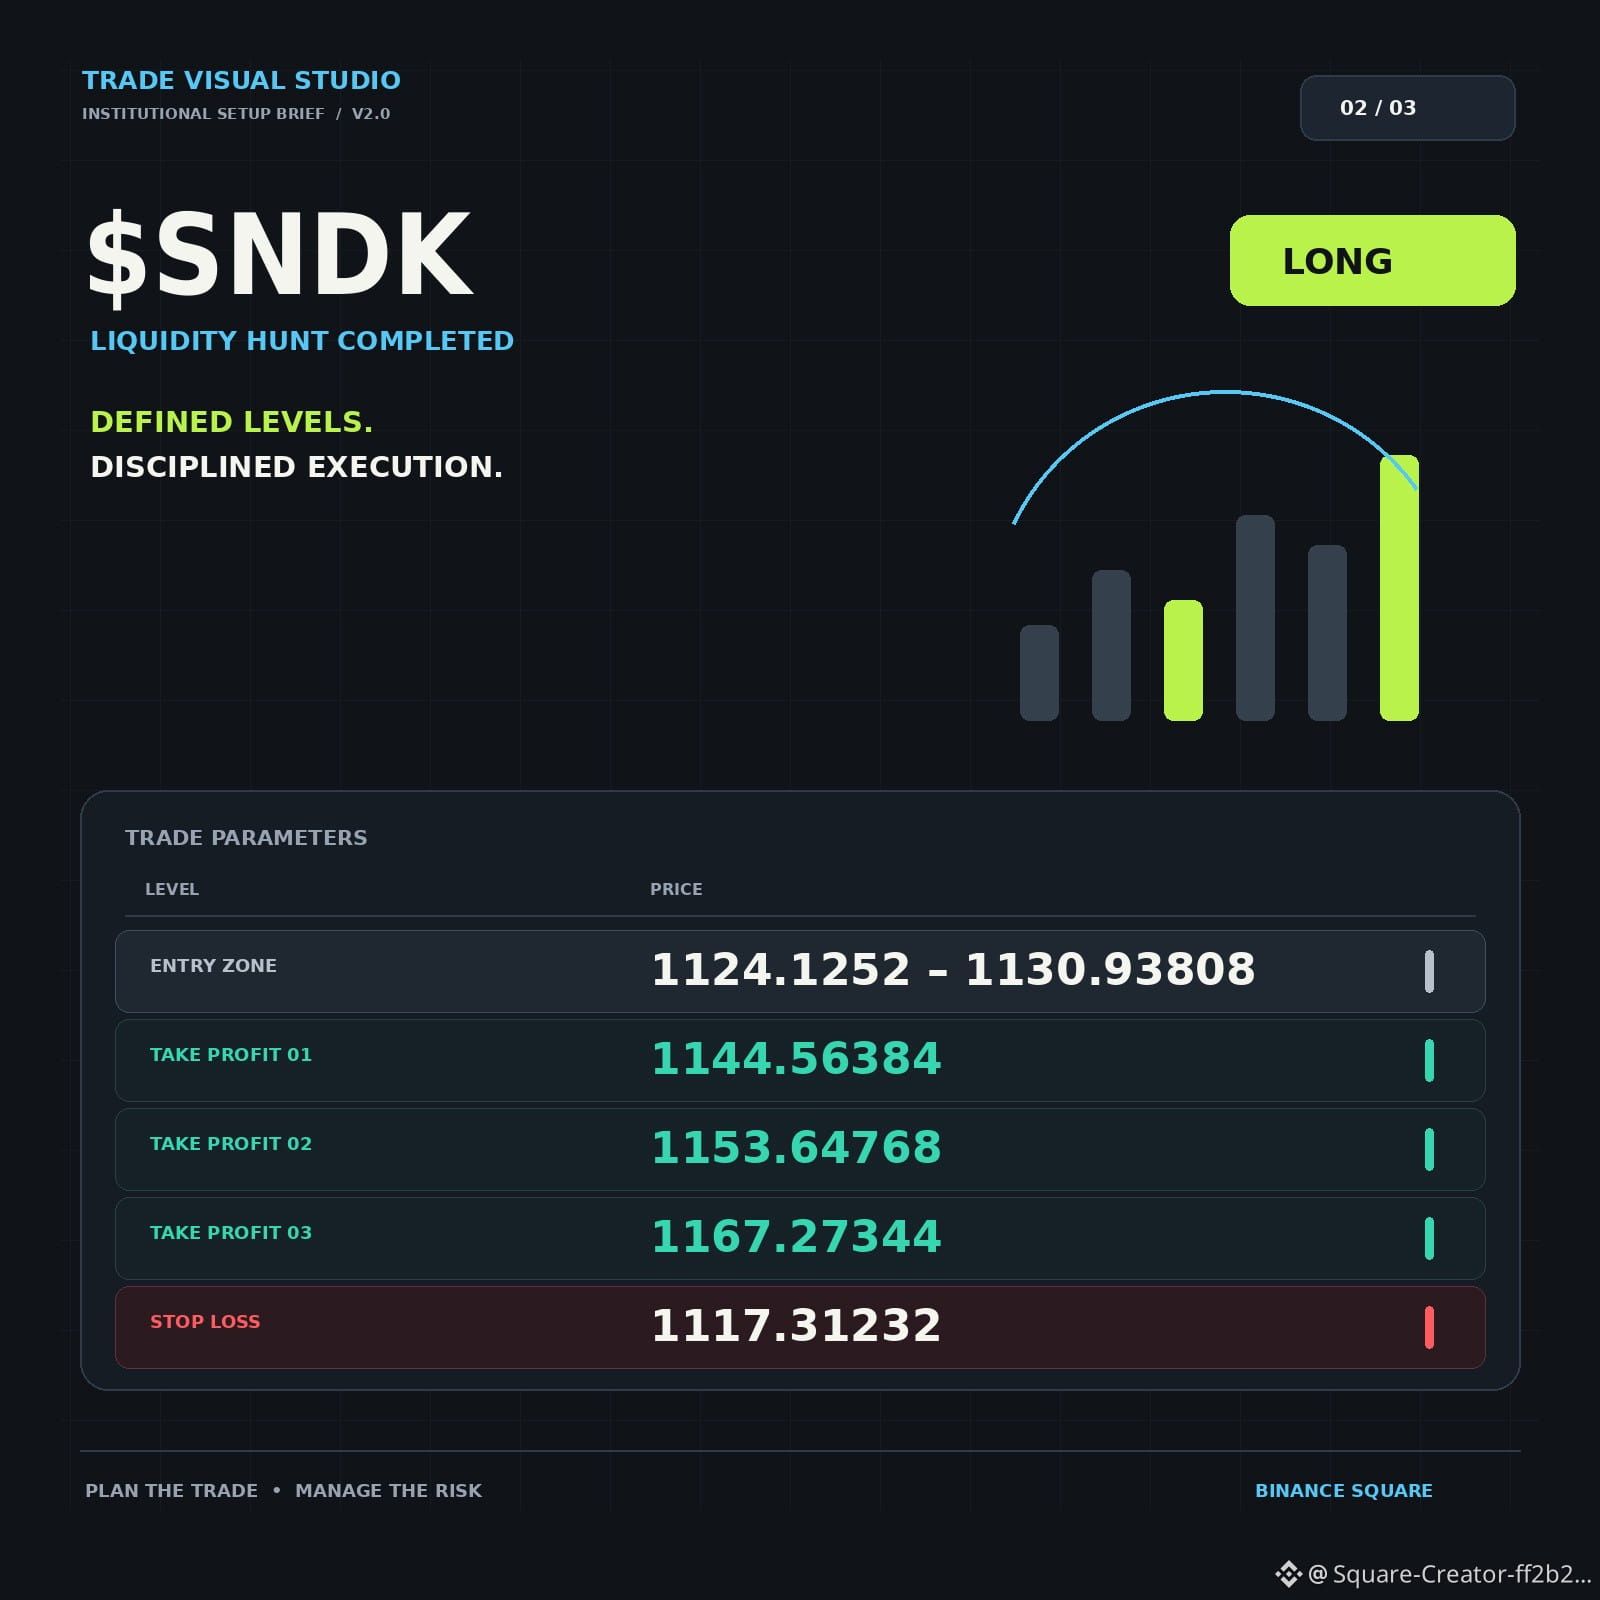
🟢 SNDK — Liquidity Hunt
🟢 IDOL — Institutional Buying
All three setups include:
▪️ Defined entry zones
▪️ Three take-profit targets
▪️ Clear invalidation levels
The interesting part isn't just the targets — it's how price reacts around the entry zones.
Which one has your attention: UAI, SNDK, or IDOL?
Long $UAI
{future}(UAIUSDT)
Entry: 0.13434 – 0.13516
TP1: 0.13679
TP2: 0.13787
TP3: 0.1395
SL: 0.13353
💎 SMC Market Reversal Loading
Long $SNDK
{future}(SNDKUSDT)
Entry: 1124.1252 – 1130.93808
TP1: 1144.56384
TP2: 1153.64768
TP3: 1167.27344
SL: 1117.31232
👑 Liquidity Hunt Completed
Long $IDOL
{future}(IDOLUSDT)
Entry: 0.01269 – 0.01276
TP1: 0.01292
TP2: 0.01302
TP3: 0.01317
SL: 0.01261
📈 Institutional Buying Triggered! IDOL
#CryptoTrading. #BinanceSquareFamily #SmartMoneyConceptsCrypto #LiquidityHunt #TechnicalAnalysiss
👀 Three setups. Three different market stories. One watchlist.
Here's what I'm tracking:
🟢 UAI — SMC Market Reversal
🟢 SNDK — Liquidity Hunt
🟢 IDOL — Institutional Buying
All three setups include:
▪️ Defined entry zones
▪️ Three take-profit targets
▪️ Clear invalidation levels
The interesting part isn't just the targets — it's how price reacts around the entry zones.
Which one has your attention: UAI, SNDK, or IDOL?
Long $UAI
Entry: 0.13434 – 0.13516
TP1: 0.13679
TP2: 0.13787
TP3: 0.1395
SL: 0.13353
💎 SMC Market Reversal Loading
Long $SNDK
Entry: 1124.1252 – 1130.93808
TP1: 1144.56384
TP2: 1153.64768
TP3: 1167.27344
SL: 1117.31232
👑 Liquidity Hunt Completed
Long $IDOL
Entry: 0.01269 – 0.01276
TP1: 0.01292
TP2: 0.01302
TP3: 0.01317
SL: 0.01261
📈 Institutional Buying Triggered! IDOL
#CryptoTrading. #BinanceSquareFamily #SmartMoneyConceptsCrypto #LiquidityHunt #TechnicalAnalysiss
Here's what I'm tracking:
🟢 UAI — SMC Market Reversal
🟢 SNDK — Liquidity Hunt
🟢 IDOL — Institutional Buying
All three setups include:
▪️ Defined entry zones
▪️ Three take-profit targets
▪️ Clear invalidation levels
The interesting part isn't just the targets — it's how price reacts around the entry zones.
Which one has your attention: UAI, SNDK, or IDOL?
Long $UAI
Entry: 0.13434 – 0.13516
TP1: 0.13679
TP2: 0.13787
TP3: 0.1395
SL: 0.13353
💎 SMC Market Reversal Loading
Long $SNDK
Entry: 1124.1252 – 1130.93808
TP1: 1144.56384
TP2: 1153.64768
TP3: 1167.27344
SL: 1117.31232
👑 Liquidity Hunt Completed
Long $IDOL
Entry: 0.01269 – 0.01276
TP1: 0.01292
TP2: 0.01302
TP3: 0.01317
SL: 0.01261
📈 Institutional Buying Triggered! IDOL
#CryptoTrading. #BinanceSquareFamily #SmartMoneyConceptsCrypto #LiquidityHunt #TechnicalAnalysiss
1
1.5k

·
--
See translation
{spot}(BTCUSDT)
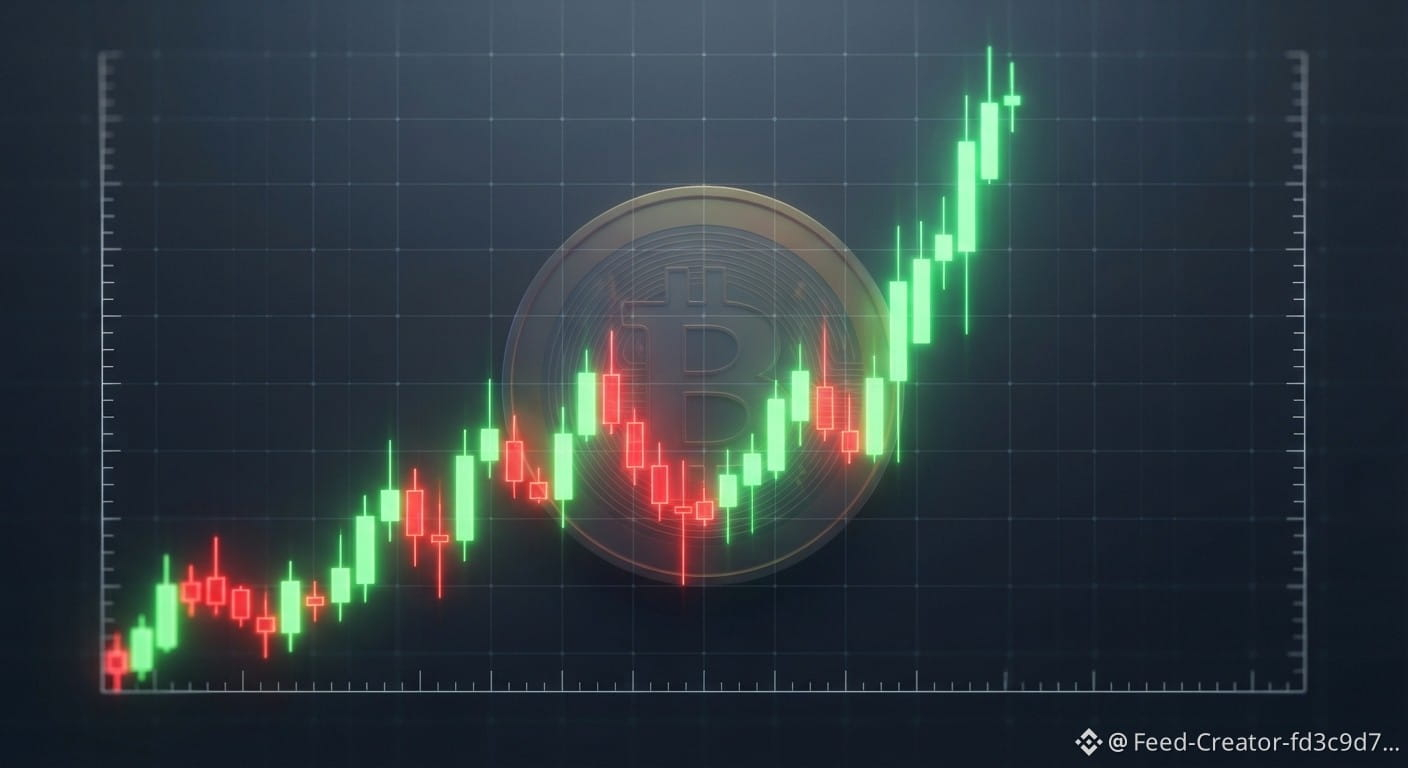
Is $BTC Preparing for a Massive Move? Key Levels to Watch Now!
Bitcoin is showing intense price action. After a brief period of consolidation, the market structure is tightly coiled, and a major volatility expansion is right around the corner.
Here is exactly what you need to track today:
📈 The Bull Case
• Resistance Breakout: A clean daily close above the immediate local resistance will trigger a wave of FOMO.
• Volume Surge: Institutional accumulation remains relentless, keeping the order books heavily supported.
📉 The Bear Case
• Liquidity Sweep: Watch out for a sudden wicked drop to hunt stop-losses before the real move starts.
• Support Test: If the immediate psychological floor breaks, we look to the next major moving average for buyers.
💡 My Strategy: Keep emotions out of it. Let the market confirm the breakout direction before forcing a high-leverage entry.
💬 Where do you think $BTC is heading next? Drop your price targets in the comments below! 👇
#bitcoin.” #CryptoNewss #TradingCommunity #BTC☀ #TechnicalAnalysiss
Is $BTC Preparing for a Massive Move? Key Levels to Watch Now!
Bitcoin is showing intense price action. After a brief period of consolidation, the market structure is tightly coiled, and a major volatility expansion is right around the corner.
Here is exactly what you need to track today:
📈 The Bull Case
• Resistance Breakout: A clean daily close above the immediate local resistance will trigger a wave of FOMO.
• Volume Surge: Institutional accumulation remains relentless, keeping the order books heavily supported.
📉 The Bear Case
• Liquidity Sweep: Watch out for a sudden wicked drop to hunt stop-losses before the real move starts.
• Support Test: If the immediate psychological floor breaks, we look to the next major moving average for buyers.
💡 My Strategy: Keep emotions out of it. Let the market confirm the breakout direction before forcing a high-leverage entry.
💬 Where do you think $BTC is heading next? Drop your price targets in the comments below! 👇
#bitcoin.” #CryptoNewss #TradingCommunity #BTC☀ #TechnicalAnalysiss
Bitcoin is showing intense price action. After a brief period of consolidation, the market structure is tightly coiled, and a major volatility expansion is right around the corner.
Here is exactly what you need to track today:
📈 The Bull Case
• Resistance Breakout: A clean daily close above the immediate local resistance will trigger a wave of FOMO.
• Volume Surge: Institutional accumulation remains relentless, keeping the order books heavily supported.
📉 The Bear Case
• Liquidity Sweep: Watch out for a sudden wicked drop to hunt stop-losses before the real move starts.
• Support Test: If the immediate psychological floor breaks, we look to the next major moving average for buyers.
💡 My Strategy: Keep emotions out of it. Let the market confirm the breakout direction before forcing a high-leverage entry.
💬 Where do you think $BTC is heading next? Drop your price targets in the comments below! 👇
#bitcoin.” #CryptoNewss #TradingCommunity #BTC☀ #TechnicalAnalysiss
111

·
--
See translation
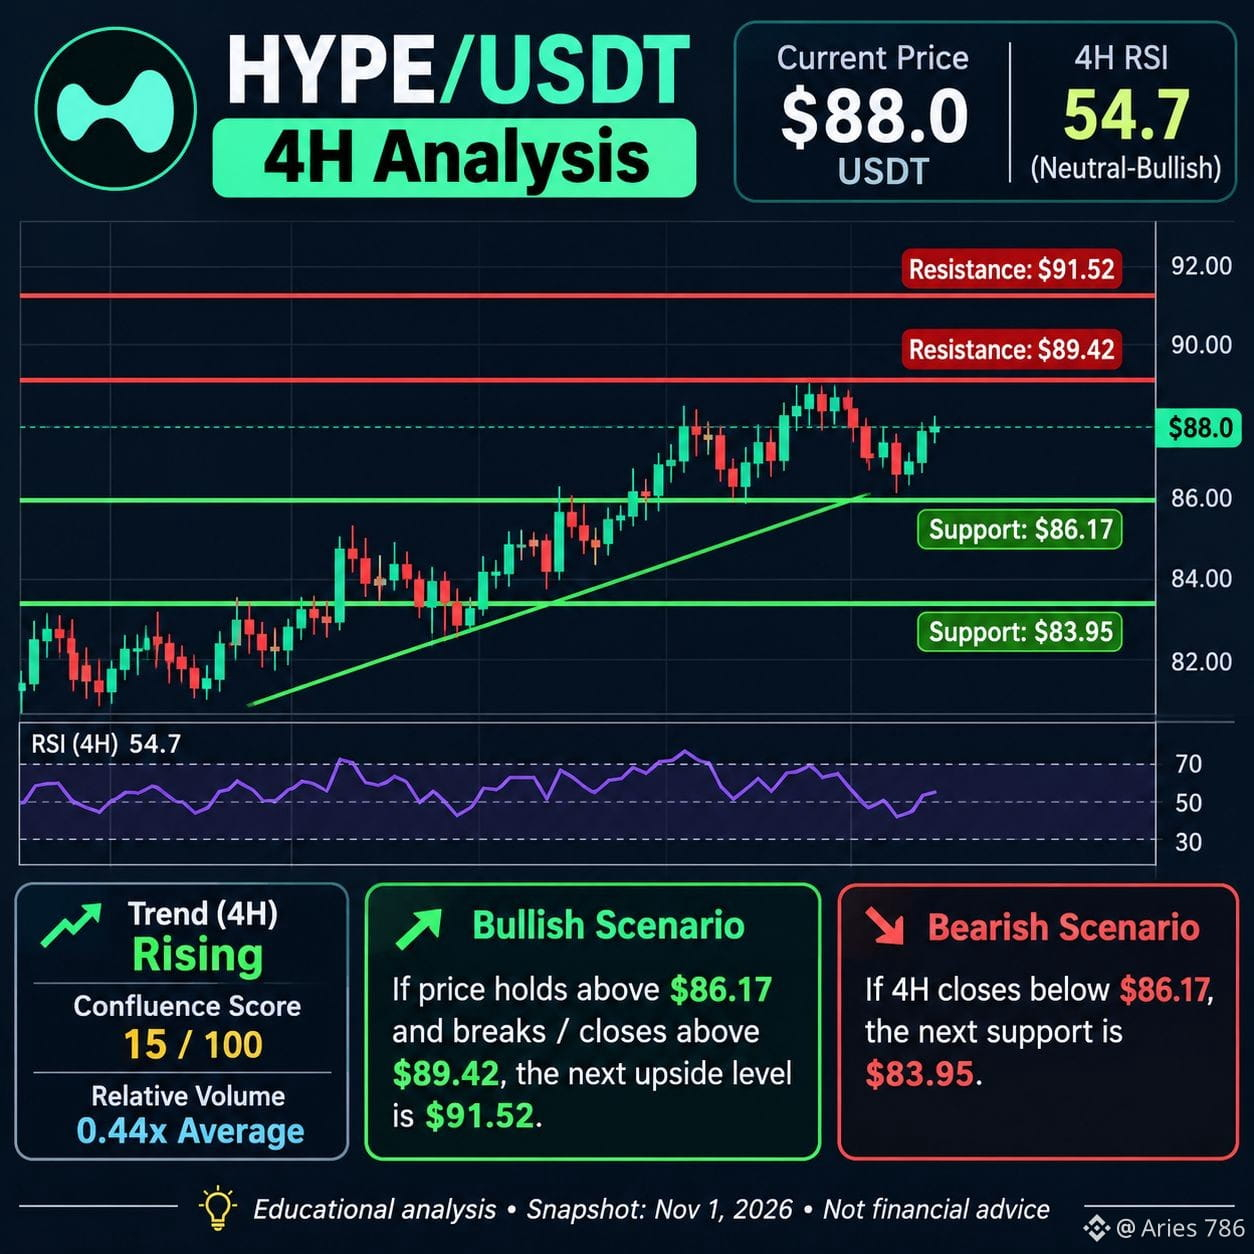
$HYPE/USDT
📅 November 1, 2026
$HYPE is trading around **$88.08**, showing mild bullish momentum with RSI near 55. Price is consolidating, and a breakout confirmation is needed.
🟢 **Support:** $86.79 – $86.17
🔴 **Resistance:** $88.12 – $89.42
🎯 **Upside Target:** $91.52
A breakout above $89.42 could strengthen bullish momentum, while a breakdown below $86.17 may bring further downside.
**Market Bias: Neutral to Bullish 📈**
Trade carefully and wait for 4H candle confirmation.
#USDT #CryptoAnalysis #TradingShot #TechnicalAnalysiss
$HYPE /USDT
📅 November 1, 2026
$HYPE is trading around **$88.08**, showing mild bullish momentum with RSI near 55. Price is consolidating, and a breakout confirmation is needed.
🟢 **Support:** $86.79 – $86.17
🔴 **Resistance:** $88.12 – $89.42
🎯 **Upside Target:** $91.52
A breakout above $89.42 could strengthen bullish momentum, while a breakdown below $86.17 may bring further downside.
**Market Bias: Neutral to Bullish 📈**
Trade carefully and wait for 4H candle confirmation.
#USDT #CryptoAnalysis #TradingShot #TechnicalAnalysiss
📅 November 1, 2026
$HYPE is trading around **$88.08**, showing mild bullish momentum with RSI near 55. Price is consolidating, and a breakout confirmation is needed.
🟢 **Support:** $86.79 – $86.17
🔴 **Resistance:** $88.12 – $89.42
🎯 **Upside Target:** $91.52
A breakout above $89.42 could strengthen bullish momentum, while a breakdown below $86.17 may bring further downside.
**Market Bias: Neutral to Bullish 📈**
Trade carefully and wait for 4H candle confirmation.
#USDT #CryptoAnalysis #TradingShot #TechnicalAnalysiss
178

·
--
See translation
$ETH
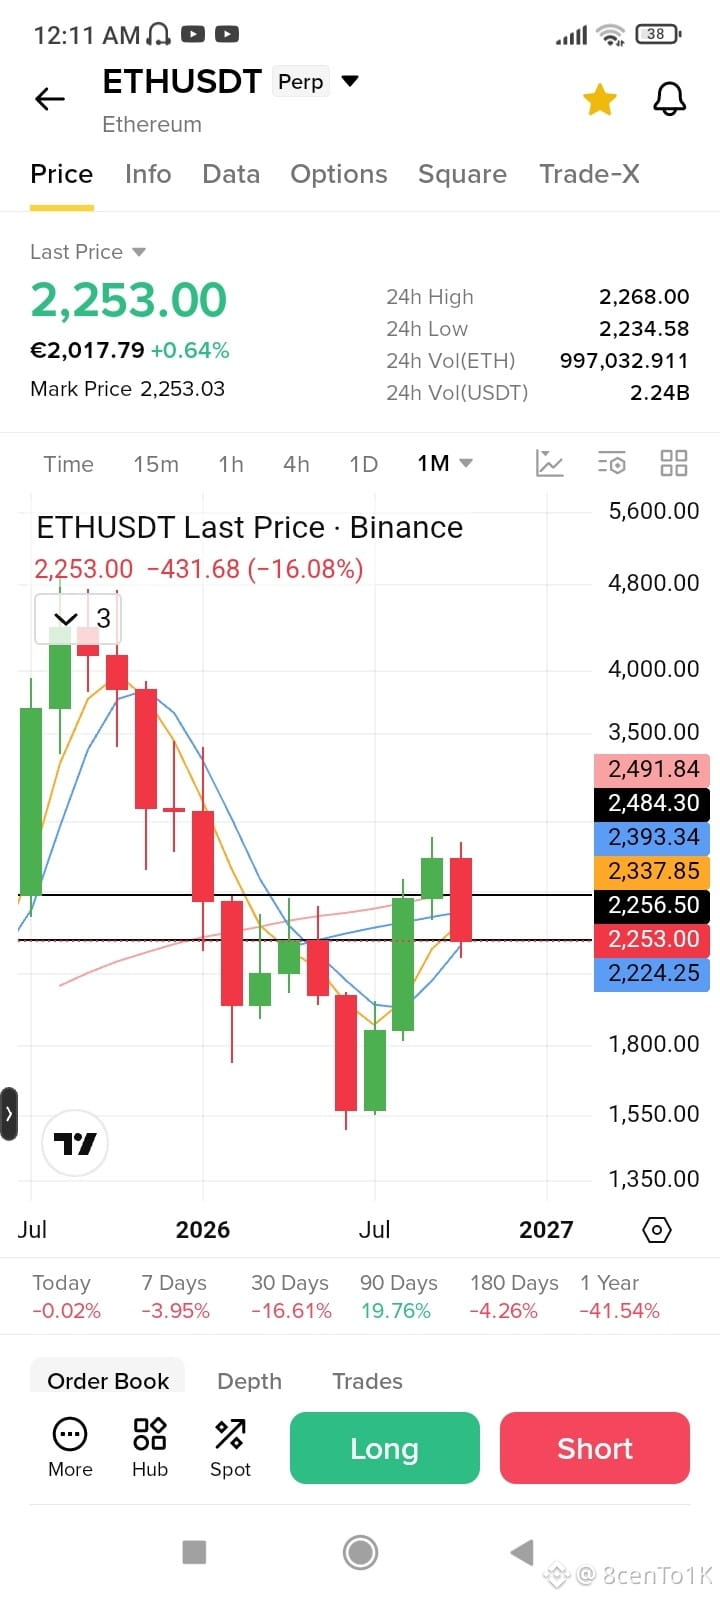
Ethereum at a Critical Crossroads: Why 2256 is the Ultimate Accumulation Zone
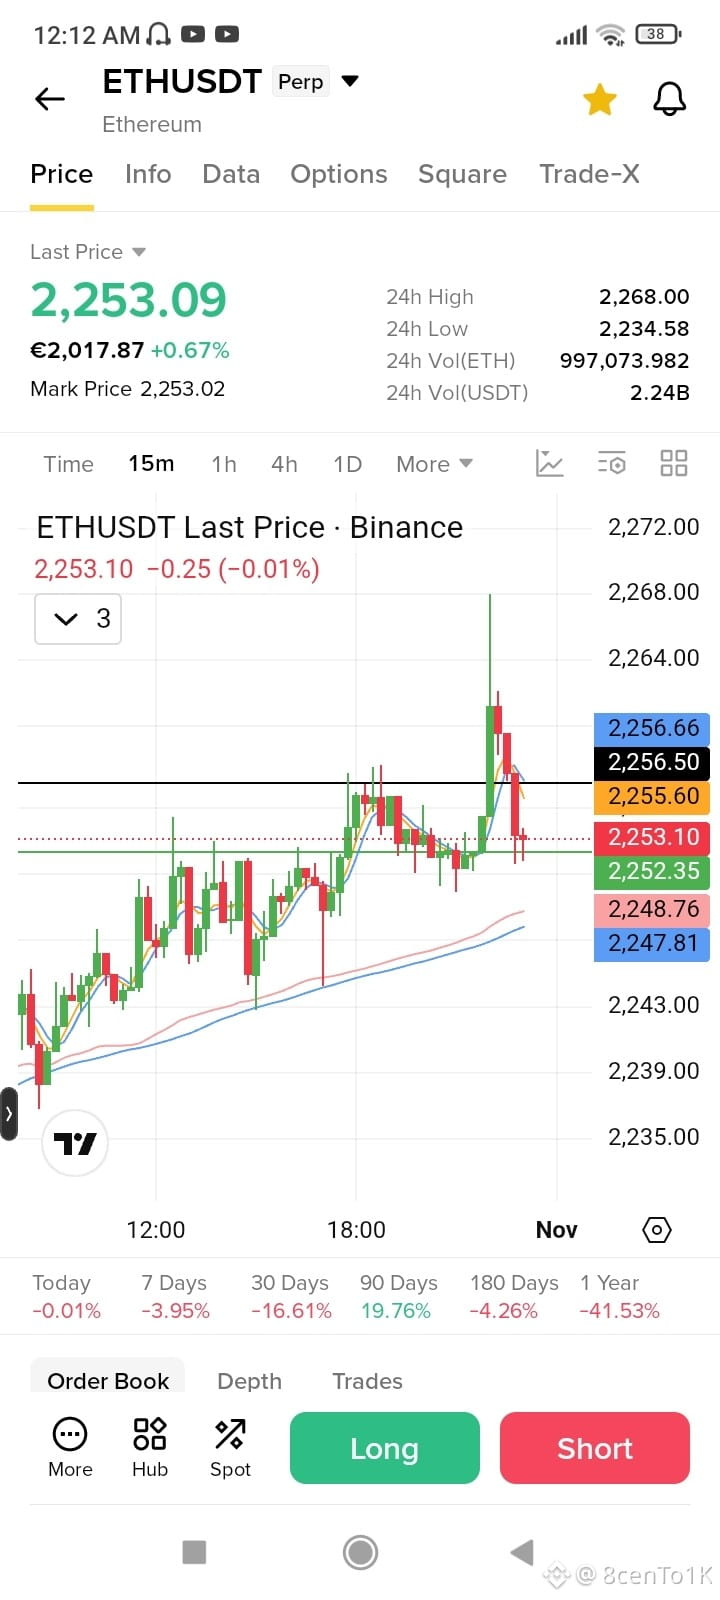
In the fast-paced world of crypto trading, noise often overshadows opportunity. Right now, Ethereum (ETH) is presenting a textbook setup that experienced market participants simply cannot ignore. If you are looking for a high-probability entry point, pay close attention to the 15-minute chart and the pivotal green-highlighted level.
We are staring at a major inflection point. For seasoned traders, a monthly close is not just another candle on a chart; it is a profound psychological and structural confirmation of market intent. Should Ethereum manage to secure a monthly close at or above the 2256 level, it will invalidate bearish momentum and validate this zone as a formidable, institutional-grade support level.
This isn't just about a quick intraday bounce; it’s about structural dominance. A monthly close defending 2256 sends a powerful message that buyers are firmly in control of macro timeframes, transforming this exact green zone into a prime accumulation area before the next impulsive leg up. Smart money doesn't chase green candles at the top—they position themselves when structural supports are rigorously defended on higher timeframes.
Manage your risk, watch the monthly close closely, and position yourself wisely. The market rewards those who trade with conviction, not emotion.
#ETH🔥🔥🔥🔥🔥🔥 #TechnicalAnalysiss #Binance
{future}(ETHUSDT)
$ETH
Ethereum at a Critical Crossroads: Why 2256 is the Ultimate Accumulation Zone
In the fast-paced world of crypto trading, noise often overshadows opportunity. Right now, Ethereum (ETH) is presenting a textbook setup that experienced market participants simply cannot ignore. If you are looking for a high-probability entry point, pay close attention to the 15-minute chart and the pivotal green-highlighted level.
We are staring at a major inflection point. For seasoned traders, a monthly close is not just another candle on a chart; it is a profound psychological and structural confirmation of market intent. Should Ethereum manage to secure a monthly close at or above the 2256 level, it will invalidate bearish momentum and validate this zone as a formidable, institutional-grade support level.
This isn't just about a quick intraday bounce; it’s about structural dominance. A monthly close defending 2256 sends a powerful message that buyers are firmly in control of macro timeframes, transforming this exact green zone into a prime accumulation area before the next impulsive leg up. Smart money doesn't chase green candles at the top—they position themselves when structural supports are rigorously defended on higher timeframes.
Manage your risk, watch the monthly close closely, and position yourself wisely. The market rewards those who trade with conviction, not emotion.
#ETH🔥🔥🔥🔥🔥🔥 #TechnicalAnalysiss #Binance
Ethereum at a Critical Crossroads: Why 2256 is the Ultimate Accumulation Zone
In the fast-paced world of crypto trading, noise often overshadows opportunity. Right now, Ethereum (ETH) is presenting a textbook setup that experienced market participants simply cannot ignore. If you are looking for a high-probability entry point, pay close attention to the 15-minute chart and the pivotal green-highlighted level.
We are staring at a major inflection point. For seasoned traders, a monthly close is not just another candle on a chart; it is a profound psychological and structural confirmation of market intent. Should Ethereum manage to secure a monthly close at or above the 2256 level, it will invalidate bearish momentum and validate this zone as a formidable, institutional-grade support level.
This isn't just about a quick intraday bounce; it’s about structural dominance. A monthly close defending 2256 sends a powerful message that buyers are firmly in control of macro timeframes, transforming this exact green zone into a prime accumulation area before the next impulsive leg up. Smart money doesn't chase green candles at the top—they position themselves when structural supports are rigorously defended on higher timeframes.
Manage your risk, watch the monthly close closely, and position yourself wisely. The market rewards those who trade with conviction, not emotion.
#ETH🔥🔥🔥🔥🔥🔥 #TechnicalAnalysiss #Binance
1
84

·
--
See translation
$DEXE QUIZ / POLL 🧠📊
The 1.504 level is acting very tricky right now, and resistance is creating serious market traps. For those looking to scalp on the 15-minute timeframe, what is your entry strategy at this moment?
👉 Vote for your combination:
Option A: 2 Green Candles close + Stop Loss at 1st Candle's bottom
Option B: 3 Green Candles close + Stop Loss at 1st Candle's bottom
Option C: 2 Green Candles close + Stop Loss below swing low / safe support
Option D: 3+ Green Candles close + Tight Risk Management
#SmartMoney #PriceActionAnalysis #TechnicalAnalysiss
$DEXE QUIZ / POLL 🧠📊
The 1.504 level is acting very tricky right now, and resistance is creating serious market traps. For those looking to scalp on the 15-minute timeframe, what is your entry strategy at this moment?
👉 Vote for your combination:
Option A: 2 Green Candles close + Stop Loss at 1st Candle's bottom
Option B: 3 Green Candles close + Stop Loss at 1st Candle's bottom
Option C: 2 Green Candles close + Stop Loss below swing low / safe support
Option D: 3+ Green Candles close + Tight Risk Management
#SmartMoney #PriceActionAnalysis #TechnicalAnalysiss
The 1.504 level is acting very tricky right now, and resistance is creating serious market traps. For those looking to scalp on the 15-minute timeframe, what is your entry strategy at this moment?
👉 Vote for your combination:
Option A: 2 Green Candles close + Stop Loss at 1st Candle's bottom
Option B: 3 Green Candles close + Stop Loss at 1st Candle's bottom
Option C: 2 Green Candles close + Stop Loss below swing low / safe support
Option D: 3+ Green Candles close + Tight Risk Management
#SmartMoney #PriceActionAnalysis #TechnicalAnalysiss
A
54%
B
17%
C
4%
D
25%
24 votes • Voting closed
2
2.3k


See translation
$STABLE 🐻
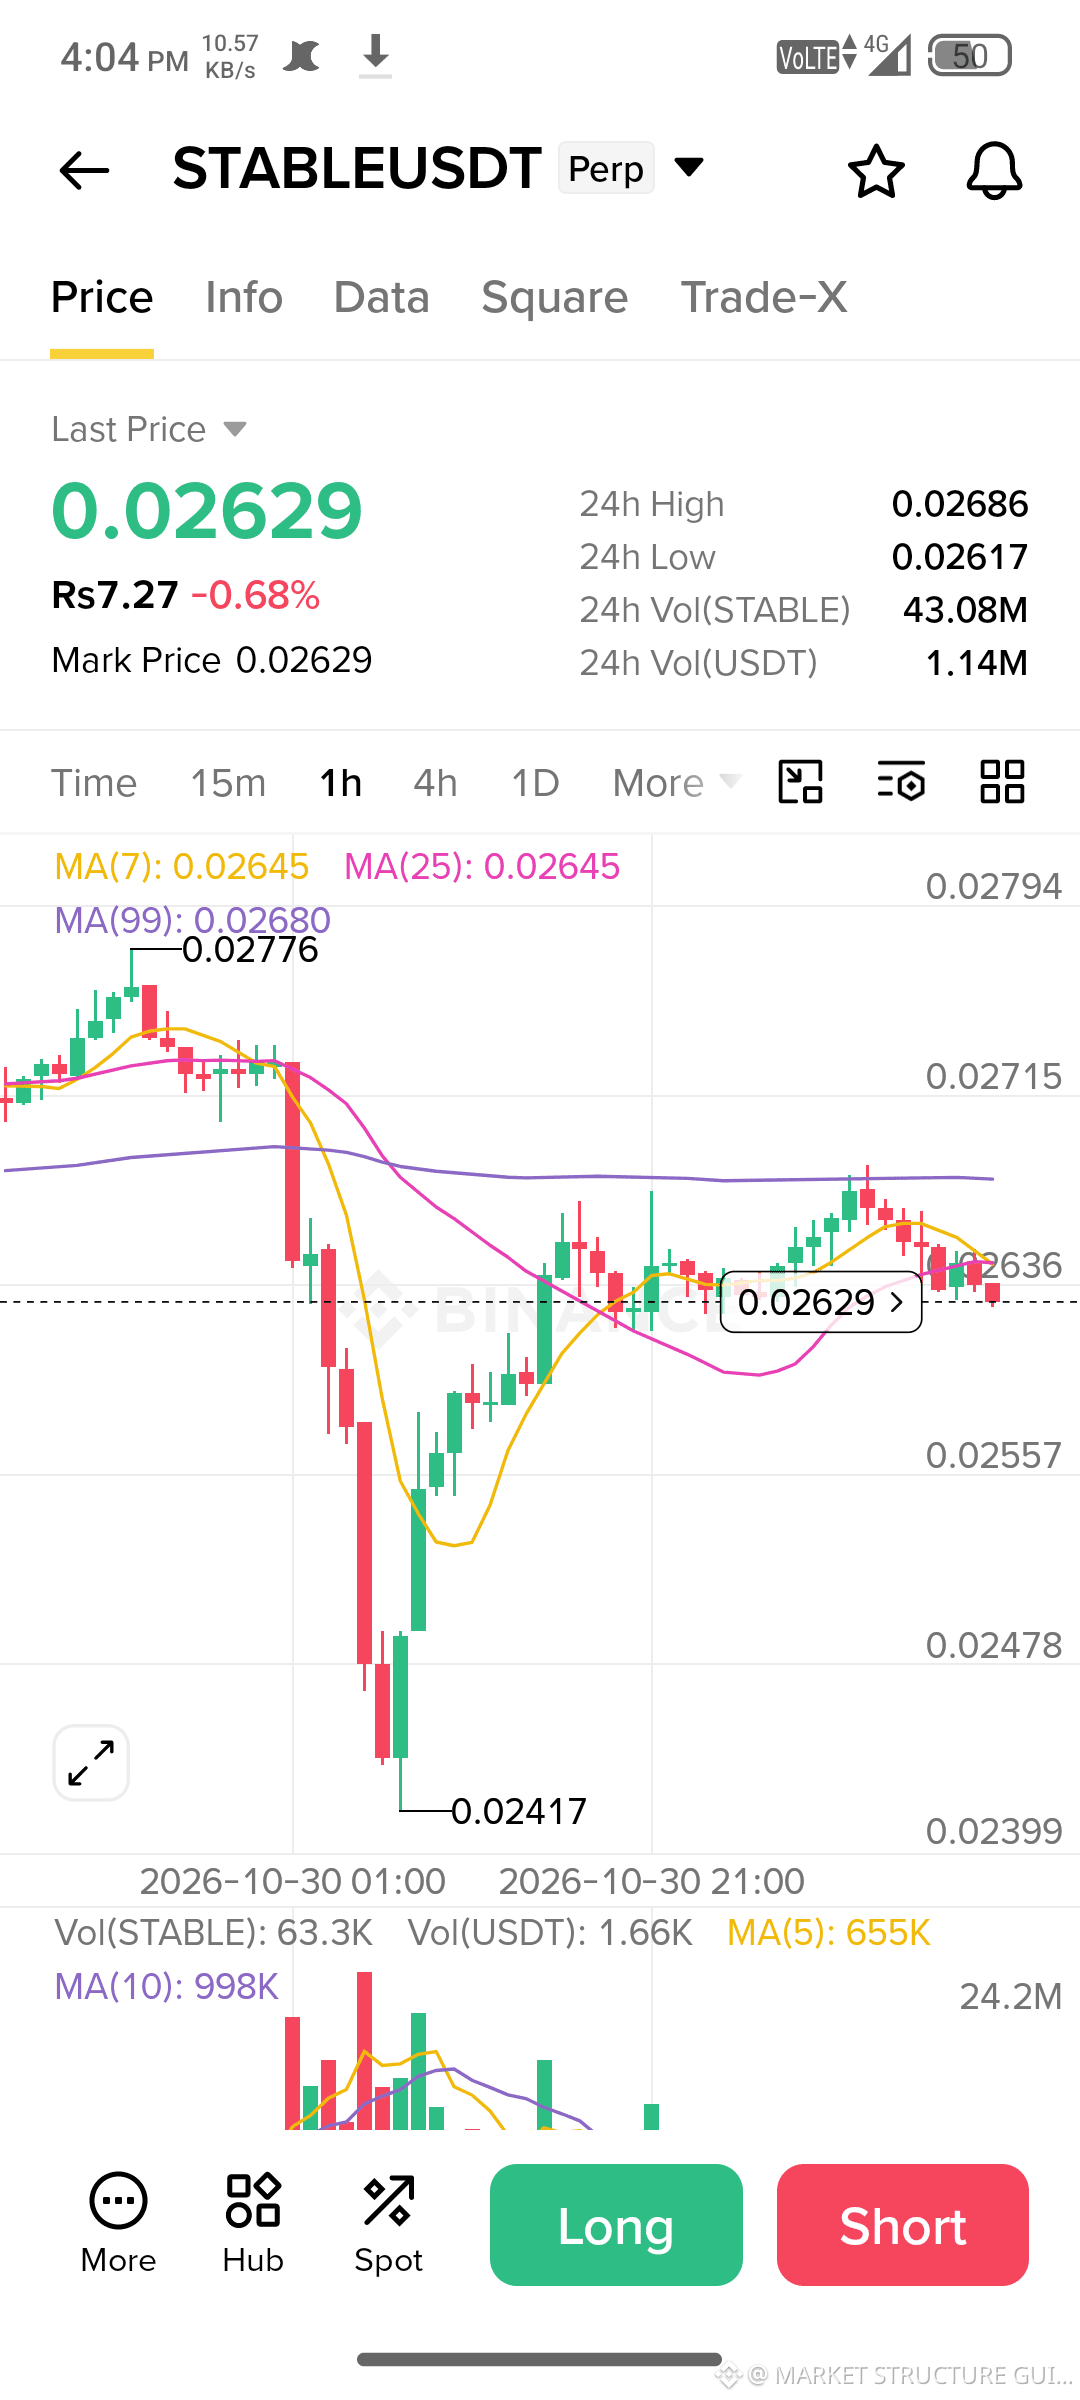
A Rising Wedge pattern is forming on the 1hour-min chart!
Price is trading around $0.02628 and showing weakening momentum inside an upward-sloping wedge.
📍 Resistance: $0.0266–$0.0268
📍 Support: $0.0260
🎯 Bearish target: $0.0255
A breakdown below the lower trendline could trigger another downside move. Watch for confirmation before entering.
#stable #crypto #TechnicalAnalysiss #Trading #ALTCOİNS
$STABLE 🐻
A Rising Wedge pattern is forming on the 1hour-min chart!
Price is trading around $0.02628 and showing weakening momentum inside an upward-sloping wedge.
📍 Resistance: $0.0266–$0.0268
📍 Support: $0.0260
🎯 Bearish target: $0.0255
A breakdown below the lower trendline could trigger another downside move. Watch for confirmation before entering.
#stable #crypto #TechnicalAnalysiss #Trading #ALTCOİNS
A Rising Wedge pattern is forming on the 1hour-min chart!
Price is trading around $0.02628 and showing weakening momentum inside an upward-sloping wedge.
📍 Resistance: $0.0266–$0.0268
📍 Support: $0.0260
🎯 Bearish target: $0.0255
A breakdown below the lower trendline could trigger another downside move. Watch for confirmation before entering.
#stable #crypto #TechnicalAnalysiss #Trading #ALTCOİNS
22

·
--
Bullish
#bnb #trading #TechnicalAnalysiss 📉⚡
🛡️ DIRECT HIT AND TACTICAL REACTION: How has BNB been behaving after being one of the hardest-hit assets? 📊🔄
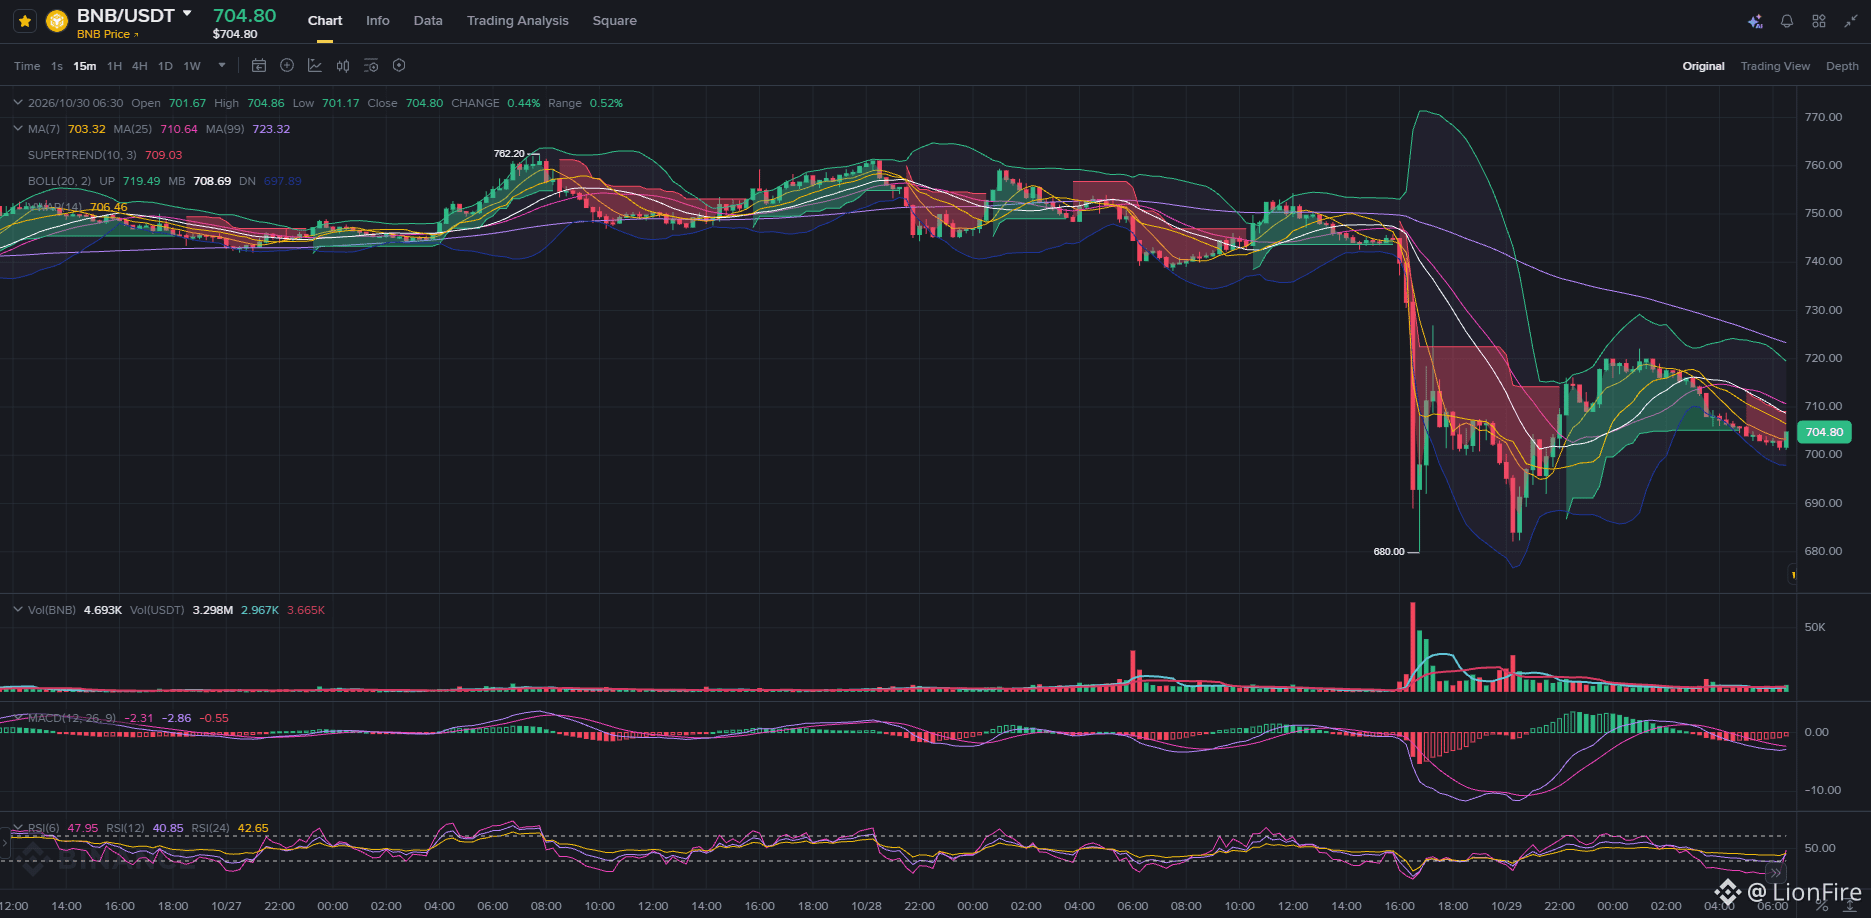
As it is directly linked to the central platform involved in the security incident reported yesterday, $BNB experienced firsthand the market’s greatest panic and liquidation pressure. However, price action over the past few hours gives us a very clear technical picture of how the market absorbed the blow and sought to stabilize.
🔍 1. Anatomy of the impact and recovery:
The initial plunge toward $680: Uncertainty around the news and widespread panic hit the native token hard, dragging it into a sharp decline that broke through previous support levels before reaching a local low of $680.00.
Tactical rebound and stabilization: Following the violent purge of leveraged positions, the price staged a relief rally, recovering toward the $710–$720 range before stabilizing at its current price of around $704.80.
Volume and compression: The massive volume spike recorded during the decline reflected the large-scale exit from speculative positions. This has now given way to a lower-volatility phase as momentum indicators seek to find balance.
🧠 2. Strategic perspective:
Assets directly associated with exchanges often take a disproportionate hit during crises because of market psychology. Trading in these conditions requires absolute composure: it’s not about reacting to an alarming headline, but about observing how price defends critical structural floors after the initial collapse.
💡 Extreme volatility tests every investor’s discipline. Protecting capital, waiting for institutional volume confirmation, and trading with a strict risk-management plan remain our best compass. Let’s keep a cool head and trade methodically! 🧠⚡
#bnb #trading #TechnicalAnalysiss 📉⚡
🛡️ DIRECT HIT AND TACTICAL REACTION: How has BNB been behaving after being one of the hardest-hit assets? 📊🔄
As it is directly linked to the central platform involved in the security incident reported yesterday, $BNB experienced firsthand the market’s greatest panic and liquidation pressure. However, price action over the past few hours gives us a very clear technical picture of how the market absorbed the blow and sought to stabilize.
🔍 1. Anatomy of the impact and recovery:
The initial plunge toward $680: Uncertainty around the news and widespread panic hit the native token hard, dragging it into a sharp decline that broke through previous support levels before reaching a local low of $680.00.
Tactical rebound and stabilization: Following the violent purge of leveraged positions, the price staged a relief rally, recovering toward the $710–$720 range before stabilizing at its current price of around $704.80.
Volume and compression: The massive volume spike recorded during the decline reflected the large-scale exit from speculative positions. This has now given way to a lower-volatility phase as momentum indicators seek to find balance.
🧠 2. Strategic perspective:
Assets directly associated with exchanges often take a disproportionate hit during crises because of market psychology. Trading in these conditions requires absolute composure: it’s not about reacting to an alarming headline, but about observing how price defends critical structural floors after the initial collapse.
💡 Extreme volatility tests every investor’s discipline. Protecting capital, waiting for institutional volume confirmation, and trading with a strict risk-management plan remain our best compass. Let’s keep a cool head and trade methodically! 🧠⚡
🛡️ DIRECT HIT AND TACTICAL REACTION: How has BNB been behaving after being one of the hardest-hit assets? 📊🔄
As it is directly linked to the central platform involved in the security incident reported yesterday, $BNB experienced firsthand the market’s greatest panic and liquidation pressure. However, price action over the past few hours gives us a very clear technical picture of how the market absorbed the blow and sought to stabilize.
🔍 1. Anatomy of the impact and recovery:
The initial plunge toward $680: Uncertainty around the news and widespread panic hit the native token hard, dragging it into a sharp decline that broke through previous support levels before reaching a local low of $680.00.
Tactical rebound and stabilization: Following the violent purge of leveraged positions, the price staged a relief rally, recovering toward the $710–$720 range before stabilizing at its current price of around $704.80.
Volume and compression: The massive volume spike recorded during the decline reflected the large-scale exit from speculative positions. This has now given way to a lower-volatility phase as momentum indicators seek to find balance.
🧠 2. Strategic perspective:
Assets directly associated with exchanges often take a disproportionate hit during crises because of market psychology. Trading in these conditions requires absolute composure: it’s not about reacting to an alarming headline, but about observing how price defends critical structural floors after the initial collapse.
💡 Extreme volatility tests every investor’s discipline. Protecting capital, waiting for institutional volume confirmation, and trading with a strict risk-management plan remain our best compass. Let’s keep a cool head and trade methodically! 🧠⚡
105

·
--
See translation
🚨🔥 $HYPE /USDT — NEW SIGNAL | BREAKOUT WATCH!
📊 The market is testing an important resistance zone. Wait for confirmation before taking a position!
🟢 LONG SETUP 🚀
📍 Entry: Break and hold above $82.60
🎯 TP1: $84.80
🎯 TP2: $87.30
🎯 TP3: $91.50
🛑 SL: $81.20
🔴 SHORT SETUP 📉
📍 Entry: Break and hold below $77.50
🎯 TP1: $76.40
🎯 TP2: $74.50
🎯 TP3: $72.50
🛑 SL: $78.70
📌 KEY LEVELS
Resistance: $82.60–$84.80
Support: $77.50–$76.40
⚠️ Don't chase the price! Wait for candle-close confirmation, use a stop-loss, and manage leverage carefully. No guaranteed profits.
❤️ LIKE this post!
🔁 SHARE with your trading friends!
➕ FOLLOW ME for more crypto signals and market updates!
💬 What are you watching — LONG 🚀 or SHORT 📉?
#Hyperium #HYPEUSDT❤️😂😂 #BİNANCESQUARE #CryptoSignals #AltcoinTrading #FuturesTrading #TechnicalAnalysiss
🚨🔥 $HYPE /USDT — NEW SIGNAL | BREAKOUT WATCH!
📊 The market is testing an important resistance zone. Wait for confirmation before taking a position!
🟢 LONG SETUP 🚀
📍 Entry: Break and hold above $82.60
🎯 TP1: $84.80
🎯 TP2: $87.30
🎯 TP3: $91.50
🛑 SL: $81.20
🔴 SHORT SETUP 📉
📍 Entry: Break and hold below $77.50
🎯 TP1: $76.40
🎯 TP2: $74.50
🎯 TP3: $72.50
🛑 SL: $78.70
📌 KEY LEVELS
Resistance: $82.60–$84.80
Support: $77.50–$76.40
⚠️ Don't chase the price! Wait for candle-close confirmation, use a stop-loss, and manage leverage carefully. No guaranteed profits.
❤️ LIKE this post!
🔁 SHARE with your trading friends!
➕ FOLLOW ME for more crypto signals and market updates!
💬 What are you watching — LONG 🚀 or SHORT 📉?
#Hyperium #HYPEUSDT❤️😂😂 #BİNANCESQUARE #CryptoSignals #AltcoinTrading #FuturesTrading #TechnicalAnalysiss
📊 The market is testing an important resistance zone. Wait for confirmation before taking a position!
🟢 LONG SETUP 🚀
📍 Entry: Break and hold above $82.60
🎯 TP1: $84.80
🎯 TP2: $87.30
🎯 TP3: $91.50
🛑 SL: $81.20
🔴 SHORT SETUP 📉
📍 Entry: Break and hold below $77.50
🎯 TP1: $76.40
🎯 TP2: $74.50
🎯 TP3: $72.50
🛑 SL: $78.70
📌 KEY LEVELS
Resistance: $82.60–$84.80
Support: $77.50–$76.40
⚠️ Don't chase the price! Wait for candle-close confirmation, use a stop-loss, and manage leverage carefully. No guaranteed profits.
❤️ LIKE this post!
🔁 SHARE with your trading friends!
➕ FOLLOW ME for more crypto signals and market updates!
💬 What are you watching — LONG 🚀 or SHORT 📉?
#Hyperium #HYPEUSDT❤️😂😂 #BİNANCESQUARE #CryptoSignals #AltcoinTrading #FuturesTrading #TechnicalAnalysiss
292
·
--
See translation
🚨🔥 $HYPE /USDT — FRESH SIGNAL | BREAKOUT ALERT!
📊 The market is at a key decision zone. Watch for confirmation before entering!
🟢 LONG SETUP 🚀
📍 Entry trigger: Break and hold above $82.60
🎯 TP1: $84.50
🎯 TP2: $86.80
🎯 TP3: $89.70
🛑 SL: $81.20
🔴 SHORT SETUP 📉
📍 Entry trigger: Break and hold below $78.40
🎯 TP1: $76.40
🎯 TP2: $75.40
🎯 TP3: $73.80
🛑 SL: $79.60
📌 KEY LEVELS
Resistance: $82.60
Support: $78.40–$75.40
⚠️ Wait for candle-close confirmation. Use a stop-loss and avoid excessive leverage. These are conditional setups, not guaranteed profits.
❤️ LIKE this post!
🔁 SHARE with your trading friends!
➕ FOLLOW ME for more crypto signals and market updates!
💬 Your move: LONG 🚀 or SHORT 📉?
#hype #HYPEUSDT #BinanceSquareVietnam #CryptoSignals #AltcoinTrading #FuturesTrading #TechnicalAnalysiss
🚨🔥 $HYPE /USDT — FRESH SIGNAL | BREAKOUT ALERT!
📊 The market is at a key decision zone. Watch for confirmation before entering!
🟢 LONG SETUP 🚀
📍 Entry trigger: Break and hold above $82.60
🎯 TP1: $84.50
🎯 TP2: $86.80
🎯 TP3: $89.70
🛑 SL: $81.20
🔴 SHORT SETUP 📉
📍 Entry trigger: Break and hold below $78.40
🎯 TP1: $76.40
🎯 TP2: $75.40
🎯 TP3: $73.80
🛑 SL: $79.60
📌 KEY LEVELS
Resistance: $82.60
Support: $78.40–$75.40
⚠️ Wait for candle-close confirmation. Use a stop-loss and avoid excessive leverage. These are conditional setups, not guaranteed profits.
❤️ LIKE this post!
🔁 SHARE with your trading friends!
➕ FOLLOW ME for more crypto signals and market updates!
💬 Your move: LONG 🚀 or SHORT 📉?
#hype #HYPEUSDT #BinanceSquareVietnam #CryptoSignals #AltcoinTrading #FuturesTrading #TechnicalAnalysiss
📊 The market is at a key decision zone. Watch for confirmation before entering!
🟢 LONG SETUP 🚀
📍 Entry trigger: Break and hold above $82.60
🎯 TP1: $84.50
🎯 TP2: $86.80
🎯 TP3: $89.70
🛑 SL: $81.20
🔴 SHORT SETUP 📉
📍 Entry trigger: Break and hold below $78.40
🎯 TP1: $76.40
🎯 TP2: $75.40
🎯 TP3: $73.80
🛑 SL: $79.60
📌 KEY LEVELS
Resistance: $82.60
Support: $78.40–$75.40
⚠️ Wait for candle-close confirmation. Use a stop-loss and avoid excessive leverage. These are conditional setups, not guaranteed profits.
❤️ LIKE this post!
🔁 SHARE with your trading friends!
➕ FOLLOW ME for more crypto signals and market updates!
💬 Your move: LONG 🚀 or SHORT 📉?
#hype #HYPEUSDT #BinanceSquareVietnam #CryptoSignals #AltcoinTrading #FuturesTrading #TechnicalAnalysiss
9

·
--
See translation
$SOLUSDT — Pullback Entry, Not Pump Chasing
$SOL is showing a potential pullback-long setup after trading near $101.79 with a reported gain of 1.68%. Buyers should demonstrate support around $100.80–$101.20 before attempting a move toward nearby resistance.
EP: $100.80–$101.20
TP1: $102.00
TP2: $102.50
TP3: $103.00
SL: $100.20
The entry zone offers a possible retracement opportunity, but support must be confirmed by a bullish reaction. A recovery above $101.80 would strengthen the case, while a decisive move below $100.20 invalidates the setup. Approximate risk/reward to TP3 is 2.5:1 from the midpoint, before fees and slippage. Do not enter simply because SOL is already trading higher.
#SOL #Solana #CryptoFutures #TechnicalAnalysiss
$SOLUSDT — Pullback Entry, Not Pump Chasing
$SOL is showing a potential pullback-long setup after trading near $101.79 with a reported gain of 1.68%. Buyers should demonstrate support around $100.80–$101.20 before attempting a move toward nearby resistance.
EP: $100.80–$101.20
TP1: $102.00
TP2: $102.50
TP3: $103.00
SL: $100.20
The entry zone offers a possible retracement opportunity, but support must be confirmed by a bullish reaction. A recovery above $101.80 would strengthen the case, while a decisive move below $100.20 invalidates the setup. Approximate risk/reward to TP3 is 2.5:1 from the midpoint, before fees and slippage. Do not enter simply because SOL is already trading higher.
#SOL #Solana #CryptoFutures #TechnicalAnalysiss
$SOL is showing a potential pullback-long setup after trading near $101.79 with a reported gain of 1.68%. Buyers should demonstrate support around $100.80–$101.20 before attempting a move toward nearby resistance.
EP: $100.80–$101.20
TP1: $102.00
TP2: $102.50
TP3: $103.00
SL: $100.20
The entry zone offers a possible retracement opportunity, but support must be confirmed by a bullish reaction. A recovery above $101.80 would strengthen the case, while a decisive move below $100.20 invalidates the setup. Approximate risk/reward to TP3 is 2.5:1 from the midpoint, before fees and slippage. Do not enter simply because SOL is already trading higher.
#SOL #Solana #CryptoFutures #TechnicalAnalysiss
1
81

·
--
See translation
$STM
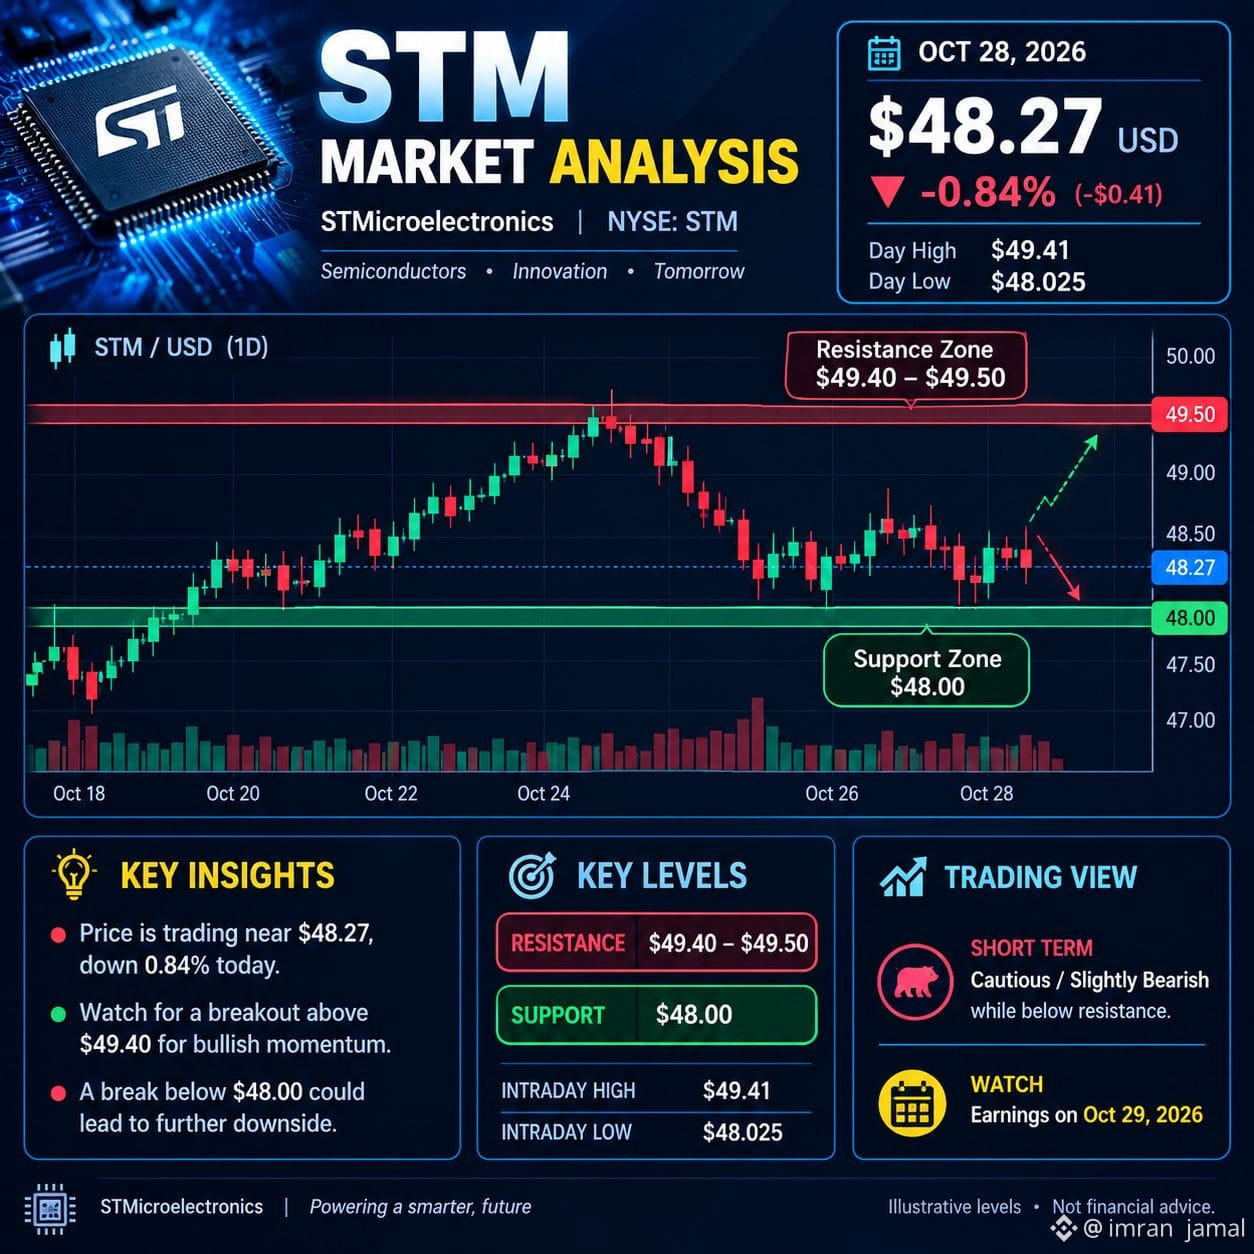
📊 STM MARKET ANALYSIS | OCT 28, 2026
🔴 Current Price: $48.27
📉 STM is trading lower today after recent gains, showing short-term selling pressure.
🟢 Support: $48.00
🔴 Resistance: $49.40–$49.50
📈 Bullish Signal: A breakout above $49.50 could support further upside.
⚠️ Bearish Signal: A break below $48.00 could trigger additional selling.
📅 Watch: Earnings scheduled for October 29.
#STMXUSDT #stockmarketupdate #TechnicalAnalysiss #trading
{future}(STMUSDT)
$STM
📊 STM MARKET ANALYSIS | OCT 28, 2026
🔴 Current Price: $48.27
📉 STM is trading lower today after recent gains, showing short-term selling pressure.
🟢 Support: $48.00
🔴 Resistance: $49.40–$49.50
📈 Bullish Signal: A breakout above $49.50 could support further upside.
⚠️ Bearish Signal: A break below $48.00 could trigger additional selling.
📅 Watch: Earnings scheduled for October 29.
#STMXUSDT #stockmarketupdate #TechnicalAnalysiss #trading
📊 STM MARKET ANALYSIS | OCT 28, 2026
🔴 Current Price: $48.27
📉 STM is trading lower today after recent gains, showing short-term selling pressure.
🟢 Support: $48.00
🔴 Resistance: $49.40–$49.50
📈 Bullish Signal: A breakout above $49.50 could support further upside.
⚠️ Bearish Signal: A break below $48.00 could trigger additional selling.
📅 Watch: Earnings scheduled for October 29.
#STMXUSDT #stockmarketupdate #TechnicalAnalysiss #trading
208
Log in to explore more content
Join global crypto users on Binance Square
⚡️ Get latest and useful information about crypto.
💬 Trusted by the world’s largest crypto exchange.
👍 Discover real insights from verified creators.
Email / Phone number
Trending Topics
1
#JobsReportRaisesHikeOdds
254,497 views
2,017 Discussing
2
#CPITestsDecemberRateOutlook
20,543 views
301 Discussing
3
#BitcoinRebounds$75KAsChipsLead
21,176 views
223 Discussing
4
#US Data Center Rules May Constrain AI Expansion
39,307 views
155 Discussing
5
#ARKPlans14ThematicETFsCoveringAIAndTokenizedMarkets
227 views
10 Discussing
6
#WillAnthropicListOnTime
61,711 views
790 Discussing
7
#WillUS-IranTensionsBoostSafe-HavenDemand?
12,036 views
118 Discussing
8
#BitcoinETFsSee$412MNetOutflows
3,319 views
46 Discussing
9
#HKSFCPlansToRestrictCryptoAndExchangeTerms
13,019 views
235 Discussing
10
#TradFiForBeginners
39,828 views
597 Discussing