
#farcamcrypto
farcamcrypto
1 views
3 Discussing
Hot
Latest

·
--
Article
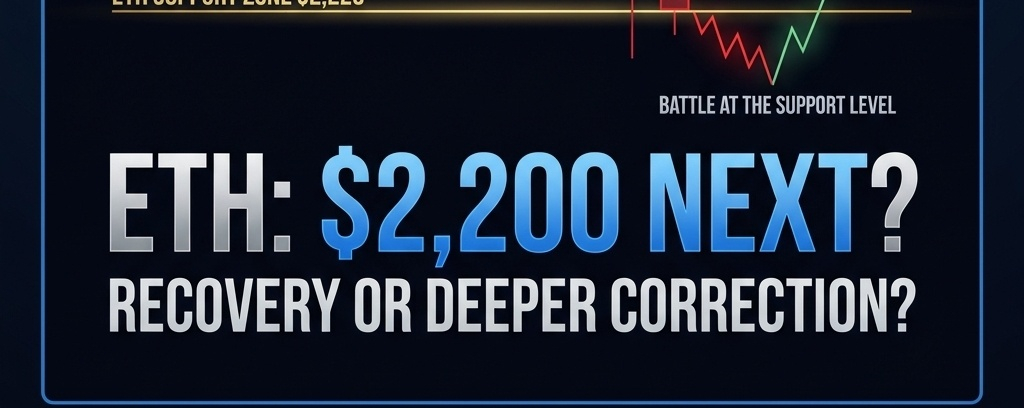
ETH Drops Below $2,250: Is Ethereum Heading for Another Major Test?Ethereum is facing renewed selling pressure.
At the time of the provided Binance chart screenshots, ETH was trading near $2,247.50, down approximately 6.75% in 24 hours.
The bigger concern is that weakness is visible across all four major timeframes: 15-minute, 1-hour, 4-hour and daily.
But does this correction create another opportunity for buyers, or should traders prepare for further downside?
1. 15-Minute Chart: Short-Term Buyers Under Pressure
Moving averages:
MA7: $2,255.80MA25: $2,278.48MA99: $2,384.66
ETH is trading below all three moving averages. Even a short-term recovery needs to reclaim the $2,255–$2,278 area before momentum can improve.
2. 1-Hour Chart: Bearish Structure Continues
Moving averages:
MA7: $2,268.58MA25: $2,377.45MA99: $2,312.30
The price remains below all three averages, suggesting sellers still have the advantage.
A recovery above $2,268 would be an early sign of stabilization, while $2,312–$2,377 remains a more important resistance region.
3. 4-Hour Chart: A Critical Technical Test
Moving averages:
MA7: $2,349.77MA25: $2,309.56MA99: $2,335.39
ETH is significantly below all three moving averages.
This is an important warning because the 4-hour structure has weakened. Buyers need to reclaim the $2,310–$2,350 region to improve the outlook.
4. Daily Chart: The Bigger Trend Needs Repair
Moving averages:
MA7: $2,282.34MA25: $2,364.24MA99: $2,366.20
The daily chart also shows ETH below all three moving averages.
This suggests that the current weakness is not limited to a few short-term candles. A stronger recovery will require buyers to reclaim important daily resistance levels.
Key ETH Levels to Watch
Support zones:
$2,236–$2,226$2,174$2,144
Resistance zones:
$2,255–$2,278$2,309–$2,366$2,384
A sustained break below $2,226 could expose the lower support levels.
On the other hand, reclaiming $2,278 and then $2,310 with stronger buying volume could indicate an improving recovery attempt.
What Should ETH Traders Watch Now?
The four-timeframe picture currently favors caution.
A falling price does not automatically mean it is time to buy, and a recovery candle does not automatically confirm a reversal.
The next important development is whether buyers can defend the $2,226 area and reclaim short-term moving averages.
Community question:
Is ETH preparing for a recovery, or could $2,200 become the next major test?
Are you watching for a bounce or waiting for stronger confirmation?
Share your analysis below.
Disclaimer: This article is based on the Binance chart screenshots provided, not live market data. It is for educational purposes only and is not financial advice. Cryptocurrency trading involves significant risk.
#Ethereum #ETH #BinancePick #CryptoAnalysis #Bitcoin #Altcoins #TrendingTopic #farcamcrypto #TechnicalAnalysiss
ETH Drops Below $2,250: Is Ethereum Heading for Another Major Test?
Ethereum is facing renewed selling pressure.
At the time of the provided Binance chart screenshots, ETH was trading near $2,247.50, down approximately 6.75% in 24 hours.
The bigger concern is that weakness is visible across all four major timeframes: 15-minute, 1-hour, 4-hour and daily.
But does this correction create another opportunity for buyers, or should traders prepare for further downside?
1. 15-Minute Chart: Short-Term Buyers Under Pressure
Moving averages:
MA7: $2,255.80MA25: $2,278.48MA99: $2,384.66
ETH is trading below all three moving averages. Even a short-term recovery needs to reclaim the $2,255–$2,278 area before momentum can improve.
2. 1-Hour Chart: Bearish Structure Continues
Moving averages:
MA7: $2,268.58MA25: $2,377.45MA99: $2,312.30
The price remains below all three averages, suggesting sellers still have the advantage.
A recovery above $2,268 would be an early sign of stabilization, while $2,312–$2,377 remains a more important resistance region.
3. 4-Hour Chart: A Critical Technical Test
Moving averages:
MA7: $2,349.77MA25: $2,309.56MA99: $2,335.39
ETH is significantly below all three moving averages.
This is an important warning because the 4-hour structure has weakened. Buyers need to reclaim the $2,310–$2,350 region to improve the outlook.
4. Daily Chart: The Bigger Trend Needs Repair
Moving averages:
MA7: $2,282.34MA25: $2,364.24MA99: $2,366.20
The daily chart also shows ETH below all three moving averages.
This suggests that the current weakness is not limited to a few short-term candles. A stronger recovery will require buyers to reclaim important daily resistance levels.
Key ETH Levels to Watch
Support zones:
$2,236–$2,226$2,174$2,144
Resistance zones:
$2,255–$2,278$2,309–$2,366$2,384
A sustained break below $2,226 could expose the lower support levels.
On the other hand, reclaiming $2,278 and then $2,310 with stronger buying volume could indicate an improving recovery attempt.
What Should ETH Traders Watch Now?
The four-timeframe picture currently favors caution.
A falling price does not automatically mean it is time to buy, and a recovery candle does not automatically confirm a reversal.
The next important development is whether buyers can defend the $2,226 area and reclaim short-term moving averages.
Community question:
Is ETH preparing for a recovery, or could $2,200 become the next major test?
Are you watching for a bounce or waiting for stronger confirmation?
Share your analysis below.
Disclaimer: This article is based on the Binance chart screenshots provided, not live market data. It is for educational purposes only and is not financial advice. Cryptocurrency trading involves significant risk.
#Ethereum #ETH #BinancePick #CryptoAnalysis #Bitcoin #Altcoins #TrendingTopic #farcamcrypto #TechnicalAnalysiss
At the time of the provided Binance chart screenshots, ETH was trading near $2,247.50, down approximately 6.75% in 24 hours.
The bigger concern is that weakness is visible across all four major timeframes: 15-minute, 1-hour, 4-hour and daily.
But does this correction create another opportunity for buyers, or should traders prepare for further downside?
1. 15-Minute Chart: Short-Term Buyers Under Pressure
Moving averages:
MA7: $2,255.80MA25: $2,278.48MA99: $2,384.66
ETH is trading below all three moving averages. Even a short-term recovery needs to reclaim the $2,255–$2,278 area before momentum can improve.
2. 1-Hour Chart: Bearish Structure Continues
Moving averages:
MA7: $2,268.58MA25: $2,377.45MA99: $2,312.30
The price remains below all three averages, suggesting sellers still have the advantage.
A recovery above $2,268 would be an early sign of stabilization, while $2,312–$2,377 remains a more important resistance region.
3. 4-Hour Chart: A Critical Technical Test
Moving averages:
MA7: $2,349.77MA25: $2,309.56MA99: $2,335.39
ETH is significantly below all three moving averages.
This is an important warning because the 4-hour structure has weakened. Buyers need to reclaim the $2,310–$2,350 region to improve the outlook.
4. Daily Chart: The Bigger Trend Needs Repair
Moving averages:
MA7: $2,282.34MA25: $2,364.24MA99: $2,366.20
The daily chart also shows ETH below all three moving averages.
This suggests that the current weakness is not limited to a few short-term candles. A stronger recovery will require buyers to reclaim important daily resistance levels.
Key ETH Levels to Watch
Support zones:
$2,236–$2,226$2,174$2,144
Resistance zones:
$2,255–$2,278$2,309–$2,366$2,384
A sustained break below $2,226 could expose the lower support levels.
On the other hand, reclaiming $2,278 and then $2,310 with stronger buying volume could indicate an improving recovery attempt.
What Should ETH Traders Watch Now?
The four-timeframe picture currently favors caution.
A falling price does not automatically mean it is time to buy, and a recovery candle does not automatically confirm a reversal.
The next important development is whether buyers can defend the $2,226 area and reclaim short-term moving averages.
Community question:
Is ETH preparing for a recovery, or could $2,200 become the next major test?
Are you watching for a bounce or waiting for stronger confirmation?
Share your analysis below.
Disclaimer: This article is based on the Binance chart screenshots provided, not live market data. It is for educational purposes only and is not financial advice. Cryptocurrency trading involves significant risk.
#Ethereum #ETH #BinancePick #CryptoAnalysis #Bitcoin #Altcoins #TrendingTopic #farcamcrypto #TechnicalAnalysiss
63
Log in to explore more content
Join global crypto users on Binance Square
⚡️ Get latest and useful information about crypto.
💬 Trusted by the world’s largest crypto exchange.
👍 Discover real insights from verified creators.
Email / Phone number
Trending Topics
1
#BinanceReopensWithdrawalsForMoreAssets
920,893 views
4,743 Discussing
2
#Binance98PercentReplenished
228,476 views
1,957 Discussing
3
#USStocksSlipandCryptoMarketUnderBroadPressure
29,266 views
289 Discussing
4
#StrategySTRCResumesIssuanceAfterOver170Days
30,995 views
445 Discussing
5
#ADPUSPrivateEmployersAdd86000JobsInOctober
48,793 views
607 Discussing
6
#KazakhstanReportedlyInvests$100MInCryptoFunds
3,582 views
64 Discussing
7
#SouthKoreaSeeksCryptoTaxDelayUntil2029
28,642 views
270 Discussing
8
#USMidterms-WhatAreMarketsExpecting?
687,511 views
2,991 Discussing
9
#US10YearTreasuryYieldFallsTo4.845%
44,535 views
210 Discussing
10
#ZcashExpectsNU7ToMake$16MSproutZECInaccessible
2,354 views
24 Discussing