
Tragic263
34 Posts

Tragic263
Report
Block User
Open Trade
Frequent Trader
3.6 Years
16 Following
19 Followers
14 Liked
Posts
Portfolio
All
Quotes
·
--
#2025withBinance Start your crypto story with the @Binance Year in Review and share your highlights! #2025withBinance.
👉 Sign up with my link and get 100 USD rewards! https://www.binance.com/year-in-review/2025-with-binance?ref=564173710
#2025withBinance Start your crypto story with the @Binance Year in Review and share your highlights! #2025withBinance.
👉 Sign up with my link and get 100 USD rewards! https://www.binance.com/year-in-review/2025-with-binance?ref=564173710
👉 Sign up with my link and get 100 USD rewards! https://www.binance.com/year-in-review/2025-with-binance?ref=564173710


·
--
Bearish
---
🧠 Trade Setup: Bounce from Oversold Zone
📌 Assumptions Based on Chart
- RSI is near or below 30 → Oversold
- Price is hugging the lower Bollinger Band → Volatility + potential bounce
- MACD is flattening → Momentum may be shifting
- Order book shows 67% sell pressure → Still bearish, but could reverse
---
🟢 Entry Point
- Buy Zone: Around 1,150 USDT
This is close to the 24h low and near support. You wait for a small bullish candle or RSI to tick upward before entering.
---
🛑 Stop-Loss
- Set at: 1,135 USDT
Just below the recent low (1,143.01). This protects you if the price keeps falling.
---
🎯 Take-Profit Targets
| Target Level | Reason | Profit Potential |
|--------------|--------|------------------|
| 1,175 USDT | Minor resistance | Quick scalp |
| 1,200 USDT | Round number + previous support | Safer exit |
| 1,220 USDT | Mid-range between low and high | Stronger bounce |
You can use a trailing stop if price moves up, locking in gains while letting profits run.
---
📊 Risk-Reward Ratio
- Risk: ~15 USDT (from 1,150 to 1,135)
- Reward: ~50–70 USDT (if targeting 1,200–1,220)
- Risk-Reward: ~1:3 to 1:4 — solid setup!
---
🧭 Bonus Tip: Confirmation Checklist
Before entering:
- ✅ RSI starts rising from oversold
- ✅ MACD histogram shrinks or flips green
- ✅ Small bullish candle forms near support
- ✅ Volume increases on green candles
---#MarketPullback #BinanceHODLerENSO #BinanceHODLerYB #bnb #BNB_Market_Update
---
🧠 Trade Setup: Bounce from Oversold Zone
📌 Assumptions Based on Chart
- RSI is near or below 30 → Oversold
- Price is hugging the lower Bollinger Band → Volatility + potential bounce
- MACD is flattening → Momentum may be shifting
- Order book shows 67% sell pressure → Still bearish, but could reverse
---
🟢 Entry Point
- Buy Zone: Around 1,150 USDT
This is close to the 24h low and near support. You wait for a small bullish candle or RSI to tick upward before entering.
---
🛑 Stop-Loss
- Set at: 1,135 USDT
Just below the recent low (1,143.01). This protects you if the price keeps falling.
---
🎯 Take-Profit Targets
| Target Level | Reason | Profit Potential |
|--------------|--------|------------------|
| 1,175 USDT | Minor resistance | Quick scalp |
| 1,200 USDT | Round number + previous support | Safer exit |
| 1,220 USDT | Mid-range between low and high | Stronger bounce |
You can use a trailing stop if price moves up, locking in gains while letting profits run.
---
📊 Risk-Reward Ratio
- Risk: ~15 USDT (from 1,150 to 1,135)
- Reward: ~50–70 USDT (if targeting 1,200–1,220)
- Risk-Reward: ~1:3 to 1:4 — solid setup!
---
🧭 Bonus Tip: Confirmation Checklist
Before entering:
- ✅ RSI starts rising from oversold
- ✅ MACD histogram shrinks or flips green
- ✅ Small bullish candle forms near support
- ✅ Volume increases on green candles
---#MarketPullback #BinanceHODLerENSO #BinanceHODLerYB #bnb #BNB_Market_Update
---
🧠 Trade Setup: Bounce from Oversold Zone
📌 Assumptions Based on Chart
- RSI is near or below 30 → Oversold
- Price is hugging the lower Bollinger Band → Volatility + potential bounce
- MACD is flattening → Momentum may be shifting
- Order book shows 67% sell pressure → Still bearish, but could reverse
---
🟢 Entry Point
- Buy Zone: Around 1,150 USDT
This is close to the 24h low and near support. You wait for a small bullish candle or RSI to tick upward before entering.
---
🛑 Stop-Loss
- Set at: 1,135 USDT
Just below the recent low (1,143.01). This protects you if the price keeps falling.
---
🎯 Take-Profit Targets
| Target Level | Reason | Profit Potential |
|--------------|--------|------------------|
| 1,175 USDT | Minor resistance | Quick scalp |
| 1,200 USDT | Round number + previous support | Safer exit |
| 1,220 USDT | Mid-range between low and high | Stronger bounce |
You can use a trailing stop if price moves up, locking in gains while letting profits run.
---
📊 Risk-Reward Ratio
- Risk: ~15 USDT (from 1,150 to 1,135)
- Reward: ~50–70 USDT (if targeting 1,200–1,220)
- Risk-Reward: ~1:3 to 1:4 — solid setup!
---
🧭 Bonus Tip: Confirmation Checklist
Before entering:
- ✅ RSI starts rising from oversold
- ✅ MACD histogram shrinks or flips green
- ✅ Small bullish candle forms near support
- ✅ Volume increases on green candles
---#MarketPullback #BinanceHODLerENSO #BinanceHODLerYB #bnb #BNB_Market_Update
8
·
--
Bullish
7
·
--
🔹 Current Situation
#open #BNBBreaks1000 #BNBChainEcosystemRally
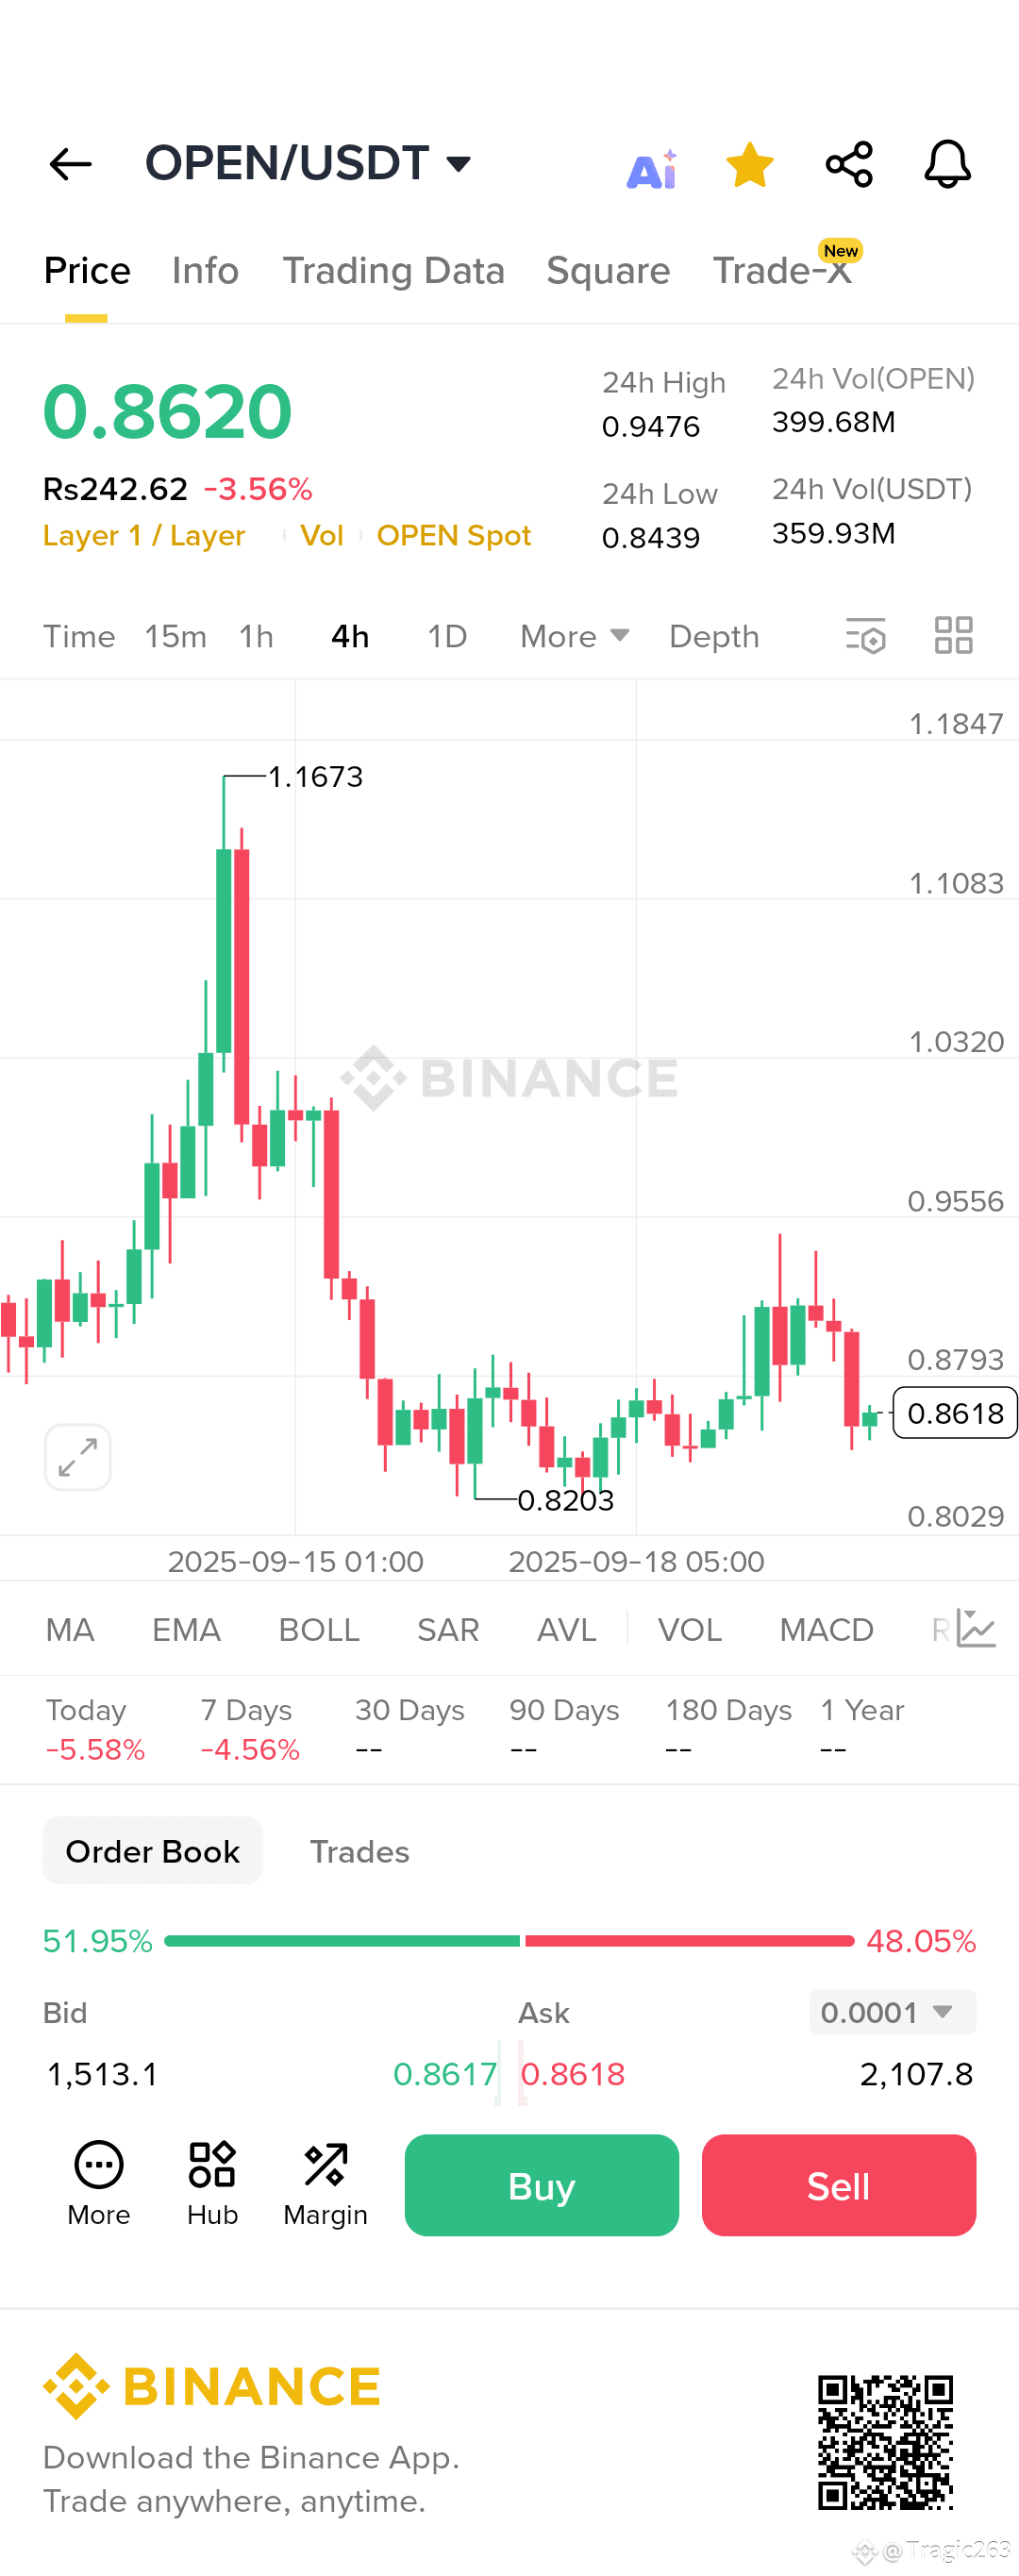
Price: 0.8620 USDT (down -3.56% in 24h)
24h High: 0.9476
24h Low: 0.8439
Volume (OPEN): 399.68M (quite high, shows active trading)
Recent Trend: Price has been in a downtrend after peaking at 1.1673. It found a bottom near 0.8203 and made a small recovery, but resistance around 0.8793 rejected it again.
🔹 Technical Observations
Support & Resistance
Strong support: 0.8200 – 0.8430 zone.
Immediate resistance: 0.8790 – 0.9470 zone.
Major resistance: 1.03 – 1.16.
Candlestick Structure
After the sharp fall from 1.16, the market is consolidating in a sideways range (0.82 – 0.95).
Recent candles show selling pressure near 0.8793.
Volume
Volume is still healthy, meaning traders are active, but sellers currently dominate slightly (48.05% ask vs 51.95% bid).
Momentum
Short-term momentum looks bearish (lower highs forming).
If price breaks 0.8430, it could re-test 0.8200 or even 0.8020.
If bulls defend 0.8430 and push above 0.8790, the next target could be 0.95 – 1.03.
🔹 Prediction (Short-Term, 4h Chart)
📉 Bearish scenario: If 0.8430 breaks, price may test 0.8200 – 0.8020.
📈 Bullish scenario: If price reclaims and holds above 0.8790, next resistance is 0.95 – 1.03.
🔹 Trading Strategy (Not Financial Advice)
Buy Zone: 0.8200 – 0.8430 (strong support area, but wait for confirmation).
Take Profit: 0.8790 → 0.95 → 1.03.
Stop Loss: Below 0.8020 (to avoid deeper downside risk).
👉 In summary: The market is consolidating after a big drop. Currently, bias is slightly bearish, but if it holds support at 0.8430, we may see a bounce toward 0.95+.
Would you like me to also check the daily timeframe (1D) for a bigger picture trend?
https://www.binance.com/download?utm_medium=screenshot
🔹 Current Situation
#open #BNBBreaks1000 #BNBChainEcosystemRally
Price: 0.8620 USDT (down -3.56% in 24h)
24h High: 0.9476
24h Low: 0.8439
Volume (OPEN): 399.68M (quite high, shows active trading)
Recent Trend: Price has been in a downtrend after peaking at 1.1673. It found a bottom near 0.8203 and made a small recovery, but resistance around 0.8793 rejected it again.
🔹 Technical Observations
Support & Resistance
Strong support: 0.8200 – 0.8430 zone.
Immediate resistance: 0.8790 – 0.9470 zone.
Major resistance: 1.03 – 1.16.
Candlestick Structure
After the sharp fall from 1.16, the market is consolidating in a sideways range (0.82 – 0.95).
Recent candles show selling pressure near 0.8793.
Volume
Volume is still healthy, meaning traders are active, but sellers currently dominate slightly (48.05% ask vs 51.95% bid).
Momentum
Short-term momentum looks bearish (lower highs forming).
If price breaks 0.8430, it could re-test 0.8200 or even 0.8020.
If bulls defend 0.8430 and push above 0.8790, the next target could be 0.95 – 1.03.
🔹 Prediction (Short-Term, 4h Chart)
📉 Bearish scenario: If 0.8430 breaks, price may test 0.8200 – 0.8020.
📈 Bullish scenario: If price reclaims and holds above 0.8790, next resistance is 0.95 – 1.03.
🔹 Trading Strategy (Not Financial Advice)
Buy Zone: 0.8200 – 0.8430 (strong support area, but wait for confirmation).
Take Profit: 0.8790 → 0.95 → 1.03.
Stop Loss: Below 0.8020 (to avoid deeper downside risk).
👉 In summary: The market is consolidating after a big drop. Currently, bias is slightly bearish, but if it holds support at 0.8430, we may see a bounce toward 0.95+.
Would you like me to also check the daily timeframe (1D) for a bigger picture trend?
https://www.binance.com/download?utm_medium=screenshot
#open #BNBBreaks1000 #BNBChainEcosystemRally
Price: 0.8620 USDT (down -3.56% in 24h)
24h High: 0.9476
24h Low: 0.8439
Volume (OPEN): 399.68M (quite high, shows active trading)
Recent Trend: Price has been in a downtrend after peaking at 1.1673. It found a bottom near 0.8203 and made a small recovery, but resistance around 0.8793 rejected it again.
🔹 Technical Observations
Support & Resistance
Strong support: 0.8200 – 0.8430 zone.
Immediate resistance: 0.8790 – 0.9470 zone.
Major resistance: 1.03 – 1.16.
Candlestick Structure
After the sharp fall from 1.16, the market is consolidating in a sideways range (0.82 – 0.95).
Recent candles show selling pressure near 0.8793.
Volume
Volume is still healthy, meaning traders are active, but sellers currently dominate slightly (48.05% ask vs 51.95% bid).
Momentum
Short-term momentum looks bearish (lower highs forming).
If price breaks 0.8430, it could re-test 0.8200 or even 0.8020.
If bulls defend 0.8430 and push above 0.8790, the next target could be 0.95 – 1.03.
🔹 Prediction (Short-Term, 4h Chart)
📉 Bearish scenario: If 0.8430 breaks, price may test 0.8200 – 0.8020.
📈 Bullish scenario: If price reclaims and holds above 0.8790, next resistance is 0.95 – 1.03.
🔹 Trading Strategy (Not Financial Advice)
Buy Zone: 0.8200 – 0.8430 (strong support area, but wait for confirmation).
Take Profit: 0.8790 → 0.95 → 1.03.
Stop Loss: Below 0.8020 (to avoid deeper downside risk).
👉 In summary: The market is consolidating after a big drop. Currently, bias is slightly bearish, but if it holds support at 0.8430, we may see a bounce toward 0.95+.
Would you like me to also check the daily timeframe (1D) for a bigger picture trend?
https://www.binance.com/download?utm_medium=screenshot
·
--
Bullish
Binance BNB is great Source of profit
{future}(BNBUSDT)
Binance BNB is great Source of profit
3
·
--
Bullish
{future}(SOMIUSDT)
Here’s the live price for Somnia (SOMI) against USD (approximately equivalent to its USDT value):
What’s “SOMI USDT”?
SOMI/USDT is the trading pair for Somnia’s native token (SOMI) quoted in USDT (Tether), a stablecoin pegged 1:1 to the USD.
Somnia (SOMI) is a high-performance, EVM-compatible Layer 1 blockchain, designed to support real-time, mass-consumer use cases like gaming, social platforms, and metaverse applications. Its token, SOMI, is used for:
Paying transaction fees
Securing the network through validator staking or delegation
Participating in governance
Recent Price Movement
All-Time High (ATH): SOMI reached its ATH of $1.84 USDT on September 7, 2025, following a substantial surge in trading volume. It has since pulled back to around $1.59 USDT.
Volatility & Recent Trend: TradingView notes a ~60.9% 24h gain, reflecting very high volatility. SOMI has also rallied sharply over the past week, by more than 450%.
Futures Activity: On Gate, SOMI/USDT perpetual futures show a current price around $1.5879–$1.5891, with daily extremes ranging from $1.08 to $1.90 and $168 million in 24h trading turnover.
What’s Driving the Surge?
Mainnet Launch & Exchange Listings: Somnia’s mainnet officially went live on September 2, 2025, unlocking its touted performance features—1 million+ TPS, sub-second finality, and ultra-low fees. CoinDesk reported over 10 billion transactions processed during its testnet phase, onboarding over 118 million wallets. Launch was accompanied by listings on Binance, KuCoin, and CoinEx.
Here’s the live price for Somnia (SOMI) against USD (approximately equivalent to its USDT value):
What’s “SOMI USDT”?
SOMI/USDT is the trading pair for Somnia’s native token (SOMI) quoted in USDT (Tether), a stablecoin pegged 1:1 to the USD.
Somnia (SOMI) is a high-performance, EVM-compatible Layer 1 blockchain, designed to support real-time, mass-consumer use cases like gaming, social platforms, and metaverse applications. Its token, SOMI, is used for:
Paying transaction fees
Securing the network through validator staking or delegation
Participating in governance
Recent Price Movement
All-Time High (ATH): SOMI reached its ATH of $1.84 USDT on September 7, 2025, following a substantial surge in trading volume. It has since pulled back to around $1.59 USDT.
Volatility & Recent Trend: TradingView notes a ~60.9% 24h gain, reflecting very high volatility. SOMI has also rallied sharply over the past week, by more than 450%.
Futures Activity: On Gate, SOMI/USDT perpetual futures show a current price around $1.5879–$1.5891, with daily extremes ranging from $1.08 to $1.90 and $168 million in 24h trading turnover.
What’s Driving the Surge?
Mainnet Launch & Exchange Listings: Somnia’s mainnet officially went live on September 2, 2025, unlocking its touted performance features—1 million+ TPS, sub-second finality, and ultra-low fees. CoinDesk reported over 10 billion transactions processed during its testnet phase, onboarding over 118 million wallets. Launch was accompanied by listings on Binance, KuCoin, and CoinEx.
Here’s the live price for Somnia (SOMI) against USD (approximately equivalent to its USDT value):
What’s “SOMI USDT”?
SOMI/USDT is the trading pair for Somnia’s native token (SOMI) quoted in USDT (Tether), a stablecoin pegged 1:1 to the USD.
Somnia (SOMI) is a high-performance, EVM-compatible Layer 1 blockchain, designed to support real-time, mass-consumer use cases like gaming, social platforms, and metaverse applications. Its token, SOMI, is used for:
Paying transaction fees
Securing the network through validator staking or delegation
Participating in governance
Recent Price Movement
All-Time High (ATH): SOMI reached its ATH of $1.84 USDT on September 7, 2025, following a substantial surge in trading volume. It has since pulled back to around $1.59 USDT.
Volatility & Recent Trend: TradingView notes a ~60.9% 24h gain, reflecting very high volatility. SOMI has also rallied sharply over the past week, by more than 450%.
Futures Activity: On Gate, SOMI/USDT perpetual futures show a current price around $1.5879–$1.5891, with daily extremes ranging from $1.08 to $1.90 and $168 million in 24h trading turnover.
What’s Driving the Surge?
Mainnet Launch & Exchange Listings: Somnia’s mainnet officially went live on September 2, 2025, unlocking its touted performance features—1 million+ TPS, sub-second finality, and ultra-low fees. CoinDesk reported over 10 billion transactions processed during its testnet phase, onboarding over 118 million wallets. Launch was accompanied by listings on Binance, KuCoin, and CoinEx.
445
·
--
Bullish
Here’s the live price for Ethereum (ETH):
---
So Ethereum “got bullish”? What’s driving the momentum?
Yes, Ethereum is indeed showing bullish signs—let’s break down what’s behind this strength:
1. Institutional Demand & ETF Momentum
Standard Chartered has upgraded its year-end forecast to $7,500 by end-2025, citing the stablecoin boom (which mostly runs on Ethereum), growing industry engagement, and long-term price drivers. The bank even sees a path to $25,000 by 2028.
Record-breaking inflows into spot Ethereum ETFs—including funds from BlackRock and Fidelity—have fueled strong buying pressure.
BitMine Immersion Technologies, one of Ethereum’s biggest corporate holders, is expanding a capital offering to accumulate more ETH—possibly up to 5% of circulating supply.
2. Supply Squeeze & On-Chain Metrics
Ethereum withdrawals from exchanges—especially on Binance—have pushed the Exchange Supply Ratio (ESR) to its lowest in weeks, indicating a supply squeeze that often anticipates price rallies.
3. Technical Patterns Signal Upside Potential
Ana
CoinCheckup projects ETH could reach $6,862 by November and $7,475 by December.
Cointelegraph notes that historical August rallies often presage 60% gains into year-end, potentially pushing ETH near $7,000.
---
Quick Summary Table
Factor Description
Institutional Flows Big ETF inflows and corporate accumulation (e.g., BitMine) are tightening supply.
Supply Withdrawals Decreased ETH on exchanges signals long-term holding and bullish setup.
Technical Patterns Pennant and megaphone breakouts targeted near $5K–$10K; $6K is near-term resistance.
Forecasts Analysts and models range from $6K to $7.5K by year-end; some even foresee $25K by 2028.
---
What’s Next?
A sustained break above $4,500 could open the door for moves toward $5,000, $6,000, or higher.
Institutional activity—like ETF inflows and treasury buys—looks set to continue fueling upward momentum.
Watch on-chain metrics and exchange supply levels closely—they may offer early signals of renewed bullish cycles.
Here’s the live price for Ethereum (ETH):
---
So Ethereum “got bullish”? What’s driving the momentum?
Yes, Ethereum is indeed showing bullish signs—let’s break down what’s behind this strength:
1. Institutional Demand & ETF Momentum
Standard Chartered has upgraded its year-end forecast to $7,500 by end-2025, citing the stablecoin boom (which mostly runs on Ethereum), growing industry engagement, and long-term price drivers. The bank even sees a path to $25,000 by 2028.
Record-breaking inflows into spot Ethereum ETFs—including funds from BlackRock and Fidelity—have fueled strong buying pressure.
BitMine Immersion Technologies, one of Ethereum’s biggest corporate holders, is expanding a capital offering to accumulate more ETH—possibly up to 5% of circulating supply.
2. Supply Squeeze & On-Chain Metrics
Ethereum withdrawals from exchanges—especially on Binance—have pushed the Exchange Supply Ratio (ESR) to its lowest in weeks, indicating a supply squeeze that often anticipates price rallies.
3. Technical Patterns Signal Upside Potential
Ana
CoinCheckup projects ETH could reach $6,862 by November and $7,475 by December.
Cointelegraph notes that historical August rallies often presage 60% gains into year-end, potentially pushing ETH near $7,000.
---
Quick Summary Table
Factor Description
Institutional Flows Big ETF inflows and corporate accumulation (e.g., BitMine) are tightening supply.
Supply Withdrawals Decreased ETH on exchanges signals long-term holding and bullish setup.
Technical Patterns Pennant and megaphone breakouts targeted near $5K–$10K; $6K is near-term resistance.
Forecasts Analysts and models range from $6K to $7.5K by year-end; some even foresee $25K by 2028.
---
What’s Next?
A sustained break above $4,500 could open the door for moves toward $5,000, $6,000, or higher.
Institutional activity—like ETF inflows and treasury buys—looks set to continue fueling upward momentum.
Watch on-chain metrics and exchange supply levels closely—they may offer early signals of renewed bullish cycles.
---
So Ethereum “got bullish”? What’s driving the momentum?
Yes, Ethereum is indeed showing bullish signs—let’s break down what’s behind this strength:
1. Institutional Demand & ETF Momentum
Standard Chartered has upgraded its year-end forecast to $7,500 by end-2025, citing the stablecoin boom (which mostly runs on Ethereum), growing industry engagement, and long-term price drivers. The bank even sees a path to $25,000 by 2028.
Record-breaking inflows into spot Ethereum ETFs—including funds from BlackRock and Fidelity—have fueled strong buying pressure.
BitMine Immersion Technologies, one of Ethereum’s biggest corporate holders, is expanding a capital offering to accumulate more ETH—possibly up to 5% of circulating supply.
2. Supply Squeeze & On-Chain Metrics
Ethereum withdrawals from exchanges—especially on Binance—have pushed the Exchange Supply Ratio (ESR) to its lowest in weeks, indicating a supply squeeze that often anticipates price rallies.
3. Technical Patterns Signal Upside Potential
Ana
CoinCheckup projects ETH could reach $6,862 by November and $7,475 by December.
Cointelegraph notes that historical August rallies often presage 60% gains into year-end, potentially pushing ETH near $7,000.
---
Quick Summary Table
Factor Description
Institutional Flows Big ETF inflows and corporate accumulation (e.g., BitMine) are tightening supply.
Supply Withdrawals Decreased ETH on exchanges signals long-term holding and bullish setup.
Technical Patterns Pennant and megaphone breakouts targeted near $5K–$10K; $6K is near-term resistance.
Forecasts Analysts and models range from $6K to $7.5K by year-end; some even foresee $25K by 2028.
---
What’s Next?
A sustained break above $4,500 could open the door for moves toward $5,000, $6,000, or higher.
Institutional activity—like ETF inflows and treasury buys—looks set to continue fueling upward momentum.
Watch on-chain metrics and exchange supply levels closely—they may offer early signals of renewed bullish cycles.
208
·
--
NVIDIA plays an indirect but very important role in the Bitcoin (BTC) and overall crypto ecosystem, mainly through its AI and GPU technologies. Let me break it down:
🔹 1. NVIDIA GPUs in Crypto Mining
In Bitcoin’s early days, NVIDIA GPUs were widely used for mining BTC because they are powerful in parallel processing.
Later, Bitcoin mining shifted mostly to ASICs (Application-Specific Integrated Circuits), which are more efficient.
However, NVIDIA GPUs are still heavily used in mining other cryptocurrencies (like Ethereum before its merge to Proof-of-Stake, and altcoins today).
🔹 2. AI + Crypto Market Analysis
NVIDIA’s AI chips (A100, H100, etc.) are used to train large AI models that analyze blockchain data.
Hedge funds and traders use NVIDIA-powered AI systems for:
Price prediction models
Market sentiment analysis (scanning social media/news)
High-frequency trading strategies
🔹 3. Blockchain Security & Fraud Detection
NVIDIA AI is applied in analyzing huge transaction datasets from Bitcoin and other blockchains.
AI helps detect fraudulent transactions, hacks, and money laundering patterns in crypto exchanges.
GPUs speed up this real-time detection.
🔹 4. AI-Powered Mining Optimization
AI algorithms running on NVIDIA GPUs optimize energy usage in mining farms.
This reduces electricity costs and improves mining efficiency, especially in Proof-of-Work coins.
🔹 5. Future: AI + Crypto Synergy
NVIDIA’s role in generative AI (like ChatGPT models) shows how AI and crypto may converge.
Possible future roles:
AI-driven decentralized finance (DeFi) bots
Crypto + AI supercomputing platforms
Tokenized access to GPU computing power
#BinanceHODLerDOLO #BTCWhalesMoveToETH
✅ In short:
NVIDIA doesn’t directly control or mine Bitcoin today, but its GPU & AI technologies power the infrastructure around crypto — from mining (in the past), AI trading bots, blockchain analytics, fraud detection, to future AI+crypto applications.
NVIDIA plays an indirect but very important role in the Bitcoin (BTC) and overall crypto ecosystem, mainly through its AI and GPU technologies. Let me break it down:
🔹 1. NVIDIA GPUs in Crypto Mining
In Bitcoin’s early days, NVIDIA GPUs were widely used for mining BTC because they are powerful in parallel processing.
Later, Bitcoin mining shifted mostly to ASICs (Application-Specific Integrated Circuits), which are more efficient.
However, NVIDIA GPUs are still heavily used in mining other cryptocurrencies (like Ethereum before its merge to Proof-of-Stake, and altcoins today).
🔹 2. AI + Crypto Market Analysis
NVIDIA’s AI chips (A100, H100, etc.) are used to train large AI models that analyze blockchain data.
Hedge funds and traders use NVIDIA-powered AI systems for:
Price prediction models
Market sentiment analysis (scanning social media/news)
High-frequency trading strategies
🔹 3. Blockchain Security & Fraud Detection
NVIDIA AI is applied in analyzing huge transaction datasets from Bitcoin and other blockchains.
AI helps detect fraudulent transactions, hacks, and money laundering patterns in crypto exchanges.
GPUs speed up this real-time detection.
🔹 4. AI-Powered Mining Optimization
AI algorithms running on NVIDIA GPUs optimize energy usage in mining farms.
This reduces electricity costs and improves mining efficiency, especially in Proof-of-Work coins.
🔹 5. Future: AI + Crypto Synergy
NVIDIA’s role in generative AI (like ChatGPT models) shows how AI and crypto may converge.
Possible future roles:
AI-driven decentralized finance (DeFi) bots
Crypto + AI supercomputing platforms
Tokenized access to GPU computing power
#BinanceHODLerDOLO #BTCWhalesMoveToETH
✅ In short:
NVIDIA doesn’t directly control or mine Bitcoin today, but its GPU & AI technologies power the infrastructure around crypto — from mining (in the past), AI trading bots, blockchain analytics, fraud detection, to future AI+crypto applications.
🔹 1. NVIDIA GPUs in Crypto Mining
In Bitcoin’s early days, NVIDIA GPUs were widely used for mining BTC because they are powerful in parallel processing.
Later, Bitcoin mining shifted mostly to ASICs (Application-Specific Integrated Circuits), which are more efficient.
However, NVIDIA GPUs are still heavily used in mining other cryptocurrencies (like Ethereum before its merge to Proof-of-Stake, and altcoins today).
🔹 2. AI + Crypto Market Analysis
NVIDIA’s AI chips (A100, H100, etc.) are used to train large AI models that analyze blockchain data.
Hedge funds and traders use NVIDIA-powered AI systems for:
Price prediction models
Market sentiment analysis (scanning social media/news)
High-frequency trading strategies
🔹 3. Blockchain Security & Fraud Detection
NVIDIA AI is applied in analyzing huge transaction datasets from Bitcoin and other blockchains.
AI helps detect fraudulent transactions, hacks, and money laundering patterns in crypto exchanges.
GPUs speed up this real-time detection.
🔹 4. AI-Powered Mining Optimization
AI algorithms running on NVIDIA GPUs optimize energy usage in mining farms.
This reduces electricity costs and improves mining efficiency, especially in Proof-of-Work coins.
🔹 5. Future: AI + Crypto Synergy
NVIDIA’s role in generative AI (like ChatGPT models) shows how AI and crypto may converge.
Possible future roles:
AI-driven decentralized finance (DeFi) bots
Crypto + AI supercomputing platforms
Tokenized access to GPU computing power
#BinanceHODLerDOLO #BTCWhalesMoveToETH
✅ In short:
NVIDIA doesn’t directly control or mine Bitcoin today, but its GPU & AI technologies power the infrastructure around crypto — from mining (in the past), AI trading bots, blockchain analytics, fraud detection, to future AI+crypto applications.
72
·
--
#BTCWhalesMoveToETH
The Bitcoin Crash: What Happened and What It Means for Investors
Bitcoin, the world’s largest cryptocurrency, has always been synonymous with volatility. But when a sharp decline—often referred to as a "crash"—hits the market, it sends shockwaves across global finance, retail investors, and the broader digital asset ecosystem.
What Triggers a Bitcoin Crash?
Several factors can contribute to a sudden drop in Bitcoin’s price:
Market Sentiment – Fear, uncertainty, and doubt (often called FUD) can spread rapidly through social media and news outlets, causing panic selling.
Regulatory Pressure – Announcements of stricter government regulations, bans, or tax crackdowns can trigger sell-offs.
Macroeconomic Factors – Rising interest rates, inflation concerns, or a strengthening U.S. dollar can push investors away from riskier assets like Bitcoin.
Leverage and Liquidations – Many traders use borrowed money to speculate on Bitcoin. When prices fall, forced liquidations can accelerate the downturn.
Security Incidents – Hacks or failures of major crypto exchanges often spark fear and sudden withdrawals.
Historical Crashes
Bitcoin has seen multiple steep declines since its creation in 2009:
2013–2014: Bitcoin plunged after the collapse of Mt. Gox, the largest exchange at the time.
2018: Following the 2017 bull run, prices crashed by more than 80%.
2021–2022: A combination of China’s mining ban, global inflation fears, and the collapse of crypto firms like FTX contributed to a major downturn.
Despite these crashes, Bitcoin has always eventually rebounded, though recovery often takes months—or even years.
How Investors React
Short-term traders may panic and sell to cut losses.
Long-term holders ("HODLers") often view crashes as buying opportunities.
Institutions may either retreat from risk or use downturns to accumulate assets at lower prices.
#MarketPullback #SOLTreasuryFundraising #CryptoRally
{future}(BTCUSDT)
#BTCWhalesMoveToETH
The Bitcoin Crash: What Happened and What It Means for Investors
Bitcoin, the world’s largest cryptocurrency, has always been synonymous with volatility. But when a sharp decline—often referred to as a "crash"—hits the market, it sends shockwaves across global finance, retail investors, and the broader digital asset ecosystem.
What Triggers a Bitcoin Crash?
Several factors can contribute to a sudden drop in Bitcoin’s price:
Market Sentiment – Fear, uncertainty, and doubt (often called FUD) can spread rapidly through social media and news outlets, causing panic selling.
Regulatory Pressure – Announcements of stricter government regulations, bans, or tax crackdowns can trigger sell-offs.
Macroeconomic Factors – Rising interest rates, inflation concerns, or a strengthening U.S. dollar can push investors away from riskier assets like Bitcoin.
Leverage and Liquidations – Many traders use borrowed money to speculate on Bitcoin. When prices fall, forced liquidations can accelerate the downturn.
Security Incidents – Hacks or failures of major crypto exchanges often spark fear and sudden withdrawals.
Historical Crashes
Bitcoin has seen multiple steep declines since its creation in 2009:
2013–2014: Bitcoin plunged after the collapse of Mt. Gox, the largest exchange at the time.
2018: Following the 2017 bull run, prices crashed by more than 80%.
2021–2022: A combination of China’s mining ban, global inflation fears, and the collapse of crypto firms like FTX contributed to a major downturn.
Despite these crashes, Bitcoin has always eventually rebounded, though recovery often takes months—or even years.
How Investors React
Short-term traders may panic and sell to cut losses.
Long-term holders ("HODLers") often view crashes as buying opportunities.
Institutions may either retreat from risk or use downturns to accumulate assets at lower prices.
#MarketPullback #SOLTreasuryFundraising #CryptoRally
The Bitcoin Crash: What Happened and What It Means for Investors
Bitcoin, the world’s largest cryptocurrency, has always been synonymous with volatility. But when a sharp decline—often referred to as a "crash"—hits the market, it sends shockwaves across global finance, retail investors, and the broader digital asset ecosystem.
What Triggers a Bitcoin Crash?
Several factors can contribute to a sudden drop in Bitcoin’s price:
Market Sentiment – Fear, uncertainty, and doubt (often called FUD) can spread rapidly through social media and news outlets, causing panic selling.
Regulatory Pressure – Announcements of stricter government regulations, bans, or tax crackdowns can trigger sell-offs.
Macroeconomic Factors – Rising interest rates, inflation concerns, or a strengthening U.S. dollar can push investors away from riskier assets like Bitcoin.
Leverage and Liquidations – Many traders use borrowed money to speculate on Bitcoin. When prices fall, forced liquidations can accelerate the downturn.
Security Incidents – Hacks or failures of major crypto exchanges often spark fear and sudden withdrawals.
Historical Crashes
Bitcoin has seen multiple steep declines since its creation in 2009:
2013–2014: Bitcoin plunged after the collapse of Mt. Gox, the largest exchange at the time.
2018: Following the 2017 bull run, prices crashed by more than 80%.
2021–2022: A combination of China’s mining ban, global inflation fears, and the collapse of crypto firms like FTX contributed to a major downturn.
Despite these crashes, Bitcoin has always eventually rebounded, though recovery often takes months—or even years.
How Investors React
Short-term traders may panic and sell to cut losses.
Long-term holders ("HODLers") often view crashes as buying opportunities.
Institutions may either retreat from risk or use downturns to accumulate assets at lower prices.
#MarketPullback #SOLTreasuryFundraising #CryptoRally
59
·
--
Bullish
·
--
Bearish
#CEXvsDEX101
Got it! You're asking about Trading Types 101 – a beginner's guide to the main types of trading.
Here’s a simple breakdown:
📘 Trading Types 101: A Beginner’s Guide
🏦 1. Stock Trading
What it is: Buying and selling shares of companies (like Apple or Tesla).
Goal: Buy low, sell high (or vice versa).
Types:
Day Trading: In-and-out in the same day.
Swing Trading: Holding for a few days/weeks.
Position Trading: Long-term (months or years).
Scalping: Very quick trades, seconds to minutes.
💱 2. Forex Trading (Foreign Exchange)
What it is: Trading one currency for another (e.g., USD/EUR).
World’s largest market.
High leverage, high risk.
Popular among experienced traders.
🪙 3. Crypto Trading
What it is: Buying/selling digital currencies like Bitcoin, Ethereum.
Volatile market = high risk/reward.
Can be done 24/7.
📦 4. Commodity Trading
What it is: Trading raw materials like gold, oil, coffee.
Often done through futures contracts.
Affected by global events and supply chains.
📊 5. Options Trading
What it is: Trading contracts that give you the right (not obligation) to buy/sell stocks at a set price in the future.
Can be used to hedge or speculate.
Complex and riskier than regular stock trading.
📈 6. Futures Trading
What it is: Agreeing to buy/sell something at a future date at a set price.
Used with commodities, indexes, and even Bitcoin now.
Highly leveraged and used by professionals.
🏘 7. Real Estate Trading (Flipping)
Buying property, holding short-term, and selling for profit.
Not part of financial markets directly, but still a trading type.
🔍 Things to Learn as a Beginner:
Risk management
Technical vs fundamental analysis
Broker platforms and tools
Psychology of trading
Want me to build you a custom beginner's plan to start trading? I can walk you through the steps, tools, and resources based on your interests (stocks, crypto, forex, etc.).
#CEXvsDEX101
Got it! You're asking about Trading Types 101 – a beginner's guide to the main types of trading.
Here’s a simple breakdown:
📘 Trading Types 101: A Beginner’s Guide
🏦 1. Stock Trading
What it is: Buying and selling shares of companies (like Apple or Tesla).
Goal: Buy low, sell high (or vice versa).
Types:
Day Trading: In-and-out in the same day.
Swing Trading: Holding for a few days/weeks.
Position Trading: Long-term (months or years).
Scalping: Very quick trades, seconds to minutes.
💱 2. Forex Trading (Foreign Exchange)
What it is: Trading one currency for another (e.g., USD/EUR).
World’s largest market.
High leverage, high risk.
Popular among experienced traders.
🪙 3. Crypto Trading
What it is: Buying/selling digital currencies like Bitcoin, Ethereum.
Volatile market = high risk/reward.
Can be done 24/7.
📦 4. Commodity Trading
What it is: Trading raw materials like gold, oil, coffee.
Often done through futures contracts.
Affected by global events and supply chains.
📊 5. Options Trading
What it is: Trading contracts that give you the right (not obligation) to buy/sell stocks at a set price in the future.
Can be used to hedge or speculate.
Complex and riskier than regular stock trading.
📈 6. Futures Trading
What it is: Agreeing to buy/sell something at a future date at a set price.
Used with commodities, indexes, and even Bitcoin now.
Highly leveraged and used by professionals.
🏘 7. Real Estate Trading (Flipping)
Buying property, holding short-term, and selling for profit.
Not part of financial markets directly, but still a trading type.
🔍 Things to Learn as a Beginner:
Risk management
Technical vs fundamental analysis
Broker platforms and tools
Psychology of trading
Want me to build you a custom beginner's plan to start trading? I can walk you through the steps, tools, and resources based on your interests (stocks, crypto, forex, etc.).
Got it! You're asking about Trading Types 101 – a beginner's guide to the main types of trading.
Here’s a simple breakdown:
📘 Trading Types 101: A Beginner’s Guide
🏦 1. Stock Trading
What it is: Buying and selling shares of companies (like Apple or Tesla).
Goal: Buy low, sell high (or vice versa).
Types:
Day Trading: In-and-out in the same day.
Swing Trading: Holding for a few days/weeks.
Position Trading: Long-term (months or years).
Scalping: Very quick trades, seconds to minutes.
💱 2. Forex Trading (Foreign Exchange)
What it is: Trading one currency for another (e.g., USD/EUR).
World’s largest market.
High leverage, high risk.
Popular among experienced traders.
🪙 3. Crypto Trading
What it is: Buying/selling digital currencies like Bitcoin, Ethereum.
Volatile market = high risk/reward.
Can be done 24/7.
📦 4. Commodity Trading
What it is: Trading raw materials like gold, oil, coffee.
Often done through futures contracts.
Affected by global events and supply chains.
📊 5. Options Trading
What it is: Trading contracts that give you the right (not obligation) to buy/sell stocks at a set price in the future.
Can be used to hedge or speculate.
Complex and riskier than regular stock trading.
📈 6. Futures Trading
What it is: Agreeing to buy/sell something at a future date at a set price.
Used with commodities, indexes, and even Bitcoin now.
Highly leveraged and used by professionals.
🏘 7. Real Estate Trading (Flipping)
Buying property, holding short-term, and selling for profit.
Not part of financial markets directly, but still a trading type.
🔍 Things to Learn as a Beginner:
Risk management
Technical vs fundamental analysis
Broker platforms and tools
Psychology of trading
Want me to build you a custom beginner's plan to start trading? I can walk you through the steps, tools, and resources based on your interests (stocks, crypto, forex, etc.).
Log in to explore more content
Join global crypto users on Binance Square
⚡️ Get latest and useful information about crypto.
💬 Trusted by the world’s largest crypto exchange.
👍 Discover real insights from verified creators.
Email / Phone number
Trending Topics
FedRateWatch
562,934 views
2,670 Discussing
Share & Win Traffic Reward in our Trending Hashtag Campaign
✨Topic: FOMC September, What's The Fed's Next Move?
👉How to Join:
Publish a short post or article with hashtag #FedRateWatch
Create content based on the below angles:
- August core CPI rose 0.3% month-over-month, and the odds of a 25bp hike this week are now close to 90%. Do you anticipate a rate hike this week? Is it a one-off, or the start of a longer hiking cycle?
- If the hike lands, how does it play out for BTC, tech stocks, and gold? Bullish or bearish?
- How are you planning to trade next? Share your BTC, stocks or gold trade/holdings with our trade sharing widget.
⏰Campaign Period:
- 2026-09-15 11:00 - 2026-09-17 3:00 UTC
🎁Reward:
- Qualified posts that comply with the above guidelines and contain more than 100 words will be reviewed and may receive a random traffic boost of 500 to 3,000 views. You will receive a notification from your feed secretary if your post is selected.
- Get a chance to have your article featured on Binance Square Official
Need ideas for your post? Visit the topic page #FedRateWatch or the Square Guide on How to Post for Better Reach.
Binance Square Official
·380 Likes
·838.8k views
BitcoinSlidesTo$76000
21,176 views
115 Discussing
BitcoinReboundsTo$79K
61,739 views
401 Discussing