
China_BNB
8.2k Posts

China_BNB
 Square Verified+
Report
Block User
Content Creator ( KITE UID:066697) trader analyst ( ChinaBNB1 - X )
High-Frequency Trader
2.2 Years
453 Following
39.4K+ Followers
23.9K+ Liked
Posts
All
Quotes
Videos
Live

·
--
Partly True

Article
NVIDIA IS AT A CRITICAL LEVEL — BREAKOUT OR PULLBACK?NVIDIA ($NVDA) is back in the spotlight, and this time the story is bigger than just AI chips.
The stock closed around $148.86 on September 28, after gaining about 1.7%. The latest move came as NVIDIA announced an additional $150 billion share-buyback authorization, bringing its remaining buyback capacity to about $135 billion through fiscal 2028.
For traders, the important question.
Can NVDA break its recent high, or will sellers appear again near resistance?
🔥 WHY NVIDIA IS GETTING ATTENTION
NVIDIA's business is still growing at a very fast pace.
In its latest reported quarter, NVIDIA generated $96.2 billion in revenue, up 106% from the same quarter a year earlier. Data Center revenue reached about $89 billion, showing how strong demand for AI computing remains.
The new buyback is another important part of the story. NVIDIA says its strong cash generation gives it room to keep investing in AI technology while also returning money to shareholders.
But traders should not look at the buyback alone.
The stock price still needs to confirm the strength on the chart.
📊 NVDA TECHNICAL PICTURE
NVDA finished the latest session at approximately $148.86.
The short-term chart is now sitting close to an important resistance area.
Current technical zones:
🟢 Possible Entry Zone: $135–$139
🛡️ Support 1: $146–$147
🛡️ Support 2: $138–$141
🛡️ Major Support: Around $125
🚧 Resistance 1: $132–$133
🚧 Resistance 2: $134–$135
🔥 Major Breakout: Above $136.50
🎯 Possible upside zones after breakout: $158 → $162
Recent technical data places first support around $126.86, with another support area near $124.87 and a deeper level around $119.70. Resistance is clustered around $132–$135, while the recent 52-week high is about $136.54.
That makes the $132–$136 area very important.
🚀 WHAT A BREAKOUT COULD MEAN
If NVDA moves above $136.50 and stays there with strong trading volume, it would mean the stock has moved above its recent high.
That would be a stronger technical signal than simply touching the level.
Traders could then watch the next zones around $145 and $155 as possible areas where sellers may appear.
But there is an important rule:
A breakout is stronger when price holds above the level.
If NVDA jumps above $156 and quickly falls back below it, that could become a false breakout.
So I would watch the closing price and volume rather than chasing the first move.
⚠️ WHAT IF NVDA FALLS?
The other side of the chart is equally important.
If NVDA cannot break $132–$135, sellers could push the stock back toward the $126–$127 support zone.
If that support holds, buyers may try again.
But if price breaks clearly below $142–$145, the chart could become weaker in the short term. The next important area would then be around $130.
This is why entering in the middle of a big move can be risky.
A better way to read the chart is to wait for price to reach an important zone and then watch how buyers and sellers react.
🧠 THE BIGGER AI STORY
There is another reason I am watching NVIDIA closely.
The AI market is no longer only about selling GPUs. NVIDIA is building a much larger AI infrastructure business around computing systems, networking and software.
At the same time, competition is increasing, and investors are asking how long the extremely fast AI spending cycle can continue.
Reuters reported that NVIDIA expects roughly 70% revenue growth for fiscal 2028, while also noting that investors are watching whether the current AI spending boom can continue at its present speed.
That creates an interesting situation.
The company is showing huge growth, but the market is also demanding more from the stock.
🎯 MY TRADING WATCHLIST
For the short term, I would keep the chart very simple:
Above $150.50: breakout area to watch.
$132–$135: major resistance zone.
$126–$127: first support zone.
$124–$125: important support.
Around $120: deeper support if selling becomes stronger.
The key is not to assume that one direction must happen.
Let the price confirm it.
If buyers take control above resistance, momentum can strengthen. If sellers reject the breakout and push price below support, the setup changes.
🔥 FINAL THOUGHT
NVIDIA remains one of the most closely watched AI stocks, but the next move should be judged by both business growth and price action.
The latest buyback announcement gives the market another reason to watch NVDA, while the latest earnings show that AI demand remains extremely strong.
Now the chart is approaching a major test.
Will NVDA finally break above $146.50 and enter a new price zone, or will sellers defend the highs once again?
$NVDAB #StockAnalysis
{spot}(NVDABUSDT)
NVIDIA IS AT A CRITICAL LEVEL — BREAKOUT OR PULLBACK?
NVIDIA ($NVDA) is back in the spotlight, and this time the story is bigger than just AI chips.
The stock closed around $148.86 on September 28, after gaining about 1.7%. The latest move came as NVIDIA announced an additional $150 billion share-buyback authorization, bringing its remaining buyback capacity to about $135 billion through fiscal 2028.
For traders, the important question.
Can NVDA break its recent high, or will sellers appear again near resistance?
🔥 WHY NVIDIA IS GETTING ATTENTION
NVIDIA's business is still growing at a very fast pace.
In its latest reported quarter, NVIDIA generated $96.2 billion in revenue, up 106% from the same quarter a year earlier. Data Center revenue reached about $89 billion, showing how strong demand for AI computing remains.
The new buyback is another important part of the story. NVIDIA says its strong cash generation gives it room to keep investing in AI technology while also returning money to shareholders.
But traders should not look at the buyback alone.
The stock price still needs to confirm the strength on the chart.
📊 NVDA TECHNICAL PICTURE
NVDA finished the latest session at approximately $148.86.
The short-term chart is now sitting close to an important resistance area.
Current technical zones:
🟢 Possible Entry Zone: $135–$139
🛡️ Support 1: $146–$147
🛡️ Support 2: $138–$141
🛡️ Major Support: Around $125
🚧 Resistance 1: $132–$133
🚧 Resistance 2: $134–$135
🔥 Major Breakout: Above $136.50
🎯 Possible upside zones after breakout: $158 → $162
Recent technical data places first support around $126.86, with another support area near $124.87 and a deeper level around $119.70. Resistance is clustered around $132–$135, while the recent 52-week high is about $136.54.
That makes the $132–$136 area very important.
🚀 WHAT A BREAKOUT COULD MEAN
If NVDA moves above $136.50 and stays there with strong trading volume, it would mean the stock has moved above its recent high.
That would be a stronger technical signal than simply touching the level.
Traders could then watch the next zones around $145 and $155 as possible areas where sellers may appear.
But there is an important rule:
A breakout is stronger when price holds above the level.
If NVDA jumps above $156 and quickly falls back below it, that could become a false breakout.
So I would watch the closing price and volume rather than chasing the first move.
⚠️ WHAT IF NVDA FALLS?
The other side of the chart is equally important.
If NVDA cannot break $132–$135, sellers could push the stock back toward the $126–$127 support zone.
If that support holds, buyers may try again.
But if price breaks clearly below $142–$145, the chart could become weaker in the short term. The next important area would then be around $130.
This is why entering in the middle of a big move can be risky.
A better way to read the chart is to wait for price to reach an important zone and then watch how buyers and sellers react.
🧠 THE BIGGER AI STORY
There is another reason I am watching NVIDIA closely.
The AI market is no longer only about selling GPUs. NVIDIA is building a much larger AI infrastructure business around computing systems, networking and software.
At the same time, competition is increasing, and investors are asking how long the extremely fast AI spending cycle can continue.
Reuters reported that NVIDIA expects roughly 70% revenue growth for fiscal 2028, while also noting that investors are watching whether the current AI spending boom can continue at its present speed.
That creates an interesting situation.
The company is showing huge growth, but the market is also demanding more from the stock.
🎯 MY TRADING WATCHLIST
For the short term, I would keep the chart very simple:
Above $150.50: breakout area to watch.
$132–$135: major resistance zone.
$126–$127: first support zone.
$124–$125: important support.
Around $120: deeper support if selling becomes stronger.
The key is not to assume that one direction must happen.
Let the price confirm it.
If buyers take control above resistance, momentum can strengthen. If sellers reject the breakout and push price below support, the setup changes.
🔥 FINAL THOUGHT
NVIDIA remains one of the most closely watched AI stocks, but the next move should be judged by both business growth and price action.
The latest buyback announcement gives the market another reason to watch NVDA, while the latest earnings show that AI demand remains extremely strong.
Now the chart is approaching a major test.
Will NVDA finally break above $146.50 and enter a new price zone, or will sellers defend the highs once again?
$NVDAB #StockAnalysis
The stock closed around $148.86 on September 28, after gaining about 1.7%. The latest move came as NVIDIA announced an additional $150 billion share-buyback authorization, bringing its remaining buyback capacity to about $135 billion through fiscal 2028.
For traders, the important question.
Can NVDA break its recent high, or will sellers appear again near resistance?
🔥 WHY NVIDIA IS GETTING ATTENTION
NVIDIA's business is still growing at a very fast pace.
In its latest reported quarter, NVIDIA generated $96.2 billion in revenue, up 106% from the same quarter a year earlier. Data Center revenue reached about $89 billion, showing how strong demand for AI computing remains.
The new buyback is another important part of the story. NVIDIA says its strong cash generation gives it room to keep investing in AI technology while also returning money to shareholders.
But traders should not look at the buyback alone.
The stock price still needs to confirm the strength on the chart.
📊 NVDA TECHNICAL PICTURE
NVDA finished the latest session at approximately $148.86.
The short-term chart is now sitting close to an important resistance area.
Current technical zones:
🟢 Possible Entry Zone: $135–$139
🛡️ Support 1: $146–$147
🛡️ Support 2: $138–$141
🛡️ Major Support: Around $125
🚧 Resistance 1: $132–$133
🚧 Resistance 2: $134–$135
🔥 Major Breakout: Above $136.50
🎯 Possible upside zones after breakout: $158 → $162
Recent technical data places first support around $126.86, with another support area near $124.87 and a deeper level around $119.70. Resistance is clustered around $132–$135, while the recent 52-week high is about $136.54.
That makes the $132–$136 area very important.
🚀 WHAT A BREAKOUT COULD MEAN
If NVDA moves above $136.50 and stays there with strong trading volume, it would mean the stock has moved above its recent high.
That would be a stronger technical signal than simply touching the level.
Traders could then watch the next zones around $145 and $155 as possible areas where sellers may appear.
But there is an important rule:
A breakout is stronger when price holds above the level.
If NVDA jumps above $156 and quickly falls back below it, that could become a false breakout.
So I would watch the closing price and volume rather than chasing the first move.
⚠️ WHAT IF NVDA FALLS?
The other side of the chart is equally important.
If NVDA cannot break $132–$135, sellers could push the stock back toward the $126–$127 support zone.
If that support holds, buyers may try again.
But if price breaks clearly below $142–$145, the chart could become weaker in the short term. The next important area would then be around $130.
This is why entering in the middle of a big move can be risky.
A better way to read the chart is to wait for price to reach an important zone and then watch how buyers and sellers react.
🧠 THE BIGGER AI STORY
There is another reason I am watching NVIDIA closely.
The AI market is no longer only about selling GPUs. NVIDIA is building a much larger AI infrastructure business around computing systems, networking and software.
At the same time, competition is increasing, and investors are asking how long the extremely fast AI spending cycle can continue.
Reuters reported that NVIDIA expects roughly 70% revenue growth for fiscal 2028, while also noting that investors are watching whether the current AI spending boom can continue at its present speed.
That creates an interesting situation.
The company is showing huge growth, but the market is also demanding more from the stock.
🎯 MY TRADING WATCHLIST
For the short term, I would keep the chart very simple:
Above $150.50: breakout area to watch.
$132–$135: major resistance zone.
$126–$127: first support zone.
$124–$125: important support.
Around $120: deeper support if selling becomes stronger.
The key is not to assume that one direction must happen.
Let the price confirm it.
If buyers take control above resistance, momentum can strengthen. If sellers reject the breakout and push price below support, the setup changes.
🔥 FINAL THOUGHT
NVIDIA remains one of the most closely watched AI stocks, but the next move should be judged by both business growth and price action.
The latest buyback announcement gives the market another reason to watch NVDA, while the latest earnings show that AI demand remains extremely strong.
Now the chart is approaching a major test.
Will NVDA finally break above $146.50 and enter a new price zone, or will sellers defend the highs once again?
$NVDAB #StockAnalysis
9
1.7k

·
--
MARKET WHY SHORT?
TELL ME EVERY ONE $BTC
{spot}(AMZNBUSDT)
{future}(BTCUSDT)
MARKET WHY SHORT?
TELL ME EVERY ONE $BTC
TELL ME EVERY ONE $BTC
3
154
·
--
Bullish
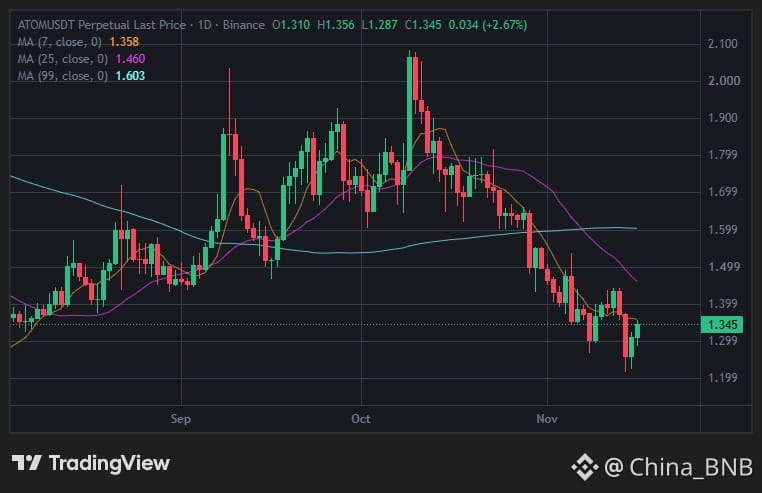
$ATOM ~ USDT Prep long swing
$1.32 $1.34 entry zon $ATOM
{future}(ATOMUSDT)
$ATOM ~ USDT Prep long swing
$1.32 $1.34 entry zon $ATOM
$1.32 $1.34 entry zon $ATOM
1
4
245
·
--
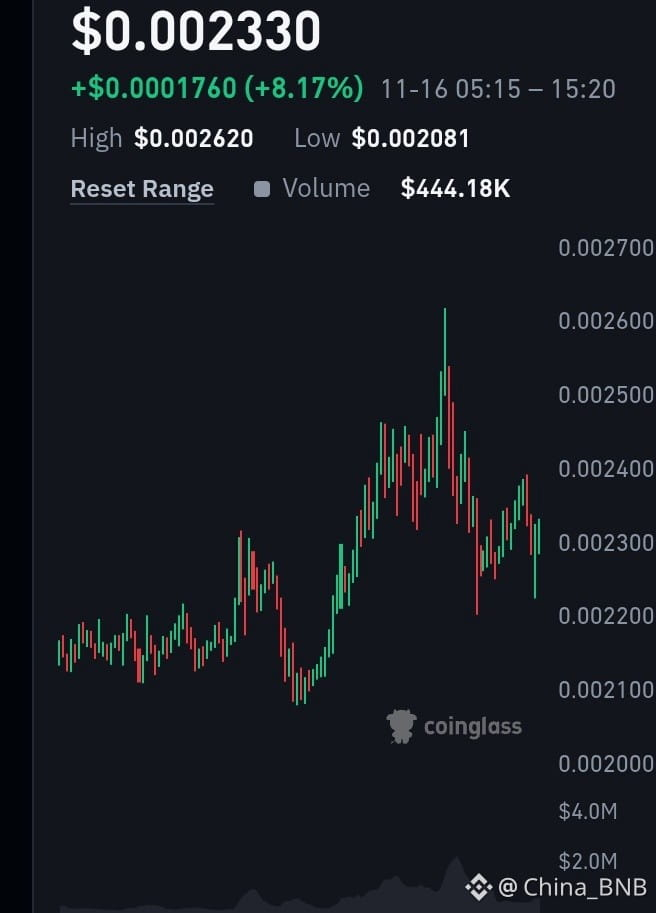
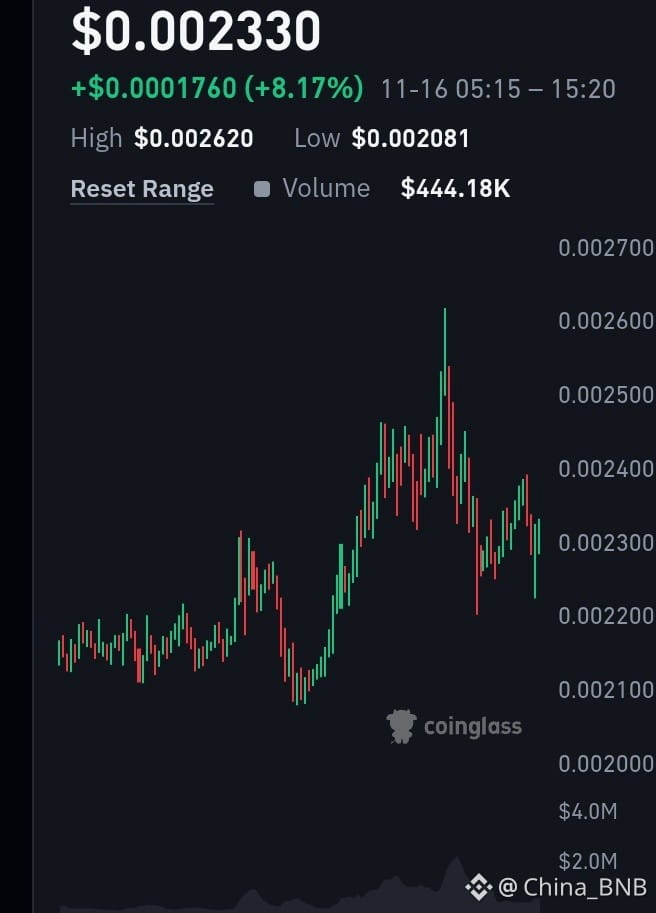
🚀 JCT (Janction) LIVE SPOT MARKET ANALYSIS
JCT is showing positive momentum, but the next resistance zone will be important for bulls.
📊 Market Levels (JCT/USDT)
💰 Reference Price: $0.00220
🔴 Resistance 1: $0.00272
🔴 Resistance 2: $0.00324
🟢 Support 1: $0.00181
🟢 Support 2: $0.00142
📈 My Market Outlook
• A strong breakout above $0.00272 with increasing volume could open the way toward $0.00324.
• Rejection near resistance may bring a pullback toward support.
• Watch volume and candle closes before confirming a breakout.
🎯 Key Level: $0.00272
Will JCT break resistance or face another rejection?
#JCT #BinanceSquare #Altcoins
{future}(JCTUSDT)
⚠️ Educational analysis only. Not financial advice.
🚀 JCT (Janction) LIVE SPOT MARKET ANALYSIS
JCT is showing positive momentum, but the next resistance zone will be important for bulls.
📊 Market Levels (JCT/USDT)
💰 Reference Price: $0.00220
🔴 Resistance 1: $0.00272
🔴 Resistance 2: $0.00324
🟢 Support 1: $0.00181
🟢 Support 2: $0.00142
📈 My Market Outlook
• A strong breakout above $0.00272 with increasing volume could open the way toward $0.00324.
• Rejection near resistance may bring a pullback toward support.
• Watch volume and candle closes before confirming a breakout.
🎯 Key Level: $0.00272
Will JCT break resistance or face another rejection?
#JCT #BinanceSquare #Altcoins
⚠️ Educational analysis only. Not financial advice.
JCT is showing positive momentum, but the next resistance zone will be important for bulls.
📊 Market Levels (JCT/USDT)
💰 Reference Price: $0.00220
🔴 Resistance 1: $0.00272
🔴 Resistance 2: $0.00324
🟢 Support 1: $0.00181
🟢 Support 2: $0.00142
📈 My Market Outlook
• A strong breakout above $0.00272 with increasing volume could open the way toward $0.00324.
• Rejection near resistance may bring a pullback toward support.
• Watch volume and candle closes before confirming a breakout.
🎯 Key Level: $0.00272
Will JCT break resistance or face another rejection?
#JCT #BinanceSquare #Altcoins
⚠️ Educational analysis only. Not financial advice.
5
180
·
--
🚀 JCT (Janction) LIVE SPOT MARKET ANALYSIS
JCT is showing positive momentum, but the next resistance zone will be important for bulls.
📊 Market Levels (JCT/USDT)
💰 Reference Price: $0.00220
🔴 Resistance 1: $0.00272
🔴 Resistance 2: $0.00324
🟢 Support 1: $0.00181
🟢 Support 2: $0.00142
📈 My Market Outlook
• A strong breakout above $0.00272 with increasing volume could open the way toward $0.00324.
• Rejection near resistance may bring a pullback toward support.
• Watch volume and candle closes before confirming a breakout.
🎯 Key Level: $0.00272
Will JCT break resistance or face another rejection?
#JCT #BinanceSquare #Altcoins
{future}(JCTUSDT)
⚠️ Educational analysis only. Not financial advice.
🚀 JCT (Janction) LIVE SPOT MARKET ANALYSIS
JCT is showing positive momentum, but the next resistance zone will be important for bulls.
📊 Market Levels (JCT/USDT)
💰 Reference Price: $0.00220
🔴 Resistance 1: $0.00272
🔴 Resistance 2: $0.00324
🟢 Support 1: $0.00181
🟢 Support 2: $0.00142
📈 My Market Outlook
• A strong breakout above $0.00272 with increasing volume could open the way toward $0.00324.
• Rejection near resistance may bring a pullback toward support.
• Watch volume and candle closes before confirming a breakout.
🎯 Key Level: $0.00272
Will JCT break resistance or face another rejection?
#JCT #BinanceSquare #Altcoins
⚠️ Educational analysis only. Not financial advice.
JCT is showing positive momentum, but the next resistance zone will be important for bulls.
📊 Market Levels (JCT/USDT)
💰 Reference Price: $0.00220
🔴 Resistance 1: $0.00272
🔴 Resistance 2: $0.00324
🟢 Support 1: $0.00181
🟢 Support 2: $0.00142
📈 My Market Outlook
• A strong breakout above $0.00272 with increasing volume could open the way toward $0.00324.
• Rejection near resistance may bring a pullback toward support.
• Watch volume and candle closes before confirming a breakout.
🎯 Key Level: $0.00272
Will JCT break resistance or face another rejection?
#JCT #BinanceSquare #Altcoins
⚠️ Educational analysis only. Not financial advice.
1
666
·
--
Bearish
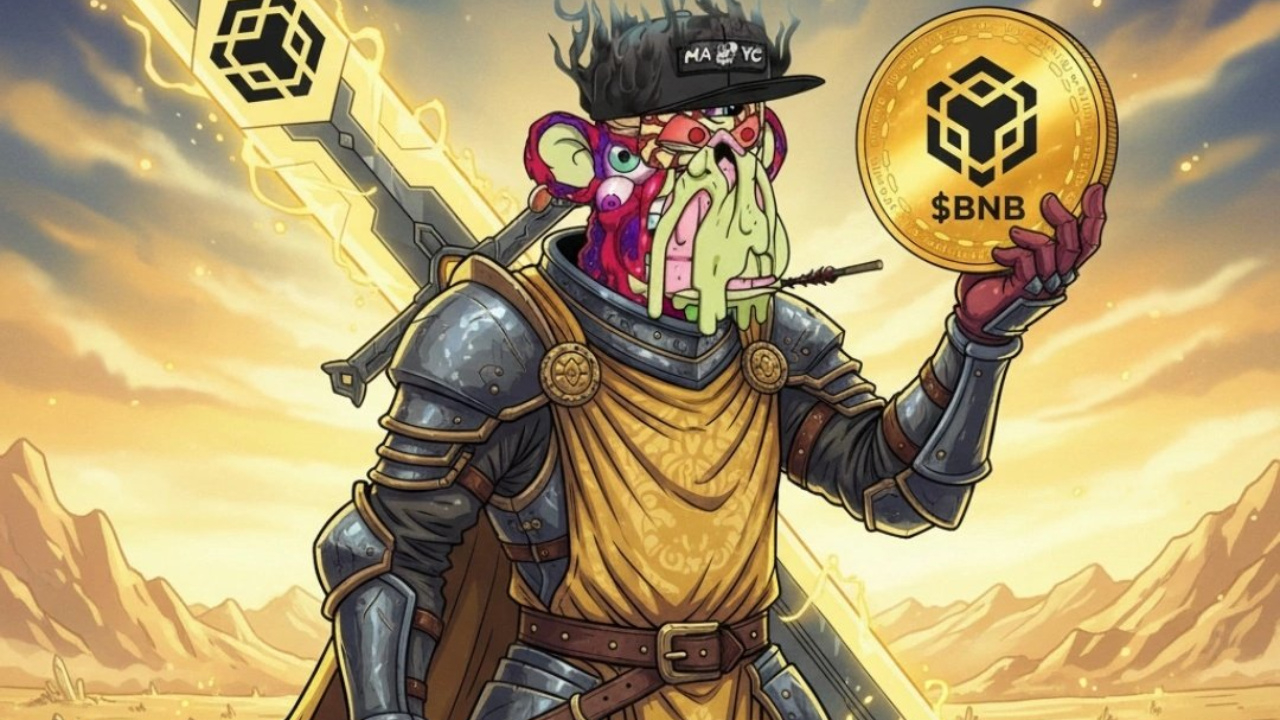
Bitcoin (BTC): The Future of Digital Finance!
Bitcoin is more than just a cryptocurrency — it's a revolution in digital finance.
🌍 Decentralized and borderless
🔒 Secure blockchain technology
💎 Limited supply of 21 million BTC
📈 Growing global adoption
Bitcoin continues to show why it remains the king of crypto. Every market move brings new opportunities, but smart investors always focus on research, patience, and risk management.
My strategy is simple: DYOR, stay patient, and think long-term.
What do you think? Will BTC reach a new all-time high in the next bull run? 👀
#bitcoin #BTC #Blockchain $BTC
Bitcoin (BTC): The Future of Digital Finance!
Bitcoin is more than just a cryptocurrency — it's a revolution in digital finance.
🌍 Decentralized and borderless
🔒 Secure blockchain technology
💎 Limited supply of 21 million BTC
📈 Growing global adoption
Bitcoin continues to show why it remains the king of crypto. Every market move brings new opportunities, but smart investors always focus on research, patience, and risk management.
My strategy is simple: DYOR, stay patient, and think long-term.
What do you think? Will BTC reach a new all-time high in the next bull run? 👀
#bitcoin #BTC #Blockchain $BTC
Bitcoin is more than just a cryptocurrency — it's a revolution in digital finance.
🌍 Decentralized and borderless
🔒 Secure blockchain technology
💎 Limited supply of 21 million BTC
📈 Growing global adoption
Bitcoin continues to show why it remains the king of crypto. Every market move brings new opportunities, but smart investors always focus on research, patience, and risk management.
My strategy is simple: DYOR, stay patient, and think long-term.
What do you think? Will BTC reach a new all-time high in the next bull run? 👀
#bitcoin #BTC #Blockchain $BTC

1
2
194

·
--
Hey Everyone can Lal Pari is Hear #Lalpari $BTC Lal 🛑 Stopped at the Hodl $SOL wait for the next move to Green 💚 Pari
Hey Everyone can Lal Pari is Hear #Lalpari $BTC Lal 🛑 Stopped at the Hodl $SOL wait for the next move to Green 💚 Pari
3
85
·
--
Bullish
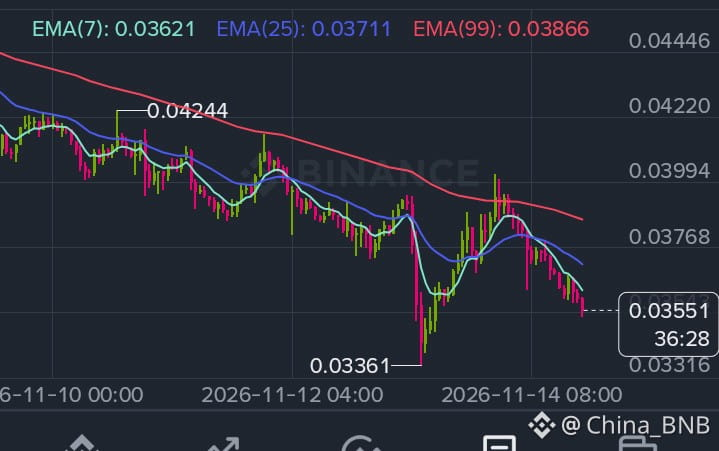
Hey Traders 🛑 Stopped is everything is good soon 🔜
$LAB Session is Back NEXT week 🔥 move started on Monday to start a gol LAB strong Move #TradingCommunity
{future}(LABUSDT)
Hey Traders 🛑 Stopped is everything is good soon 🔜
$LAB Session is Back NEXT week 🔥 move started on Monday to start a gol LAB strong Move #TradingCommunity
$LAB Session is Back NEXT week 🔥 move started on Monday to start a gol LAB strong Move #TradingCommunity
1
4
798
·
--
Bullish
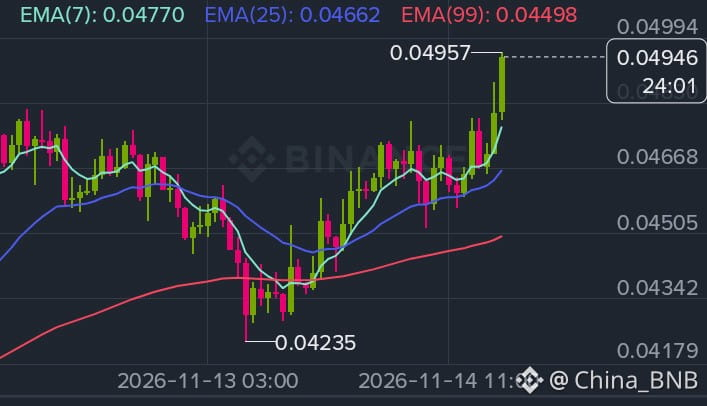
$AKE move on the $0.15 to $0.17 hot gains not missing the chance
$AKE move on the $0.15 to $0.17 hot gains not missing the chance
1
3
771
·
--
1 month my trading panel is very week I have staying at trade with in 1 week #tradeNEarn
1 month my trading panel is very week I have staying at trade with in 1 week #tradeNEarn
1
4
213
Log in to explore more content
Join global crypto users on Binance Square
⚡️ Get latest and useful information about crypto.
💬 Trusted by the world’s largest crypto exchange.
👍 Discover real insights from verified creators.
Email / Phone number
Trending Topics
CanBTCReboundAfterFallingBelow60K?
0 views
43 Discussing
Bitcoin News | Bitcoin Falls Below $60,000 for the First Time Since July as IBIT Posts Record $541 Million Outflow
Binance News
·6 Likes
·5.4k views
GlobalStocksFaceLongestLosingStreakSince2023
0 views
223 Discussing
AnthropicPlungesTowardIPOPriceonDay2
0 views
7 Discussing