

Crypto__Today
1.9k Posts

Crypto__Today
Report
Block User
Make impactful strides with the all-in-one, intelligent marketing platform designed to accelerate the growth of blockchain projects.Any promo: @Theodore_finch1
Open Trade
Occasional Trader
4.7 Years
15 Following
12.8K+ Followers
12.1K Liked
Posts
Portfolio
All
Quotes
Live
PINNED

Article
DOGS (DOGS) Price Prediction 2024, 2025–2030Explore short and medium-term DOGS price prediction analysis and check long-term DOGS forecasts for 2025, 2030, and beyond.
According to our current DOGS price prediction, the price of DOGS is predicted to rise by 228.05% and reach $ 0.007002 by September 25, 2024. Per our technical indicators, the current sentiment is Bearish while the Fear & Greed Index is showing 55 (Greed). DOGS recorded 5/7 (71%) green days with price volatility over the last 30 days. Based on the DOGS forecast, it's now a bad time to buy DOGS.
Based on the historical price movements of DOGS and the BTC halving cycles, the yearly low DOGS price prediction for 2025 is estimated at $ 0.002134. Meanwhile, the price of DOGS is predicted to reach as high as $ 0.010086 next year. Using the same basis, here is the DOGS price prediction for each year up until 2030.
DOGS price prediction 2025
The DOGS price prediction for 2025 is currently between $ 0.002134 on the lower end and $ 0.010086 on the high end. Compared to today’s price, DOGS could gain 372.57% by 2025 if DOGS reaches the upper price target.
DOGS price prediction 2030
The DOGS price prediction for 2030 is currently between $ 0.005381 on the lower end and $ 0.008725 on the high end. Compared to today’s price, DOGS could gain 308.82% by 2030 if it reaches the upper price target.
DOGS Price Forecast Based on Technical Analysis
Popular DOGS Moving Averages and Oscillators for Mon, Aug 26, 2024
Moving averages (MA) are a popular indicator in all financial markets, designed to smooth price action over a certain amount of time. They are a lagging indicator which means they are influenced by historical price activity. In the table below you can find two types of moving averages, simple moving average (SMA) and exponential moving average (EMA).
DOGS Key Price Levels
Based on today's classical pivot point (P1) with the value of $ 0.00205, DOGS has support levels of $ 0.001864, $ 0.001593, and the strongest at $ 0.001407. Similarly, DOGS resistance levels are at $ 0.002321, $ 0.002507, and $ 0.002778.
#BinanceLaunchpoolDOGS #TelegramCEO #CryptoMarketMoves #BinanceBlockchainWeek #LowestCPI2021
DOGS (DOGS) Price Prediction 2024, 2025–2030
Explore short and medium-term DOGS price prediction analysis and check long-term DOGS forecasts for 2025, 2030, and beyond.
According to our current DOGS price prediction, the price of DOGS is predicted to rise by 228.05% and reach $ 0.007002 by September 25, 2024. Per our technical indicators, the current sentiment is Bearish while the Fear & Greed Index is showing 55 (Greed). DOGS recorded 5/7 (71%) green days with price volatility over the last 30 days. Based on the DOGS forecast, it's now a bad time to buy DOGS.
Based on the historical price movements of DOGS and the BTC halving cycles, the yearly low DOGS price prediction for 2025 is estimated at $ 0.002134. Meanwhile, the price of DOGS is predicted to reach as high as $ 0.010086 next year. Using the same basis, here is the DOGS price prediction for each year up until 2030.
DOGS price prediction 2025
The DOGS price prediction for 2025 is currently between $ 0.002134 on the lower end and $ 0.010086 on the high end. Compared to today’s price, DOGS could gain 372.57% by 2025 if DOGS reaches the upper price target.
DOGS price prediction 2030
The DOGS price prediction for 2030 is currently between $ 0.005381 on the lower end and $ 0.008725 on the high end. Compared to today’s price, DOGS could gain 308.82% by 2030 if it reaches the upper price target.
DOGS Price Forecast Based on Technical Analysis
Popular DOGS Moving Averages and Oscillators for Mon, Aug 26, 2024
Moving averages (MA) are a popular indicator in all financial markets, designed to smooth price action over a certain amount of time. They are a lagging indicator which means they are influenced by historical price activity. In the table below you can find two types of moving averages, simple moving average (SMA) and exponential moving average (EMA).
DOGS Key Price Levels
Based on today's classical pivot point (P1) with the value of $ 0.00205, DOGS has support levels of $ 0.001864, $ 0.001593, and the strongest at $ 0.001407. Similarly, DOGS resistance levels are at $ 0.002321, $ 0.002507, and $ 0.002778.
#BinanceLaunchpoolDOGS #TelegramCEO #CryptoMarketMoves #BinanceBlockchainWeek #LowestCPI2021
According to our current DOGS price prediction, the price of DOGS is predicted to rise by 228.05% and reach $ 0.007002 by September 25, 2024. Per our technical indicators, the current sentiment is Bearish while the Fear & Greed Index is showing 55 (Greed). DOGS recorded 5/7 (71%) green days with price volatility over the last 30 days. Based on the DOGS forecast, it's now a bad time to buy DOGS.
Based on the historical price movements of DOGS and the BTC halving cycles, the yearly low DOGS price prediction for 2025 is estimated at $ 0.002134. Meanwhile, the price of DOGS is predicted to reach as high as $ 0.010086 next year. Using the same basis, here is the DOGS price prediction for each year up until 2030.
DOGS price prediction 2025
The DOGS price prediction for 2025 is currently between $ 0.002134 on the lower end and $ 0.010086 on the high end. Compared to today’s price, DOGS could gain 372.57% by 2025 if DOGS reaches the upper price target.
DOGS price prediction 2030
The DOGS price prediction for 2030 is currently between $ 0.005381 on the lower end and $ 0.008725 on the high end. Compared to today’s price, DOGS could gain 308.82% by 2030 if it reaches the upper price target.
DOGS Price Forecast Based on Technical Analysis
Popular DOGS Moving Averages and Oscillators for Mon, Aug 26, 2024
Moving averages (MA) are a popular indicator in all financial markets, designed to smooth price action over a certain amount of time. They are a lagging indicator which means they are influenced by historical price activity. In the table below you can find two types of moving averages, simple moving average (SMA) and exponential moving average (EMA).
DOGS Key Price Levels
Based on today's classical pivot point (P1) with the value of $ 0.00205, DOGS has support levels of $ 0.001864, $ 0.001593, and the strongest at $ 0.001407. Similarly, DOGS resistance levels are at $ 0.002321, $ 0.002507, and $ 0.002778.
#BinanceLaunchpoolDOGS #TelegramCEO #CryptoMarketMoves #BinanceBlockchainWeek #LowestCPI2021
177
8
1.8k
651.6k

Article
Brazil’s Shocking Election Result: Lula Re-elected, Bovespa Plunges 15%—What's Next for Markets?Brazil just witnessed one of the most volatile political outcomes of the year. Incumbent President Luiz Inácio Lula da Silva secured re-election, narrowly defeating right-wing challenger Flávio Bolsonaro with 51.77% of the vote.
The immediate reaction from the financial sector was swift and severe, with the Ibovespa stock market index crashing 15% following the announcement. For global investors, macroeconomic strategists, and cryptocurrency traders tracking emerging markets, this political pivot triggers a massive wave of capital re-allocation.
Here is an analysis of why the markets reacted so aggressively and what comes next.
Why the Stock Market Panicked
The 15% drop reflects a classic market knee-jerk reaction to political uncertainty and a shifting economic philosophy.
Fear of Fiscal Expansion: Investors are bracing for increased government spending, social welfare programs, and tighter state control over major industries—hallmarks of Lula's traditional economic platform.The Fate of State-Owned Giants: Heavyweight state-backed entities like Petrobras and Banco do Brasil face immediate selling pressure as traders anticipate potential shifts in corporate governance, dividend policies, and strategic priorities away from pure privatization.Currency Volatility: The Brazilian Real (BRL) is experiencing extreme friction, driving up import costs and complicating the inflation outlook for the Central Bank of Brazil.
What's Next? Key Triggers to Watch
While the initial crash signals panic, the medium-term outlook will depend entirely on Lula’s next structural moves. Savvy market participants are tracking three critical areas:
1. Cabinet Appointments & Fiscal Frameworks
The market’s primary focus will be on who Lula appoints to lead the Ministry of Finance. A pragmatic, orthodox economic team could quickly restore market confidence and stabilize the Bovespa. Conversely, choosing highly interventionist policymakers could prolong the capital flight.
2. Legislative Gridlock
Lula won by a razor-thin margin (51.77%), meaning the country remains deeply polarized. More importantly, the Brazilian Congress features a strong conservative and centrist presence. Lula will be forced to negotiate every major policy, likely diluting any extreme fiscal proposals and creating a stabilizing political checks-and-balances system.
3. The Digital Asset and Crypto Outlook
Brazil remains a crown jewel for cryptocurrency adoption in Latin America. Under the current regulatory framework, the Central Bank of Brazil has aggressively pushed for institutional crypto integration, stablecoin guidelines, and the development of its central bank digital currency (CBDC), Drex.
Historically, Lula’s administration has supported formalizing digital economies to boost financial inclusion and tax compliance. While traditional equities bleed, Brazil’s crypto infrastructure is likely to remain resilient, potentially acting as an alternative capital sanctuary if the BRL continues to weaken.
Investor Takeaway
A 15% market crash represents extreme panic, but it also opens the door for historic mispricings. Historically, emerging market shocks of this magnitude tend to overextend.
If the new administration signals structural fiscal discipline and cooperates with a divided Congress, Brazil's beaten-down equity valuations, high-yielding fixed-income instruments, and robust digital asset ecosystems could offer a compelling asymmetric risk-reward profile once the dust settles.
#EarningsSeason #Write2Earn
Brazil’s Shocking Election Result: Lula Re-elected, Bovespa Plunges 15%—What's Next for Markets?
Brazil just witnessed one of the most volatile political outcomes of the year. Incumbent President Luiz Inácio Lula da Silva secured re-election, narrowly defeating right-wing challenger Flávio Bolsonaro with 51.77% of the vote.
The immediate reaction from the financial sector was swift and severe, with the Ibovespa stock market index crashing 15% following the announcement. For global investors, macroeconomic strategists, and cryptocurrency traders tracking emerging markets, this political pivot triggers a massive wave of capital re-allocation.
Here is an analysis of why the markets reacted so aggressively and what comes next.
Why the Stock Market Panicked
The 15% drop reflects a classic market knee-jerk reaction to political uncertainty and a shifting economic philosophy.
Fear of Fiscal Expansion: Investors are bracing for increased government spending, social welfare programs, and tighter state control over major industries—hallmarks of Lula's traditional economic platform.The Fate of State-Owned Giants: Heavyweight state-backed entities like Petrobras and Banco do Brasil face immediate selling pressure as traders anticipate potential shifts in corporate governance, dividend policies, and strategic priorities away from pure privatization.Currency Volatility: The Brazilian Real (BRL) is experiencing extreme friction, driving up import costs and complicating the inflation outlook for the Central Bank of Brazil.
What's Next? Key Triggers to Watch
While the initial crash signals panic, the medium-term outlook will depend entirely on Lula’s next structural moves. Savvy market participants are tracking three critical areas:
1. Cabinet Appointments & Fiscal Frameworks
The market’s primary focus will be on who Lula appoints to lead the Ministry of Finance. A pragmatic, orthodox economic team could quickly restore market confidence and stabilize the Bovespa. Conversely, choosing highly interventionist policymakers could prolong the capital flight.
2. Legislative Gridlock
Lula won by a razor-thin margin (51.77%), meaning the country remains deeply polarized. More importantly, the Brazilian Congress features a strong conservative and centrist presence. Lula will be forced to negotiate every major policy, likely diluting any extreme fiscal proposals and creating a stabilizing political checks-and-balances system.
3. The Digital Asset and Crypto Outlook
Brazil remains a crown jewel for cryptocurrency adoption in Latin America. Under the current regulatory framework, the Central Bank of Brazil has aggressively pushed for institutional crypto integration, stablecoin guidelines, and the development of its central bank digital currency (CBDC), Drex.
Historically, Lula’s administration has supported formalizing digital economies to boost financial inclusion and tax compliance. While traditional equities bleed, Brazil’s crypto infrastructure is likely to remain resilient, potentially acting as an alternative capital sanctuary if the BRL continues to weaken.
Investor Takeaway
A 15% market crash represents extreme panic, but it also opens the door for historic mispricings. Historically, emerging market shocks of this magnitude tend to overextend.
If the new administration signals structural fiscal discipline and cooperates with a divided Congress, Brazil's beaten-down equity valuations, high-yielding fixed-income instruments, and robust digital asset ecosystems could offer a compelling asymmetric risk-reward profile once the dust settles.
#EarningsSeason #Write2Earn
The immediate reaction from the financial sector was swift and severe, with the Ibovespa stock market index crashing 15% following the announcement. For global investors, macroeconomic strategists, and cryptocurrency traders tracking emerging markets, this political pivot triggers a massive wave of capital re-allocation.
Here is an analysis of why the markets reacted so aggressively and what comes next.
Why the Stock Market Panicked
The 15% drop reflects a classic market knee-jerk reaction to political uncertainty and a shifting economic philosophy.
Fear of Fiscal Expansion: Investors are bracing for increased government spending, social welfare programs, and tighter state control over major industries—hallmarks of Lula's traditional economic platform.The Fate of State-Owned Giants: Heavyweight state-backed entities like Petrobras and Banco do Brasil face immediate selling pressure as traders anticipate potential shifts in corporate governance, dividend policies, and strategic priorities away from pure privatization.Currency Volatility: The Brazilian Real (BRL) is experiencing extreme friction, driving up import costs and complicating the inflation outlook for the Central Bank of Brazil.
What's Next? Key Triggers to Watch
While the initial crash signals panic, the medium-term outlook will depend entirely on Lula’s next structural moves. Savvy market participants are tracking three critical areas:
1. Cabinet Appointments & Fiscal Frameworks
The market’s primary focus will be on who Lula appoints to lead the Ministry of Finance. A pragmatic, orthodox economic team could quickly restore market confidence and stabilize the Bovespa. Conversely, choosing highly interventionist policymakers could prolong the capital flight.
2. Legislative Gridlock
Lula won by a razor-thin margin (51.77%), meaning the country remains deeply polarized. More importantly, the Brazilian Congress features a strong conservative and centrist presence. Lula will be forced to negotiate every major policy, likely diluting any extreme fiscal proposals and creating a stabilizing political checks-and-balances system.
3. The Digital Asset and Crypto Outlook
Brazil remains a crown jewel for cryptocurrency adoption in Latin America. Under the current regulatory framework, the Central Bank of Brazil has aggressively pushed for institutional crypto integration, stablecoin guidelines, and the development of its central bank digital currency (CBDC), Drex.
Historically, Lula’s administration has supported formalizing digital economies to boost financial inclusion and tax compliance. While traditional equities bleed, Brazil’s crypto infrastructure is likely to remain resilient, potentially acting as an alternative capital sanctuary if the BRL continues to weaken.
Investor Takeaway
A 15% market crash represents extreme panic, but it also opens the door for historic mispricings. Historically, emerging market shocks of this magnitude tend to overextend.
If the new administration signals structural fiscal discipline and cooperates with a divided Congress, Brazil's beaten-down equity valuations, high-yielding fixed-income instruments, and robust digital asset ecosystems could offer a compelling asymmetric risk-reward profile once the dust settles.
#EarningsSeason #Write2Earn
1
168
Partly True

Article
Geopolitical Flashpoint: Trump Warns of Potential Iran Strikes—Can Bitcoin Hold the Critical $80,000The cryptocurrency market is bracing for acute volatility as escalating geopolitical tensions intersect with a critical technical retest for digital assets. President Donald Trump publicly declared that military strikes against Iran could initiate as soon as Sunday, though he maintained that a diplomatic resolution remains an open possibility.
Against this highly charged global backdrop, Bitcoin ($BTC) is fighting to protect its structural baseline, currently trading at $80,546 after briefly violating the critical psychological threshold by dipping below $80,000 on Saturday.
The Geopolitical Engine: Safe Haven or Risk Asset?
The immediate horizon presents a complex macroeconomic paradigm for digital asset traders. Historical precedents suggest that localized military conflicts act as significant catalysts for immediate capital reallocation.
Initial Shock Volatility: Sudden geopolitical updates typically trigger immediate cascading liquidations across highly leveraged derivative markets, as evidenced by Saturday's brief dip below $80,000.The De-Risking Reflex: In the immediate wake of military uncertainty, institutional managers often rotate capital into physical cash equivalents or short-term sovereign debt instruments, temporarily starving risk markets of liquidity.Long-Term Alternative Narrative: Conversely, structural instability within traditional banking hours often accelerates the core thesis of decentralized, borderless networks. If standard fiat rails encounter friction, hard assets like $BTC frequently experience powerful secondary accumulation waves.
Technical Realities: The $80,000 Defense Line
From a pure market structure perspective, the weekend price action has isolated the exact boundaries of the current structural playing field.
The Saturday Flush: The brief drop below $80,000 successfully flushed out short-term speculative longs, resetting open interest metrics to healthier baseline levels.Aggressive Limit Orders: The swift recovery back toward $80,546 proves that robust, institutional scale buy-walls remain highly active right beneath the round-number support zone.Weekend Illiquidity Risks: Because traditional banking infrastructure is dark over the weekend, the market remains highly susceptible to localized order-book exploitation if sudden headlines drop before the Monday morning bell.
Strategy for Active Market Participants
The next 24 hours require heightened risk management protocols. Traders must treat the macro headlines not as speculative trading signals, but as indicators of sudden liquidity shifts. A definitive daily close below the $80,000 cluster could rapidly open the doors to test the structural support nodes situated in the mid-$70,000 range. Conversely, if $BTC successfully absorbs the geopolitical headline risk above $80,000, it sets a incredibly strong foundation for a relief rally once institutional trading desks reopen globally.
#WriteToEarn #BTC #Geopolitics #MarketVolatility #CryptoNews
Geopolitical Flashpoint: Trump Warns of Potential Iran Strikes—Can Bitcoin Hold the Critical $80,000
The cryptocurrency market is bracing for acute volatility as escalating geopolitical tensions intersect with a critical technical retest for digital assets. President Donald Trump publicly declared that military strikes against Iran could initiate as soon as Sunday, though he maintained that a diplomatic resolution remains an open possibility.
Against this highly charged global backdrop, Bitcoin ($BTC ) is fighting to protect its structural baseline, currently trading at $80,546 after briefly violating the critical psychological threshold by dipping below $80,000 on Saturday.
The Geopolitical Engine: Safe Haven or Risk Asset?
The immediate horizon presents a complex macroeconomic paradigm for digital asset traders. Historical precedents suggest that localized military conflicts act as significant catalysts for immediate capital reallocation.
Initial Shock Volatility: Sudden geopolitical updates typically trigger immediate cascading liquidations across highly leveraged derivative markets, as evidenced by Saturday's brief dip below $80,000.The De-Risking Reflex: In the immediate wake of military uncertainty, institutional managers often rotate capital into physical cash equivalents or short-term sovereign debt instruments, temporarily starving risk markets of liquidity.Long-Term Alternative Narrative: Conversely, structural instability within traditional banking hours often accelerates the core thesis of decentralized, borderless networks. If standard fiat rails encounter friction, hard assets like $BTC frequently experience powerful secondary accumulation waves.
Technical Realities: The $80,000 Defense Line
From a pure market structure perspective, the weekend price action has isolated the exact boundaries of the current structural playing field.
The Saturday Flush: The brief drop below $80,000 successfully flushed out short-term speculative longs, resetting open interest metrics to healthier baseline levels.Aggressive Limit Orders: The swift recovery back toward $80,546 proves that robust, institutional scale buy-walls remain highly active right beneath the round-number support zone.Weekend Illiquidity Risks: Because traditional banking infrastructure is dark over the weekend, the market remains highly susceptible to localized order-book exploitation if sudden headlines drop before the Monday morning bell.
Strategy for Active Market Participants
The next 24 hours require heightened risk management protocols. Traders must treat the macro headlines not as speculative trading signals, but as indicators of sudden liquidity shifts. A definitive daily close below the $80,000 cluster could rapidly open the doors to test the structural support nodes situated in the mid-$70,000 range. Conversely, if $BTC successfully absorbs the geopolitical headline risk above $80,000, it sets a incredibly strong foundation for a relief rally once institutional trading desks reopen globally.
#WriteToEarn #BTC #Geopolitics #MarketVolatility #CryptoNews
Against this highly charged global backdrop, Bitcoin ($BTC ) is fighting to protect its structural baseline, currently trading at $80,546 after briefly violating the critical psychological threshold by dipping below $80,000 on Saturday.
The Geopolitical Engine: Safe Haven or Risk Asset?
The immediate horizon presents a complex macroeconomic paradigm for digital asset traders. Historical precedents suggest that localized military conflicts act as significant catalysts for immediate capital reallocation.
Initial Shock Volatility: Sudden geopolitical updates typically trigger immediate cascading liquidations across highly leveraged derivative markets, as evidenced by Saturday's brief dip below $80,000.The De-Risking Reflex: In the immediate wake of military uncertainty, institutional managers often rotate capital into physical cash equivalents or short-term sovereign debt instruments, temporarily starving risk markets of liquidity.Long-Term Alternative Narrative: Conversely, structural instability within traditional banking hours often accelerates the core thesis of decentralized, borderless networks. If standard fiat rails encounter friction, hard assets like $BTC frequently experience powerful secondary accumulation waves.
Technical Realities: The $80,000 Defense Line
From a pure market structure perspective, the weekend price action has isolated the exact boundaries of the current structural playing field.
The Saturday Flush: The brief drop below $80,000 successfully flushed out short-term speculative longs, resetting open interest metrics to healthier baseline levels.Aggressive Limit Orders: The swift recovery back toward $80,546 proves that robust, institutional scale buy-walls remain highly active right beneath the round-number support zone.Weekend Illiquidity Risks: Because traditional banking infrastructure is dark over the weekend, the market remains highly susceptible to localized order-book exploitation if sudden headlines drop before the Monday morning bell.
Strategy for Active Market Participants
The next 24 hours require heightened risk management protocols. Traders must treat the macro headlines not as speculative trading signals, but as indicators of sudden liquidity shifts. A definitive daily close below the $80,000 cluster could rapidly open the doors to test the structural support nodes situated in the mid-$70,000 range. Conversely, if $BTC successfully absorbs the geopolitical headline risk above $80,000, it sets a incredibly strong foundation for a relief rally once institutional trading desks reopen globally.
#WriteToEarn #BTC #Geopolitics #MarketVolatility #CryptoNews
1
3
857
Article
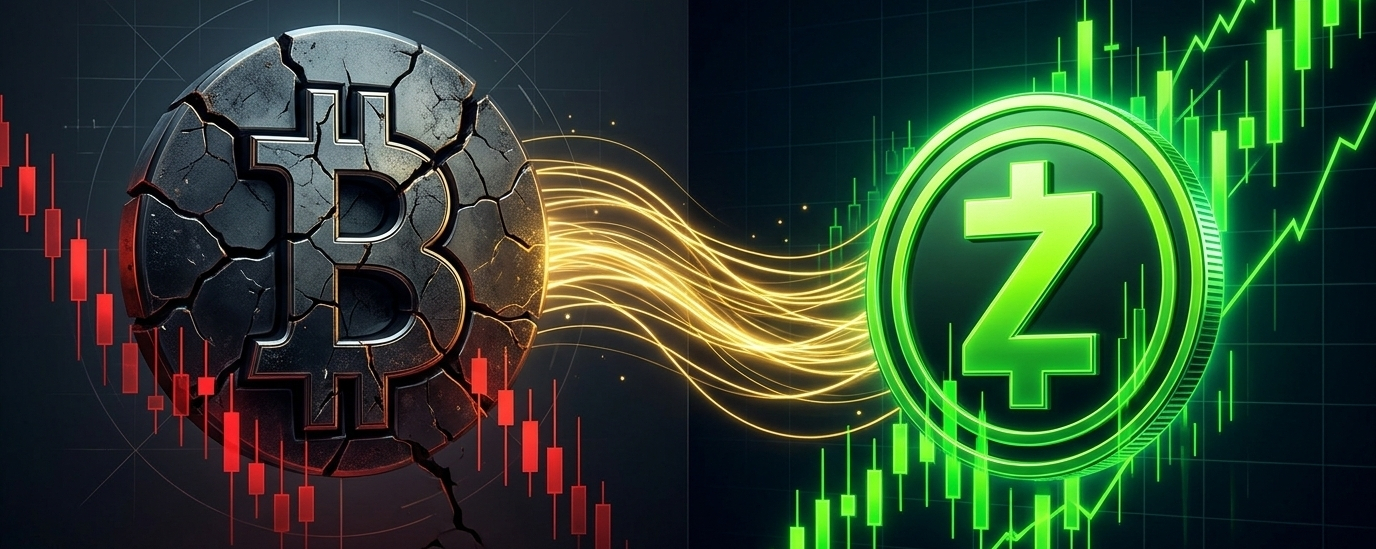
Capital Rotation? ETF Investors Pour Millions Into Zcash (ZEC) as Bitcoin (BTC) Outflows AccelerateThe cryptocurrency market is witnessing a fascinating shift in institutional capital dynamics. While traditional market eyes have been glued to the cooling momentum of primary assets, sophisticated Wall Street players are quietly redirecting liquidity. Over a volatile two-day window last week, spot Bitcoin ($NVDAB ETFs experienced over half a billion dollars in net outflows, while institutional investors simultaneously poured $41.1 million into Zcash ($ZEC).
This stark divergence raises a critical question for the broader market: Is smart money positioning itself ahead of a major privacy-centric narrative shift and an impending Zcash rally?
The Liquidity Contrast: Institutional De-risking vs. Targeted Re-entry
The contrasting flows indicate that large-scale market participants are not entirely exiting the digital asset ecosystem, but rather shifting strategies to exploit specific technical setups.
Bitcoin ETF Exhaustion: The massive deceleration in Bitcoin ETF net inflows suggests that institutional buyers are temporarily taking profits or hedging exposure as BTC consolidates beneath critical structural barriers.The Zcash Capital Influx: Allocating $41.1 million into a relatively mid-cap asset like Zcash in such a compressed timeframe represents a significant percentage of its circulating liquidity, creating massive localized buying pressure.Narrative Rotation: Historically, when capital drains from large-cap index drivers like $BTC, it triggers a rotation phase into specific altcoin categories offering higher volatility profiles or distinct utility arguments.
Why Zcash ($ZEC) Is Catching Wall Street's Attention
The sudden concentration of institutional interest in Zcash is rarely accidental. Several underlying catalysts could be driving this quiet accumulation phase.
Privacy Infrastructure Demand: As global regulatory oversight scales up, the foundational value proposition of robust, zero-knowledge security protocols is regaining institutional validation.Technological Maturation: Strategic upgrades within the Zcash network, particularly its transitions toward more scalable consensus layers and programmatic privacy tools, make it a highly viable long-term infrastructure bet.Asymmetric Risk-Reward Profile: Compared to major layer-1 assets that have already extended heavily into macro resistance, $ZEC presents an attractive, deeply discounted valuation relative to its historical high-water marks.
Market Outlook: Positioning for the Next Move
The upcoming trading week will be critical in confirming whether this institutional rotation has sustained structural legs. If Bitcoin stabilizes and stops the bleeding from its spot investment vehicles, the fresh capital injected into $ZEC could act as a high-powered spring, igniting broader speculative momentum across the entire privacy and zero-knowledge storage sector.
Traders should monitor near-term volume spikes on $ZEC to verify if Wall Street's accumulation phase translates into a definitive breakout above macro-resistance levels.
#WriteToEarn #ZEC #BTC #MacroOutlook #TrendingTopic
Capital Rotation? ETF Investors Pour Millions Into Zcash (ZEC) as Bitcoin (BTC) Outflows Accelerate
The cryptocurrency market is witnessing a fascinating shift in institutional capital dynamics. While traditional market eyes have been glued to the cooling momentum of primary assets, sophisticated Wall Street players are quietly redirecting liquidity. Over a volatile two-day window last week, spot Bitcoin ($NVDAB ETFs experienced over half a billion dollars in net outflows, while institutional investors simultaneously poured $41.1 million into Zcash ($ZEC ).
This stark divergence raises a critical question for the broader market: Is smart money positioning itself ahead of a major privacy-centric narrative shift and an impending Zcash rally?
The Liquidity Contrast: Institutional De-risking vs. Targeted Re-entry
The contrasting flows indicate that large-scale market participants are not entirely exiting the digital asset ecosystem, but rather shifting strategies to exploit specific technical setups.
Bitcoin ETF Exhaustion: The massive deceleration in Bitcoin ETF net inflows suggests that institutional buyers are temporarily taking profits or hedging exposure as BTC consolidates beneath critical structural barriers.The Zcash Capital Influx: Allocating $41.1 million into a relatively mid-cap asset like Zcash in such a compressed timeframe represents a significant percentage of its circulating liquidity, creating massive localized buying pressure.Narrative Rotation: Historically, when capital drains from large-cap index drivers like $BTC, it triggers a rotation phase into specific altcoin categories offering higher volatility profiles or distinct utility arguments.
Why Zcash ($ZEC ) Is Catching Wall Street's Attention
The sudden concentration of institutional interest in Zcash is rarely accidental. Several underlying catalysts could be driving this quiet accumulation phase.
Privacy Infrastructure Demand: As global regulatory oversight scales up, the foundational value proposition of robust, zero-knowledge security protocols is regaining institutional validation.Technological Maturation: Strategic upgrades within the Zcash network, particularly its transitions toward more scalable consensus layers and programmatic privacy tools, make it a highly viable long-term infrastructure bet.Asymmetric Risk-Reward Profile: Compared to major layer-1 assets that have already extended heavily into macro resistance, $ZEC presents an attractive, deeply discounted valuation relative to its historical high-water marks.
Market Outlook: Positioning for the Next Move
The upcoming trading week will be critical in confirming whether this institutional rotation has sustained structural legs. If Bitcoin stabilizes and stops the bleeding from its spot investment vehicles, the fresh capital injected into $ZEC could act as a high-powered spring, igniting broader speculative momentum across the entire privacy and zero-knowledge storage sector.
Traders should monitor near-term volume spikes on $ZEC to verify if Wall Street's accumulation phase translates into a definitive breakout above macro-resistance levels.
#WriteToEarn #ZEC #BTC #MacroOutlook #TrendingTopic
This stark divergence raises a critical question for the broader market: Is smart money positioning itself ahead of a major privacy-centric narrative shift and an impending Zcash rally?
The Liquidity Contrast: Institutional De-risking vs. Targeted Re-entry
The contrasting flows indicate that large-scale market participants are not entirely exiting the digital asset ecosystem, but rather shifting strategies to exploit specific technical setups.
Bitcoin ETF Exhaustion: The massive deceleration in Bitcoin ETF net inflows suggests that institutional buyers are temporarily taking profits or hedging exposure as BTC consolidates beneath critical structural barriers.The Zcash Capital Influx: Allocating $41.1 million into a relatively mid-cap asset like Zcash in such a compressed timeframe represents a significant percentage of its circulating liquidity, creating massive localized buying pressure.Narrative Rotation: Historically, when capital drains from large-cap index drivers like $BTC, it triggers a rotation phase into specific altcoin categories offering higher volatility profiles or distinct utility arguments.
Why Zcash ($ZEC ) Is Catching Wall Street's Attention
The sudden concentration of institutional interest in Zcash is rarely accidental. Several underlying catalysts could be driving this quiet accumulation phase.
Privacy Infrastructure Demand: As global regulatory oversight scales up, the foundational value proposition of robust, zero-knowledge security protocols is regaining institutional validation.Technological Maturation: Strategic upgrades within the Zcash network, particularly its transitions toward more scalable consensus layers and programmatic privacy tools, make it a highly viable long-term infrastructure bet.Asymmetric Risk-Reward Profile: Compared to major layer-1 assets that have already extended heavily into macro resistance, $ZEC presents an attractive, deeply discounted valuation relative to its historical high-water marks.
Market Outlook: Positioning for the Next Move
The upcoming trading week will be critical in confirming whether this institutional rotation has sustained structural legs. If Bitcoin stabilizes and stops the bleeding from its spot investment vehicles, the fresh capital injected into $ZEC could act as a high-powered spring, igniting broader speculative momentum across the entire privacy and zero-knowledge storage sector.
Traders should monitor near-term volume spikes on $ZEC to verify if Wall Street's accumulation phase translates into a definitive breakout above macro-resistance levels.
#WriteToEarn #ZEC #BTC #MacroOutlook #TrendingTopic
2
543

Article
Bitcoin Faces Critical Make-or-Break Weekend as Market Liquidity Tests $80,000The global cryptocurrency market is entering a high-stakes weekend as Bitcoin ($BTC ) struggles to maintain its bullish momentum, sparking intense debate over an impending market correction. After a failed attempt to consolidate above the psychological $83,000 resistance level, the premier digital asset has pulled back, forcing traders to closely monitor a critical line in the sand: the $80,000 baseline.
This crucial threshold represents more than just a round number. It serves as a pivotal support zone that could dictate the market's trajectory heading into the new week.
The Technical Battleground: Why $80,000 Matters
Bitcoin’s rejection at the higher bounds has shifted short-term market dynamics from aggressive accumulation to cautious defensive positioning.
Crucial Support Zone: The area between $79,500 and $80,400 is acting as the primary line of defense against deeper liquidations.Failed $83K Breakout: The inability to turn $83,000 into support triggered a wave of leveraged long liquidations, exhausting immediate buying pressure.Volume Metrics: Weekend trading typically brings lower volume and thinner order books, which could amplify price volatility in either direction.
Two Scenarios for the Days Ahead
Market participants are currently split between a healthy consolidation narrative and fears of a broader systemic flush.
The Bullish Defense: If buyers successfully absorb selling pressure above $80,000, this pullback will likely be classified as a standard retest. A successful defense here lays the groundwork for another leg up toward macro resistance.The Bearish Flush: A decisive daily close below $80,000 could trigger stop-loss orders and cascading liquidations. This scenario opens the door for a deeper correction, potentially testing lower support structures near the mid-$70,000 range.
Institutional Dominance vs. Retail Fear
Despite the immediate price anxiety, underlying market structures tell a story of resilience. Bitcoin continues to command a dominance rate of over 60% across the total digital asset landscape. This high concentration indicates that while capital is de-risking out of highly volatile altcoins, institutional allocations to $BTC remain structurally intact.
Market Outlook: The next 48 hours will test the market's true risk appetite. Traders should prepare for heightened volatility and closely monitor order book depth around the $80,000 level before committing to heavy positions.
#WriteToEarn #BTC #MarketDownturn #BinancePick
Bitcoin Faces Critical Make-or-Break Weekend as Market Liquidity Tests $80,000
The global cryptocurrency market is entering a high-stakes weekend as Bitcoin ($BTC ) struggles to maintain its bullish momentum, sparking intense debate over an impending market correction. After a failed attempt to consolidate above the psychological $83,000 resistance level, the premier digital asset has pulled back, forcing traders to closely monitor a critical line in the sand: the $80,000 baseline.
This crucial threshold represents more than just a round number. It serves as a pivotal support zone that could dictate the market's trajectory heading into the new week.
The Technical Battleground: Why $80,000 Matters
Bitcoin’s rejection at the higher bounds has shifted short-term market dynamics from aggressive accumulation to cautious defensive positioning.
Crucial Support Zone: The area between $79,500 and $80,400 is acting as the primary line of defense against deeper liquidations.Failed $83K Breakout: The inability to turn $83,000 into support triggered a wave of leveraged long liquidations, exhausting immediate buying pressure.Volume Metrics: Weekend trading typically brings lower volume and thinner order books, which could amplify price volatility in either direction.
Two Scenarios for the Days Ahead
Market participants are currently split between a healthy consolidation narrative and fears of a broader systemic flush.
The Bullish Defense: If buyers successfully absorb selling pressure above $80,000, this pullback will likely be classified as a standard retest. A successful defense here lays the groundwork for another leg up toward macro resistance.The Bearish Flush: A decisive daily close below $80,000 could trigger stop-loss orders and cascading liquidations. This scenario opens the door for a deeper correction, potentially testing lower support structures near the mid-$70,000 range.
Institutional Dominance vs. Retail Fear
Despite the immediate price anxiety, underlying market structures tell a story of resilience. Bitcoin continues to command a dominance rate of over 60% across the total digital asset landscape. This high concentration indicates that while capital is de-risking out of highly volatile altcoins, institutional allocations to $BTC remain structurally intact.
Market Outlook: The next 48 hours will test the market's true risk appetite. Traders should prepare for heightened volatility and closely monitor order book depth around the $80,000 level before committing to heavy positions.
#WriteToEarn #BTC #MarketDownturn #BinancePick
This crucial threshold represents more than just a round number. It serves as a pivotal support zone that could dictate the market's trajectory heading into the new week.
The Technical Battleground: Why $80,000 Matters
Bitcoin’s rejection at the higher bounds has shifted short-term market dynamics from aggressive accumulation to cautious defensive positioning.
Crucial Support Zone: The area between $79,500 and $80,400 is acting as the primary line of defense against deeper liquidations.Failed $83K Breakout: The inability to turn $83,000 into support triggered a wave of leveraged long liquidations, exhausting immediate buying pressure.Volume Metrics: Weekend trading typically brings lower volume and thinner order books, which could amplify price volatility in either direction.
Two Scenarios for the Days Ahead
Market participants are currently split between a healthy consolidation narrative and fears of a broader systemic flush.
The Bullish Defense: If buyers successfully absorb selling pressure above $80,000, this pullback will likely be classified as a standard retest. A successful defense here lays the groundwork for another leg up toward macro resistance.The Bearish Flush: A decisive daily close below $80,000 could trigger stop-loss orders and cascading liquidations. This scenario opens the door for a deeper correction, potentially testing lower support structures near the mid-$70,000 range.
Institutional Dominance vs. Retail Fear
Despite the immediate price anxiety, underlying market structures tell a story of resilience. Bitcoin continues to command a dominance rate of over 60% across the total digital asset landscape. This high concentration indicates that while capital is de-risking out of highly volatile altcoins, institutional allocations to $BTC remain structurally intact.
Market Outlook: The next 48 hours will test the market's true risk appetite. Traders should prepare for heightened volatility and closely monitor order book depth around the $80,000 level before committing to heavy positions.
#WriteToEarn #BTC #MarketDownturn #BinancePick
1
1
280

Article
OIL SURGES TOWARD YEARLY HIGHS: Are Stocks & Crypto Next to Crash?The timing couldn’t be worse for global markets. As crude oil targets its yearly peak, Wall Street is flashing red, Bitcoin is breaking key supports, and a massive geopolitical storm is brewing on the horizon.
Here is the brutal reality of what’s coming—and how it impacts your portfolio:
1️The Energy Tax on Growth
Rising oil prices act as a direct tax on consumers and corporations.
Inflation Resurgence: High crude spikes transportation costs, forcing the Federal Reserve to keep interest rates higher for longer.Wall Street Bleeding: Higher input costs compress corporate profit margins, triggering institutional de-risking across tech and growth stocks.
2️The Crypto Liquidity Squeeze 📉
Bitcoin and altcoins are no longer detached safe havens; they are hyper-sensitive liquidity gauges.
Risk-Off Dominance: As oil triggers broader market anxiety, investors are fleeing to cash, pulling massive capital out of digital assets.ETF Outflows: The cooling risk appetite has already sparked aggressive spot crypto ETF exits, accelerating the downward pressure.
3️ The Geopolitical Wildcard: US-Iran Escalation 🚀
The biggest threat isn't just economic; it’s structural. Rumors of a renewed US conflict with Iran post-midterm elections are freezing market sentiment.
Supply Shock: A war in the Middle East risks choking major energy chokepoints, sending oil past $100+ and breaking global supply chains.Panic Selling: Historically, the onset of major conflicts triggers immediate "sell-first, ask-questions-later" behavior in speculative assets like crypto.
The Bottom Line
Markets hate uncertainty, and right now, we are facing a perfect storm of energy inflation, monetary tightening, and wartime risk.
Buckle up. The next few weeks will determine if this is a temporary correction or the start of a deep structural crash.
#Crypto #EarningsSeason #macroeconomic #OilPrice #Bitcoin $BTC
OIL SURGES TOWARD YEARLY HIGHS: Are Stocks & Crypto Next to Crash?
The timing couldn’t be worse for global markets. As crude oil targets its yearly peak, Wall Street is flashing red, Bitcoin is breaking key supports, and a massive geopolitical storm is brewing on the horizon.
Here is the brutal reality of what’s coming—and how it impacts your portfolio:
1️The Energy Tax on Growth
Rising oil prices act as a direct tax on consumers and corporations.
Inflation Resurgence: High crude spikes transportation costs, forcing the Federal Reserve to keep interest rates higher for longer.Wall Street Bleeding: Higher input costs compress corporate profit margins, triggering institutional de-risking across tech and growth stocks.
2️The Crypto Liquidity Squeeze 📉
Bitcoin and altcoins are no longer detached safe havens; they are hyper-sensitive liquidity gauges.
Risk-Off Dominance: As oil triggers broader market anxiety, investors are fleeing to cash, pulling massive capital out of digital assets.ETF Outflows: The cooling risk appetite has already sparked aggressive spot crypto ETF exits, accelerating the downward pressure.
3️ The Geopolitical Wildcard: US-Iran Escalation 🚀
The biggest threat isn't just economic; it’s structural. Rumors of a renewed US conflict with Iran post-midterm elections are freezing market sentiment.
Supply Shock: A war in the Middle East risks choking major energy chokepoints, sending oil past $100+ and breaking global supply chains.Panic Selling: Historically, the onset of major conflicts triggers immediate "sell-first, ask-questions-later" behavior in speculative assets like crypto.
The Bottom Line
Markets hate uncertainty, and right now, we are facing a perfect storm of energy inflation, monetary tightening, and wartime risk.
Buckle up. The next few weeks will determine if this is a temporary correction or the start of a deep structural crash.
#Crypto #EarningsSeason #macroeconomic #OilPrice #Bitcoin $BTC
Here is the brutal reality of what’s coming—and how it impacts your portfolio:
1️The Energy Tax on Growth
Rising oil prices act as a direct tax on consumers and corporations.
Inflation Resurgence: High crude spikes transportation costs, forcing the Federal Reserve to keep interest rates higher for longer.Wall Street Bleeding: Higher input costs compress corporate profit margins, triggering institutional de-risking across tech and growth stocks.
2️The Crypto Liquidity Squeeze 📉
Bitcoin and altcoins are no longer detached safe havens; they are hyper-sensitive liquidity gauges.
Risk-Off Dominance: As oil triggers broader market anxiety, investors are fleeing to cash, pulling massive capital out of digital assets.ETF Outflows: The cooling risk appetite has already sparked aggressive spot crypto ETF exits, accelerating the downward pressure.
3️ The Geopolitical Wildcard: US-Iran Escalation 🚀
The biggest threat isn't just economic; it’s structural. Rumors of a renewed US conflict with Iran post-midterm elections are freezing market sentiment.
Supply Shock: A war in the Middle East risks choking major energy chokepoints, sending oil past $100+ and breaking global supply chains.Panic Selling: Historically, the onset of major conflicts triggers immediate "sell-first, ask-questions-later" behavior in speculative assets like crypto.
The Bottom Line
Markets hate uncertainty, and right now, we are facing a perfect storm of energy inflation, monetary tightening, and wartime risk.
Buckle up. The next few weeks will determine if this is a temporary correction or the start of a deep structural crash.
#Crypto #EarningsSeason #macroeconomic #OilPrice #Bitcoin $BTC
1
1
898
Article
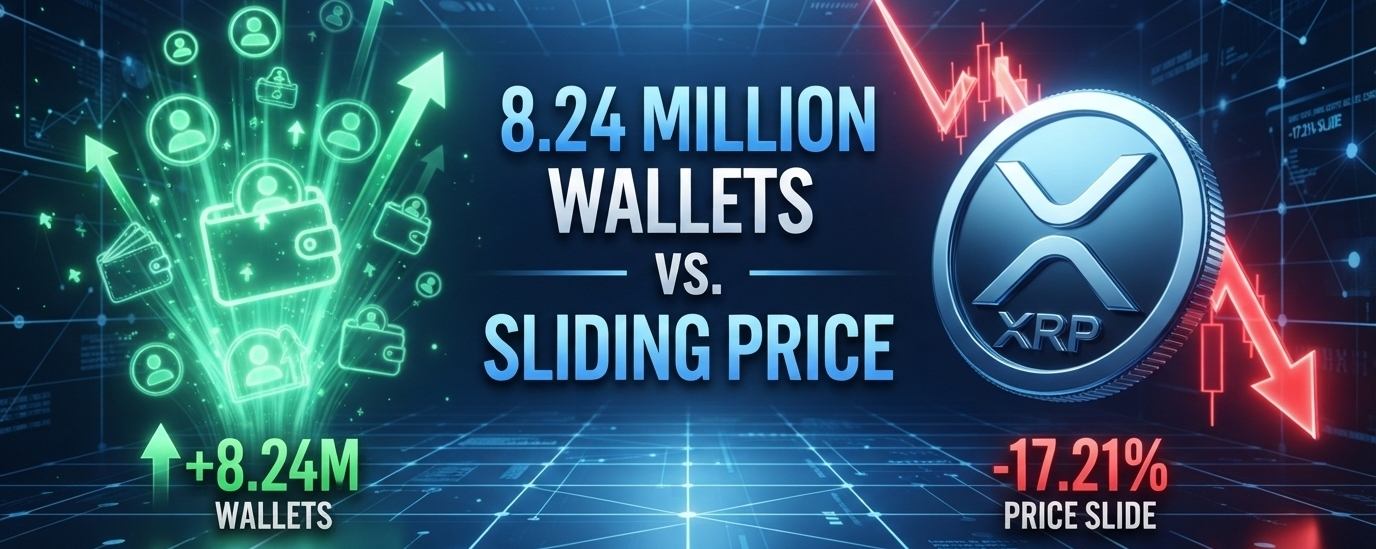
XRP Wallets Hit a Record 8.24 Million, So Why Is the Price Still Sliding?The Ripple ledger is experiencing an unprecedented surge in network adoption, yet the token's price remains stuck in a persistent downtrend. According to recent data from blockchain analytics firm Santiment, XRP has reached a historic milestone of 8.24 million non-empty wallets.
Despite this massive influx of address growth, the token has shed 17.21% of its value over the past month, slipping down to the $1.31 level.
This stark divergence between network growth and price action has left many investors scratching their heads. If more people are holding XRP than ever before, why is the price still sliding?
1. The "Dust Account" Dilution Effect
A primary reason for the mismatch between wallet growth and price appreciation is the nature of the addresses being created. A sharp rise in non-empty wallets does not automatically equal fresh, institutional capital entering the market. Many of these new accounts are retail users holding small fractions of XRP, often referred to as "dust." While the absolute number of holders looks impressive on a chart, the actual buying volume generated by these addresses is insufficient to absorb structural sell walls.
2. General Crypto Market De-risking
XRP does not trade in a vacuum. The broader digital asset market has faced significant headwinds recently, largely driven by macroeconomic shifts and tech-sector liquidations on Wall Street. As capital rotates out of riskier altcoins and moves toward cash or Bitcoin dominance (which recently hovered near 58%), XRP has suffered from a lack of independent upward momentum. When the tides of the overall market recede, even networks with strong fundamentals get dragged down.
3. Supply Inflation and Escrow Releases
Price is fundamentally governed by supply and demand. Even as demand grows via new wallet creation, Ripple’s predictable monthly escrow releases continue to introduce hundreds of millions of tokens into the circulating supply. When these massive unlocks coincide with periods of low market liquidity, they create a natural ceiling for price growth, requiring immense buying pressure just to maintain a flat baseline.
4. Speculative Fatigue vs. Real Utility
While enterprise adoption is steadily climbing—highlighted by major institutions expanding tokenized fund pilots across public ledgers—retail speculation still dictates short-term price movements. Many long-term holders have grown fatigued by prolonged consolidation phases, leading to localized distribution (selling) that counteracts the accumulation seen from new, smaller market entrants.
The Bottom Line
Record-breaking wallet growth proves that the XRP ledger remains one of the most resilient and widely distributed networks in crypto. However, a growing user base is a lagging indicator of network health, not a guarantee of immediate price pumps.
For XRP to reverse its 17% monthly slide and catch up to its network growth, it will need a combination of broader macroeconomic relief, a return of high-volume retail trading, and a sustained break above immediate technical resistance levels. Until then, the ledger will keep growing, even if the price has to wait.
#BinancePick #EarningsSeason #BitcoinSurpasses$82K #Write2Earn $XRP
{future}(XRPUSDT)
XRP Wallets Hit a Record 8.24 Million, So Why Is the Price Still Sliding?
The Ripple ledger is experiencing an unprecedented surge in network adoption, yet the token's price remains stuck in a persistent downtrend. According to recent data from blockchain analytics firm Santiment, XRP has reached a historic milestone of 8.24 million non-empty wallets.
Despite this massive influx of address growth, the token has shed 17.21% of its value over the past month, slipping down to the $1.31 level.
This stark divergence between network growth and price action has left many investors scratching their heads. If more people are holding XRP than ever before, why is the price still sliding?
1. The "Dust Account" Dilution Effect
A primary reason for the mismatch between wallet growth and price appreciation is the nature of the addresses being created. A sharp rise in non-empty wallets does not automatically equal fresh, institutional capital entering the market. Many of these new accounts are retail users holding small fractions of XRP, often referred to as "dust." While the absolute number of holders looks impressive on a chart, the actual buying volume generated by these addresses is insufficient to absorb structural sell walls.
2. General Crypto Market De-risking
XRP does not trade in a vacuum. The broader digital asset market has faced significant headwinds recently, largely driven by macroeconomic shifts and tech-sector liquidations on Wall Street. As capital rotates out of riskier altcoins and moves toward cash or Bitcoin dominance (which recently hovered near 58%), XRP has suffered from a lack of independent upward momentum. When the tides of the overall market recede, even networks with strong fundamentals get dragged down.
3. Supply Inflation and Escrow Releases
Price is fundamentally governed by supply and demand. Even as demand grows via new wallet creation, Ripple’s predictable monthly escrow releases continue to introduce hundreds of millions of tokens into the circulating supply. When these massive unlocks coincide with periods of low market liquidity, they create a natural ceiling for price growth, requiring immense buying pressure just to maintain a flat baseline.
4. Speculative Fatigue vs. Real Utility
While enterprise adoption is steadily climbing—highlighted by major institutions expanding tokenized fund pilots across public ledgers—retail speculation still dictates short-term price movements. Many long-term holders have grown fatigued by prolonged consolidation phases, leading to localized distribution (selling) that counteracts the accumulation seen from new, smaller market entrants.
The Bottom Line
Record-breaking wallet growth proves that the XRP ledger remains one of the most resilient and widely distributed networks in crypto. However, a growing user base is a lagging indicator of network health, not a guarantee of immediate price pumps.
For XRP to reverse its 17% monthly slide and catch up to its network growth, it will need a combination of broader macroeconomic relief, a return of high-volume retail trading, and a sustained break above immediate technical resistance levels. Until then, the ledger will keep growing, even if the price has to wait.
#BinancePick #EarningsSeason #BitcoinSurpasses$82K #Write2Earn $XRP
Despite this massive influx of address growth, the token has shed 17.21% of its value over the past month, slipping down to the $1.31 level.
This stark divergence between network growth and price action has left many investors scratching their heads. If more people are holding XRP than ever before, why is the price still sliding?
1. The "Dust Account" Dilution Effect
A primary reason for the mismatch between wallet growth and price appreciation is the nature of the addresses being created. A sharp rise in non-empty wallets does not automatically equal fresh, institutional capital entering the market. Many of these new accounts are retail users holding small fractions of XRP, often referred to as "dust." While the absolute number of holders looks impressive on a chart, the actual buying volume generated by these addresses is insufficient to absorb structural sell walls.
2. General Crypto Market De-risking
XRP does not trade in a vacuum. The broader digital asset market has faced significant headwinds recently, largely driven by macroeconomic shifts and tech-sector liquidations on Wall Street. As capital rotates out of riskier altcoins and moves toward cash or Bitcoin dominance (which recently hovered near 58%), XRP has suffered from a lack of independent upward momentum. When the tides of the overall market recede, even networks with strong fundamentals get dragged down.
3. Supply Inflation and Escrow Releases
Price is fundamentally governed by supply and demand. Even as demand grows via new wallet creation, Ripple’s predictable monthly escrow releases continue to introduce hundreds of millions of tokens into the circulating supply. When these massive unlocks coincide with periods of low market liquidity, they create a natural ceiling for price growth, requiring immense buying pressure just to maintain a flat baseline.
4. Speculative Fatigue vs. Real Utility
While enterprise adoption is steadily climbing—highlighted by major institutions expanding tokenized fund pilots across public ledgers—retail speculation still dictates short-term price movements. Many long-term holders have grown fatigued by prolonged consolidation phases, leading to localized distribution (selling) that counteracts the accumulation seen from new, smaller market entrants.
The Bottom Line
Record-breaking wallet growth proves that the XRP ledger remains one of the most resilient and widely distributed networks in crypto. However, a growing user base is a lagging indicator of network health, not a guarantee of immediate price pumps.
For XRP to reverse its 17% monthly slide and catch up to its network growth, it will need a combination of broader macroeconomic relief, a return of high-volume retail trading, and a sustained break above immediate technical resistance levels. Until then, the ledger will keep growing, even if the price has to wait.
#BinancePick #EarningsSeason #BitcoinSurpasses$82K #Write2Earn $XRP
1
1.3k

Article
Bitcoin Price Erases Two-Day Gains After $85,000 Rejection: Will It Fall to $80,000?The cryptocurrency market faced a sharp reality check as Bitcoin (BTC) erased its entire two-day winning streak, sliding roughly 4% from local highs to hit an intraday low of $81,652. This sudden downturn follows a stiff rejection near the highly anticipated $85,000 psychological threshold, leaving traders wondering if a deeper correction toward $80,000 is inevitable.
Here is a deep dive into the technical levels, on-chain metrics, and market dynamics dictating Bitcoin’s next move.
The Catalyst: Rejection at the Gates of $85,000
After staging a robust rally earlier in the week, Bitcoin bulls encountered heavy sell-side liquidity just shy of $85,000, peaking at $84,840. The inability to clear this overhead resistance triggered a cascading liquidation event, wiping out over $431 million in leveraged positions network-wide.
Macroeconomic headwinds also played a major role. Hotter-than-expected inflation data pushed the U.S. Dollar Index (DXY) and Treasury yields higher, dampening investor appetite for risk assets and stalling institutional inflows into Spot Bitcoin ETFs.
Why a Drop to $80,000 is on the Table
Several structural indicators suggest that Bitcoin could test the $80,000 mark before finding a permanent bottom:
Institutional Profitability Line: According to on-chain data, corporate Bitcoin treasuries hold a collective average cost basis right at $80,000. Breaking below this critical psych level would push major corporate holders into net-unrealized losses, potentially sparking defensive risk-management selling.Draining Liquidity Footprint: Stablecoin reserves across major exchanges have plunged to a one-year low. This reduction in stablecoin supply indicates a lack of immediate buying power (dry powder) sitting on the sidelines to aggressively buy the dip.Slowing Corporate Demand: Corporate treasury accumulation has slowed down significantly compared to the high-velocity buying cycles observed in previous quarters, leaving the market highly dependent on retail spot absorption.
Critical Technical Support Levels to Watch
As volatility spikes, Bitcoin is currently battling within a very tight technical corridor:
The $81,500 Support Cluster: On the 4-hour chart, an ascending trendline stretching back to mid-October intersects directly around the $81,500 swing low. A daily candle close below this cluster confirms a short-term bearish breakdown.The 50-Day Moving Average: Bitcoin is actively testing its 50-day moving average at $81,835. As long as BTC holds above this indicator on a weekly closing basis, the overarching macro structure remains cautiously bullish.
The Outlook
If bulls fail to hold the $81,500 line, a swift retest of the $80,000 support level is highly probable. A catastrophic breach of $80,000 would open the door for a deeper correction toward the weekly order block between $73,000 and $75,000.
DYOR. NFA
#Write2Earn #EarningsSeason #btc
Bitcoin Price Erases Two-Day Gains After $85,000 Rejection: Will It Fall to $80,000?
The cryptocurrency market faced a sharp reality check as Bitcoin (BTC) erased its entire two-day winning streak, sliding roughly 4% from local highs to hit an intraday low of $81,652. This sudden downturn follows a stiff rejection near the highly anticipated $85,000 psychological threshold, leaving traders wondering if a deeper correction toward $80,000 is inevitable.
Here is a deep dive into the technical levels, on-chain metrics, and market dynamics dictating Bitcoin’s next move.
The Catalyst: Rejection at the Gates of $85,000
After staging a robust rally earlier in the week, Bitcoin bulls encountered heavy sell-side liquidity just shy of $85,000, peaking at $84,840. The inability to clear this overhead resistance triggered a cascading liquidation event, wiping out over $431 million in leveraged positions network-wide.
Macroeconomic headwinds also played a major role. Hotter-than-expected inflation data pushed the U.S. Dollar Index (DXY) and Treasury yields higher, dampening investor appetite for risk assets and stalling institutional inflows into Spot Bitcoin ETFs.
Why a Drop to $80,000 is on the Table
Several structural indicators suggest that Bitcoin could test the $80,000 mark before finding a permanent bottom:
Institutional Profitability Line: According to on-chain data, corporate Bitcoin treasuries hold a collective average cost basis right at $80,000. Breaking below this critical psych level would push major corporate holders into net-unrealized losses, potentially sparking defensive risk-management selling.Draining Liquidity Footprint: Stablecoin reserves across major exchanges have plunged to a one-year low. This reduction in stablecoin supply indicates a lack of immediate buying power (dry powder) sitting on the sidelines to aggressively buy the dip.Slowing Corporate Demand: Corporate treasury accumulation has slowed down significantly compared to the high-velocity buying cycles observed in previous quarters, leaving the market highly dependent on retail spot absorption.
Critical Technical Support Levels to Watch
As volatility spikes, Bitcoin is currently battling within a very tight technical corridor:
The $81,500 Support Cluster: On the 4-hour chart, an ascending trendline stretching back to mid-October intersects directly around the $81,500 swing low. A daily candle close below this cluster confirms a short-term bearish breakdown.The 50-Day Moving Average: Bitcoin is actively testing its 50-day moving average at $81,835. As long as BTC holds above this indicator on a weekly closing basis, the overarching macro structure remains cautiously bullish.
The Outlook
If bulls fail to hold the $81,500 line, a swift retest of the $80,000 support level is highly probable. A catastrophic breach of $80,000 would open the door for a deeper correction toward the weekly order block between $73,000 and $75,000.
DYOR. NFA
#Write2Earn #EarningsSeason #btc
Here is a deep dive into the technical levels, on-chain metrics, and market dynamics dictating Bitcoin’s next move.
The Catalyst: Rejection at the Gates of $85,000
After staging a robust rally earlier in the week, Bitcoin bulls encountered heavy sell-side liquidity just shy of $85,000, peaking at $84,840. The inability to clear this overhead resistance triggered a cascading liquidation event, wiping out over $431 million in leveraged positions network-wide.
Macroeconomic headwinds also played a major role. Hotter-than-expected inflation data pushed the U.S. Dollar Index (DXY) and Treasury yields higher, dampening investor appetite for risk assets and stalling institutional inflows into Spot Bitcoin ETFs.
Why a Drop to $80,000 is on the Table
Several structural indicators suggest that Bitcoin could test the $80,000 mark before finding a permanent bottom:
Institutional Profitability Line: According to on-chain data, corporate Bitcoin treasuries hold a collective average cost basis right at $80,000. Breaking below this critical psych level would push major corporate holders into net-unrealized losses, potentially sparking defensive risk-management selling.Draining Liquidity Footprint: Stablecoin reserves across major exchanges have plunged to a one-year low. This reduction in stablecoin supply indicates a lack of immediate buying power (dry powder) sitting on the sidelines to aggressively buy the dip.Slowing Corporate Demand: Corporate treasury accumulation has slowed down significantly compared to the high-velocity buying cycles observed in previous quarters, leaving the market highly dependent on retail spot absorption.
Critical Technical Support Levels to Watch
As volatility spikes, Bitcoin is currently battling within a very tight technical corridor:
The $81,500 Support Cluster: On the 4-hour chart, an ascending trendline stretching back to mid-October intersects directly around the $81,500 swing low. A daily candle close below this cluster confirms a short-term bearish breakdown.The 50-Day Moving Average: Bitcoin is actively testing its 50-day moving average at $81,835. As long as BTC holds above this indicator on a weekly closing basis, the overarching macro structure remains cautiously bullish.
The Outlook
If bulls fail to hold the $81,500 line, a swift retest of the $80,000 support level is highly probable. A catastrophic breach of $80,000 would open the door for a deeper correction toward the weekly order block between $73,000 and $75,000.
DYOR. NFA
#Write2Earn #EarningsSeason #btc
1
228

Article
Crypto Long & Short: Why Real-World Assets Need Fixed-Rate Loans OnchainThe buzz around Real-World Assets (RWAs) in DeFi is real, with everyone talking about bringing institutional trillions onchain. By tokenizing real estate, private credit, and trade finance, Web3 can tap into massive, battle-tested markets.
But let's be honest: there is a massive roadblock keeping traditional businesses from actually scaling onchain—crazy interest rate volatility.
If we want to bridge TradFi and DeFi, we need a foundational pillar of traditional credit markets: fixed-rate loans.
The Trap: Why Variable Rates Don't Work for Real Businesses
Most DeFi lending protocols rely on variable-rate models driven by utilization pools. Demand goes up? Borrowing rates skyrocket. Demand drops? Rates plunge.
This works fine for crypto degens and hedge funds chasing quick leverage, but it’s a nightmare for real-world businesses:
Zero Budgeting Control: You can't run a real business financing a construction project or an export shipment when your capital costs swing from 4% to 25% in a matter of weeks.The Yield Mismatch: Real-world projects yield predictable, fixed returns. Matching a fixed-yield asset with a highly volatile variable-rate loan is a recipe for disaster.CFOs Will Say No: Chief Financial Officers demand predictability. If they can’t lock in a multi-month cost of capital, they will stay far away from Web3.
The Fix: Enter Fixed-Rate Lending
By bringing fixed-rate protocols into the RWA space, DeFi unlocks the missing puzzle pieces:
True Financial Planning: Fixed-rate loans let enterprises forecast expenses with 100% accuracy. Knowing the exact cost of capital over a 180 or 360-day term keeps profit margins safe.Predictable Yields for Lenders: Institutional investors and DAOs managing treasuries want steady, predictable income. Fixed-rate RWA pools offer a reliable alternative to volatile yield-farming, acting as a safe haven during market downturns.Better Capital Efficiency: Because fixed-rate terms are locked upfront, protocols can build more precise risk models. This opens the door to structured, under-collateralized lending for verified institutional players.
The Bottom Line
For RWAs to mature, putting a property deed or a bond on the blockchain isn't enough. The credit markets supporting them have to step up.
Once businesses can lock in predictable, fixed-rate loans onchain, the migration of traditional debt to Web3 will move from a nice theory to an absolute operational reality.
What’s your take? Will fixed-rate lending finally bring the big traditional players onchain, or is DeFi liquidity too volatile to support it?
#RWA #DeFi #Web3 #TradFi
Crypto Long & Short: Why Real-World Assets Need Fixed-Rate Loans Onchain
The buzz around Real-World Assets (RWAs) in DeFi is real, with everyone talking about bringing institutional trillions onchain. By tokenizing real estate, private credit, and trade finance, Web3 can tap into massive, battle-tested markets.
But let's be honest: there is a massive roadblock keeping traditional businesses from actually scaling onchain—crazy interest rate volatility.
If we want to bridge TradFi and DeFi, we need a foundational pillar of traditional credit markets: fixed-rate loans.
The Trap: Why Variable Rates Don't Work for Real Businesses
Most DeFi lending protocols rely on variable-rate models driven by utilization pools. Demand goes up? Borrowing rates skyrocket. Demand drops? Rates plunge.
This works fine for crypto degens and hedge funds chasing quick leverage, but it’s a nightmare for real-world businesses:
Zero Budgeting Control: You can't run a real business financing a construction project or an export shipment when your capital costs swing from 4% to 25% in a matter of weeks.The Yield Mismatch: Real-world projects yield predictable, fixed returns. Matching a fixed-yield asset with a highly volatile variable-rate loan is a recipe for disaster.CFOs Will Say No: Chief Financial Officers demand predictability. If they can’t lock in a multi-month cost of capital, they will stay far away from Web3.
The Fix: Enter Fixed-Rate Lending
By bringing fixed-rate protocols into the RWA space, DeFi unlocks the missing puzzle pieces:
True Financial Planning: Fixed-rate loans let enterprises forecast expenses with 100% accuracy. Knowing the exact cost of capital over a 180 or 360-day term keeps profit margins safe.Predictable Yields for Lenders: Institutional investors and DAOs managing treasuries want steady, predictable income. Fixed-rate RWA pools offer a reliable alternative to volatile yield-farming, acting as a safe haven during market downturns.Better Capital Efficiency: Because fixed-rate terms are locked upfront, protocols can build more precise risk models. This opens the door to structured, under-collateralized lending for verified institutional players.
The Bottom Line
For RWAs to mature, putting a property deed or a bond on the blockchain isn't enough. The credit markets supporting them have to step up.
Once businesses can lock in predictable, fixed-rate loans onchain, the migration of traditional debt to Web3 will move from a nice theory to an absolute operational reality.
What’s your take? Will fixed-rate lending finally bring the big traditional players onchain, or is DeFi liquidity too volatile to support it?
#RWA #DeFi #Web3 #TradFi
But let's be honest: there is a massive roadblock keeping traditional businesses from actually scaling onchain—crazy interest rate volatility.
If we want to bridge TradFi and DeFi, we need a foundational pillar of traditional credit markets: fixed-rate loans.
The Trap: Why Variable Rates Don't Work for Real Businesses
Most DeFi lending protocols rely on variable-rate models driven by utilization pools. Demand goes up? Borrowing rates skyrocket. Demand drops? Rates plunge.
This works fine for crypto degens and hedge funds chasing quick leverage, but it’s a nightmare for real-world businesses:
Zero Budgeting Control: You can't run a real business financing a construction project or an export shipment when your capital costs swing from 4% to 25% in a matter of weeks.The Yield Mismatch: Real-world projects yield predictable, fixed returns. Matching a fixed-yield asset with a highly volatile variable-rate loan is a recipe for disaster.CFOs Will Say No: Chief Financial Officers demand predictability. If they can’t lock in a multi-month cost of capital, they will stay far away from Web3.
The Fix: Enter Fixed-Rate Lending
By bringing fixed-rate protocols into the RWA space, DeFi unlocks the missing puzzle pieces:
True Financial Planning: Fixed-rate loans let enterprises forecast expenses with 100% accuracy. Knowing the exact cost of capital over a 180 or 360-day term keeps profit margins safe.Predictable Yields for Lenders: Institutional investors and DAOs managing treasuries want steady, predictable income. Fixed-rate RWA pools offer a reliable alternative to volatile yield-farming, acting as a safe haven during market downturns.Better Capital Efficiency: Because fixed-rate terms are locked upfront, protocols can build more precise risk models. This opens the door to structured, under-collateralized lending for verified institutional players.
The Bottom Line
For RWAs to mature, putting a property deed or a bond on the blockchain isn't enough. The credit markets supporting them have to step up.
Once businesses can lock in predictable, fixed-rate loans onchain, the migration of traditional debt to Web3 will move from a nice theory to an absolute operational reality.
What’s your take? Will fixed-rate lending finally bring the big traditional players onchain, or is DeFi liquidity too volatile to support it?
#RWA #DeFi #Web3 #TradFi
304
Article
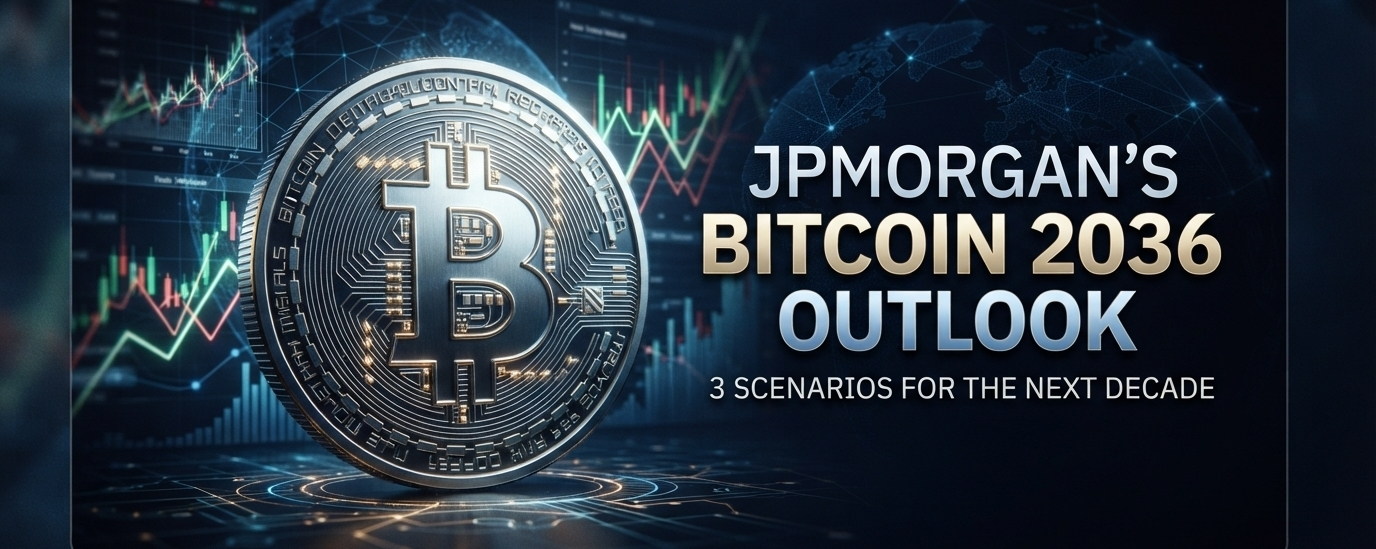
🚨 JPMorgan Outlines 3 Bold Bitcoin Price Scenarios for 2036: Will It Outperform Gold?A striking new projection from JPMorgan Asset Management has caught the financial world's attention. The banking giant suggests that Bitcoin (BTC) could potentially outperform both US stocks and gold over the next decade.
As institutional adoption accelerates and macro landscapes shift, JPMorgan analysts have mapped out three distinct paths for Bitcoin’s valuation by the year 2036. Here is a breakdown of what the future might hold for the world’s leading digital asset.
1. The Bearish Reality: Regulatory & Macro Headwinds
In the most conservative scenario, Bitcoin faces stringent global regulatory frameworks, localized crackdowns on proof-of-work mining, and sustained high-interest-rate environments.
The Outcome: Growth slows down dramatically. Bitcoin remains a highly speculative niche asset rather than a global reserve. Under this lens, traditional equities and gold maintain their historical dominance, while BTC struggles to break past its structural resistance levels.
2. The Base Case: Steady Institutional Integration
JPMorgan’s baseline scenario assumes that current trends continue smoothly. Spot ETFs see steady, predictable inflows, and sovereign wealth funds gradually allocate 1% to 3% of their portfolios to digital assets.
The Outcome: Bitcoin establishes itself firmly as "Digital Gold." It matches or slightly beats the performance of the S&P 500 over the 10-year horizon. Volatility dampens, turning BTC into a mature, widely accepted macroeconomic hedge against fiat inflation.
3. The Bullish Supercycle: Hyper-Bitcoinization
The most optimistic scenario relies on Bitcoin completely disrupting traditional asset classes. In this future, global central banks begin holding BTC on their balance sheets, and hyper-inflationary pressures in developing fiat economies drive mass retail migration to decentralized networks.
The Outcome: Bitcoin massively outperforms both US stocks and gold. As its market cap aggressively chases the multi-trillion-dollar valuation of physical gold, BTC achieves unprecedented price milestones, cementing its status as the ultimate global store of value.
The Bottom Line for Crypto Investors
JPMorgan's projection underscores a massive shift in Wall Street's sentiment. An asset once dismissed by major banks is now being directly compared to—and projected to potentially beat—the bedrock of traditional finance: gold and American equities.
While the 2036 timeline leaves plenty of room for short-term volatility and cyclical bear markets, the long-term structural outlook remains highly compelling for patient holders.
What is your take on JPMorgan's 2036 outlook? Which scenario do you think is most likely to play out?
Disclaimer: This post is for informational and educational purposes only and does not constitute financial advice.
#Bitcoin #BTC #JPMorgan #CryptoNews #CryptoMarket
🚨 JPMorgan Outlines 3 Bold Bitcoin Price Scenarios for 2036: Will It Outperform Gold?
A striking new projection from JPMorgan Asset Management has caught the financial world's attention. The banking giant suggests that Bitcoin (BTC) could potentially outperform both US stocks and gold over the next decade.
As institutional adoption accelerates and macro landscapes shift, JPMorgan analysts have mapped out three distinct paths for Bitcoin’s valuation by the year 2036. Here is a breakdown of what the future might hold for the world’s leading digital asset.
1. The Bearish Reality: Regulatory & Macro Headwinds
In the most conservative scenario, Bitcoin faces stringent global regulatory frameworks, localized crackdowns on proof-of-work mining, and sustained high-interest-rate environments.
The Outcome: Growth slows down dramatically. Bitcoin remains a highly speculative niche asset rather than a global reserve. Under this lens, traditional equities and gold maintain their historical dominance, while BTC struggles to break past its structural resistance levels.
2. The Base Case: Steady Institutional Integration
JPMorgan’s baseline scenario assumes that current trends continue smoothly. Spot ETFs see steady, predictable inflows, and sovereign wealth funds gradually allocate 1% to 3% of their portfolios to digital assets.
The Outcome: Bitcoin establishes itself firmly as "Digital Gold." It matches or slightly beats the performance of the S&P 500 over the 10-year horizon. Volatility dampens, turning BTC into a mature, widely accepted macroeconomic hedge against fiat inflation.
3. The Bullish Supercycle: Hyper-Bitcoinization
The most optimistic scenario relies on Bitcoin completely disrupting traditional asset classes. In this future, global central banks begin holding BTC on their balance sheets, and hyper-inflationary pressures in developing fiat economies drive mass retail migration to decentralized networks.
The Outcome: Bitcoin massively outperforms both US stocks and gold. As its market cap aggressively chases the multi-trillion-dollar valuation of physical gold, BTC achieves unprecedented price milestones, cementing its status as the ultimate global store of value.
The Bottom Line for Crypto Investors
JPMorgan's projection underscores a massive shift in Wall Street's sentiment. An asset once dismissed by major banks is now being directly compared to—and projected to potentially beat—the bedrock of traditional finance: gold and American equities.
While the 2036 timeline leaves plenty of room for short-term volatility and cyclical bear markets, the long-term structural outlook remains highly compelling for patient holders.
What is your take on JPMorgan's 2036 outlook? Which scenario do you think is most likely to play out?
Disclaimer: This post is for informational and educational purposes only and does not constitute financial advice.
#Bitcoin #BTC #JPMorgan #CryptoNews #CryptoMarket
As institutional adoption accelerates and macro landscapes shift, JPMorgan analysts have mapped out three distinct paths for Bitcoin’s valuation by the year 2036. Here is a breakdown of what the future might hold for the world’s leading digital asset.
1. The Bearish Reality: Regulatory & Macro Headwinds
In the most conservative scenario, Bitcoin faces stringent global regulatory frameworks, localized crackdowns on proof-of-work mining, and sustained high-interest-rate environments.
The Outcome: Growth slows down dramatically. Bitcoin remains a highly speculative niche asset rather than a global reserve. Under this lens, traditional equities and gold maintain their historical dominance, while BTC struggles to break past its structural resistance levels.
2. The Base Case: Steady Institutional Integration
JPMorgan’s baseline scenario assumes that current trends continue smoothly. Spot ETFs see steady, predictable inflows, and sovereign wealth funds gradually allocate 1% to 3% of their portfolios to digital assets.
The Outcome: Bitcoin establishes itself firmly as "Digital Gold." It matches or slightly beats the performance of the S&P 500 over the 10-year horizon. Volatility dampens, turning BTC into a mature, widely accepted macroeconomic hedge against fiat inflation.
3. The Bullish Supercycle: Hyper-Bitcoinization
The most optimistic scenario relies on Bitcoin completely disrupting traditional asset classes. In this future, global central banks begin holding BTC on their balance sheets, and hyper-inflationary pressures in developing fiat economies drive mass retail migration to decentralized networks.
The Outcome: Bitcoin massively outperforms both US stocks and gold. As its market cap aggressively chases the multi-trillion-dollar valuation of physical gold, BTC achieves unprecedented price milestones, cementing its status as the ultimate global store of value.
The Bottom Line for Crypto Investors
JPMorgan's projection underscores a massive shift in Wall Street's sentiment. An asset once dismissed by major banks is now being directly compared to—and projected to potentially beat—the bedrock of traditional finance: gold and American equities.
While the 2036 timeline leaves plenty of room for short-term volatility and cyclical bear markets, the long-term structural outlook remains highly compelling for patient holders.
What is your take on JPMorgan's 2036 outlook? Which scenario do you think is most likely to play out?
Disclaimer: This post is for informational and educational purposes only and does not constitute financial advice.
#Bitcoin #BTC #JPMorgan #CryptoNews #CryptoMarket
247
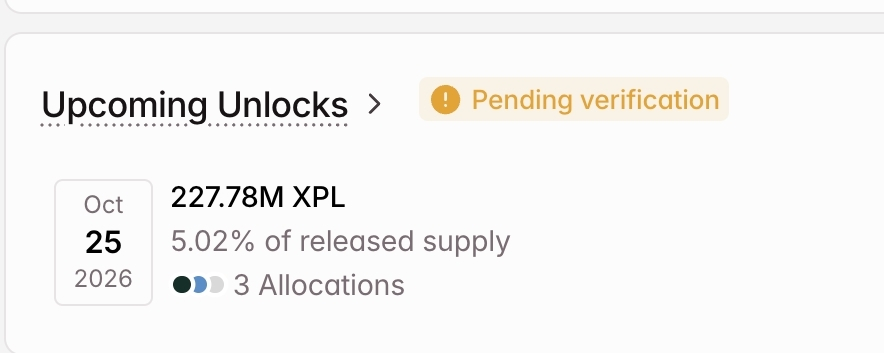
Article
Supply Shock Alert: 3 Massive Token Unlocks to Watch This WeekThe crypto market is bracing for a heavy influx of liquidity during the fourth week of October 2026. Across the broader market, scheduled token unlocks are projected to flood the space with more than $793.6 million in newly available supply.
For smart traders, massive unlocks represent a double-edged sword: they can trigger localized panic and sell-offs, or they can present the perfect "buy the dip" opportunity once the initial supply is absorbed.
If you are trading LayerZero (ZRO), Plasma (XPL), or Humanity (H), here are the critical dates, token distributions, and potential market impacts you need to keep on your radar this week.
1. LayerZero (ZRO) — October 20
Unlock Value: ~$43.54 MillionTokens Released: 23.28 Million ZROPercentage of Circulating Supply: 3.83%
As a leading interoperability protocol facilitating seamless cross-chain communication, LayerZero's upcoming release is the largest single-day dollar value event among the three. The distribution will allocate 10.99 million tokens to strategic partners, 10.63 million to core contributors, and 1.67 million toward team-repurchased tokens.
Market Outlook: Because a significant portion goes directly to core contributors and insiders, the short-term price action will heavily depend on whether these entities decide to monetize immediately or hold for the long haul. Keep a close eye on ZRO's 24-hour trading volume; if the volume begins to taper off while supply enters the market, expect localized sell pressure.
2. Plasma (XPL) — October 25
Unlock Value: ~$17.50 MillionTokens Released: 227.78 Million XPLPercentage of Circulating Supply: 5.02%
Plasma, the specialized Layer 1 blockchain optimized for zero-fee stablecoin transactions and confidential payments, is entering its next supply expansion phase. The upcoming unlock will direct 88.89 million XPL to ecosystem growth, while investors and the core team will split the remainder by receiving 69.44 million tokens each.
Market Outlook: While XPL has seen decent tailwinds recently due to its integration milestones—such as native payment tracking and high-profile stablecoin payout use cases—this release still expands the liquid float by over 5%. The asset has experienced front-running sell pressure ahead of the date, meaning much of the dilution risk might already be priced in.
3. Humanity (H) — October 25
Unlock Value: ~$15.30 MillionTokens Released: 266.47 Million HPercentage of Circulating Supply: 6.84%
Humanity Protocol utilizes unique biometric palm recognition alongside zero-knowledge proofs to build decentralized identity infrastructure. This unlock represents the largest percentage increase in circulating supply among the three primary projects. The supply will split six ways, heavily favoring early contributors (79.17 million H) and investors (55.56 million H). The rest will fund identity verification rewards, the ecosystem pot, and the treasury.
Market Outlook: A 6.84% supply expansion concentrated heavily around early backers and contributors introduces significant sell-side risk. Watch the order books carefully around October 25; a sharp drop in liquidity could result in higher volatility if early investors choose to take profits.
Pro-Trader Takeaway
Token unlocks are structurally bearish in the short term due to the sudden increase in floating supply, but they also act as a vital health check for a project’s community conviction. If a token manages to hold its key support levels during a massive unlock event, it signals intense buyer demand and long-term accumulation interest.
Always cross-reference these schedules with active decentralized exchange (DEX) liquidity and incoming exchange inflows to spot where the whales are moving their newly unlocked bags.
Disclaimer: Token unlock schedules can be adjusted by project foundations, and exact distribution values fluctuate based on real-time market prices. Always manage your risk.
What are your thoughts on this week's unlocks? Are you planning to de-risk your positions, or are you looking to buy the volatility? Let me know in the comments below!
#Write2Earn #H #zro
Supply Shock Alert: 3 Massive Token Unlocks to Watch This Week
The crypto market is bracing for a heavy influx of liquidity during the fourth week of October 2026. Across the broader market, scheduled token unlocks are projected to flood the space with more than $793.6 million in newly available supply.
For smart traders, massive unlocks represent a double-edged sword: they can trigger localized panic and sell-offs, or they can present the perfect "buy the dip" opportunity once the initial supply is absorbed.
If you are trading LayerZero (ZRO), Plasma (XPL), or Humanity (H), here are the critical dates, token distributions, and potential market impacts you need to keep on your radar this week.
1. LayerZero (ZRO) — October 20
Unlock Value: ~$43.54 MillionTokens Released: 23.28 Million ZROPercentage of Circulating Supply: 3.83%
As a leading interoperability protocol facilitating seamless cross-chain communication, LayerZero's upcoming release is the largest single-day dollar value event among the three. The distribution will allocate 10.99 million tokens to strategic partners, 10.63 million to core contributors, and 1.67 million toward team-repurchased tokens.
Market Outlook: Because a significant portion goes directly to core contributors and insiders, the short-term price action will heavily depend on whether these entities decide to monetize immediately or hold for the long haul. Keep a close eye on ZRO's 24-hour trading volume; if the volume begins to taper off while supply enters the market, expect localized sell pressure.
2. Plasma (XPL) — October 25
Unlock Value: ~$17.50 MillionTokens Released: 227.78 Million XPLPercentage of Circulating Supply: 5.02%
Plasma, the specialized Layer 1 blockchain optimized for zero-fee stablecoin transactions and confidential payments, is entering its next supply expansion phase. The upcoming unlock will direct 88.89 million XPL to ecosystem growth, while investors and the core team will split the remainder by receiving 69.44 million tokens each.
Market Outlook: While XPL has seen decent tailwinds recently due to its integration milestones—such as native payment tracking and high-profile stablecoin payout use cases—this release still expands the liquid float by over 5%. The asset has experienced front-running sell pressure ahead of the date, meaning much of the dilution risk might already be priced in.
3. Humanity (H) — October 25
Unlock Value: ~$15.30 MillionTokens Released: 266.47 Million HPercentage of Circulating Supply: 6.84%
Humanity Protocol utilizes unique biometric palm recognition alongside zero-knowledge proofs to build decentralized identity infrastructure. This unlock represents the largest percentage increase in circulating supply among the three primary projects. The supply will split six ways, heavily favoring early contributors (79.17 million H) and investors (55.56 million H). The rest will fund identity verification rewards, the ecosystem pot, and the treasury.
Market Outlook: A 6.84% supply expansion concentrated heavily around early backers and contributors introduces significant sell-side risk. Watch the order books carefully around October 25; a sharp drop in liquidity could result in higher volatility if early investors choose to take profits.
Pro-Trader Takeaway
Token unlocks are structurally bearish in the short term due to the sudden increase in floating supply, but they also act as a vital health check for a project’s community conviction. If a token manages to hold its key support levels during a massive unlock event, it signals intense buyer demand and long-term accumulation interest.
Always cross-reference these schedules with active decentralized exchange (DEX) liquidity and incoming exchange inflows to spot where the whales are moving their newly unlocked bags.
Disclaimer: Token unlock schedules can be adjusted by project foundations, and exact distribution values fluctuate based on real-time market prices. Always manage your risk.
What are your thoughts on this week's unlocks? Are you planning to de-risk your positions, or are you looking to buy the volatility? Let me know in the comments below!
#Write2Earn #H #zro
For smart traders, massive unlocks represent a double-edged sword: they can trigger localized panic and sell-offs, or they can present the perfect "buy the dip" opportunity once the initial supply is absorbed.
If you are trading LayerZero (ZRO), Plasma (XPL), or Humanity (H), here are the critical dates, token distributions, and potential market impacts you need to keep on your radar this week.
1. LayerZero (ZRO) — October 20
Unlock Value: ~$43.54 MillionTokens Released: 23.28 Million ZROPercentage of Circulating Supply: 3.83%
As a leading interoperability protocol facilitating seamless cross-chain communication, LayerZero's upcoming release is the largest single-day dollar value event among the three. The distribution will allocate 10.99 million tokens to strategic partners, 10.63 million to core contributors, and 1.67 million toward team-repurchased tokens.
Market Outlook: Because a significant portion goes directly to core contributors and insiders, the short-term price action will heavily depend on whether these entities decide to monetize immediately or hold for the long haul. Keep a close eye on ZRO's 24-hour trading volume; if the volume begins to taper off while supply enters the market, expect localized sell pressure.
2. Plasma (XPL) — October 25
Unlock Value: ~$17.50 MillionTokens Released: 227.78 Million XPLPercentage of Circulating Supply: 5.02%
Plasma, the specialized Layer 1 blockchain optimized for zero-fee stablecoin transactions and confidential payments, is entering its next supply expansion phase. The upcoming unlock will direct 88.89 million XPL to ecosystem growth, while investors and the core team will split the remainder by receiving 69.44 million tokens each.
Market Outlook: While XPL has seen decent tailwinds recently due to its integration milestones—such as native payment tracking and high-profile stablecoin payout use cases—this release still expands the liquid float by over 5%. The asset has experienced front-running sell pressure ahead of the date, meaning much of the dilution risk might already be priced in.
3. Humanity (H) — October 25
Unlock Value: ~$15.30 MillionTokens Released: 266.47 Million HPercentage of Circulating Supply: 6.84%
Humanity Protocol utilizes unique biometric palm recognition alongside zero-knowledge proofs to build decentralized identity infrastructure. This unlock represents the largest percentage increase in circulating supply among the three primary projects. The supply will split six ways, heavily favoring early contributors (79.17 million H) and investors (55.56 million H). The rest will fund identity verification rewards, the ecosystem pot, and the treasury.
Market Outlook: A 6.84% supply expansion concentrated heavily around early backers and contributors introduces significant sell-side risk. Watch the order books carefully around October 25; a sharp drop in liquidity could result in higher volatility if early investors choose to take profits.
Pro-Trader Takeaway
Token unlocks are structurally bearish in the short term due to the sudden increase in floating supply, but they also act as a vital health check for a project’s community conviction. If a token manages to hold its key support levels during a massive unlock event, it signals intense buyer demand and long-term accumulation interest.
Always cross-reference these schedules with active decentralized exchange (DEX) liquidity and incoming exchange inflows to spot where the whales are moving their newly unlocked bags.
Disclaimer: Token unlock schedules can be adjusted by project foundations, and exact distribution values fluctuate based on real-time market prices. Always manage your risk.
What are your thoughts on this week's unlocks? Are you planning to de-risk your positions, or are you looking to buy the volatility? Let me know in the comments below!
#Write2Earn #H #zro
2
902
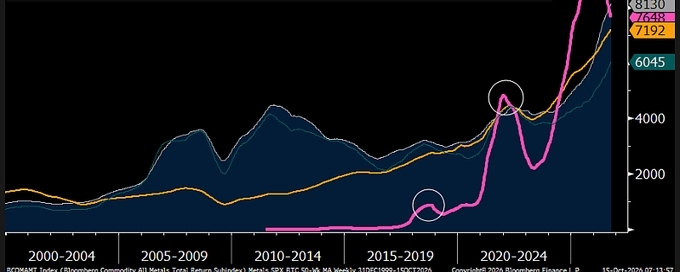
Article
🚨 Will Bitcoin Crash to $10,000? Evaluating Bloomberg’s Grim Macro WarningA stark forecast from Bloomberg Intelligence senior commodity strategist Mike McGlone has reignited intense debate across the cryptocurrency market. McGlone warned that Bitcoin (BTC) could plummet toward the $10,000 level if United States stock indexes experience a severe 20% correction.
While Bitcoin has solidified its position as a major institutional asset class, this projection serves as a sobering reminder of the deep liquidity ties connecting crypto markets to traditional finance.
The Macro Link: Why $10,000 is on the Radar
The core of the bearish thesis relies heavily on macro liquidity and asset correlation:
Equity Market Contagion: A sudden 20% drop in US equities would trigger a massive liquidity squeeze. In high-risk environments, institutional investors historically liquidate volatile assets—including cryptocurrencies—to cover margins and hoard cash.The High-Beta Reality: Despite its "digital gold" narrative, Bitcoin continues to trade as a high-beta risk asset during broader market panics.Historic Precedent: Major stock market drawdowns, such as the 2020 liquidity crunch, have historically dragged the crypto market down in tandem before a decoupling or recovery occurs.
The Counter-Argument: Institutional Floors & ETF Support
While a severe macroeconomic shock could trigger sharp liquidations, many analysts argue that a drop to $10,000 faces massive structural roadblocks:
The ETF Cushion: The introduction of spot Bitcoin ETFs has established a robust institutional floor. Massive capital inflows from traditional finance giants have fundamentally changed the asset's supply dynamics.Long-Term Holder Resilience: On-chain data reveals that the percentage of supply held by long-term entities remains near historic highs, indicating strong conviction that resists panic selling.Production Cost Floor: The underlying cost of mining a single Bitcoin acts as a psychological and economic floor, making a sustained drop to four figures highly unlikely without a total network collapse.
⚖ Final Verdict: Risk Management is Key
McGlone’s warning shouldn't be dismissed as mere bearishness, but rather interpreted as a worst-case macro scenario. If global markets experience a severe systemic shock, crypto will not be immune to the initial damage.
For creators and investors on Binance Square, this serves as an important reminder to look beyond simple crypto charts. Keeping a close eye on broader macroeconomic indicators, interest rates, and Wall Street equity health is vital for navigating the next phase of the market cycle.
What do you think? Is a $10,000 Bitcoin completely out of the question, or are we underestimating macro risks?
#Bitcoin #CryptoNews #BinanceSquare #MacroEconomics
🚨 Will Bitcoin Crash to $10,000? Evaluating Bloomberg’s Grim Macro Warning
A stark forecast from Bloomberg Intelligence senior commodity strategist Mike McGlone has reignited intense debate across the cryptocurrency market. McGlone warned that Bitcoin (BTC) could plummet toward the $10,000 level if United States stock indexes experience a severe 20% correction.
While Bitcoin has solidified its position as a major institutional asset class, this projection serves as a sobering reminder of the deep liquidity ties connecting crypto markets to traditional finance.
The Macro Link: Why $10,000 is on the Radar
The core of the bearish thesis relies heavily on macro liquidity and asset correlation:
Equity Market Contagion: A sudden 20% drop in US equities would trigger a massive liquidity squeeze. In high-risk environments, institutional investors historically liquidate volatile assets—including cryptocurrencies—to cover margins and hoard cash.The High-Beta Reality: Despite its "digital gold" narrative, Bitcoin continues to trade as a high-beta risk asset during broader market panics.Historic Precedent: Major stock market drawdowns, such as the 2020 liquidity crunch, have historically dragged the crypto market down in tandem before a decoupling or recovery occurs.
The Counter-Argument: Institutional Floors & ETF Support
While a severe macroeconomic shock could trigger sharp liquidations, many analysts argue that a drop to $10,000 faces massive structural roadblocks:
The ETF Cushion: The introduction of spot Bitcoin ETFs has established a robust institutional floor. Massive capital inflows from traditional finance giants have fundamentally changed the asset's supply dynamics.Long-Term Holder Resilience: On-chain data reveals that the percentage of supply held by long-term entities remains near historic highs, indicating strong conviction that resists panic selling.Production Cost Floor: The underlying cost of mining a single Bitcoin acts as a psychological and economic floor, making a sustained drop to four figures highly unlikely without a total network collapse.
⚖ Final Verdict: Risk Management is Key
McGlone’s warning shouldn't be dismissed as mere bearishness, but rather interpreted as a worst-case macro scenario. If global markets experience a severe systemic shock, crypto will not be immune to the initial damage.
For creators and investors on Binance Square, this serves as an important reminder to look beyond simple crypto charts. Keeping a close eye on broader macroeconomic indicators, interest rates, and Wall Street equity health is vital for navigating the next phase of the market cycle.
What do you think? Is a $10,000 Bitcoin completely out of the question, or are we underestimating macro risks?
#Bitcoin #CryptoNews #BinanceSquare #MacroEconomics
While Bitcoin has solidified its position as a major institutional asset class, this projection serves as a sobering reminder of the deep liquidity ties connecting crypto markets to traditional finance.
The Macro Link: Why $10,000 is on the Radar
The core of the bearish thesis relies heavily on macro liquidity and asset correlation:
Equity Market Contagion: A sudden 20% drop in US equities would trigger a massive liquidity squeeze. In high-risk environments, institutional investors historically liquidate volatile assets—including cryptocurrencies—to cover margins and hoard cash.The High-Beta Reality: Despite its "digital gold" narrative, Bitcoin continues to trade as a high-beta risk asset during broader market panics.Historic Precedent: Major stock market drawdowns, such as the 2020 liquidity crunch, have historically dragged the crypto market down in tandem before a decoupling or recovery occurs.
The Counter-Argument: Institutional Floors & ETF Support
While a severe macroeconomic shock could trigger sharp liquidations, many analysts argue that a drop to $10,000 faces massive structural roadblocks:
The ETF Cushion: The introduction of spot Bitcoin ETFs has established a robust institutional floor. Massive capital inflows from traditional finance giants have fundamentally changed the asset's supply dynamics.Long-Term Holder Resilience: On-chain data reveals that the percentage of supply held by long-term entities remains near historic highs, indicating strong conviction that resists panic selling.Production Cost Floor: The underlying cost of mining a single Bitcoin acts as a psychological and economic floor, making a sustained drop to four figures highly unlikely without a total network collapse.
⚖ Final Verdict: Risk Management is Key
McGlone’s warning shouldn't be dismissed as mere bearishness, but rather interpreted as a worst-case macro scenario. If global markets experience a severe systemic shock, crypto will not be immune to the initial damage.
For creators and investors on Binance Square, this serves as an important reminder to look beyond simple crypto charts. Keeping a close eye on broader macroeconomic indicators, interest rates, and Wall Street equity health is vital for navigating the next phase of the market cycle.
What do you think? Is a $10,000 Bitcoin completely out of the question, or are we underestimating macro risks?
#Bitcoin #CryptoNews #BinanceSquare #MacroEconomics
281
🚨 Is $NIL the Missing Piece for Web3 Privacy & AI? 🌐
Everyone is talking about Zero-Knowledge (ZK) tech, but Nillion ($NIL) is tackling the holy grail of crypto security: Blind Computation
Blockchains are inherently public, which means your trading intents, smart contract strategies, and private data are exposed to MEV bots and front-runners. Nillion fixes this by processing data without ever "seeing" it.
Here is what you need to know about this massive ecosystem push:
Encrypted Markets via Covenants: Nillion's Covenants completely shield advanced order details and proprietary trading strategies, keeping them 100% private during execution while maintaining clean on-chain verification. Say goodbye to structural front-running leaks!
Dusk is Live on Ethereum Mainnet: With Dusk, EVM developers can seamlessly plug into Nillion’s private compute network without rewriting their protocols from scratch.
Decentralized AI Fuel: As AI agents take over Web3, they need private data (like API keys and custom trading algorithms). Nillion provides the necessary secure infrastructure to scale decentralized AI models safely.
The crossover between Privacy DeFi and AI is expanding rapidly. Don't sleep on this narrative! 📈
💬 What do you think? Will Nillion's Covenants finally kill off predatory MEV bots for good?
#NIL #Nillion #PrivacyDeFi
#nil $NIL @nillionnetwork
🚨 Is $NIL the Missing Piece for Web3 Privacy & AI? 🌐
Everyone is talking about Zero-Knowledge (ZK) tech, but Nillion ($NIL ) is tackling the holy grail of crypto security: Blind Computation
Blockchains are inherently public, which means your trading intents, smart contract strategies, and private data are exposed to MEV bots and front-runners. Nillion fixes this by processing data without ever "seeing" it.
Here is what you need to know about this massive ecosystem push:
Encrypted Markets via Covenants: Nillion's Covenants completely shield advanced order details and proprietary trading strategies, keeping them 100% private during execution while maintaining clean on-chain verification. Say goodbye to structural front-running leaks!
Dusk is Live on Ethereum Mainnet: With Dusk, EVM developers can seamlessly plug into Nillion’s private compute network without rewriting their protocols from scratch.
Decentralized AI Fuel: As AI agents take over Web3, they need private data (like API keys and custom trading algorithms). Nillion provides the necessary secure infrastructure to scale decentralized AI models safely.
The crossover between Privacy DeFi and AI is expanding rapidly. Don't sleep on this narrative! 📈
💬 What do you think? Will Nillion's Covenants finally kill off predatory MEV bots for good?
#NIL #Nillion #PrivacyDeFi
#nil $NIL @Nillion
Everyone is talking about Zero-Knowledge (ZK) tech, but Nillion ($NIL ) is tackling the holy grail of crypto security: Blind Computation
Blockchains are inherently public, which means your trading intents, smart contract strategies, and private data are exposed to MEV bots and front-runners. Nillion fixes this by processing data without ever "seeing" it.
Here is what you need to know about this massive ecosystem push:
Encrypted Markets via Covenants: Nillion's Covenants completely shield advanced order details and proprietary trading strategies, keeping them 100% private during execution while maintaining clean on-chain verification. Say goodbye to structural front-running leaks!
Dusk is Live on Ethereum Mainnet: With Dusk, EVM developers can seamlessly plug into Nillion’s private compute network without rewriting their protocols from scratch.
Decentralized AI Fuel: As AI agents take over Web3, they need private data (like API keys and custom trading algorithms). Nillion provides the necessary secure infrastructure to scale decentralized AI models safely.
The crossover between Privacy DeFi and AI is expanding rapidly. Don't sleep on this narrative! 📈
💬 What do you think? Will Nillion's Covenants finally kill off predatory MEV bots for good?
#NIL #Nillion #PrivacyDeFi
#nil $NIL @Nillion
1
775

Article
🚨 10-Minute Solana Ad in Shanghai: Did CZ Really Cause the Takedown? 🇨🇳A massive Solana ($SOL ) advertisement recently shocked the crypto community by lighting up Shanghai’s iconic Bund waterfront—only to be abruptly pulled down a mere 10 minutes later.
The lightning-fast removal instantly triggered massive speculation across Web3, with some critics quickly pointing fingers at Binance founder Changpeng "CZ" Zhao.
Here is exactly what happened and why the rumors don't match the reality.
⚡ The Spark: A Brief Moment on the Bund
The Bund is one of China's most heavily monitored, high-profile public spaces. Seeing a major global layer-1 blockchain project like Solana splashed across the waterfront immediately turned heads in the local crypto space.
But almost as soon as the cameras started rolling, the display went dark.
In the immediate aftermath, wild theories flooded X (formerly Twitter). A few vocal critics claimed that a social media post by CZ drew the wrong kind of attention, ultimately triggering the removal by local authorities.
🛡️ CZ Sets the Record Straight
CZ wasted no time shutting down the rumors. He firmly rejected the claims, clarifying that while he did post about the ad shortly after it appeared, his tweet had absolutely nothing to do with it being taken offline.
Industry veterans agree with CZ. China maintains a famously rigid stance on cryptocurrency marketing. Given the extreme municipal oversight along the Bund, public displays require intense vetting. The most logical explanation is standard regulatory compliance—meaning the ad simply lacked the proper local approvals required for such a high-profile public zone.
📉 The Takeaway for SOL & the Market
This incident is a stark reminder of the ongoing friction between global Web3 marketing ambitions and strict regional compliance frameworks. Even as Solana's on-chain metrics and network activity remain highly active globally, navigating public visibility in regions with tight digital asset policies remains a major hurdle.
What do you think? Was it just a classic regulatory shutdown, or was the 10-minute runtime just a stunt for viral marketing?
#Solana #SOL #Binance #CZ #CryptoNews
🚨 10-Minute Solana Ad in Shanghai: Did CZ Really Cause the Takedown? 🇨🇳
A massive Solana ($SOL ) advertisement recently shocked the crypto community by lighting up Shanghai’s iconic Bund waterfront—only to be abruptly pulled down a mere 10 minutes later.
The lightning-fast removal instantly triggered massive speculation across Web3, with some critics quickly pointing fingers at Binance founder Changpeng "CZ" Zhao.
Here is exactly what happened and why the rumors don't match the reality.
⚡ The Spark: A Brief Moment on the Bund
The Bund is one of China's most heavily monitored, high-profile public spaces. Seeing a major global layer-1 blockchain project like Solana splashed across the waterfront immediately turned heads in the local crypto space.
But almost as soon as the cameras started rolling, the display went dark.
In the immediate aftermath, wild theories flooded X (formerly Twitter). A few vocal critics claimed that a social media post by CZ drew the wrong kind of attention, ultimately triggering the removal by local authorities.
🛡️ CZ Sets the Record Straight
CZ wasted no time shutting down the rumors. He firmly rejected the claims, clarifying that while he did post about the ad shortly after it appeared, his tweet had absolutely nothing to do with it being taken offline.
Industry veterans agree with CZ. China maintains a famously rigid stance on cryptocurrency marketing. Given the extreme municipal oversight along the Bund, public displays require intense vetting. The most logical explanation is standard regulatory compliance—meaning the ad simply lacked the proper local approvals required for such a high-profile public zone.
📉 The Takeaway for SOL & the Market
This incident is a stark reminder of the ongoing friction between global Web3 marketing ambitions and strict regional compliance frameworks. Even as Solana's on-chain metrics and network activity remain highly active globally, navigating public visibility in regions with tight digital asset policies remains a major hurdle.
What do you think? Was it just a classic regulatory shutdown, or was the 10-minute runtime just a stunt for viral marketing?
#Solana #SOL #Binance #CZ #CryptoNews
The lightning-fast removal instantly triggered massive speculation across Web3, with some critics quickly pointing fingers at Binance founder Changpeng "CZ" Zhao.
Here is exactly what happened and why the rumors don't match the reality.
⚡ The Spark: A Brief Moment on the Bund
The Bund is one of China's most heavily monitored, high-profile public spaces. Seeing a major global layer-1 blockchain project like Solana splashed across the waterfront immediately turned heads in the local crypto space.
But almost as soon as the cameras started rolling, the display went dark.
In the immediate aftermath, wild theories flooded X (formerly Twitter). A few vocal critics claimed that a social media post by CZ drew the wrong kind of attention, ultimately triggering the removal by local authorities.
🛡️ CZ Sets the Record Straight
CZ wasted no time shutting down the rumors. He firmly rejected the claims, clarifying that while he did post about the ad shortly after it appeared, his tweet had absolutely nothing to do with it being taken offline.
Industry veterans agree with CZ. China maintains a famously rigid stance on cryptocurrency marketing. Given the extreme municipal oversight along the Bund, public displays require intense vetting. The most logical explanation is standard regulatory compliance—meaning the ad simply lacked the proper local approvals required for such a high-profile public zone.
📉 The Takeaway for SOL & the Market
This incident is a stark reminder of the ongoing friction between global Web3 marketing ambitions and strict regional compliance frameworks. Even as Solana's on-chain metrics and network activity remain highly active globally, navigating public visibility in regions with tight digital asset policies remains a major hurdle.
What do you think? Was it just a classic regulatory shutdown, or was the 10-minute runtime just a stunt for viral marketing?
#Solana #SOL #Binance #CZ #CryptoNews
318
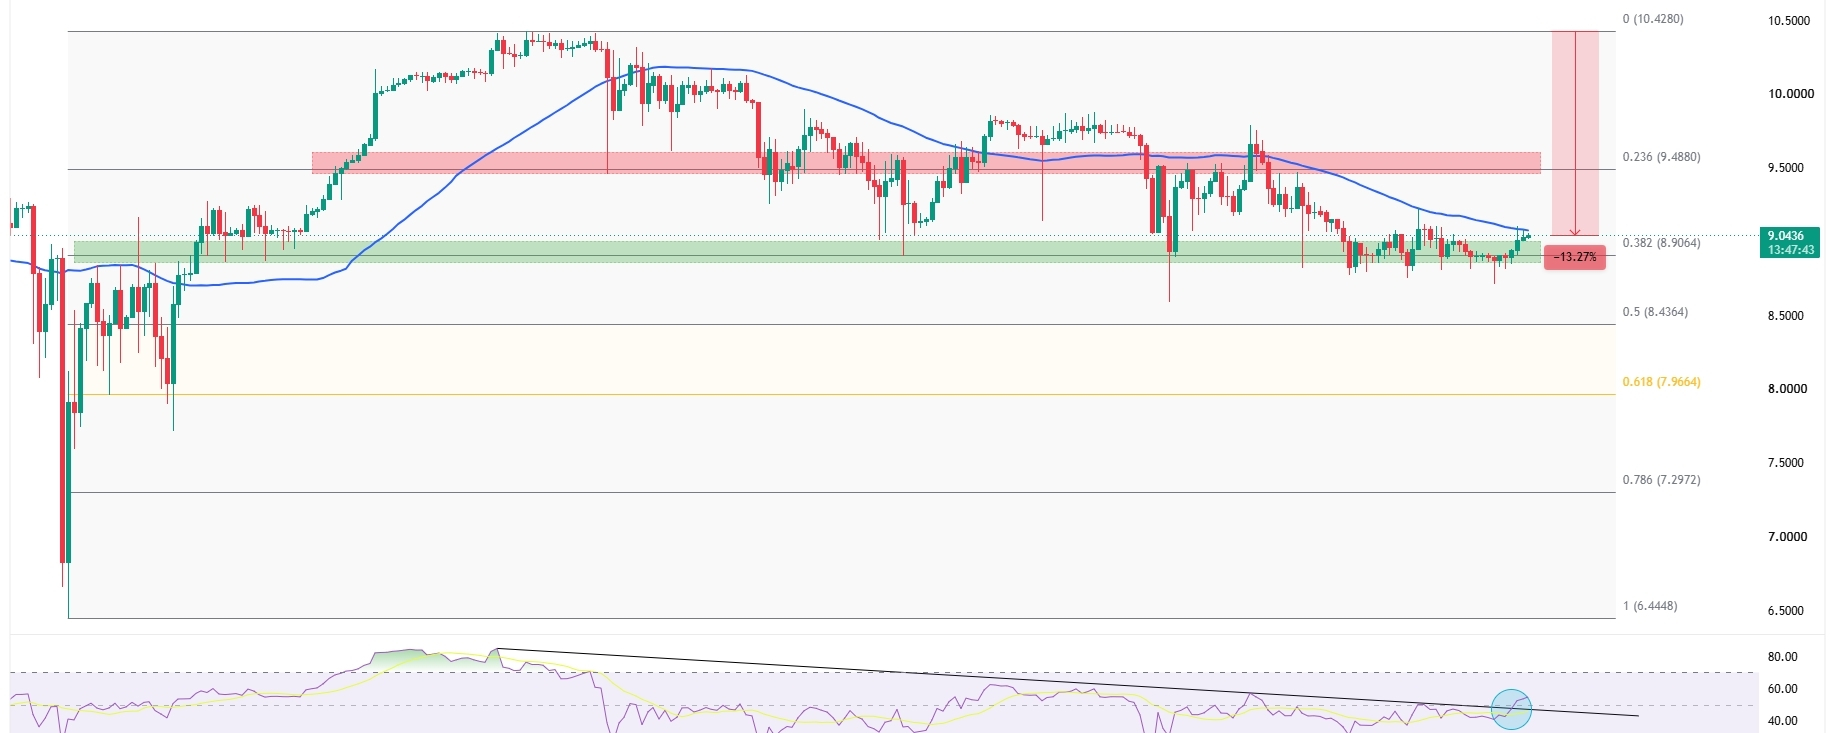
Article
Weekend Watching : 3 Altcoins Nearing Massive Breakouts to New All-Time HighsAs the weekend approaches, the broader crypto market is flashing signs of intense consolidation. Amid this sideways price action, three specific tokens—LEO Token (LEO), Hyperliquid (HYPE), and Tron (TRX)—are positioning themselves at critical technical inflection points.
With buying pressure mounting, these assets are sitting just a stone's throw away from rewriting their price history books. Here is a breakdown of what needs to happen next.
🦁 1. LEO Token (LEO)
LEO has quietly established a strong foundational support level after weeks of steady accumulation.
The Target: The asset is currently aiming to break through its final overhead resistance.The Gap: LEO requires a rally of roughly 15% from its current consolidation zone to eclipse its former peak and establish a fresh all-time high (ATH).What to Watch: Keep an eye on sudden volume spikes, which have historically triggered explosive upward moves for this token.
💧 2. Hyperliquid (HYPE)
As one of the most talked-about decentralized trading networks, Hyperliquid’s native token is coiled tightly for its next major macro expansion.
The Target: HYPE is building strong momentum just underneath its discovery-phase resistance.The Gap: The token needs a swift 21% gain to clear local supply walls and enter unchartered price territory.What to Watch: Sustained open interest on the Hyperliquid platform could easily act as the weekend catalyst fuel for this move.
🔴 3. Tron (TRX)
Tron continues to defy broader market corrections, heavily anchored by its massive dominance in global stablecoin velocity and network revenue generation.
The Target: TRX is compressing tightly inside a bullish continuation pattern on the daily chart.The Gap: Unlike newer tokens, TRX faces a multi-year psychological barrier, but its current structural setup suggests a breakout attempt is imminent.What to Watch: Increased burning dynamics (deflationary supply) and surging TVL (Total Value Locked) are the primary drivers backing this weekend push.
💡 The Bottom Line
Weekend trading typically brings lower liquidity, which can lead to high volatility and rapid price expansions. If Bitcoin stabilizes or pushes slightly higher, the compressed energy in LEO, HYPE, and TRX could easily trigger a race to new historic peaks before the weekly close.
#CryptoNews #Altcoins #TRX #LEOToken #Hyperliquid #CryptoMarket #ATHWatch
Would you like me to generate a custom visual banner for this article to help it stand out on the Binance Square feed, or should we set up a task to track their price movements over the weekend?
#DYOR #NFA #Write2Earn #Trx #Hyperium
Weekend Watching : 3 Altcoins Nearing Massive Breakouts to New All-Time Highs
As the weekend approaches, the broader crypto market is flashing signs of intense consolidation. Amid this sideways price action, three specific tokens—LEO Token (LEO), Hyperliquid (HYPE), and Tron (TRX)—are positioning themselves at critical technical inflection points.
With buying pressure mounting, these assets are sitting just a stone's throw away from rewriting their price history books. Here is a breakdown of what needs to happen next.
🦁 1. LEO Token (LEO)
LEO has quietly established a strong foundational support level after weeks of steady accumulation.
The Target: The asset is currently aiming to break through its final overhead resistance.The Gap: LEO requires a rally of roughly 15% from its current consolidation zone to eclipse its former peak and establish a fresh all-time high (ATH).What to Watch: Keep an eye on sudden volume spikes, which have historically triggered explosive upward moves for this token.
💧 2. Hyperliquid (HYPE)
As one of the most talked-about decentralized trading networks, Hyperliquid’s native token is coiled tightly for its next major macro expansion.
The Target: HYPE is building strong momentum just underneath its discovery-phase resistance.The Gap: The token needs a swift 21% gain to clear local supply walls and enter unchartered price territory.What to Watch: Sustained open interest on the Hyperliquid platform could easily act as the weekend catalyst fuel for this move.
🔴 3. Tron (TRX)
Tron continues to defy broader market corrections, heavily anchored by its massive dominance in global stablecoin velocity and network revenue generation.
The Target: TRX is compressing tightly inside a bullish continuation pattern on the daily chart.The Gap: Unlike newer tokens, TRX faces a multi-year psychological barrier, but its current structural setup suggests a breakout attempt is imminent.What to Watch: Increased burning dynamics (deflationary supply) and surging TVL (Total Value Locked) are the primary drivers backing this weekend push.
💡 The Bottom Line
Weekend trading typically brings lower liquidity, which can lead to high volatility and rapid price expansions. If Bitcoin stabilizes or pushes slightly higher, the compressed energy in LEO, HYPE, and TRX could easily trigger a race to new historic peaks before the weekly close.
#CryptoNews #Altcoins #TRX #LEOToken #Hyperliquid #CryptoMarket #ATHWatch
Would you like me to generate a custom visual banner for this article to help it stand out on the Binance Square feed, or should we set up a task to track their price movements over the weekend?
#DYOR #NFA #Write2Earn #Trx #Hyperium
With buying pressure mounting, these assets are sitting just a stone's throw away from rewriting their price history books. Here is a breakdown of what needs to happen next.
🦁 1. LEO Token (LEO)
LEO has quietly established a strong foundational support level after weeks of steady accumulation.
The Target: The asset is currently aiming to break through its final overhead resistance.The Gap: LEO requires a rally of roughly 15% from its current consolidation zone to eclipse its former peak and establish a fresh all-time high (ATH).What to Watch: Keep an eye on sudden volume spikes, which have historically triggered explosive upward moves for this token.
💧 2. Hyperliquid (HYPE)
As one of the most talked-about decentralized trading networks, Hyperliquid’s native token is coiled tightly for its next major macro expansion.
The Target: HYPE is building strong momentum just underneath its discovery-phase resistance.The Gap: The token needs a swift 21% gain to clear local supply walls and enter unchartered price territory.What to Watch: Sustained open interest on the Hyperliquid platform could easily act as the weekend catalyst fuel for this move.
🔴 3. Tron (TRX)
Tron continues to defy broader market corrections, heavily anchored by its massive dominance in global stablecoin velocity and network revenue generation.
The Target: TRX is compressing tightly inside a bullish continuation pattern on the daily chart.The Gap: Unlike newer tokens, TRX faces a multi-year psychological barrier, but its current structural setup suggests a breakout attempt is imminent.What to Watch: Increased burning dynamics (deflationary supply) and surging TVL (Total Value Locked) are the primary drivers backing this weekend push.
💡 The Bottom Line
Weekend trading typically brings lower liquidity, which can lead to high volatility and rapid price expansions. If Bitcoin stabilizes or pushes slightly higher, the compressed energy in LEO, HYPE, and TRX could easily trigger a race to new historic peaks before the weekly close.
#CryptoNews #Altcoins #TRX #LEOToken #Hyperliquid #CryptoMarket #ATHWatch
Would you like me to generate a custom visual banner for this article to help it stand out on the Binance Square feed, or should we set up a task to track their price movements over the weekend?
#DYOR #NFA #Write2Earn #Trx #Hyperium
4
621

Article
Bitcoin Just Fell Below $80,000: What Triggered the Selloff?The cryptocurrency market faced intense liquidation today as Bitcoin (BTC) decisively broke below the critical $80,000 support level. The decline marks a sharp continuation of the selling pressure building throughout the week, accelerated by a dual macroeconomic blow that caught over-leveraged traders off guard.
According to [Binance Market Data](https://www.binance.com/), Bitcoin momentarily dipped to $79,805 during morning trading hours before attempting a minor technical rebound to consolidate near the $80,900 range. This sudden move wiped millions off the derivatives market and reset near-term price projections.
The Catalyst: A Double-Header Inflation Shock
The primary driver behind today's breakdown is a worsening macroeconomic landscape in the United States, which has completely shifted investor expectations for interest rates:
Hot Producer Price Index (PPI): Fresh data released by the U.S. Labor Department showed that wholesale inflation rose at its fastest pace in over four years.Sticky Consumer Inflation: This followed yesterday's hotter-than-expected Consumer Price Index (CPI) report, which locked annual consumer inflation at a sticky 3.7%.
The Market Impact: Cryptocurrencies thrive in low-interest-rate environments where excess liquidity flows into risk assets. With both consumer and wholesale metrics coming in hot, traders are rapidly shifting bets, realizing that the Federal Reserve is highly likely to keep interest rates higher for longer to aggressively fight inflation.
Cascading Liquidations Fuel the Drop
As Bitcoin dipped toward the psychological $80,000 baseline, structural elements within the crypto market amplified the downside momentum:
$483 Million Wiped Out: Broader market data reveals that roughly $483 million in crypto futures positions were liquidated within a 24-hour window.The Long Squeeze: Bullish traders who heavily leveraged long positions at the $81,000 support level were forced into automated stop-outs, triggering a cascading domino effect that forced spot prices below $80,000.Altcoin Bleed: The selling pressure quickly spread across major layer-1 assets. Ethereum (ETH) bore the brunt of the volatility, dropping over 5.8% down to $2,360, while assets like Solana and XRP registered parallel 3% drops.
Macro Correlation: Tech Stocks Under Pressure
Bitcoin's decline did not happen in isolation. Risk assets across the board faced a uniform selloff following the inflation data releases. The tech-heavy Nasdaq and broader stock indices slid alongside crypto, demonstrating that institutional capital is treating Bitcoin as a correlated high-beta risk asset rather than an inflation hedge in the immediate term.
Additionally, cautious investor sentiment had already been building on decentralized prediction platforms. Market activity on platforms like Polymarket showed that traders were pricing in a 54% to 63% probability of Bitcoin touching the $80,000 floor this month, prompting institutional participants to derisk prematurely.
Technical Levels: What Comes Next?
With the $80,000 baseline actively being contested, market analysts are closely watching the weekly candle close to gauge structural health:
The Bearish Trap: If Bitcoin fails to firmly reclaim $81,000, analysts warn that momentum could quickly carry the asset down to the short-term holder cost basis located near $75,000. A failure there opens the door for a deeper correction toward $65,000.The Bullish Reclaim: To reverse this localized bearish structure, buyers must push BTC back above the $82,500 supply zone to invalidate the inflation-induced dump and attract spot ETF inflows back into the market.
What's your move? Are you buying this macroeconomic dip, or do you think Bitcoin has lower to go? Drop your strategy in the comments!
#Bitcoin #BTC走势分析 #CryptoNews #MacroEconomics #Inflation
Bitcoin Just Fell Below $80,000: What Triggered the Selloff?
The cryptocurrency market faced intense liquidation today as Bitcoin (BTC) decisively broke below the critical $80,000 support level. The decline marks a sharp continuation of the selling pressure building throughout the week, accelerated by a dual macroeconomic blow that caught over-leveraged traders off guard.
According to Binance Market Data, Bitcoin momentarily dipped to $79,805 during morning trading hours before attempting a minor technical rebound to consolidate near the $80,900 range. This sudden move wiped millions off the derivatives market and reset near-term price projections.
The Catalyst: A Double-Header Inflation Shock
The primary driver behind today's breakdown is a worsening macroeconomic landscape in the United States, which has completely shifted investor expectations for interest rates:
Hot Producer Price Index (PPI): Fresh data released by the U.S. Labor Department showed that wholesale inflation rose at its fastest pace in over four years.Sticky Consumer Inflation: This followed yesterday's hotter-than-expected Consumer Price Index (CPI) report, which locked annual consumer inflation at a sticky 3.7%.
The Market Impact: Cryptocurrencies thrive in low-interest-rate environments where excess liquidity flows into risk assets. With both consumer and wholesale metrics coming in hot, traders are rapidly shifting bets, realizing that the Federal Reserve is highly likely to keep interest rates higher for longer to aggressively fight inflation.
Cascading Liquidations Fuel the Drop
As Bitcoin dipped toward the psychological $80,000 baseline, structural elements within the crypto market amplified the downside momentum:
$483 Million Wiped Out: Broader market data reveals that roughly $483 million in crypto futures positions were liquidated within a 24-hour window.The Long Squeeze: Bullish traders who heavily leveraged long positions at the $81,000 support level were forced into automated stop-outs, triggering a cascading domino effect that forced spot prices below $80,000.Altcoin Bleed: The selling pressure quickly spread across major layer-1 assets. Ethereum (ETH) bore the brunt of the volatility, dropping over 5.8% down to $2,360, while assets like Solana and XRP registered parallel 3% drops.
Macro Correlation: Tech Stocks Under Pressure
Bitcoin's decline did not happen in isolation. Risk assets across the board faced a uniform selloff following the inflation data releases. The tech-heavy Nasdaq and broader stock indices slid alongside crypto, demonstrating that institutional capital is treating Bitcoin as a correlated high-beta risk asset rather than an inflation hedge in the immediate term.
Additionally, cautious investor sentiment had already been building on decentralized prediction platforms. Market activity on platforms like Polymarket showed that traders were pricing in a 54% to 63% probability of Bitcoin touching the $80,000 floor this month, prompting institutional participants to derisk prematurely.
Technical Levels: What Comes Next?
With the $80,000 baseline actively being contested, market analysts are closely watching the weekly candle close to gauge structural health:
The Bearish Trap: If Bitcoin fails to firmly reclaim $81,000, analysts warn that momentum could quickly carry the asset down to the short-term holder cost basis located near $75,000. A failure there opens the door for a deeper correction toward $65,000.The Bullish Reclaim: To reverse this localized bearish structure, buyers must push BTC back above the $82,500 supply zone to invalidate the inflation-induced dump and attract spot ETF inflows back into the market.
What's your move? Are you buying this macroeconomic dip, or do you think Bitcoin has lower to go? Drop your strategy in the comments!
#Bitcoin #BTC走势分析 #CryptoNews #MacroEconomics #Inflation
According to Binance Market Data, Bitcoin momentarily dipped to $79,805 during morning trading hours before attempting a minor technical rebound to consolidate near the $80,900 range. This sudden move wiped millions off the derivatives market and reset near-term price projections.
The Catalyst: A Double-Header Inflation Shock
The primary driver behind today's breakdown is a worsening macroeconomic landscape in the United States, which has completely shifted investor expectations for interest rates:
Hot Producer Price Index (PPI): Fresh data released by the U.S. Labor Department showed that wholesale inflation rose at its fastest pace in over four years.Sticky Consumer Inflation: This followed yesterday's hotter-than-expected Consumer Price Index (CPI) report, which locked annual consumer inflation at a sticky 3.7%.
The Market Impact: Cryptocurrencies thrive in low-interest-rate environments where excess liquidity flows into risk assets. With both consumer and wholesale metrics coming in hot, traders are rapidly shifting bets, realizing that the Federal Reserve is highly likely to keep interest rates higher for longer to aggressively fight inflation.
Cascading Liquidations Fuel the Drop
As Bitcoin dipped toward the psychological $80,000 baseline, structural elements within the crypto market amplified the downside momentum:
$483 Million Wiped Out: Broader market data reveals that roughly $483 million in crypto futures positions were liquidated within a 24-hour window.The Long Squeeze: Bullish traders who heavily leveraged long positions at the $81,000 support level were forced into automated stop-outs, triggering a cascading domino effect that forced spot prices below $80,000.Altcoin Bleed: The selling pressure quickly spread across major layer-1 assets. Ethereum (ETH) bore the brunt of the volatility, dropping over 5.8% down to $2,360, while assets like Solana and XRP registered parallel 3% drops.
Macro Correlation: Tech Stocks Under Pressure
Bitcoin's decline did not happen in isolation. Risk assets across the board faced a uniform selloff following the inflation data releases. The tech-heavy Nasdaq and broader stock indices slid alongside crypto, demonstrating that institutional capital is treating Bitcoin as a correlated high-beta risk asset rather than an inflation hedge in the immediate term.
Additionally, cautious investor sentiment had already been building on decentralized prediction platforms. Market activity on platforms like Polymarket showed that traders were pricing in a 54% to 63% probability of Bitcoin touching the $80,000 floor this month, prompting institutional participants to derisk prematurely.
Technical Levels: What Comes Next?
With the $80,000 baseline actively being contested, market analysts are closely watching the weekly candle close to gauge structural health:
The Bearish Trap: If Bitcoin fails to firmly reclaim $81,000, analysts warn that momentum could quickly carry the asset down to the short-term holder cost basis located near $75,000. A failure there opens the door for a deeper correction toward $65,000.The Bullish Reclaim: To reverse this localized bearish structure, buyers must push BTC back above the $82,500 supply zone to invalidate the inflation-induced dump and attract spot ETF inflows back into the market.
What's your move? Are you buying this macroeconomic dip, or do you think Bitcoin has lower to go? Drop your strategy in the comments!
#Bitcoin #BTC走势分析 #CryptoNews #MacroEconomics #Inflation
1
424

Article
Solana's Alpenglow Goes Live Next Week: How Will SOL Price React?The Solana network is on the verge of one of its most critical architectural transformations since its inception in 2020. The highly anticipated Alpenglow consensus upgrade is officially scheduled to go live on the mainnet on October 21, 2026.
As the countdown begins, the broader crypto community is asking one vital question: How will the price of $SOL react?
Here is a deep dive into what the Alpenglow upgrade brings, the historical patterns of major blockchain overhauls, and the potential short- and long-term price targets for Solana.
What is the Alpenglow Upgrade?
Alpenglow introduces a fundamental overhaul to Solana’s core engine. While past updates focused heavily on combating network congestion and optimizing fee markets, Alpenglow targets the very foundation of the blockchain: its consensus mechanism and state execution architecture.
Key features of the upgrade include:
Optimized Transaction Execution: Drastically lowering localized hardware bottlenecks for validators.Enhanced State Finality: Substantially lowering the time-to-finality for cross-border transactions and smart contract executions.Upgraded Security Infrastructure: Boosting the network’s theoretical resistance to economic attacks and MEV (Maximal Extractable Value) exploitation.
By fixing structural issues that previously caused sporadic network degradation during high-traffic meme coin seasons and NFT mints, Alpenglow aims to cement Solana as the premier enterprise-grade monolithic blockchain.
Historical Context: "Buy the Rumor, Sell the News"?
To predict how SOL's price will move next week, we can look at how major crypto assets behave during massive technical updates—such as Ethereum's "Merge" or Bitcoin's halving cycles.
Typically, these events trigger a distinct multi-phase price action:
The Pre-Upgrade Run-Up (Current Phase): Anticipation builds buying pressure. Investors accumulate the token expecting a flawless technical launch.The Liquidity Flush (Launch Week): Even if the upgrade goes perfectly, large-scale upgrades frequently face a classic "buy the rumor, sell the news" scenario. Traders who bought in early may liquidate positions on October 21 to lock in quick profits, causing short-term price volatility.The Fundamental Shift (Post-Launch): If the mainnet remains stable and delivers the promised speed improvements, institutional applications and capital inflows follow, sparking a sustained, organic rally.
SOL Price Analysis: Key Levels to Watch
Solana's native token enters next week backed by strong structural momentum, but macroeconomic pressures require a cautious approach.
📈 The Bullish Scenario (Flawless Execution)
If the Alpenglow upgrade goes live seamlessly without any unexpected mainnet downtime, it will validate Solana's technical maturity to institutional investors.
Short-Term Target: A successful launch could push SOL past immediate overhead resistance levels, targeting a swift move toward the $185 – $195 zone.Long-Term Target: If network stability holds and dApp development accelerates throughout Q4 2026, a breach above $220 is highly achievable by early 2027.
📉 The Bearish Scenario (Technical Hitches or Market Sell-offs)
Monolithic blockchains carry inherent risks during hard forks and major consensus updates. Any unexpected validator coordination delays or temporary chain stalls could hurt investor confidence.
Immediate Support: If a "sell the news" event unfolds or minor technical bugs occur, SOL could slide to retest its key psychological support floor at $145 – $150.Major Capitulation Floor: A broader macro market pullback combined with technical instability could push the asset down toward the $130 accumulation zone.
The Verdict: A Structural Leap Forward
Ultimately, the Alpenglow upgrade is a net positive for Solana’s longevity. While short-term day traders should brace for volatile price swings surrounding the October 21 activation date, long-term spot holders are looking at a fundamentally stronger, faster, and more secure network.
As always in crypto, ensure you use proper risk management strategies ahead of high-impact network events.
What are your thoughts? Will Alpenglow push SOL to new yearly highs, or are we set for a correction?
#Solana #SOL #CryptoNews #Blockchain #Alpenglow
Solana's Alpenglow Goes Live Next Week: How Will SOL Price React?
The Solana network is on the verge of one of its most critical architectural transformations since its inception in 2020. The highly anticipated Alpenglow consensus upgrade is officially scheduled to go live on the mainnet on October 21, 2026.
As the countdown begins, the broader crypto community is asking one vital question: How will the price of $SOL react?
Here is a deep dive into what the Alpenglow upgrade brings, the historical patterns of major blockchain overhauls, and the potential short- and long-term price targets for Solana.
What is the Alpenglow Upgrade?
Alpenglow introduces a fundamental overhaul to Solana’s core engine. While past updates focused heavily on combating network congestion and optimizing fee markets, Alpenglow targets the very foundation of the blockchain: its consensus mechanism and state execution architecture.
Key features of the upgrade include:
Optimized Transaction Execution: Drastically lowering localized hardware bottlenecks for validators.Enhanced State Finality: Substantially lowering the time-to-finality for cross-border transactions and smart contract executions.Upgraded Security Infrastructure: Boosting the network’s theoretical resistance to economic attacks and MEV (Maximal Extractable Value) exploitation.
By fixing structural issues that previously caused sporadic network degradation during high-traffic meme coin seasons and NFT mints, Alpenglow aims to cement Solana as the premier enterprise-grade monolithic blockchain.
Historical Context: "Buy the Rumor, Sell the News"?
To predict how SOL's price will move next week, we can look at how major crypto assets behave during massive technical updates—such as Ethereum's "Merge" or Bitcoin's halving cycles.
Typically, these events trigger a distinct multi-phase price action:
The Pre-Upgrade Run-Up (Current Phase): Anticipation builds buying pressure. Investors accumulate the token expecting a flawless technical launch.The Liquidity Flush (Launch Week): Even if the upgrade goes perfectly, large-scale upgrades frequently face a classic "buy the rumor, sell the news" scenario. Traders who bought in early may liquidate positions on October 21 to lock in quick profits, causing short-term price volatility.The Fundamental Shift (Post-Launch): If the mainnet remains stable and delivers the promised speed improvements, institutional applications and capital inflows follow, sparking a sustained, organic rally.
SOL Price Analysis: Key Levels to Watch
Solana's native token enters next week backed by strong structural momentum, but macroeconomic pressures require a cautious approach.
📈 The Bullish Scenario (Flawless Execution)
If the Alpenglow upgrade goes live seamlessly without any unexpected mainnet downtime, it will validate Solana's technical maturity to institutional investors.
Short-Term Target: A successful launch could push SOL past immediate overhead resistance levels, targeting a swift move toward the $185 – $195 zone.Long-Term Target: If network stability holds and dApp development accelerates throughout Q4 2026, a breach above $220 is highly achievable by early 2027.
📉 The Bearish Scenario (Technical Hitches or Market Sell-offs)
Monolithic blockchains carry inherent risks during hard forks and major consensus updates. Any unexpected validator coordination delays or temporary chain stalls could hurt investor confidence.
Immediate Support: If a "sell the news" event unfolds or minor technical bugs occur, SOL could slide to retest its key psychological support floor at $145 – $150.Major Capitulation Floor: A broader macro market pullback combined with technical instability could push the asset down toward the $130 accumulation zone.
The Verdict: A Structural Leap Forward
Ultimately, the Alpenglow upgrade is a net positive for Solana’s longevity. While short-term day traders should brace for volatile price swings surrounding the October 21 activation date, long-term spot holders are looking at a fundamentally stronger, faster, and more secure network.
As always in crypto, ensure you use proper risk management strategies ahead of high-impact network events.
What are your thoughts? Will Alpenglow push SOL to new yearly highs, or are we set for a correction?
#Solana #SOL #CryptoNews #Blockchain #Alpenglow
As the countdown begins, the broader crypto community is asking one vital question: How will the price of $SOL react?
Here is a deep dive into what the Alpenglow upgrade brings, the historical patterns of major blockchain overhauls, and the potential short- and long-term price targets for Solana.
What is the Alpenglow Upgrade?
Alpenglow introduces a fundamental overhaul to Solana’s core engine. While past updates focused heavily on combating network congestion and optimizing fee markets, Alpenglow targets the very foundation of the blockchain: its consensus mechanism and state execution architecture.
Key features of the upgrade include:
Optimized Transaction Execution: Drastically lowering localized hardware bottlenecks for validators.Enhanced State Finality: Substantially lowering the time-to-finality for cross-border transactions and smart contract executions.Upgraded Security Infrastructure: Boosting the network’s theoretical resistance to economic attacks and MEV (Maximal Extractable Value) exploitation.
By fixing structural issues that previously caused sporadic network degradation during high-traffic meme coin seasons and NFT mints, Alpenglow aims to cement Solana as the premier enterprise-grade monolithic blockchain.
Historical Context: "Buy the Rumor, Sell the News"?
To predict how SOL's price will move next week, we can look at how major crypto assets behave during massive technical updates—such as Ethereum's "Merge" or Bitcoin's halving cycles.
Typically, these events trigger a distinct multi-phase price action:
The Pre-Upgrade Run-Up (Current Phase): Anticipation builds buying pressure. Investors accumulate the token expecting a flawless technical launch.The Liquidity Flush (Launch Week): Even if the upgrade goes perfectly, large-scale upgrades frequently face a classic "buy the rumor, sell the news" scenario. Traders who bought in early may liquidate positions on October 21 to lock in quick profits, causing short-term price volatility.The Fundamental Shift (Post-Launch): If the mainnet remains stable and delivers the promised speed improvements, institutional applications and capital inflows follow, sparking a sustained, organic rally.
SOL Price Analysis: Key Levels to Watch
Solana's native token enters next week backed by strong structural momentum, but macroeconomic pressures require a cautious approach.
📈 The Bullish Scenario (Flawless Execution)
If the Alpenglow upgrade goes live seamlessly without any unexpected mainnet downtime, it will validate Solana's technical maturity to institutional investors.
Short-Term Target: A successful launch could push SOL past immediate overhead resistance levels, targeting a swift move toward the $185 – $195 zone.Long-Term Target: If network stability holds and dApp development accelerates throughout Q4 2026, a breach above $220 is highly achievable by early 2027.
📉 The Bearish Scenario (Technical Hitches or Market Sell-offs)
Monolithic blockchains carry inherent risks during hard forks and major consensus updates. Any unexpected validator coordination delays or temporary chain stalls could hurt investor confidence.
Immediate Support: If a "sell the news" event unfolds or minor technical bugs occur, SOL could slide to retest its key psychological support floor at $145 – $150.Major Capitulation Floor: A broader macro market pullback combined with technical instability could push the asset down toward the $130 accumulation zone.
The Verdict: A Structural Leap Forward
Ultimately, the Alpenglow upgrade is a net positive for Solana’s longevity. While short-term day traders should brace for volatile price swings surrounding the October 21 activation date, long-term spot holders are looking at a fundamentally stronger, faster, and more secure network.
As always in crypto, ensure you use proper risk management strategies ahead of high-impact network events.
What are your thoughts? Will Alpenglow push SOL to new yearly highs, or are we set for a correction?
#Solana #SOL #CryptoNews #Blockchain #Alpenglow
1
305
Weekly Trading Data Shows Crypto Markets May Expect Prices to FallThe crypto market might be bracing for a bumpy ride. If you've been watching the charts lately, you've probably noticed a distinct lack of momentum. Now, on-chain data is giving us a clear reason why: the market's "dry powder" is rapidly drying up.
According to the latest weekly data from Lookonchain, a staggering $856 million in stablecoins exited circulation over the last seven days. In plain English? Traders are pulling capital out of the crypto ecosystem entirely, and that historically points to downward price action ahead.
Stablecoins are the lifeblood of crypto trading. They represent the cash sitting on the sidelines waiting to buy the dip. When nearly a billion dollars worth of that cash vanishes from the ecosystem in a single week, it tells us that institutional investors and whales aren't looking to accumulate right now—they are actively de-risking and moving back to traditional fiat.
The Data Behind the Drain
Liquidity Exits: The $856 million outflow is one of the sharpest single-week drops in stablecoin supply we've seen in months.Stalled Minting: The printing presses for top stablecoins like Tether (USDT) and USD Coin (USDC) have cooled down, reflecting a broader hesitation to enter the market.The Macro Drag: With US Treasury yields offering attractive, risk-free returns, big money is finding it hard to justify holding non-yielding crypto assets during times of high uncertainty.
The Takeaway for Traders
Weaker Buying Support: Less stablecoin liquidity on exchanges means there are fewer buyers ready to catch falling knives if major tokens break below their current support levels.A Leading Bearish Indicator: Even if Bitcoin (BTC) and major altcoins look like they are holding steady today, this massive on-chain capital flight serves as a warning sign that the broader market sentiment has flipped to "risk-off."Pre-emptive De-risking: Smart money is opting for cash preservation right now. With major macroeconomic reports on the horizon, the priority for large traders has shifted from chasing gains to protecting capital.
Keep a close eye on your risk management this week the liquidity trends suggest the bears might be getting ready to take control.
What’s your game plan for this week?
Are you converting to fiat alongside the whales, or are you setting up buy orders to catch a potential discount? Drop your strategy in the comments below!
Disclaimer: This article is for informational purposes only and does not constitute financial advice. Always do your own research before trading.
#BitcoinReclaims$84K #Write2Earn!
Weekly Trading Data Shows Crypto Markets May Expect Prices to Fall
The crypto market might be bracing for a bumpy ride. If you've been watching the charts lately, you've probably noticed a distinct lack of momentum. Now, on-chain data is giving us a clear reason why: the market's "dry powder" is rapidly drying up.
According to the latest weekly data from Lookonchain, a staggering $856 million in stablecoins exited circulation over the last seven days. In plain English? Traders are pulling capital out of the crypto ecosystem entirely, and that historically points to downward price action ahead.
Stablecoins are the lifeblood of crypto trading. They represent the cash sitting on the sidelines waiting to buy the dip. When nearly a billion dollars worth of that cash vanishes from the ecosystem in a single week, it tells us that institutional investors and whales aren't looking to accumulate right now—they are actively de-risking and moving back to traditional fiat.
The Data Behind the Drain
Liquidity Exits: The $856 million outflow is one of the sharpest single-week drops in stablecoin supply we've seen in months.Stalled Minting: The printing presses for top stablecoins like Tether (USDT) and USD Coin (USDC) have cooled down, reflecting a broader hesitation to enter the market.The Macro Drag: With US Treasury yields offering attractive, risk-free returns, big money is finding it hard to justify holding non-yielding crypto assets during times of high uncertainty.
The Takeaway for Traders
Weaker Buying Support: Less stablecoin liquidity on exchanges means there are fewer buyers ready to catch falling knives if major tokens break below their current support levels.A Leading Bearish Indicator: Even if Bitcoin (BTC) and major altcoins look like they are holding steady today, this massive on-chain capital flight serves as a warning sign that the broader market sentiment has flipped to "risk-off."Pre-emptive De-risking: Smart money is opting for cash preservation right now. With major macroeconomic reports on the horizon, the priority for large traders has shifted from chasing gains to protecting capital.
Keep a close eye on your risk management this week the liquidity trends suggest the bears might be getting ready to take control.
What’s your game plan for this week?
Are you converting to fiat alongside the whales, or are you setting up buy orders to catch a potential discount? Drop your strategy in the comments below!
Disclaimer: This article is for informational purposes only and does not constitute financial advice. Always do your own research before trading.
#BitcoinReclaims$84K #Write2Earn!
According to the latest weekly data from Lookonchain, a staggering $856 million in stablecoins exited circulation over the last seven days. In plain English? Traders are pulling capital out of the crypto ecosystem entirely, and that historically points to downward price action ahead.
Stablecoins are the lifeblood of crypto trading. They represent the cash sitting on the sidelines waiting to buy the dip. When nearly a billion dollars worth of that cash vanishes from the ecosystem in a single week, it tells us that institutional investors and whales aren't looking to accumulate right now—they are actively de-risking and moving back to traditional fiat.
The Data Behind the Drain
Liquidity Exits: The $856 million outflow is one of the sharpest single-week drops in stablecoin supply we've seen in months.Stalled Minting: The printing presses for top stablecoins like Tether (USDT) and USD Coin (USDC) have cooled down, reflecting a broader hesitation to enter the market.The Macro Drag: With US Treasury yields offering attractive, risk-free returns, big money is finding it hard to justify holding non-yielding crypto assets during times of high uncertainty.
The Takeaway for Traders
Weaker Buying Support: Less stablecoin liquidity on exchanges means there are fewer buyers ready to catch falling knives if major tokens break below their current support levels.A Leading Bearish Indicator: Even if Bitcoin (BTC) and major altcoins look like they are holding steady today, this massive on-chain capital flight serves as a warning sign that the broader market sentiment has flipped to "risk-off."Pre-emptive De-risking: Smart money is opting for cash preservation right now. With major macroeconomic reports on the horizon, the priority for large traders has shifted from chasing gains to protecting capital.
Keep a close eye on your risk management this week the liquidity trends suggest the bears might be getting ready to take control.
What’s your game plan for this week?
Are you converting to fiat alongside the whales, or are you setting up buy orders to catch a potential discount? Drop your strategy in the comments below!
Disclaimer: This article is for informational purposes only and does not constitute financial advice. Always do your own research before trading.
#BitcoinReclaims$84K #Write2Earn!
1
268

Article
🇨🇳 China’s New National Blockchain Network: Will Bitcoin Actually Benefit? 🚀China is making a massive leap into the future of digital infrastructure. In a recently unveiled economic blueprint, top leadership called for the development of a national blockchain network as part of 19 sweeping measures to modernize the country’s economy.
However, the ambitious initiative comes with a stark warning: officials must strictly avoid creating speculative "bubbles" and prevent the virtual economy from overshadowing the real economy.
For the global cryptocurrency market, this announcement raises a critical question: Will Bitcoin benefit from China’s official blockchain push?
🧱 The Infrastructure Push vs. The Anti-Speculation Stance
China's latest economic blueprint highlights a clear dichotomy in how the world’s second-largest economy views blockchain technology versus crypto assets:
The Blueprint: Blockchain is recognized as a vital, foundational technology capable of streamlining supply chains, improving administrative efficiency, and securing cross-border data.The Warning: The document heavily emphasizes anchoring technology to the "real economy." Policymakers explicitly cautioned against abandoning tangible industries in favor of the "virtual economy," signaling that speculative trading, tokenization, and decentralized finance (DeFi) remain firmly out of favor.
This framework is a continuation of Beijing's long-standing policy: "Blockchain, not Bitcoin."
Will Bitcoin Benefit?
While a national blockchain network sounds bullish on the surface, the direct implications for Bitcoin are highly nuanced, presenting both systemic hurdles and indirect advantages.
1. Why it might NOT benefit Bitcoin: Increased Control and Separation
Permissioned vs. Permissionless: China’s national network will be highly centralized and permissioned. This stands in direct opposition to Bitcoin’s decentralized, permissionless architecture.No Reversal on Crypto Bans: The explicit warning against "virtual bubbles" indicates that China has no intention of lifting its strict 2021 ban on crypto mining and trading.Empowering the e-CNY: A unified national blockchain will likely serve as the perfect rails to further integrate and scale China’s central bank digital currency (CBDC), the digital yuan (e-CNY), reinforcing sovereign control over payments rather than opening doors to decentralized alternatives.
2. The Indirect Silver Lining for Bitcoin
Global Validation of Tech: When a major global superpower officially integrates blockchain into its national economic strategy, it validates the underlying technology on the world stage. This institutional validation historically shifts public perception, indirectly boosting interest in the ultimate blockchain—Bitcoin.The Liquidity Paradox: Historically, strict capital controls and the expansion of digital sovereign networks in Asia have driven subtle, alternative capital flight into censorship-resistant assets like Bitcoin. If the digital yuan or national network tightens domestic financial surveillance, it could inadvertently drive organic demand for decentralized alternatives through secondary markets.Accelerating Western Adoption: China’s aggressive stance on national digital infrastructure often triggers a geopolitical competitive response. Increased state-backed blockchain development in the East could pressure Western regulators to adopt more favorable, open-market crypto frameworks to ensure they don't fall behind.
The Bottom Line
China is building a digital fortress utilizing the technology that Bitcoin birthed, but it is doing so while keeping the gates firmly shut against speculative crypto assets.
For Bitcoin, this development will not result in a sudden influx of Chinese retail buying or an official policy reversal. Instead, its value lies in the macro-validation of blockchain rails and the potential geopolitical domino effect it could trigger among global regulators. As China builds its virtual wall, Bitcoin’s role as the premier decentralized, global alternative becomes even more distinct.
What are your thoughts? Will China's blockchain network inadvertently fuel the next Bitcoin cycle, or will it stifle independent innovation? DYOR
#China #Blockchain #Bitcoin #CryptoRegulation #BinanceSquare
🇨🇳 China’s New National Blockchain Network: Will Bitcoin Actually Benefit? 🚀
China is making a massive leap into the future of digital infrastructure. In a recently unveiled economic blueprint, top leadership called for the development of a national blockchain network as part of 19 sweeping measures to modernize the country’s economy.
However, the ambitious initiative comes with a stark warning: officials must strictly avoid creating speculative "bubbles" and prevent the virtual economy from overshadowing the real economy.
For the global cryptocurrency market, this announcement raises a critical question: Will Bitcoin benefit from China’s official blockchain push?
🧱 The Infrastructure Push vs. The Anti-Speculation Stance
China's latest economic blueprint highlights a clear dichotomy in how the world’s second-largest economy views blockchain technology versus crypto assets:
The Blueprint: Blockchain is recognized as a vital, foundational technology capable of streamlining supply chains, improving administrative efficiency, and securing cross-border data.The Warning: The document heavily emphasizes anchoring technology to the "real economy." Policymakers explicitly cautioned against abandoning tangible industries in favor of the "virtual economy," signaling that speculative trading, tokenization, and decentralized finance (DeFi) remain firmly out of favor.
This framework is a continuation of Beijing's long-standing policy: "Blockchain, not Bitcoin."
Will Bitcoin Benefit?
While a national blockchain network sounds bullish on the surface, the direct implications for Bitcoin are highly nuanced, presenting both systemic hurdles and indirect advantages.
1. Why it might NOT benefit Bitcoin: Increased Control and Separation
Permissioned vs. Permissionless: China’s national network will be highly centralized and permissioned. This stands in direct opposition to Bitcoin’s decentralized, permissionless architecture.No Reversal on Crypto Bans: The explicit warning against "virtual bubbles" indicates that China has no intention of lifting its strict 2021 ban on crypto mining and trading.Empowering the e-CNY: A unified national blockchain will likely serve as the perfect rails to further integrate and scale China’s central bank digital currency (CBDC), the digital yuan (e-CNY), reinforcing sovereign control over payments rather than opening doors to decentralized alternatives.
2. The Indirect Silver Lining for Bitcoin
Global Validation of Tech: When a major global superpower officially integrates blockchain into its national economic strategy, it validates the underlying technology on the world stage. This institutional validation historically shifts public perception, indirectly boosting interest in the ultimate blockchain—Bitcoin.The Liquidity Paradox: Historically, strict capital controls and the expansion of digital sovereign networks in Asia have driven subtle, alternative capital flight into censorship-resistant assets like Bitcoin. If the digital yuan or national network tightens domestic financial surveillance, it could inadvertently drive organic demand for decentralized alternatives through secondary markets.Accelerating Western Adoption: China’s aggressive stance on national digital infrastructure often triggers a geopolitical competitive response. Increased state-backed blockchain development in the East could pressure Western regulators to adopt more favorable, open-market crypto frameworks to ensure they don't fall behind.
The Bottom Line
China is building a digital fortress utilizing the technology that Bitcoin birthed, but it is doing so while keeping the gates firmly shut against speculative crypto assets.
For Bitcoin, this development will not result in a sudden influx of Chinese retail buying or an official policy reversal. Instead, its value lies in the macro-validation of blockchain rails and the potential geopolitical domino effect it could trigger among global regulators. As China builds its virtual wall, Bitcoin’s role as the premier decentralized, global alternative becomes even more distinct.
What are your thoughts? Will China's blockchain network inadvertently fuel the next Bitcoin cycle, or will it stifle independent innovation? DYOR
#China #Blockchain #Bitcoin #CryptoRegulation #BinanceSquare
However, the ambitious initiative comes with a stark warning: officials must strictly avoid creating speculative "bubbles" and prevent the virtual economy from overshadowing the real economy.
For the global cryptocurrency market, this announcement raises a critical question: Will Bitcoin benefit from China’s official blockchain push?
🧱 The Infrastructure Push vs. The Anti-Speculation Stance
China's latest economic blueprint highlights a clear dichotomy in how the world’s second-largest economy views blockchain technology versus crypto assets:
The Blueprint: Blockchain is recognized as a vital, foundational technology capable of streamlining supply chains, improving administrative efficiency, and securing cross-border data.The Warning: The document heavily emphasizes anchoring technology to the "real economy." Policymakers explicitly cautioned against abandoning tangible industries in favor of the "virtual economy," signaling that speculative trading, tokenization, and decentralized finance (DeFi) remain firmly out of favor.
This framework is a continuation of Beijing's long-standing policy: "Blockchain, not Bitcoin."
Will Bitcoin Benefit?
While a national blockchain network sounds bullish on the surface, the direct implications for Bitcoin are highly nuanced, presenting both systemic hurdles and indirect advantages.
1. Why it might NOT benefit Bitcoin: Increased Control and Separation
Permissioned vs. Permissionless: China’s national network will be highly centralized and permissioned. This stands in direct opposition to Bitcoin’s decentralized, permissionless architecture.No Reversal on Crypto Bans: The explicit warning against "virtual bubbles" indicates that China has no intention of lifting its strict 2021 ban on crypto mining and trading.Empowering the e-CNY: A unified national blockchain will likely serve as the perfect rails to further integrate and scale China’s central bank digital currency (CBDC), the digital yuan (e-CNY), reinforcing sovereign control over payments rather than opening doors to decentralized alternatives.
2. The Indirect Silver Lining for Bitcoin
Global Validation of Tech: When a major global superpower officially integrates blockchain into its national economic strategy, it validates the underlying technology on the world stage. This institutional validation historically shifts public perception, indirectly boosting interest in the ultimate blockchain—Bitcoin.The Liquidity Paradox: Historically, strict capital controls and the expansion of digital sovereign networks in Asia have driven subtle, alternative capital flight into censorship-resistant assets like Bitcoin. If the digital yuan or national network tightens domestic financial surveillance, it could inadvertently drive organic demand for decentralized alternatives through secondary markets.Accelerating Western Adoption: China’s aggressive stance on national digital infrastructure often triggers a geopolitical competitive response. Increased state-backed blockchain development in the East could pressure Western regulators to adopt more favorable, open-market crypto frameworks to ensure they don't fall behind.
The Bottom Line
China is building a digital fortress utilizing the technology that Bitcoin birthed, but it is doing so while keeping the gates firmly shut against speculative crypto assets.
For Bitcoin, this development will not result in a sudden influx of Chinese retail buying or an official policy reversal. Instead, its value lies in the macro-validation of blockchain rails and the potential geopolitical domino effect it could trigger among global regulators. As China builds its virtual wall, Bitcoin’s role as the premier decentralized, global alternative becomes even more distinct.
What are your thoughts? Will China's blockchain network inadvertently fuel the next Bitcoin cycle, or will it stifle independent innovation? DYOR
#China #Blockchain #Bitcoin #CryptoRegulation #BinanceSquare
3
413

Article
🚨 Security Alert: Trader Loses $6.6M in Bitcoin from "Brand New" Ledger WalletThe crypto community is reeling today after a devastating security breach cost one trader 80 Bitcoin (BTC)—valued at approximately $6.6 million—in a single, unauthorized transaction on Friday.
What makes this hack particularly alarming is the setting: the funds had been sitting for just 10 days on a brand-new Ledger hardware wallet, a device widely trusted as the gold standard for offline cold storage.
Here is what happened, how it likely occurred, and the critical security steps you must take to protect your assets.
The Anatomy of a $6.6 Million Drain
According to on-chain tracking data, the 80 BTC had remained completely untouched for over a week following its transfer to the new device. However, on Friday, the wallet was completely drained in a flash transaction.
While hardware wallets themselves are structurally secure, they are completely vulnerable if the setup process or recovery phrase is compromised. Security analysts suspect this devastating loss stems from one of two common, sophisticated attack vectors:
The Pre-Configured Seed Phrase Scam: The victim may have purchased the Ledger from an unauthorized third-party reseller (like eBay or an unverified Amazon storefront). Malicious sellers sometimes set up the device beforehand, write down the 24-word recovery phrase, scratch off the security card to make it look "new," and wait for an unsuspecting buyer to load it with crypto.Malicious Supply Chain Interception: In rarer cases, devices are physically intercepted and loaded with custom, malicious firmware before arriving at the customer's doorstep, allowing hackers to clone the seed phrase remotely.
How to Safeguard Your Assets: 4 Non-Negotiable Rules
Hardware wallets only protect you if you control the point of origin. To ensure you never fall victim to this type of exploit, always follow these protocol guidelines:
Buy Directly from the Source: Never buy a hardware wallet from secondary marketplaces, auction sites, or unverified distributors. Only order directly from the official manufacturer's website.Verify the Device State: A genuine Ledger or Trezor will always generate a brand-new 24-word seed phrase on the device screen upon its very first boot. If a device arrives with a pre-written PIN code or a pre-filled recovery sheet, do not use it.Utilize Genuine Verification Apps: Before moving funds, always connect the device to the official companion application (e.g., Ledger Live). The app will run a cryptographic check to verify if the internal chip has been tampered with or modified.Test with Small Amounts: When initializing any new wallet system, always send a tiny test transaction first. Practice wiping the device and restoring it using your written recovery phrase to guarantee your backup works flawlessly before depositing millions.
What’s your take on this? Do you still trust hardware wallets completely, or have supply-chain attacks made you think twice?
Disclaimer: This post is for educational purposes only and does not constitute financial or legal advice. Always perform your own due diligence when handling crypto storage.
#Write2Earn #BTC #trending
🚨 Security Alert: Trader Loses $6.6M in Bitcoin from "Brand New" Ledger Wallet
The crypto community is reeling today after a devastating security breach cost one trader 80 Bitcoin (BTC)—valued at approximately $6.6 million—in a single, unauthorized transaction on Friday.
What makes this hack particularly alarming is the setting: the funds had been sitting for just 10 days on a brand-new Ledger hardware wallet, a device widely trusted as the gold standard for offline cold storage.
Here is what happened, how it likely occurred, and the critical security steps you must take to protect your assets.
The Anatomy of a $6.6 Million Drain
According to on-chain tracking data, the 80 BTC had remained completely untouched for over a week following its transfer to the new device. However, on Friday, the wallet was completely drained in a flash transaction.
While hardware wallets themselves are structurally secure, they are completely vulnerable if the setup process or recovery phrase is compromised. Security analysts suspect this devastating loss stems from one of two common, sophisticated attack vectors:
The Pre-Configured Seed Phrase Scam: The victim may have purchased the Ledger from an unauthorized third-party reseller (like eBay or an unverified Amazon storefront). Malicious sellers sometimes set up the device beforehand, write down the 24-word recovery phrase, scratch off the security card to make it look "new," and wait for an unsuspecting buyer to load it with crypto.Malicious Supply Chain Interception: In rarer cases, devices are physically intercepted and loaded with custom, malicious firmware before arriving at the customer's doorstep, allowing hackers to clone the seed phrase remotely.
How to Safeguard Your Assets: 4 Non-Negotiable Rules
Hardware wallets only protect you if you control the point of origin. To ensure you never fall victim to this type of exploit, always follow these protocol guidelines:
Buy Directly from the Source: Never buy a hardware wallet from secondary marketplaces, auction sites, or unverified distributors. Only order directly from the official manufacturer's website.Verify the Device State: A genuine Ledger or Trezor will always generate a brand-new 24-word seed phrase on the device screen upon its very first boot. If a device arrives with a pre-written PIN code or a pre-filled recovery sheet, do not use it.Utilize Genuine Verification Apps: Before moving funds, always connect the device to the official companion application (e.g., Ledger Live). The app will run a cryptographic check to verify if the internal chip has been tampered with or modified.Test with Small Amounts: When initializing any new wallet system, always send a tiny test transaction first. Practice wiping the device and restoring it using your written recovery phrase to guarantee your backup works flawlessly before depositing millions.
What’s your take on this? Do you still trust hardware wallets completely, or have supply-chain attacks made you think twice?
Disclaimer: This post is for educational purposes only and does not constitute financial or legal advice. Always perform your own due diligence when handling crypto storage.
#Write2Earn #BTC #trending
What makes this hack particularly alarming is the setting: the funds had been sitting for just 10 days on a brand-new Ledger hardware wallet, a device widely trusted as the gold standard for offline cold storage.
Here is what happened, how it likely occurred, and the critical security steps you must take to protect your assets.
The Anatomy of a $6.6 Million Drain
According to on-chain tracking data, the 80 BTC had remained completely untouched for over a week following its transfer to the new device. However, on Friday, the wallet was completely drained in a flash transaction.
While hardware wallets themselves are structurally secure, they are completely vulnerable if the setup process or recovery phrase is compromised. Security analysts suspect this devastating loss stems from one of two common, sophisticated attack vectors:
The Pre-Configured Seed Phrase Scam: The victim may have purchased the Ledger from an unauthorized third-party reseller (like eBay or an unverified Amazon storefront). Malicious sellers sometimes set up the device beforehand, write down the 24-word recovery phrase, scratch off the security card to make it look "new," and wait for an unsuspecting buyer to load it with crypto.Malicious Supply Chain Interception: In rarer cases, devices are physically intercepted and loaded with custom, malicious firmware before arriving at the customer's doorstep, allowing hackers to clone the seed phrase remotely.
How to Safeguard Your Assets: 4 Non-Negotiable Rules
Hardware wallets only protect you if you control the point of origin. To ensure you never fall victim to this type of exploit, always follow these protocol guidelines:
Buy Directly from the Source: Never buy a hardware wallet from secondary marketplaces, auction sites, or unverified distributors. Only order directly from the official manufacturer's website.Verify the Device State: A genuine Ledger or Trezor will always generate a brand-new 24-word seed phrase on the device screen upon its very first boot. If a device arrives with a pre-written PIN code or a pre-filled recovery sheet, do not use it.Utilize Genuine Verification Apps: Before moving funds, always connect the device to the official companion application (e.g., Ledger Live). The app will run a cryptographic check to verify if the internal chip has been tampered with or modified.Test with Small Amounts: When initializing any new wallet system, always send a tiny test transaction first. Practice wiping the device and restoring it using your written recovery phrase to guarantee your backup works flawlessly before depositing millions.
What’s your take on this? Do you still trust hardware wallets completely, or have supply-chain attacks made you think twice?
Disclaimer: This post is for educational purposes only and does not constitute financial or legal advice. Always perform your own due diligence when handling crypto storage.
#Write2Earn #BTC #trending
1
344
Log in to explore more content
Join global crypto users on Binance Square
⚡️ Get latest and useful information about crypto.
💬 Trusted by the world’s largest crypto exchange.
👍 Discover real insights from verified creators.
Email / Phone number