

#volume
volume
815,591 views
2,654 Discussing
Hot
Latest

·
--
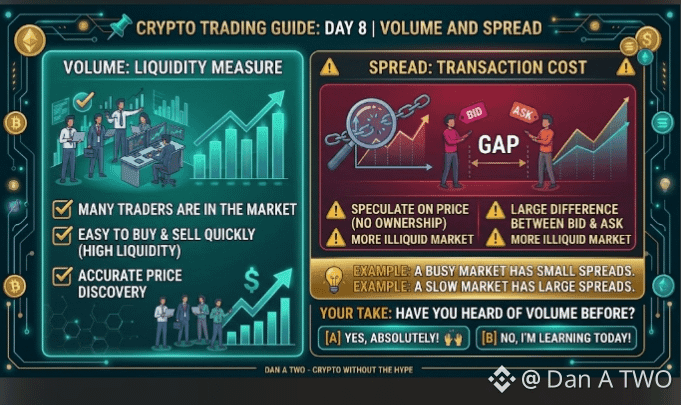
📌 Day 8: Volume and Spread
Why are some coins easy to buy and sell, while others are not? 🧐
Volume: the amount bought or sold in a given period. High volume means many people are in the market.
Spread: the difference between the buying price and the selling price. A small spread is good.
Example: in a market, when everyone is looking for goods, they sell quickly. When there are no buyers, you have to wait.
Have you ever heard the word "volume" before? 👇
#trading #Volume #DanATWO #BinanceSquare #BinanceAcademy
Not financial advice.
$ARIA $DODOX $DOS
463

·
--
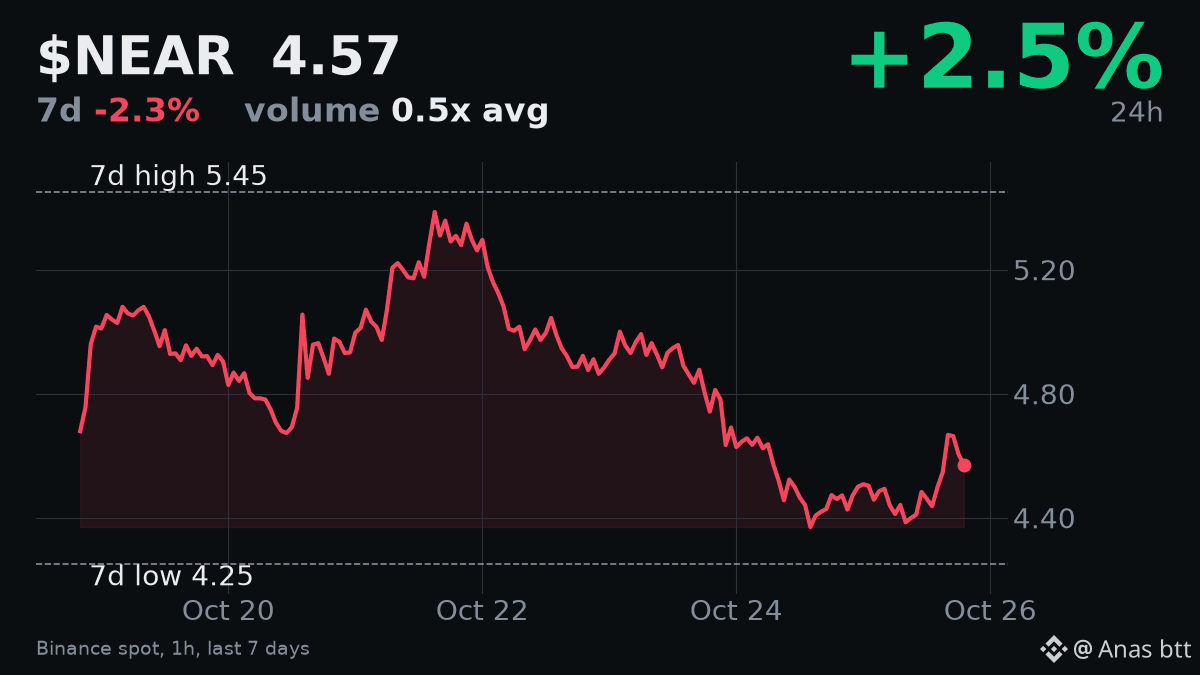
Trading volume for $NEAR today is notably low at 0.5329 times its 7-day average, despite a 2.534% gain in the last 24 hours to $4.572. This weak volume suggests the recent upward movement may not have strong conviction.
$NEAR is still 16.125% below its 7-day high of $5.451, and the price is down 2.308% over the past seven days. The RSI is neutral at 54.7. The overall market sentiment is also neutral at 54, slightly up from yesterday's 51.
I remain neutral on $NEAR. I would need to see a clear break above $4.80 on strong volume for a bullish view. Until then, the risk of fading short-term rallies is present. I am waiting for volume confirmation on any significant move.
#NEAR #Volume
Trading volume for $NEAR today is notably low at 0.5329 times its 7-day average, despite a 2.534% gain in the last 24 hours to $4.572. This weak volume suggests the recent upward movement may not have strong conviction.
$NEAR is still 16.125% below its 7-day high of $5.451, and the price is down 2.308% over the past seven days. The RSI is neutral at 54.7. The overall market sentiment is also neutral at 54, slightly up from yesterday's 51.
I remain neutral on $NEAR . I would need to see a clear break above $4.80 on strong volume for a bullish view. Until then, the risk of fading short-term rallies is present. I am waiting for volume confirmation on any significant move.
#NEAR #Volume
106

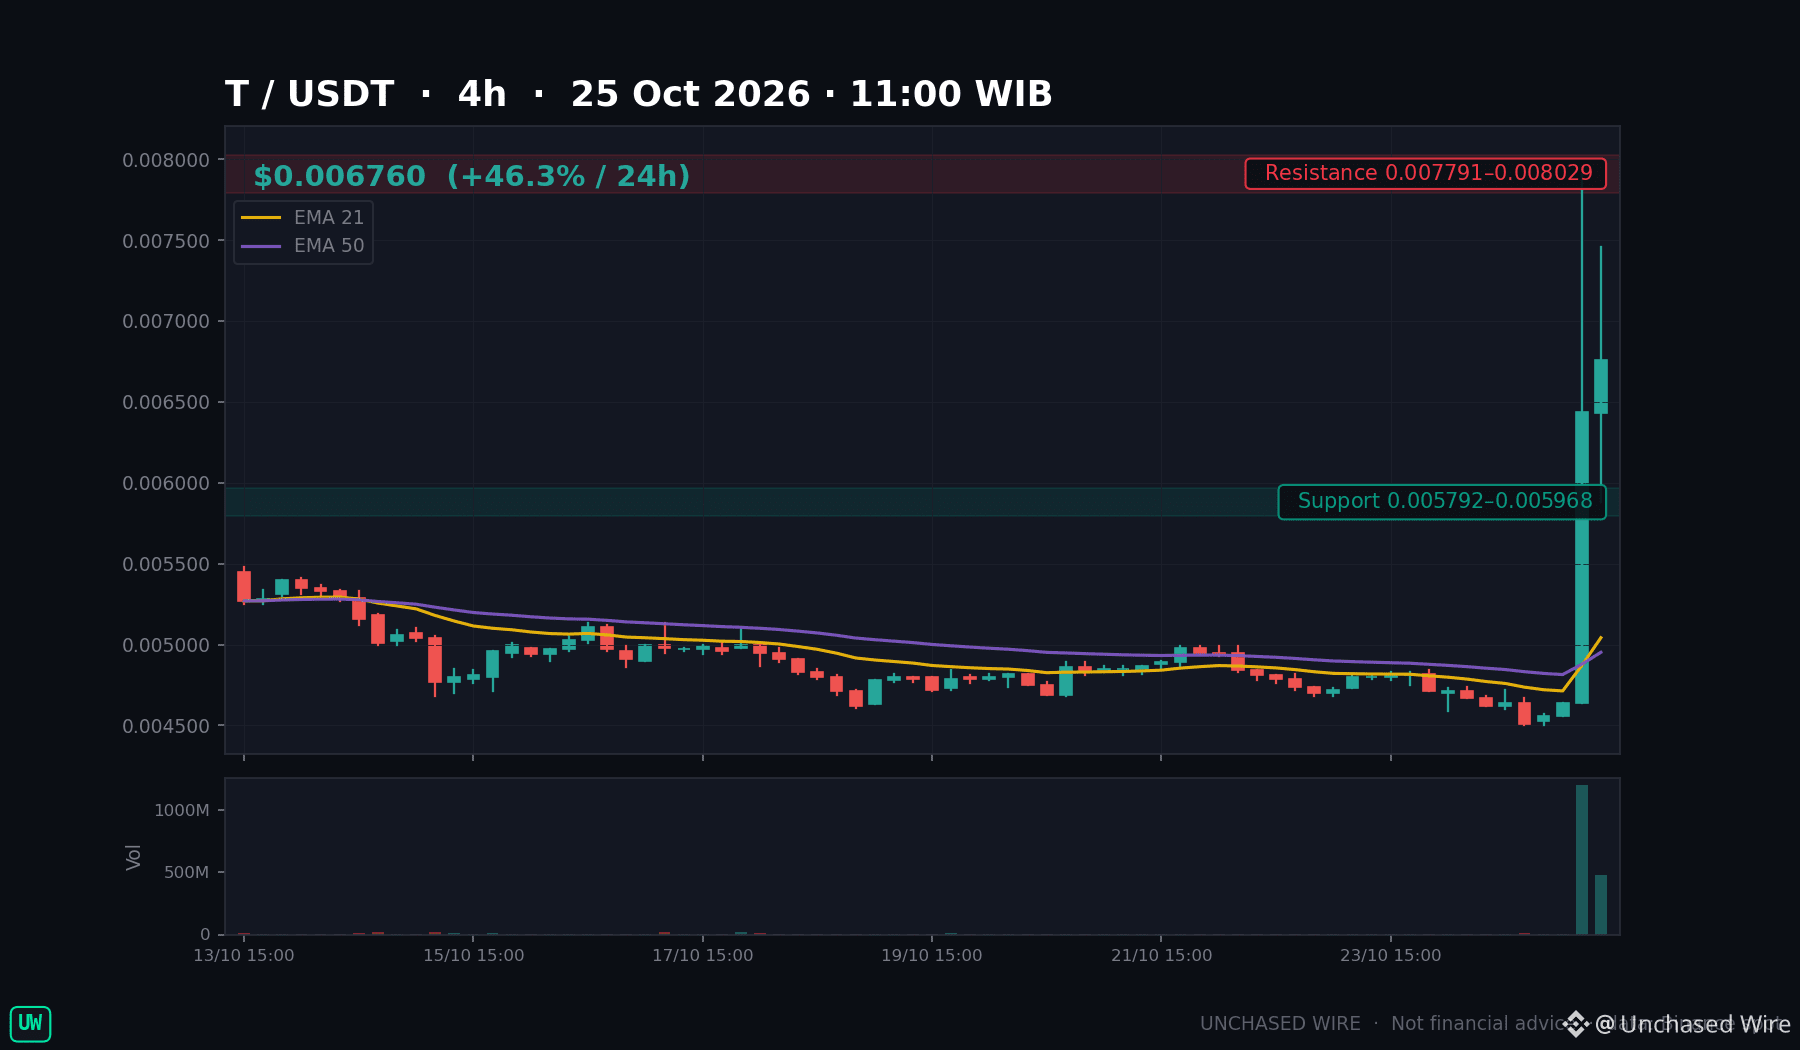
One 4-hour candle traded 1.2 billion $T. The ten before it averaged under 6 million.
I'm reading that as the story: Threshold sat near $0.0046 for days, then one candle ripped to $0.00791 on volume more than 200 times the norm, and the follow-through closed above $0.0064. It now trades near $0.0068, up about 47% in 24 hours on $11.3 million of spot volume.
Threshold is the network behind threshold-cryptography tooling for dApps, the Keep–NuCypher merger coin — so this isn't a launch chasing a narrative. But I found no verified announcement behind the spike, and a one-candle move is the easiest kind to give back.
Support: $0.00588, the follow-through candle's low.
Resistance: $0.00791, the spike high.
A 4-hour close under $0.00588 re-opens the $0.0046 base; a reclaim of $0.00791 puts the spike back in play.
Your invalidation line — $0.00588, or lower?
Not financial advice.
$T #CryptoMarkets #Threshold #Volume #CryptoTrading
One 4-hour candle traded 1.2 billion $T . The ten before it averaged under 6 million.
I'm reading that as the story: Threshold sat near $0.0046 for days, then one candle ripped to $0.00791 on volume more than 200 times the norm, and the follow-through closed above $0.0064. It now trades near $0.0068, up about 47% in 24 hours on $11.3 million of spot volume.
Threshold is the network behind threshold-cryptography tooling for dApps, the Keep–NuCypher merger coin — so this isn't a launch chasing a narrative. But I found no verified announcement behind the spike, and a one-candle move is the easiest kind to give back.
Support: $0.00588, the follow-through candle's low.
Resistance: $0.00791, the spike high.
A 4-hour close under $0.00588 re-opens the $0.0046 base; a reclaim of $0.00791 puts the spike back in play.
Your invalidation line — $0.00588, or lower?
Not financial advice.
$T #CryptoMarkets #Threshold #Volume #CryptoTrading
29
·
--
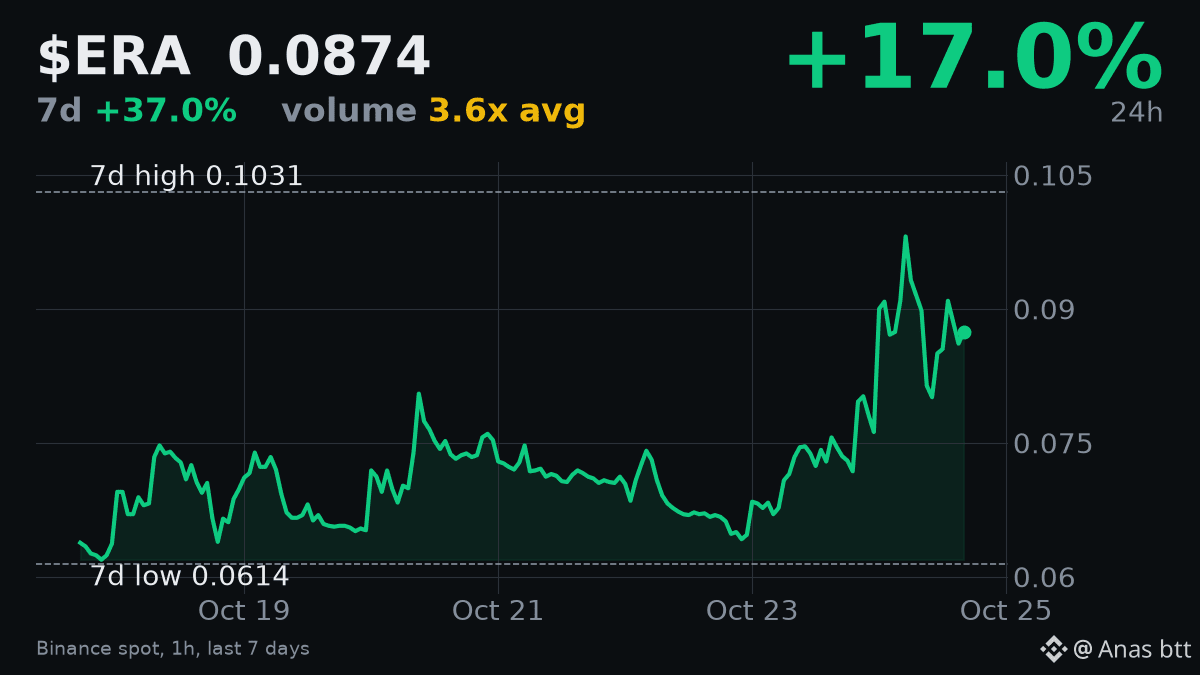
$ERA trading volume is significantly high today, at 3.646 times its 7-day average, with $27.64 million exchanged. The coin is currently priced at $0.0874, having surged 17.001% in the last 24 hours and 36.991% over the past seven days. Despite these strong gains, $ERA remains 15.228% below its 7-day high of $0.1031.
The 14-hour RSI is at 54.8, indicating neutral momentum. While the elevated volume suggests genuine interest, the inability to hold its recent high means I am not ready for a strong directional call. My view is neutral for now. I would turn bullish if $ERA can reclaim and hold above the $0.1031 level on good volume. A drop below $0.07 would suggest further consolidation or a deeper pullback.
I am watching for confirmation of either a breakout or a clear support level.
#ERACoin #Volume
170

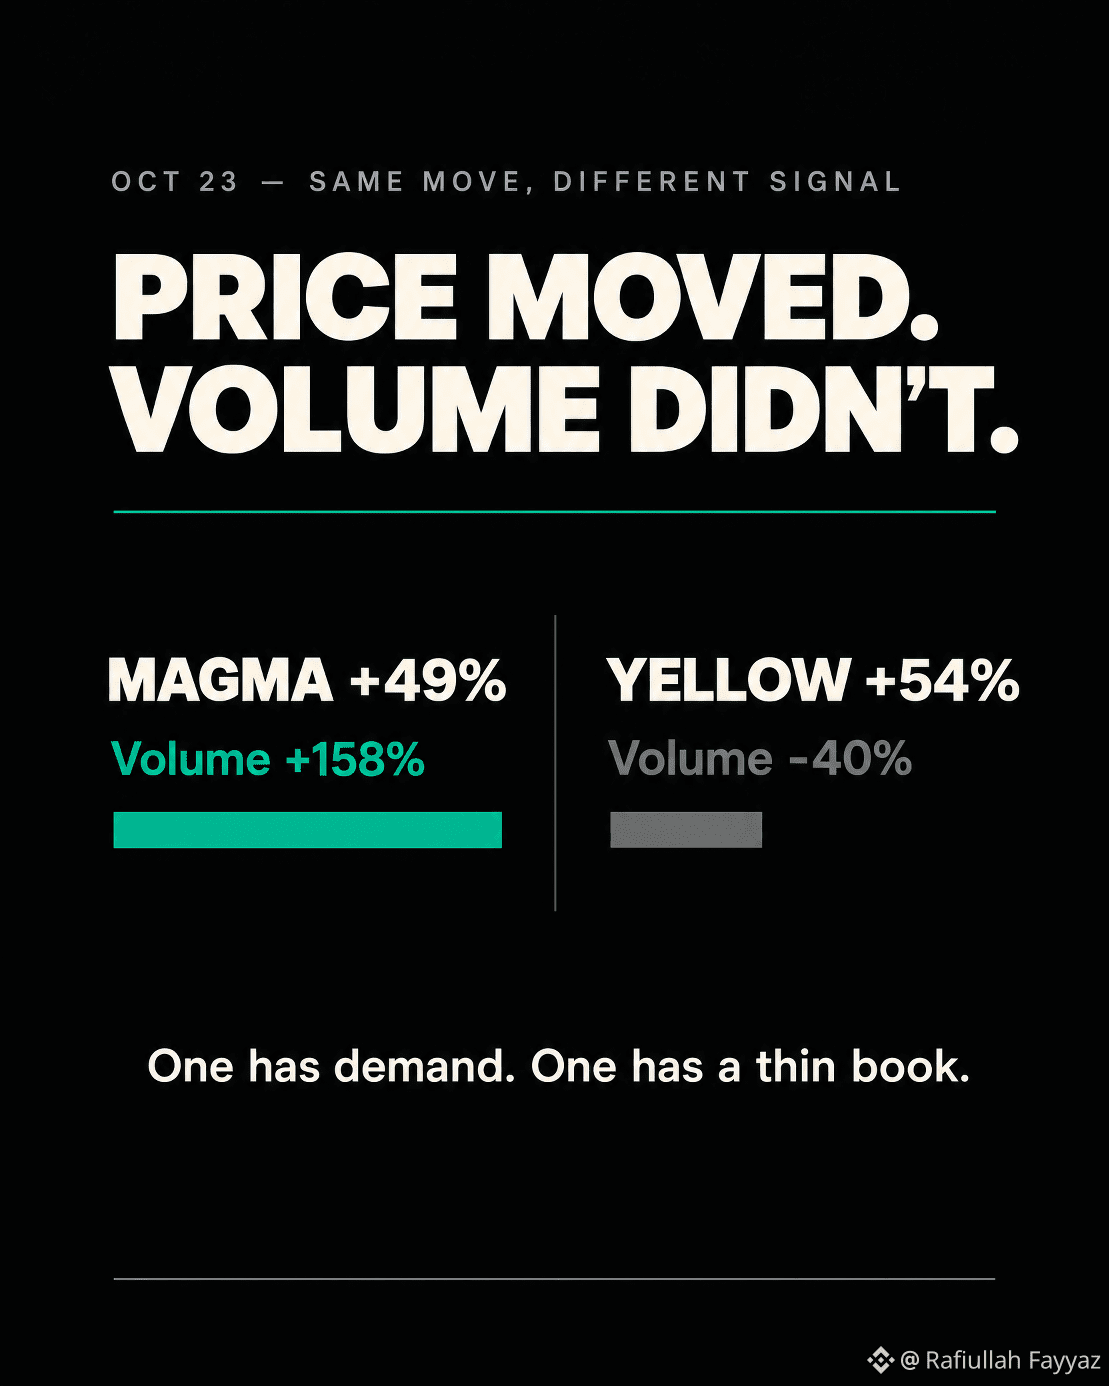
MAGMA is up 49% today. Volume rose 158%. The trigger wasn't news — whale wallets opened $1.5M in 2x leveraged longs, and the low float did the rest.
Yellow is also up 54%. But volume fell 40%.
Same green candle. Opposite confirmation.
A price move on rising volume means real demand is meeting the sellers. A price move on falling volume means the order book is thin and a few buys moved the price.
MAGMA has volume behind it. Yellow doesn't.
$MAGMA
#crypto #research #Volume #Marketstructure #BinanceSquareFamily
{future}(MAGMAUSDT)
MAGMA is up 49% today. Volume rose 158%. The trigger wasn't news — whale wallets opened $1.5M in 2x leveraged longs, and the low float did the rest.
Yellow is also up 54%. But volume fell 40%.
Same green candle. Opposite confirmation.
A price move on rising volume means real demand is meeting the sellers. A price move on falling volume means the order book is thin and a few buys moved the price.
MAGMA has volume behind it. Yellow doesn't.
$MAGMA
#crypto #research #Volume #Marketstructure #BinanceSquareFamily
324

🚀 Why does a dip with solid volume matter?
$NEAR just slid ‑0.9% in the last 24 h, sitting around $4.93 with a 24‑hour volume of $107 M. The price drop alone could be dismissed as noise, but the hefty trading volume tells a different story. When volume spikes alongside a move, it confirms that real participants—buyers and sellers—are active, giving the price action credibility. In contrast, a low‑volume dip often fizzles out because only a few hands are moving the market.
By watching volume, you can filter false breakouts and decide whether a pull‑back is a genuine correction or a temporary wobble. If the volume stays high on a down move, expect the price to keep testing lower levels; if it dries up, the market may be ready to bounce.
💡 How do you currently use volume to validate your entry or exit points?
#CryptoEducation #Volume
We post every algo signal's REAL result openly and the full live track record + a free preview channel are in our bio/profile.
25

·
--
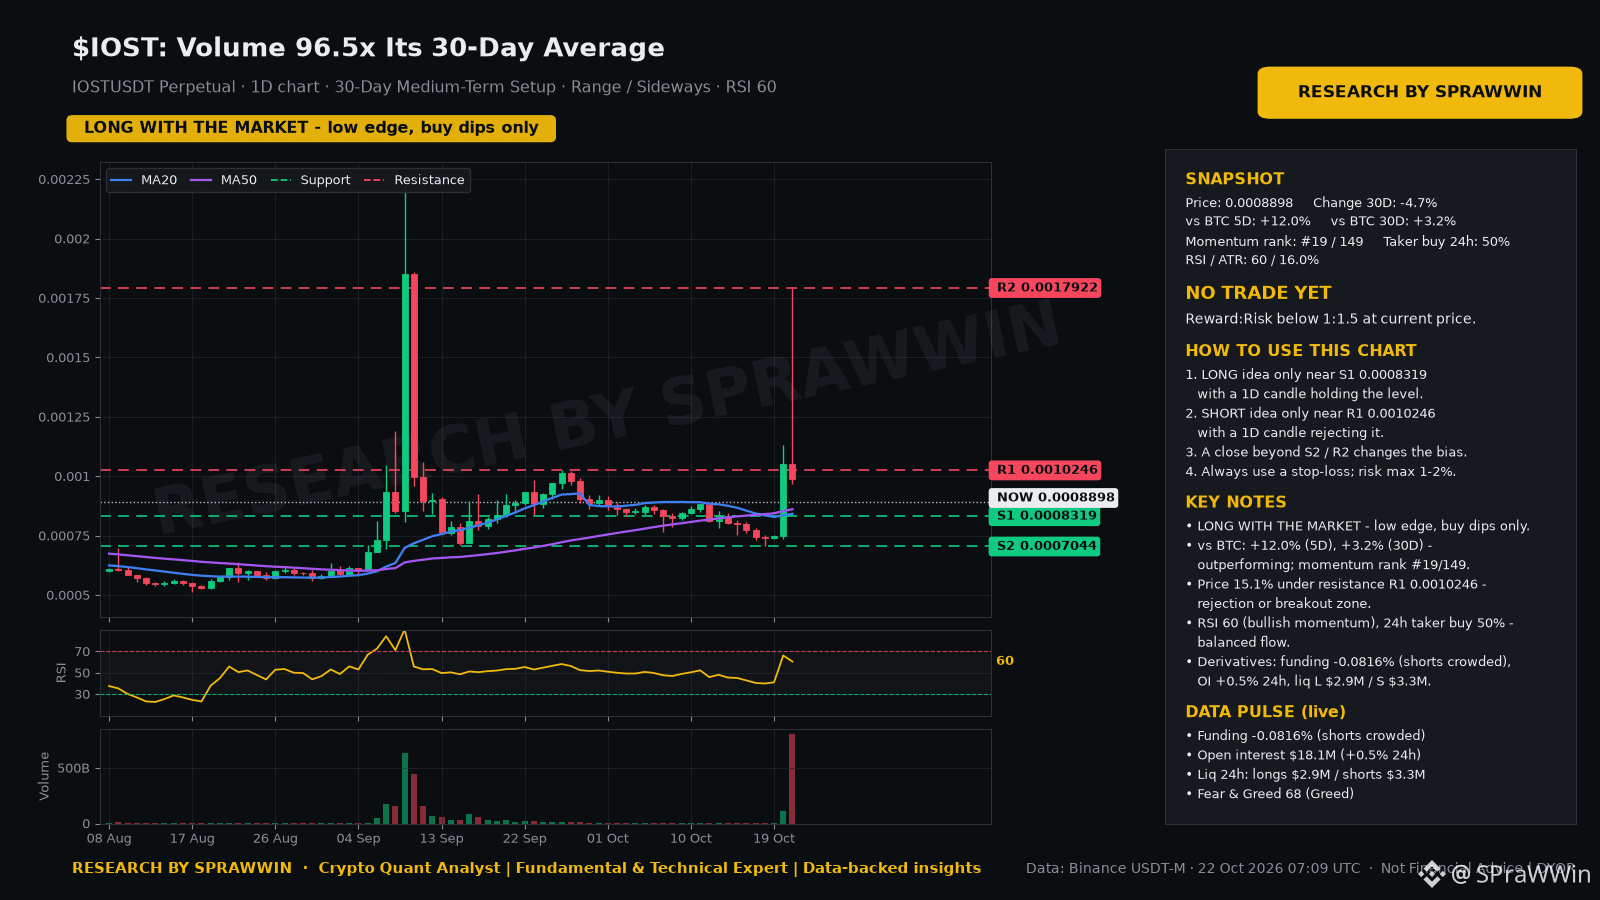
$IOST: Volume 96.5x Its 30-Day Average
The data leans bullish. Price 0.0008899 · trend: uptrend · daily RSI 60
What stands out:
• 24h volume is 96.5x the 30-day average — unusual attention on this coin.
• Open interest moved -16.8% in 24h (now 10M USD) — leverage is being flushed out.
• Still 65% below its 1-year high — deep drawdown; rallies may meet supply.
Quant outlook (measured, not guessed):
• Next 24h, 68% range: 0.0007944 – 0.0009969. This band held on 75% of days over the past year.
• Next 7 days, 68% range: 0.0006589 – 0.0012018 (90%: 0.0005428 – 0.0014589).
• 30D momentum: middle of the pack (top 48%), where history shows no edge either way.
• 24h direction is close to a coin flip in our backtests, so trade the levels, not a forecast.
Key levels: support 0.0008319 / 0.0007044 · resistance 0.0010246 / 0.0017922
Plan: no clean reward-to-risk right now. A daily close above 0.0010246 or below 0.0008319 sets the next move.
💬 What do you think is driving the volume spike?
Not financial advice · DYOR · Data: Binance Futures
$IOST #IOST #Volume #CryptoAnalysis
— Crypto Quant Analyst | Fundamental & Technical Expert | Data-backed insights
$IOST : Volume 96.5x Its 30-Day Average
The data leans bullish. Price 0.0008899 · trend: uptrend · daily RSI 60
What stands out:
• 24h volume is 96.5x the 30-day average — unusual attention on this coin.
• Open interest moved -16.8% in 24h (now 10M USD) — leverage is being flushed out.
• Still 65% below its 1-year high — deep drawdown; rallies may meet supply.
Quant outlook (measured, not guessed):
• Next 24h, 68% range: 0.0007944 – 0.0009969. This band held on 75% of days over the past year.
• Next 7 days, 68% range: 0.0006589 – 0.0012018 (90%: 0.0005428 – 0.0014589).
• 30D momentum: middle of the pack (top 48%), where history shows no edge either way.
• 24h direction is close to a coin flip in our backtests, so trade the levels, not a forecast.
Key levels: support 0.0008319 / 0.0007044 · resistance 0.0010246 / 0.0017922
Plan: no clean reward-to-risk right now. A daily close above 0.0010246 or below 0.0008319 sets the next move.
💬 What do you think is driving the volume spike?
Not financial advice · DYOR · Data: Binance Futures
$IOST #IOST #Volume #CryptoAnalysis
— Crypto Quant Analyst | Fundamental & Technical Expert | Data-backed insights
1
316

·
--
Bullish
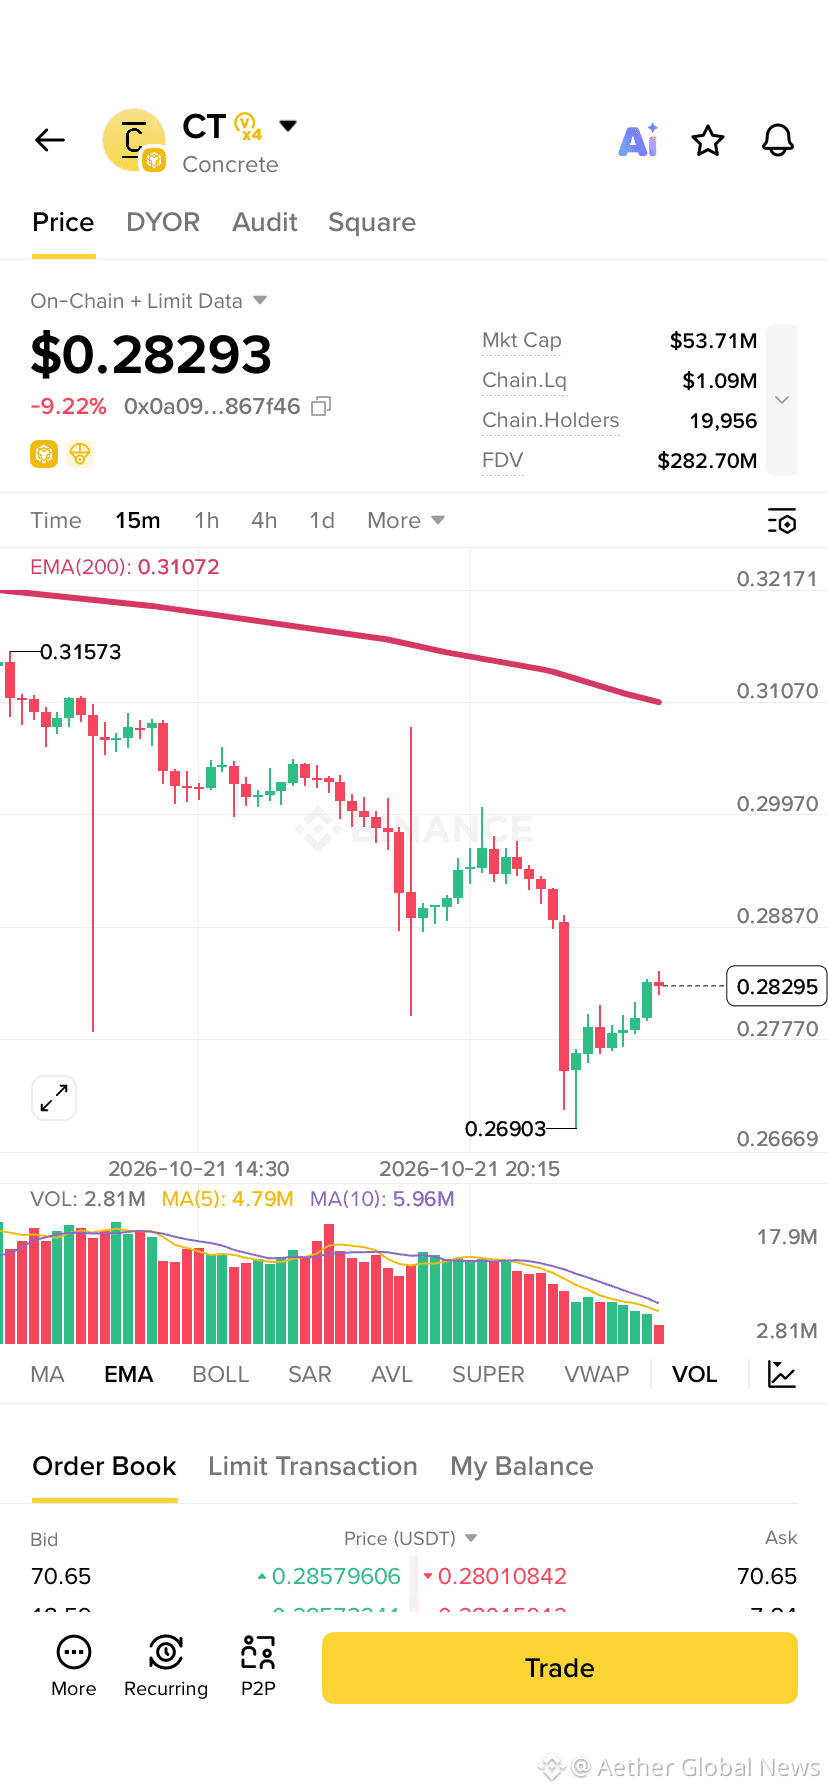
$CT Today top 1 alpha volume
over 900 million volume traded alpha CT
$DNA holding second first around $250 million
$DGAI placing third as volume #EarningsSeason #Volume #bnb #ALPHA
$CT Today top 1 alpha volume
over 900 million volume traded alpha CT
$DNA holding second first around $250 million
$DGAI placing third as volume #EarningsSeason #Volume #bnb #ALPHA
over 900 million volume traded alpha CT
$DNA holding second first around $250 million
$DGAI placing third as volume #EarningsSeason #Volume #bnb #ALPHA

Follow get packet
From Aether Global News
4
1.5k
Ever wondered why a 2% rally can feel so shaky?
Right now $BTC is up 2.0% in 24 h, sitting at $83,830 with a whopping $1.143 B of volume. The price jump looks strong, but the real test is the volume behind it. High, sustained volume means many traders are backing the move, turning a short‑term spike into a credible trend. If the price rose on thin volume, it would likely snap back as soon as a few larger players step in.
Key takeaway: always match price action with volume spikes. A genuine breakout should be accompanied by volume at least 1.5‑2× the recent average; anything less is a red flag.
What’s the most reliable volume signal you’ve used to confirm a move? $BTC
We post every algo signal’s REAL result openly, and the full live track record + a free preview channel are in our bio/profile. #CryptoEducation #Volume
30
·
--
两只宽基ETF成交额暴增!上证50ETF破60亿,科创50ETF近100亿。市场交投活跃,投资者信心回暖。ETF市场热度持续,加密ETF未来值得期待!
#ETF #成交量
$BTC
Massive volume surge in two major ETFs! SSE 50 ETF exceeded 6B yuan while STAR 50 ETF hit nearly 10B yuan. Active trading indicates improving market sentiment. As ETF markets heat up, keep an eye on potential crypto ETF developments - they could be the next big thing!
#ETF #Volume
$BTC
44
Why does a sudden jump in volume matter more than price moves?
Take $SUI as a live case: it’s down 4.4% in the last 24 h, trading around $1.0397, while 24‑hour volume spiked to $76 M. The price dip alone could signal weakness, but the hefty volume tells a different story. High volume confirms that many traders are actively buying or selling, adding credibility to the move. If the volume had stayed low, the dip might have been a false alarm—easily filled by a single large order.
In this scenario, the surge in volume suggests that the market is absorbing the sell‑off, which often precedes a stabilization or even a rebound. Traders watch for such volume confirmation to decide whether to hold, add, or exit positions, rather than reacting to price alone.
What volume clues have helped you avoid a bad trade recently?
we post every algo signal's REAL result openly and the full live track record + a free preview channel are in our bio/profile. #CryptoEducation #Volume
44

·
--
🚨 Q 涨疯了!24H 涨幅达 16.5%,1小时再拉 11.5%,成交量放大 22.7 倍,现价约 $0.032!
但真正奇怪的是:OI 同时上升 13.1%,散户看多情绪冲到 14.5 倍,X 已有 156 次提及,却没有 KOL 参与,情绪明显拥挤。
📊 这意味着什么?所有人都怕踏空,追涨资金正在加速涌入;可一旦量能撤退,最晚进场的人,可能就成了最后一棒。看对方向,不代表能在高位全身而退。
我的看法:短线趋势偏多,但绝不盲目追高!量能继续维持,才有机会延续;一旦放量衰退、冲高失败,要警惕多头拥挤后的快速回吐。数据部分仍待核验。
你觉得 Q 下一步是继续冲高,还是量能一撤直接回吐?👇 #volume-spike #crowded-longs
但真正奇怪的是:OI 同时上升 13.1%,散户看多情绪冲到 14.5 倍,X 已有 156 次提及,却没有 KOL 参与,情绪明显拥挤。
📊 这意味着什么?所有人都怕踏空,追涨资金正在加速涌入;可一旦量能撤退,最晚进场的人,可能就成了最后一棒。看对方向,不代表能在高位全身而退。
我的看法:短线趋势偏多,但绝不盲目追高!量能继续维持,才有机会延续;一旦放量衰退、冲高失败,要警惕多头拥挤后的快速回吐。数据部分仍待核验。
你觉得 Q 下一步是继续冲高,还是量能一撤直接回吐?👇 #volume-spike #crowded-longs
14

·
--
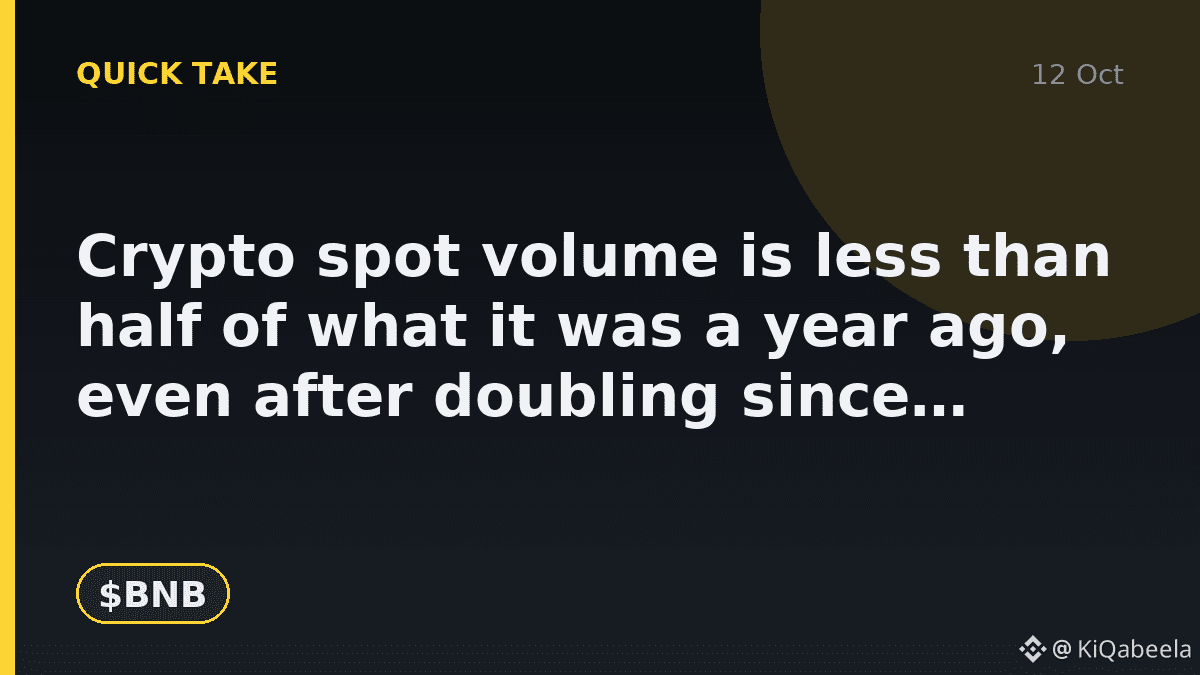
Crypto spot volume is less than half of what it was a year ago, even after doubling since August.
CoinDesk Research puts the four-week average to September 27 at about $279B per week on centralized exchanges. The crash week of October 2025 saw $801B, and August bottomed near $135B.
My take: the market feels busier than summer, but it is nowhere near the frenzy that set up last year's wipeout. Lower volume with deeper order books for the majors is, in my view, a healthier mix. Exchange tokens such as $BNB tend to track how much people trade, so this is worth watching.
💬 Does lower volume worry you or reassure you?
#Crypto #Volume
13
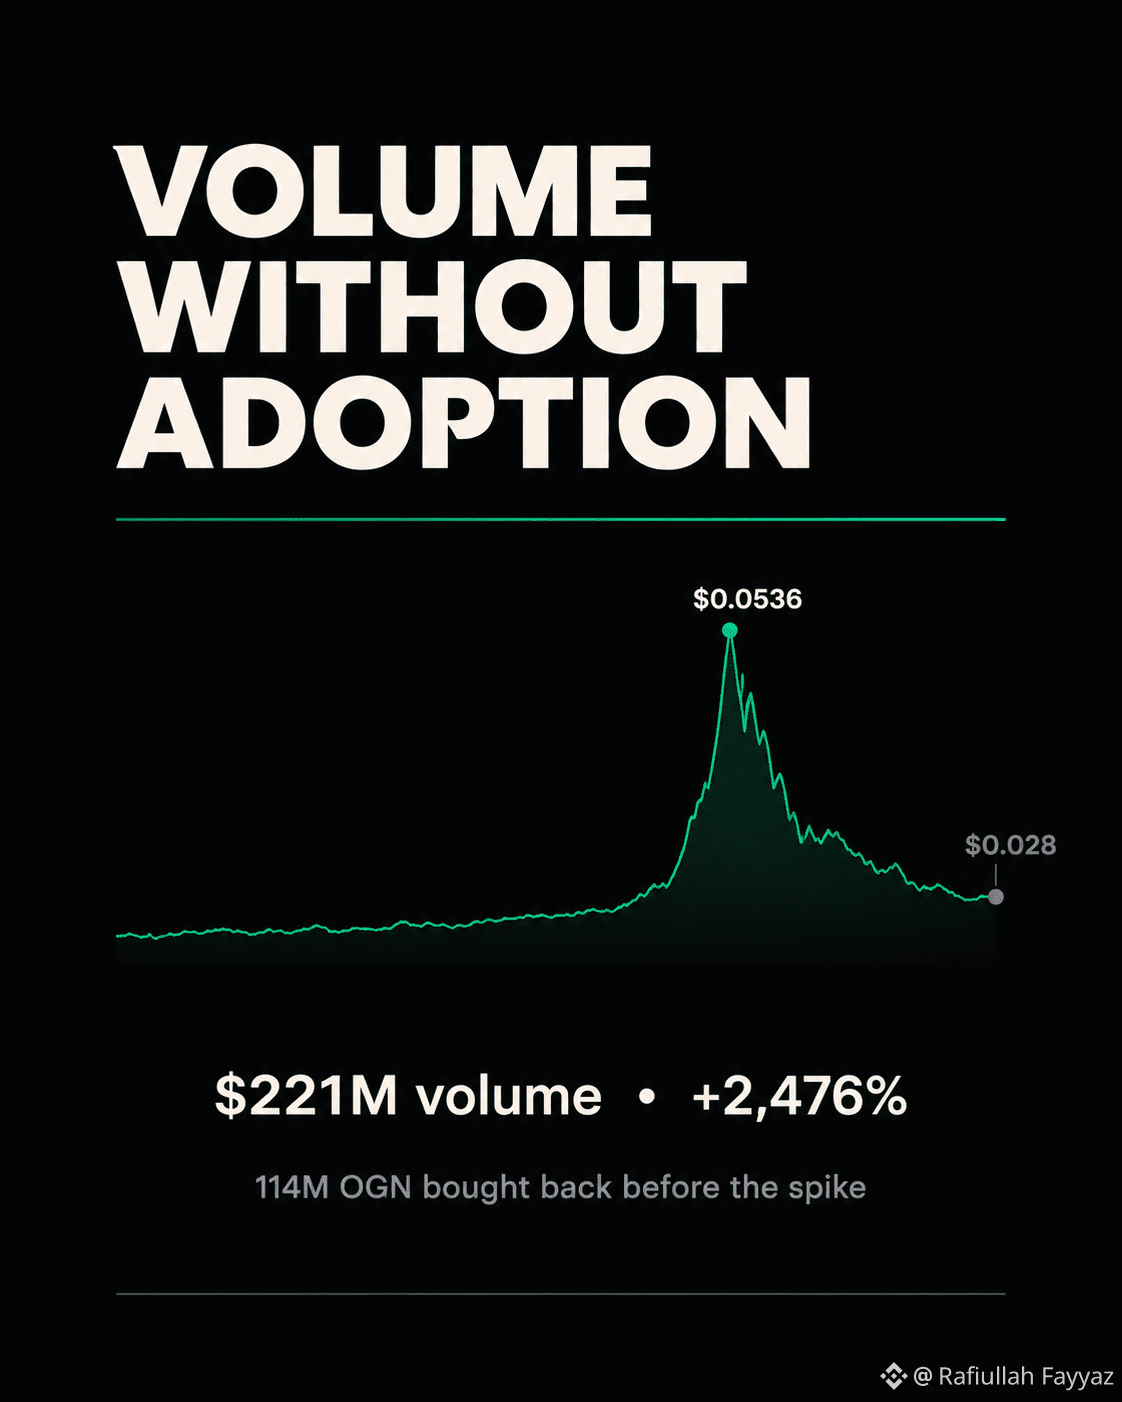
OGN went from $0.0175 to $0.0536 in a day. Volume hit $221M — a 2,476% jump.
Then it gave most of it back. Down 47% from the high now.
That's the pattern worth studying. Origin Protocol had already bought back 114M OGN by end of September. Real supply reduction. But the rally overshot on thin liquidity, and the unwind was just as violent.
Volume like that doesn't mean adoption. It means a crowded trade found an exit.
$OGN
#Marketpulse #Volume #BinanceSquare
{spot}(OGNUSDT)
OGN went from $0.0175 to $0.0536 in a day. Volume hit $221M — a 2,476% jump.
Then it gave most of it back. Down 47% from the high now.
That's the pattern worth studying. Origin Protocol had already bought back 114M OGN by end of September. Real supply reduction. But the rally overshot on thin liquidity, and the unwind was just as violent.
Volume like that doesn't mean adoption. It means a crowded trade found an exit.
$OGN
#Marketpulse #Volume #BinanceSquare
266

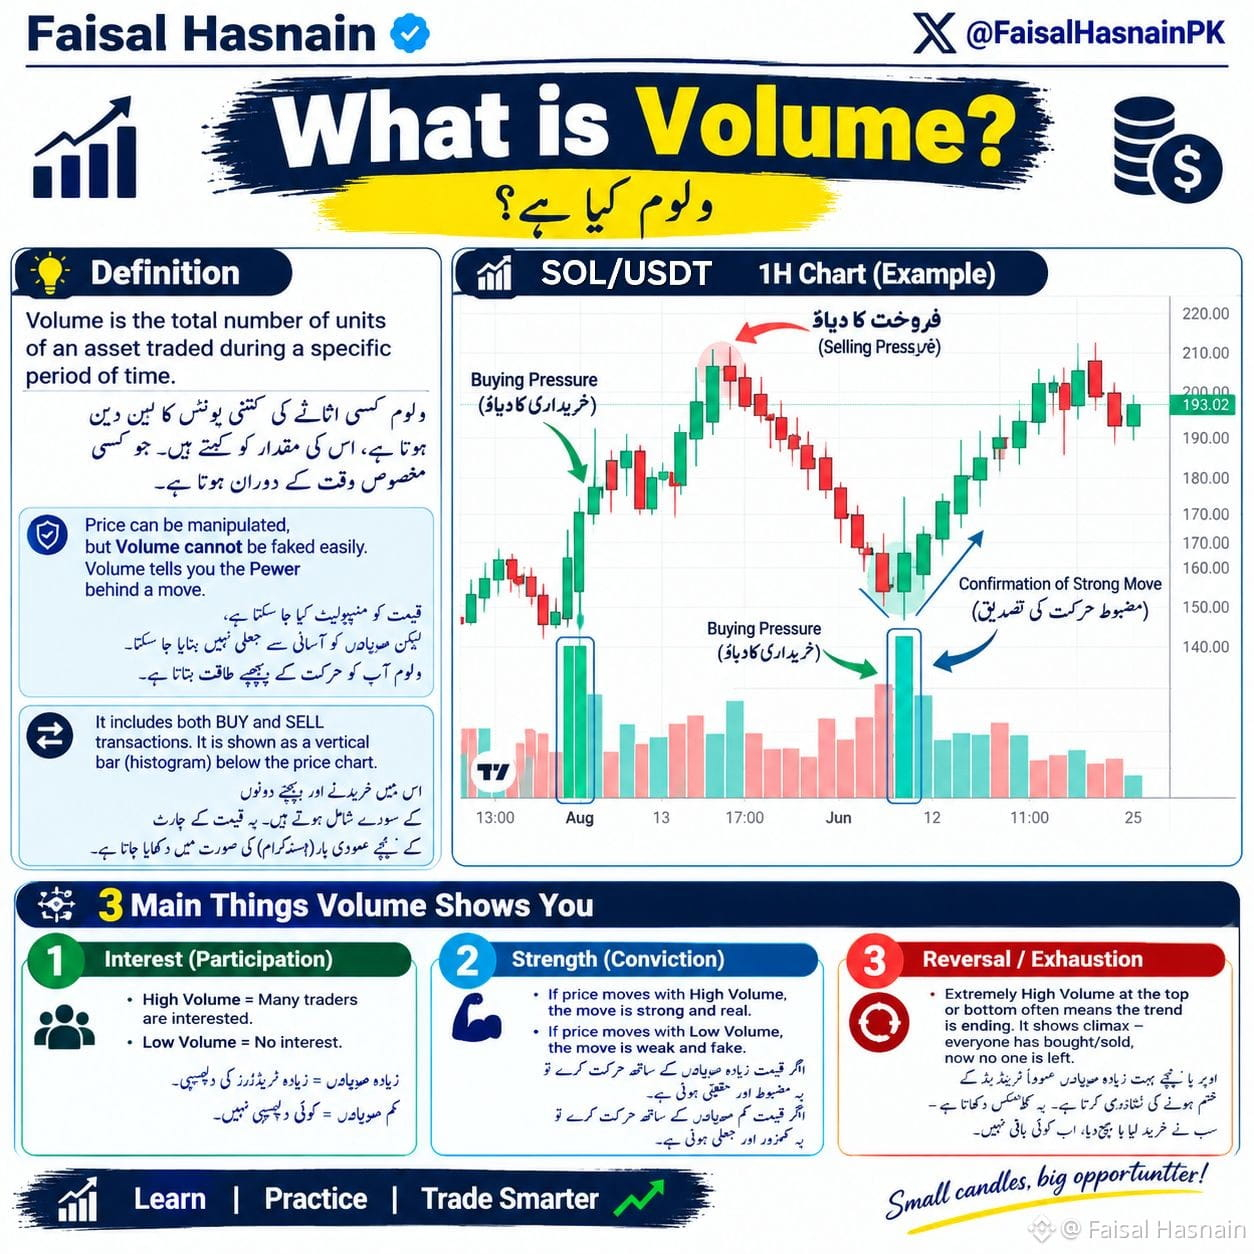
What is Volume? 📊
Volume is the total number of units of an asset traded during a specific period of time. 💱
Price can be manipulated, but Volume cannot be faked easily. Volume tells you the Power behind a move. 💪
It includes both BUY and SELL transactions. It is shown as a vertical bar (histogram) below the price chart. 📈
3 Main Things Volume Shows You: 👇
1️⃣ Interest (Participation):
High Volume = Many traders are interested 👀
Low Volume = No interest 😴
2️⃣ Strength (Conviction):
If price moves with High Volume, the move is strong and real ✅
If price moves with Low Volume, the move is weak and fake ⚠️
3️⃣ Reversal / Exhaustion:
Extremely High Volume at the top or bottom often means the trend is ending. It shows climax - everyone has bought/sold, now no one is left 🔄
Example 💡:
SOL pumps with a big green candle but Volume is very low = Trap 🪤 Don't Buy.
SOL pumps with a big green candle and Volume is also high = Real Move 🚀 You can Buy.
Price tells you WHAT happened.
Volume tells you WHY it happened.
#trading #Volume #priceaction #FaisalHasnain $BTC $SOL
124
📉 Why is $SUI sliding 6.9% in the last 24 h while its 24‑hour volume surged to $84 M? This is a textbook case of **volume confirmation**, a simple yet powerful way to gauge whether a price move has real backing.
When price drops and volume spikes, sellers are stepping in with conviction, turning a minor dip into a potentially sustained downtrend. Conversely, a price rise on low volume often signals a weak rally that can reverse quickly. In $SUI’s case, the heavy sell‑side volume confirms the bearish pressure, suggesting the current $1.122 level may act as a short‑term support if the sell‑off eases.
🔎 Keep an eye on the volume bars: a clear rise together with price movement usually validates the direction, while a divergence warns of a possible reversal.
Do you spot similar volume‑price mismatches in other coins? #CryptoEducation #Volume
We post every algo signal's REAL result openly and the full live track record + a free preview channel are in our bio/profile.
📉 Why is $SUI sliding 6.9% in the last 24 h while its 24‑hour volume surged to $84 M? This is a textbook case of **volume confirmation**, a simple yet powerful way to gauge whether a price move has real backing.
When price drops and volume spikes, sellers are stepping in with conviction, turning a minor dip into a potentially sustained downtrend. Conversely, a price rise on low volume often signals a weak rally that can reverse quickly. In $SUI ’s case, the heavy sell‑side volume confirms the bearish pressure, suggesting the current $1.122 level may act as a short‑term support if the sell‑off eases.
🔎 Keep an eye on the volume bars: a clear rise together with price movement usually validates the direction, while a divergence warns of a possible reversal.
Do you spot similar volume‑price mismatches in other coins? #CryptoEducation #Volume
We post every algo signal's REAL result openly and the full live track record + a free preview channel are in our bio/profile.
61
·
--
Article
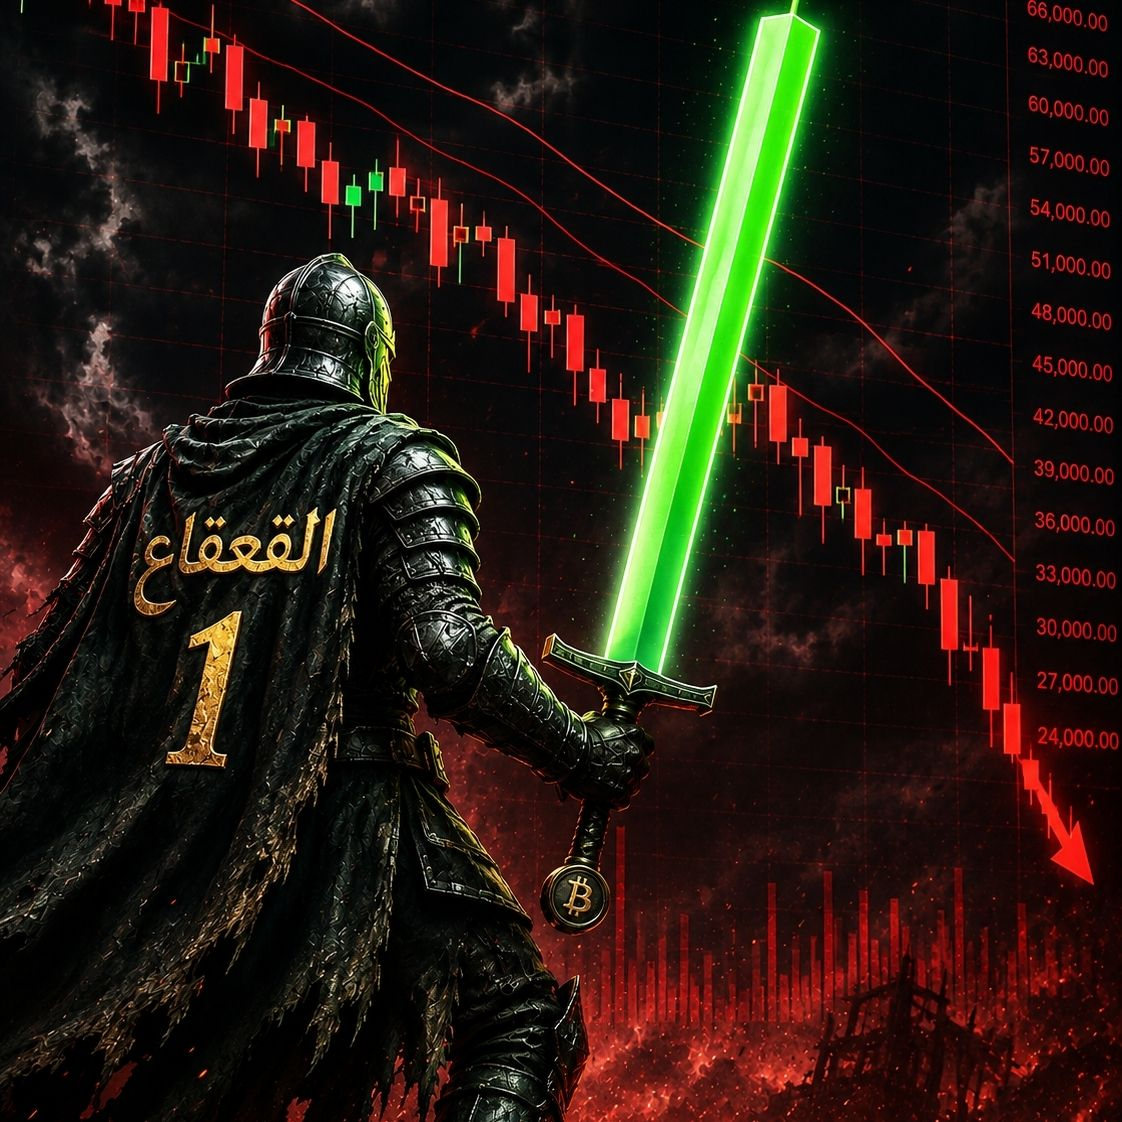
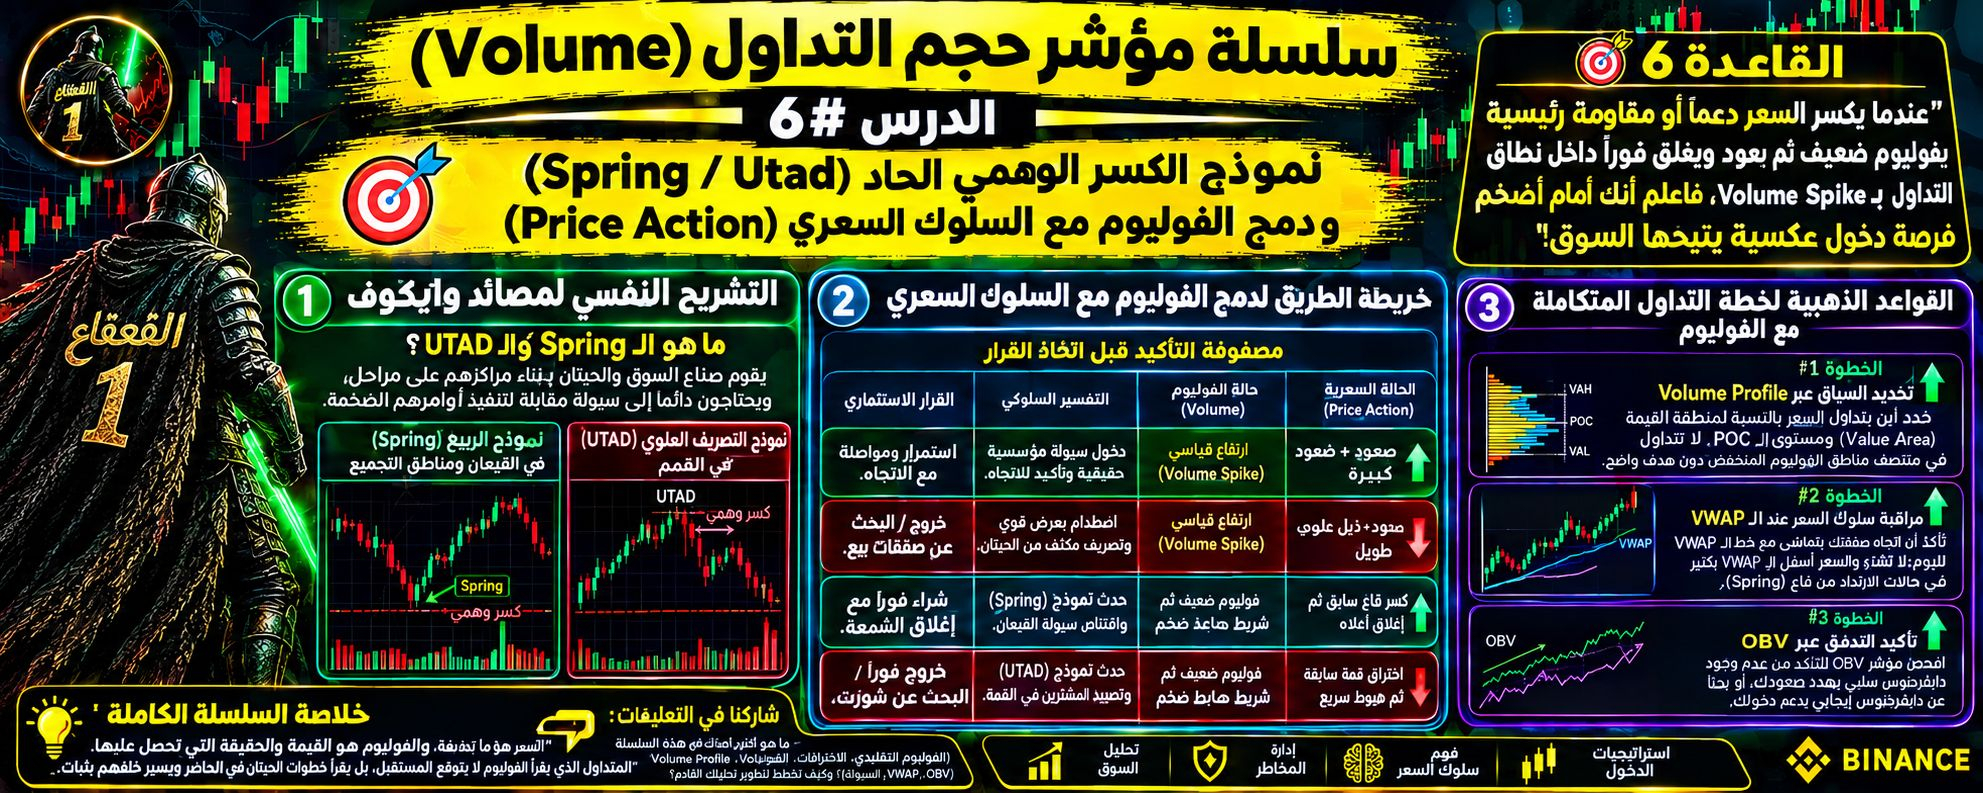
سلسلة مؤشر حجم التداول (Volume) الدرس #6 نموذج الكسر الوهمي الحاد (Spring / Utad) ودمج مع (PA)مرحباً بكم زملائي المتداولين! أهلاً بكم في المحطة السادسة والختامية من سلسلتنا التعليمية لـ Volume. بعد أن قطعنا شوطاً كبيراً في فهم الفوليوم الزمني، الاختراقات، Volume Profile، مؤشر OBV، ومؤشر VWAP، حان الوقت لدمج هذه المهارات في استراتيجية تداول متكاملة تعتمد على مدرسة وايكوف (Wyckoff Method) واقتناص مصائد السيولة (Liquidity Traps).
---
🎯 القاعدة #6: "عندما يكسر السعر دعماً أو مقاومة رئيسية بفوليوم ضعيف ثم يعود ويغلق فوراً داخل نطاق التداول بـ Volume Spike، فاعلم أنك أمام أضخم فرصة دخول عكسية يتيحها السوق!"
---
💡 1️⃣ التشريح النفسي لمصائد وايكوف: ما هو الـ Spring والـ UTAD؟
يقوم صناع السوق والحيتان ببناء مراكزهم على مراحل، ويحتاجون دائماً إلى سيولة مقابلة (Counter-liquidity) لتنفيذ أوامرهم الضخمة:
• نموذج الربيع (Spring) - في القيعان ومناطق التجميع:
1. يكون السعر في نطاق تجميعي جانبي (Accumulation Range).
2. يقوم صانع السوق بكسر خط الدعم السفلي لإيهام المتداولين بالهبوط وتفعيل أوامر وقف الخسارة (Stop Losses) للمشترين.
3. البصمة الحقيقية: يكون الفوليوم أثناء الكسر منخفضاً أو يجف فوراً، أو يتلوه مباشرة شمعة ابتلاعية صاعدة بـ Volume Spike ضخم يعيد السعر فوق الدعم.
• نموذج التصريف العلوي (UTAD - Upthrust After Distribution) - في القمم:
1. اختراق حاد لأعلى مستوى مقاومة في نطاق جانبي.
2. يهدف للفت انتباه المشترين الأفراد لشراء الارتفاع، واستهداف وقف خسارة صفقات البيع.
3. يعود السعر سريعاً ويهبط بداخل النطاق بشمعة هابطة وفوليوم بيعي قياسي.
---
🧬 2️⃣ خريطة الطريق لدمج الفوليوم مع السلوك السعري (Price Action Matrix)
لتنفيذ صفقات عالية الدقة، استخدم مصفوفة التأكيد التالية قبل اتخاذ القرار:
| الحالة السعرية (Price Action) | حالة الفوليوم (Volume) | التفسير السلوكي | القرار الاستثماري |
| :--- | :--- | :--- | :--- |
| صعود + شمعة زخم كبيرة | ارتفاع قياسي (Volume Spike) | دخول سيولة مؤسسية حقيقية وتأكيد للاتجاه. | استمرار ومواصلة مع الاتجاه. |
| صعود + ذيل علوي طويل | ارتفاع قياسي (Volume Spike) | اصطدام بعرض قوي وتصريف مكثف من الحيتان. | خروج / البحث عن صفقات بيع. |
| كسر قاع سابق ثم إغلاق أعلاه | فوليوم ضعيف ثم شريط صاعد ضخم | حدث نموذج (Spring) واقتناص سيولة القيعان. | شراء فوراً مع إغلاق الشمعة. |
| اختراق قمة سابقة ثم هبوط سريع | فوليوم ضعيف ثم شريط هابط ضخم | حدث نموذج (UTAD) وتصييد المشترين في القمة. | خروج فوراً / البحث عن شورت. |
---
🔍 3️⃣ القواعد الذهبية لخطة التداول المتكاملة مع الفوليوم
لكي تصبح متداولاً يعتمد على الفوليوم كركيزة أساسية، اتبع هذه الخطوات الثلاث في كل صفقة:
• الخطوة #1 (تحديد السياق عبر Volume Profile):
حدد أين يتداول السعر بالنسبة لمنطقة القيمة (Value Area) ومستوى الـ POC. لا تتداول في منتصف مناطق الفوليوم المنخفض دون هدف واضح.
• الخطوة #2 (مراقبة سلوك السعر عند الـ VWAP):
تأكد أن اتجاه صفقتك يتماشى مع خط الـ VWAP لليوم؛ لا تشترِ والسعر أسفل الـ VWAP بكثير إلا في حالات الارتداد من قاع (Spring).
• الخطوة #3 (تأكيد التدفق عبر OBV):
افحص مؤشر OBV للتأكد من عدم وجود دايفرجنوس سلبي يهدد صعودك، أو بحثاً عن دايفرجنوس إيجابي يدعم دخولك.
---
⚖️ خلاصة السلسلة الكاملة:
"السعر هو ما تدفعه، والفوليوم هو القيمة والحقيقة التي تحصل عليها. المتداول الذي يقرأ الفوليوم لا يتوقع المستقبل، بل يقرأ خطوات الحيتان في الحاضر ويسير خلفهم بثبات."
---
💬 شاركونا في التعليقات:
ما هو أكثر درس أضاف لك في هذه السلسلة (الفوليوم التقليدي، الاختراقات، Volume Profile، OBV، VWAP، أو مصائد السيولة)؟ وكيف تخطط لتطوير تحليلك القادم؟
#BinanceSquare #cryptotrading #Volume #wyckoff #القعقاع_1 $NVDAB $AAPLB $AMZNB
{spot}(BTCUSDT)
{spot}(ETHUSDT)
{spot}(BNBUSDT)
سلسلة مؤشر حجم التداول (Volume) الدرس #6 نموذج الكسر الوهمي الحاد (Spring / Utad) ودمج مع (PA)
مرحباً بكم زملائي المتداولين! أهلاً بكم في المحطة السادسة والختامية من سلسلتنا التعليمية لـ Volume. بعد أن قطعنا شوطاً كبيراً في فهم الفوليوم الزمني، الاختراقات، Volume Profile، مؤشر OBV، ومؤشر VWAP، حان الوقت لدمج هذه المهارات في استراتيجية تداول متكاملة تعتمد على مدرسة وايكوف (Wyckoff Method) واقتناص مصائد السيولة (Liquidity Traps).
---
🎯 القاعدة #6: "عندما يكسر السعر دعماً أو مقاومة رئيسية بفوليوم ضعيف ثم يعود ويغلق فوراً داخل نطاق التداول بـ Volume Spike، فاعلم أنك أمام أضخم فرصة دخول عكسية يتيحها السوق!"
---
💡 1️⃣ التشريح النفسي لمصائد وايكوف: ما هو الـ Spring والـ UTAD؟
يقوم صناع السوق والحيتان ببناء مراكزهم على مراحل، ويحتاجون دائماً إلى سيولة مقابلة (Counter-liquidity) لتنفيذ أوامرهم الضخمة:
• نموذج الربيع (Spring) - في القيعان ومناطق التجميع:
1. يكون السعر في نطاق تجميعي جانبي (Accumulation Range).
2. يقوم صانع السوق بكسر خط الدعم السفلي لإيهام المتداولين بالهبوط وتفعيل أوامر وقف الخسارة (Stop Losses) للمشترين.
3. البصمة الحقيقية: يكون الفوليوم أثناء الكسر منخفضاً أو يجف فوراً، أو يتلوه مباشرة شمعة ابتلاعية صاعدة بـ Volume Spike ضخم يعيد السعر فوق الدعم.
• نموذج التصريف العلوي (UTAD - Upthrust After Distribution) - في القمم:
1. اختراق حاد لأعلى مستوى مقاومة في نطاق جانبي.
2. يهدف للفت انتباه المشترين الأفراد لشراء الارتفاع، واستهداف وقف خسارة صفقات البيع.
3. يعود السعر سريعاً ويهبط بداخل النطاق بشمعة هابطة وفوليوم بيعي قياسي.
---
🧬 2️⃣ خريطة الطريق لدمج الفوليوم مع السلوك السعري (Price Action Matrix)
لتنفيذ صفقات عالية الدقة، استخدم مصفوفة التأكيد التالية قبل اتخاذ القرار:
| الحالة السعرية (Price Action) | حالة الفوليوم (Volume) | التفسير السلوكي | القرار الاستثماري |
| :--- | :--- | :--- | :--- |
| صعود + شمعة زخم كبيرة | ارتفاع قياسي (Volume Spike) | دخول سيولة مؤسسية حقيقية وتأكيد للاتجاه. | استمرار ومواصلة مع الاتجاه. |
| صعود + ذيل علوي طويل | ارتفاع قياسي (Volume Spike) | اصطدام بعرض قوي وتصريف مكثف من الحيتان. | خروج / البحث عن صفقات بيع. |
| كسر قاع سابق ثم إغلاق أعلاه | فوليوم ضعيف ثم شريط صاعد ضخم | حدث نموذج (Spring) واقتناص سيولة القيعان. | شراء فوراً مع إغلاق الشمعة. |
| اختراق قمة سابقة ثم هبوط سريع | فوليوم ضعيف ثم شريط هابط ضخم | حدث نموذج (UTAD) وتصييد المشترين في القمة. | خروج فوراً / البحث عن شورت. |
---
🔍 3️⃣ القواعد الذهبية لخطة التداول المتكاملة مع الفوليوم
لكي تصبح متداولاً يعتمد على الفوليوم كركيزة أساسية، اتبع هذه الخطوات الثلاث في كل صفقة:
• الخطوة #1 (تحديد السياق عبر Volume Profile):
حدد أين يتداول السعر بالنسبة لمنطقة القيمة (Value Area) ومستوى الـ POC. لا تتداول في منتصف مناطق الفوليوم المنخفض دون هدف واضح.
• الخطوة #2 (مراقبة سلوك السعر عند الـ VWAP):
تأكد أن اتجاه صفقتك يتماشى مع خط الـ VWAP لليوم؛ لا تشترِ والسعر أسفل الـ VWAP بكثير إلا في حالات الارتداد من قاع (Spring).
• الخطوة #3 (تأكيد التدفق عبر OBV):
افحص مؤشر OBV للتأكد من عدم وجود دايفرجنوس سلبي يهدد صعودك، أو بحثاً عن دايفرجنوس إيجابي يدعم دخولك.
---
⚖️ خلاصة السلسلة الكاملة:
"السعر هو ما تدفعه، والفوليوم هو القيمة والحقيقة التي تحصل عليها. المتداول الذي يقرأ الفوليوم لا يتوقع المستقبل، بل يقرأ خطوات الحيتان في الحاضر ويسير خلفهم بثبات."
---
💬 شاركونا في التعليقات:
ما هو أكثر درس أضاف لك في هذه السلسلة (الفوليوم التقليدي، الاختراقات، Volume Profile، OBV، VWAP، أو مصائد السيولة)؟ وكيف تخطط لتطوير تحليلك القادم؟
#BinanceSquare #cryptotrading #Volume #wyckoff #القعقاع_1 $NVDAB $AAPLB $AMZNB
---
🎯 القاعدة #6: "عندما يكسر السعر دعماً أو مقاومة رئيسية بفوليوم ضعيف ثم يعود ويغلق فوراً داخل نطاق التداول بـ Volume Spike، فاعلم أنك أمام أضخم فرصة دخول عكسية يتيحها السوق!"
---
💡 1️⃣ التشريح النفسي لمصائد وايكوف: ما هو الـ Spring والـ UTAD؟
يقوم صناع السوق والحيتان ببناء مراكزهم على مراحل، ويحتاجون دائماً إلى سيولة مقابلة (Counter-liquidity) لتنفيذ أوامرهم الضخمة:
• نموذج الربيع (Spring) - في القيعان ومناطق التجميع:
1. يكون السعر في نطاق تجميعي جانبي (Accumulation Range).
2. يقوم صانع السوق بكسر خط الدعم السفلي لإيهام المتداولين بالهبوط وتفعيل أوامر وقف الخسارة (Stop Losses) للمشترين.
3. البصمة الحقيقية: يكون الفوليوم أثناء الكسر منخفضاً أو يجف فوراً، أو يتلوه مباشرة شمعة ابتلاعية صاعدة بـ Volume Spike ضخم يعيد السعر فوق الدعم.
• نموذج التصريف العلوي (UTAD - Upthrust After Distribution) - في القمم:
1. اختراق حاد لأعلى مستوى مقاومة في نطاق جانبي.
2. يهدف للفت انتباه المشترين الأفراد لشراء الارتفاع، واستهداف وقف خسارة صفقات البيع.
3. يعود السعر سريعاً ويهبط بداخل النطاق بشمعة هابطة وفوليوم بيعي قياسي.
---
🧬 2️⃣ خريطة الطريق لدمج الفوليوم مع السلوك السعري (Price Action Matrix)
لتنفيذ صفقات عالية الدقة، استخدم مصفوفة التأكيد التالية قبل اتخاذ القرار:
| الحالة السعرية (Price Action) | حالة الفوليوم (Volume) | التفسير السلوكي | القرار الاستثماري |
| :--- | :--- | :--- | :--- |
| صعود + شمعة زخم كبيرة | ارتفاع قياسي (Volume Spike) | دخول سيولة مؤسسية حقيقية وتأكيد للاتجاه. | استمرار ومواصلة مع الاتجاه. |
| صعود + ذيل علوي طويل | ارتفاع قياسي (Volume Spike) | اصطدام بعرض قوي وتصريف مكثف من الحيتان. | خروج / البحث عن صفقات بيع. |
| كسر قاع سابق ثم إغلاق أعلاه | فوليوم ضعيف ثم شريط صاعد ضخم | حدث نموذج (Spring) واقتناص سيولة القيعان. | شراء فوراً مع إغلاق الشمعة. |
| اختراق قمة سابقة ثم هبوط سريع | فوليوم ضعيف ثم شريط هابط ضخم | حدث نموذج (UTAD) وتصييد المشترين في القمة. | خروج فوراً / البحث عن شورت. |
---
🔍 3️⃣ القواعد الذهبية لخطة التداول المتكاملة مع الفوليوم
لكي تصبح متداولاً يعتمد على الفوليوم كركيزة أساسية، اتبع هذه الخطوات الثلاث في كل صفقة:
• الخطوة #1 (تحديد السياق عبر Volume Profile):
حدد أين يتداول السعر بالنسبة لمنطقة القيمة (Value Area) ومستوى الـ POC. لا تتداول في منتصف مناطق الفوليوم المنخفض دون هدف واضح.
• الخطوة #2 (مراقبة سلوك السعر عند الـ VWAP):
تأكد أن اتجاه صفقتك يتماشى مع خط الـ VWAP لليوم؛ لا تشترِ والسعر أسفل الـ VWAP بكثير إلا في حالات الارتداد من قاع (Spring).
• الخطوة #3 (تأكيد التدفق عبر OBV):
افحص مؤشر OBV للتأكد من عدم وجود دايفرجنوس سلبي يهدد صعودك، أو بحثاً عن دايفرجنوس إيجابي يدعم دخولك.
---
⚖️ خلاصة السلسلة الكاملة:
"السعر هو ما تدفعه، والفوليوم هو القيمة والحقيقة التي تحصل عليها. المتداول الذي يقرأ الفوليوم لا يتوقع المستقبل، بل يقرأ خطوات الحيتان في الحاضر ويسير خلفهم بثبات."
---
💬 شاركونا في التعليقات:
ما هو أكثر درس أضاف لك في هذه السلسلة (الفوليوم التقليدي، الاختراقات، Volume Profile، OBV، VWAP، أو مصائد السيولة)؟ وكيف تخطط لتطوير تحليلك القادم؟
#BinanceSquare #cryptotrading #Volume #wyckoff #القعقاع_1 $NVDAB $AAPLB $AMZNB
2
5
181

·
--
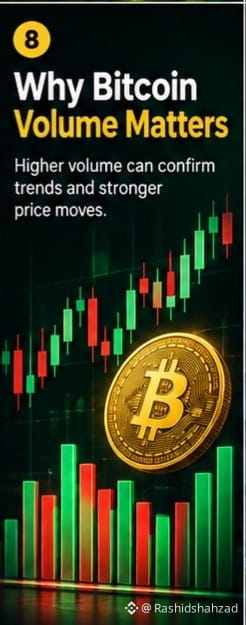
$BTC 📈 Why Volume Matters
Price movement becomes more interesting when supported by strong trading volume. Traders often use volume to judge whether a breakout or breakdown has meaningful participation.
#Bitcoin #Volume #TechnicalAnalysis
$BTC 📈 Why Volume Matters
Price movement becomes more interesting when supported by strong trading volume. Traders often use volume to judge whether a breakout or breakdown has meaningful participation.
#Bitcoin #Volume #TechnicalAnalysis
Price movement becomes more interesting when supported by strong trading volume. Traders often use volume to judge whether a breakout or breakdown has meaningful participation.
#Bitcoin #Volume #TechnicalAnalysis
77
A -5% daily drop means nothing without context. Here's how to read it.
$ZEC is sitting at $1303.54 right now, down 5% over 24 hours. But the real story is volume: $126M.
Volume confirmation is your truth-teller. When price falls on LOW volume, sellers are exhausted and a reversal often follows. When price falls on HIGH volume, strong hands are distributing and the downtrend has fuel.
The lesson? Never trade a move without checking volume first. It tells you whether the order flow behind the price action is real or fake.
So here's my question: do you check volume before entering a trade, or do you only look at price?
We post every algo signal's real result openly and the full live track record plus a free preview channel are linked in our profile.
#Volume #CryptoTrading
85
·
--
Article
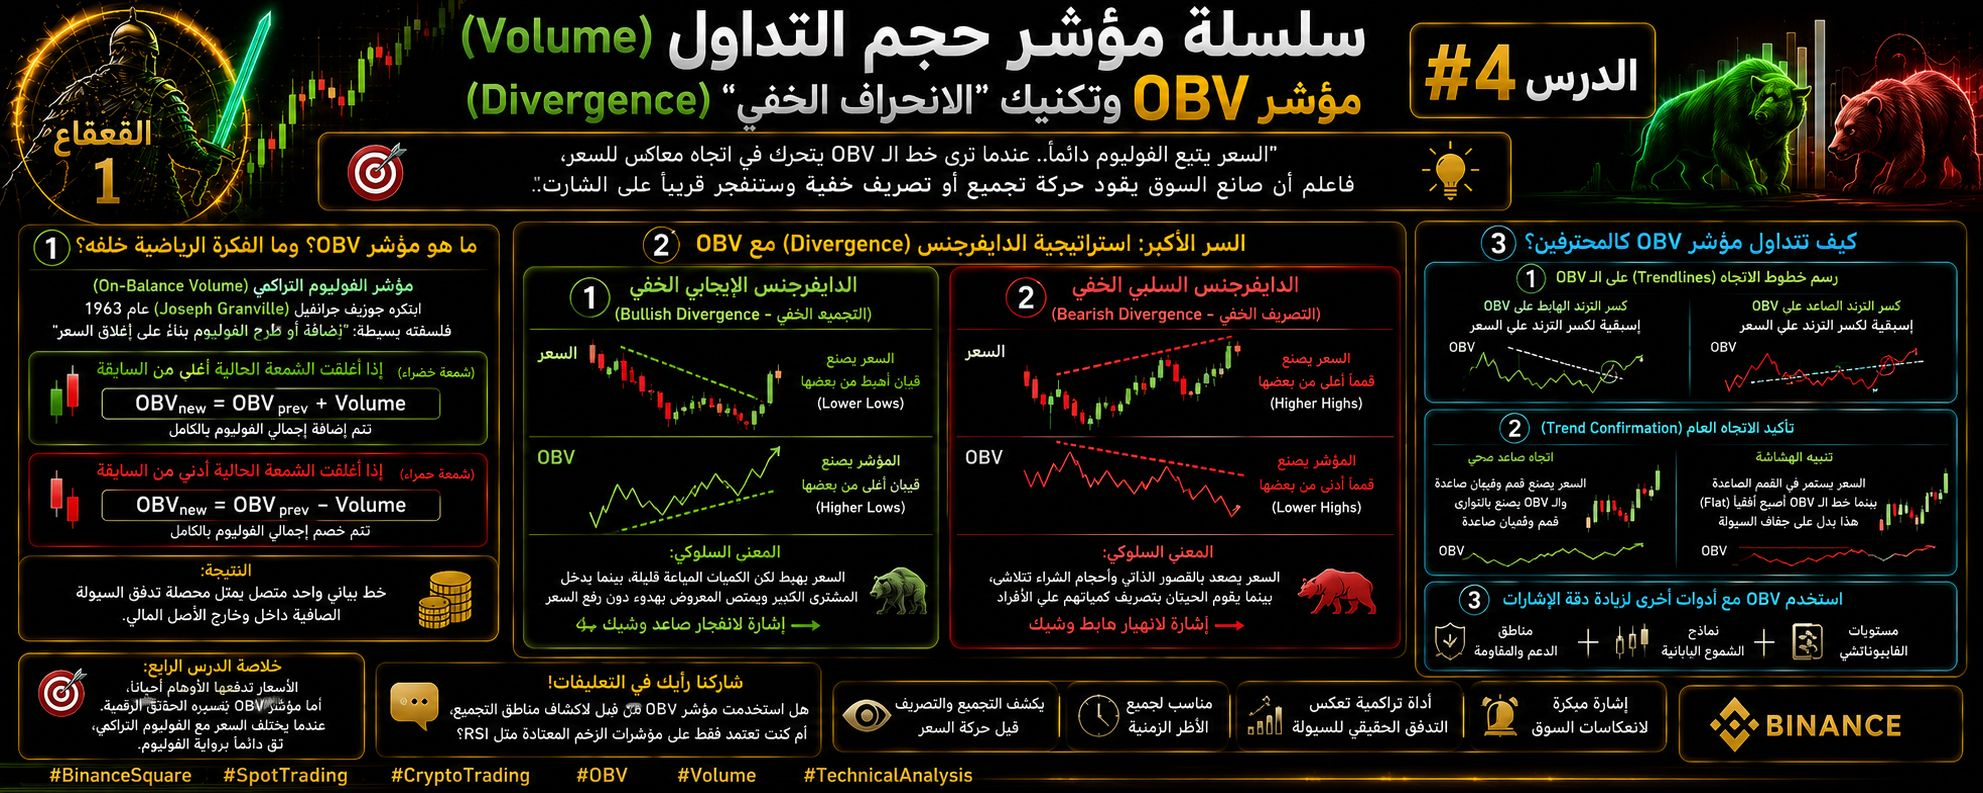
📌 سلسلة مؤشر حجم التداول (Volume) | الدرس #4: مؤشر OBV وتكنيك "الانحراف الخفي" (Divergence)مرحباً بكم زملائي المتداولين! أهلاً بكم في المحطة الرابعة من سلسلتنا. بعد أن تعلمت في الدرس السابق خريطة Volume Profile ومواقع الحيتان، سنتعلم اليوم كيف نكشف "التجميع والتصريف المباشر" حتى قبل أن يتحرك السعر، وذلك باستخدام أداة تراكمية أسطورية: مؤشر الفوليوم التراكمي (On-Balance Volume - OBV).
---
🎯 القاعدة #4: "السعر يتبع الفوليوم دائماً.. عندما ترى خط الـ OBV يتحرك في اتجاه معاكس للسعر، فاعلم أن صانع السوق يقود حركة تجميع أو تصريف خفية وستنفجر قريباً على الشارت."
---
💡 1️⃣ ما هو مؤشر OBV؟ وما الفكرة الرياضية خلفه؟
ابتكر هذا المؤشر المحلل الفني جوزيف جرانفيل (Joseph Granville) عام 1963، وتقوم فلسفته على مبدأ بسيط جداً: "إضافة فوليوم الشمعة أو طرحه بناءً على إغلاق السعر":
• إذا أغلقت الشمعة الحالية أعلى من السابقة (شمعة خضراء):
يتم إضافة إجمالي الفوليوم بالكامل إلى قيمة المؤشر التراكمي:
$$OBV_{\text{new}} = OBV_{\text{previous}} + \text{Volume}$$
• إذا أغلقت الشمعة الحالية أدنى من السابقة (شمعة حمراء):
يتم خصم إجمالي الفوليوم بالكامل من قيمة المؤشر:
$$OBV_{\text{new}} = OBV_{\text{previous}} - \text{Volume}$$
• النتيجة: خط بياني واحد متصل يمثل "محصلة تدفق السيولة" الصافية داخل وخارج الأصل المالي.
---
🧬 2️⃣ السر الأكبر: استراتيجية الدايفرجنس (Divergence) مع OBV
الدايفرجنس مع مؤشر OBV يُعتبر من أقوى الإشارات الانعكاسية في التحليل الفني، ويأتي على صورتين:
• 1. الدايفرجنس الإيجابي الخفي (Bullish Divergence - التجميع الخفي):
- على الشارت: السعر يصنع قيعان أهبط من بعضها ($Lower\ Lows$).
- على مؤشر OBV: المؤشر يصنع قيعان أعلى من بعضها ($Higher\ Lows$).
- المعنى السلوكي: السعر يهبط لكن الكميات المباعة قليلة، بينما يدخل المشتري الكبير ويمتص المعروض بهدوء دون رفع السعر ⬅️ إشارة لانفجار صاعد وشيك.
• 2. الدايفرجنس السلبي الخفي (Bearish Divergence - التصريف الخفي):
- على الشارت: السعر يصنع قمماً أعلى من بعضها ($Higher\ Highs$).
- على مؤشر OBV: المؤشر يصنع قمماً أدنى من بعضها ($Lower\ Highs$).
- المعنى السلوكي: السعر يصعد بالقصور الذاتي وأحجام الشراء تتلاشى، بينما يقوم الحيتان بتصريف كمياتهم على الأفراد ⬅️ إشارة لانهيار هابط وشيك.
---
🔍 3️⃣ كيف تتداول مؤشر OBV كالمحترفين؟
لا تنظر إلى القيم الرقمية للـ OBV، بل ركز على اتصال الحركة والاتجاه:
• رسم خطوط الاتجاه (Trendlines) على الـ OBV:
يمكنك رسم خط ترند على القمم أو القيعان الخاصة بالمؤشر نفسه. عندما يكسر الـ OBV خط ترند هابط، فهذه إسبقية صريحة لكسر الترند على السعر أيضاً.
• تأكيد الاتجاه العام (Trend Confirmation):
- اتجاه صاعد صحي: السعر يصنع قمم وقيعان صاعدة، والـ OBV يصنع بالتوازي قمم وقيعان صاعدة.
- تنبيه الهشاشة: إذا استمر السعر في القمم الصاعدة بينما خط الـ OBV أصبح أفقياً (Flat)، فهذا يدل على جفاف السيولة.
---
⚖️ خلاصة الدرس الرابع:
"الأسعار تدفعها الأوهام أحياناً، أما مؤشر OBV فتسيره الحقائق الرقمية. عندما يختلف السعر مع الفوليوم التراكمي، ثق دائماً برواية الفوليوم."
---
💬 شاركونا في التعليقات:
هل استخدمت مؤشر OBV من قبل لاكتشاف مناطق التجميع، أم كنت تعتمد فقط على مؤشرات الزخم المعتادة مثل RSI؟
#BinanceSquare #cryptotrading #Volume #القعقاع_1
{spot}(BTCUSDT)
{spot}(ETHUSDT)
{spot}(DEXEUSDT)
📌 سلسلة مؤشر حجم التداول (Volume) | الدرس #4: مؤشر OBV وتكنيك "الانحراف الخفي" (Divergence)
مرحباً بكم زملائي المتداولين! أهلاً بكم في المحطة الرابعة من سلسلتنا. بعد أن تعلمت في الدرس السابق خريطة Volume Profile ومواقع الحيتان، سنتعلم اليوم كيف نكشف "التجميع والتصريف المباشر" حتى قبل أن يتحرك السعر، وذلك باستخدام أداة تراكمية أسطورية: مؤشر الفوليوم التراكمي (On-Balance Volume - OBV).
---
🎯 القاعدة #4: "السعر يتبع الفوليوم دائماً.. عندما ترى خط الـ OBV يتحرك في اتجاه معاكس للسعر، فاعلم أن صانع السوق يقود حركة تجميع أو تصريف خفية وستنفجر قريباً على الشارت."
---
💡 1️⃣ ما هو مؤشر OBV؟ وما الفكرة الرياضية خلفه؟
ابتكر هذا المؤشر المحلل الفني جوزيف جرانفيل (Joseph Granville) عام 1963، وتقوم فلسفته على مبدأ بسيط جداً: "إضافة فوليوم الشمعة أو طرحه بناءً على إغلاق السعر":
• إذا أغلقت الشمعة الحالية أعلى من السابقة (شمعة خضراء):
يتم إضافة إجمالي الفوليوم بالكامل إلى قيمة المؤشر التراكمي:
$$OBV_{\text{new}} = OBV_{\text{previous}} + \text{Volume}$$
• إذا أغلقت الشمعة الحالية أدنى من السابقة (شمعة حمراء):
يتم خصم إجمالي الفوليوم بالكامل من قيمة المؤشر:
$$OBV_{\text{new}} = OBV_{\text{previous}} - \text{Volume}$$
• النتيجة: خط بياني واحد متصل يمثل "محصلة تدفق السيولة" الصافية داخل وخارج الأصل المالي.
---
🧬 2️⃣ السر الأكبر: استراتيجية الدايفرجنس (Divergence) مع OBV
الدايفرجنس مع مؤشر OBV يُعتبر من أقوى الإشارات الانعكاسية في التحليل الفني، ويأتي على صورتين:
• 1. الدايفرجنس الإيجابي الخفي (Bullish Divergence - التجميع الخفي):
- على الشارت: السعر يصنع قيعان أهبط من بعضها ($Lower\ Lows$).
- على مؤشر OBV: المؤشر يصنع قيعان أعلى من بعضها ($Higher\ Lows$).
- المعنى السلوكي: السعر يهبط لكن الكميات المباعة قليلة، بينما يدخل المشتري الكبير ويمتص المعروض بهدوء دون رفع السعر ⬅️ إشارة لانفجار صاعد وشيك.
• 2. الدايفرجنس السلبي الخفي (Bearish Divergence - التصريف الخفي):
- على الشارت: السعر يصنع قمماً أعلى من بعضها ($Higher\ Highs$).
- على مؤشر OBV: المؤشر يصنع قمماً أدنى من بعضها ($Lower\ Highs$).
- المعنى السلوكي: السعر يصعد بالقصور الذاتي وأحجام الشراء تتلاشى، بينما يقوم الحيتان بتصريف كمياتهم على الأفراد ⬅️ إشارة لانهيار هابط وشيك.
---
🔍 3️⃣ كيف تتداول مؤشر OBV كالمحترفين؟
لا تنظر إلى القيم الرقمية للـ OBV، بل ركز على اتصال الحركة والاتجاه:
• رسم خطوط الاتجاه (Trendlines) على الـ OBV:
يمكنك رسم خط ترند على القمم أو القيعان الخاصة بالمؤشر نفسه. عندما يكسر الـ OBV خط ترند هابط، فهذه إسبقية صريحة لكسر الترند على السعر أيضاً.
• تأكيد الاتجاه العام (Trend Confirmation):
- اتجاه صاعد صحي: السعر يصنع قمم وقيعان صاعدة، والـ OBV يصنع بالتوازي قمم وقيعان صاعدة.
- تنبيه الهشاشة: إذا استمر السعر في القمم الصاعدة بينما خط الـ OBV أصبح أفقياً (Flat)، فهذا يدل على جفاف السيولة.
---
⚖️ خلاصة الدرس الرابع:
"الأسعار تدفعها الأوهام أحياناً، أما مؤشر OBV فتسيره الحقائق الرقمية. عندما يختلف السعر مع الفوليوم التراكمي، ثق دائماً برواية الفوليوم."
---
💬 شاركونا في التعليقات:
هل استخدمت مؤشر OBV من قبل لاكتشاف مناطق التجميع، أم كنت تعتمد فقط على مؤشرات الزخم المعتادة مثل RSI؟
#BinanceSquare #cryptotrading #Volume #القعقاع_1
---
🎯 القاعدة #4: "السعر يتبع الفوليوم دائماً.. عندما ترى خط الـ OBV يتحرك في اتجاه معاكس للسعر، فاعلم أن صانع السوق يقود حركة تجميع أو تصريف خفية وستنفجر قريباً على الشارت."
---
💡 1️⃣ ما هو مؤشر OBV؟ وما الفكرة الرياضية خلفه؟
ابتكر هذا المؤشر المحلل الفني جوزيف جرانفيل (Joseph Granville) عام 1963، وتقوم فلسفته على مبدأ بسيط جداً: "إضافة فوليوم الشمعة أو طرحه بناءً على إغلاق السعر":
• إذا أغلقت الشمعة الحالية أعلى من السابقة (شمعة خضراء):
يتم إضافة إجمالي الفوليوم بالكامل إلى قيمة المؤشر التراكمي:
$$OBV_{\text{new}} = OBV_{\text{previous}} + \text{Volume}$$
• إذا أغلقت الشمعة الحالية أدنى من السابقة (شمعة حمراء):
يتم خصم إجمالي الفوليوم بالكامل من قيمة المؤشر:
$$OBV_{\text{new}} = OBV_{\text{previous}} - \text{Volume}$$
• النتيجة: خط بياني واحد متصل يمثل "محصلة تدفق السيولة" الصافية داخل وخارج الأصل المالي.
---
🧬 2️⃣ السر الأكبر: استراتيجية الدايفرجنس (Divergence) مع OBV
الدايفرجنس مع مؤشر OBV يُعتبر من أقوى الإشارات الانعكاسية في التحليل الفني، ويأتي على صورتين:
• 1. الدايفرجنس الإيجابي الخفي (Bullish Divergence - التجميع الخفي):
- على الشارت: السعر يصنع قيعان أهبط من بعضها ($Lower\ Lows$).
- على مؤشر OBV: المؤشر يصنع قيعان أعلى من بعضها ($Higher\ Lows$).
- المعنى السلوكي: السعر يهبط لكن الكميات المباعة قليلة، بينما يدخل المشتري الكبير ويمتص المعروض بهدوء دون رفع السعر ⬅️ إشارة لانفجار صاعد وشيك.
• 2. الدايفرجنس السلبي الخفي (Bearish Divergence - التصريف الخفي):
- على الشارت: السعر يصنع قمماً أعلى من بعضها ($Higher\ Highs$).
- على مؤشر OBV: المؤشر يصنع قمماً أدنى من بعضها ($Lower\ Highs$).
- المعنى السلوكي: السعر يصعد بالقصور الذاتي وأحجام الشراء تتلاشى، بينما يقوم الحيتان بتصريف كمياتهم على الأفراد ⬅️ إشارة لانهيار هابط وشيك.
---
🔍 3️⃣ كيف تتداول مؤشر OBV كالمحترفين؟
لا تنظر إلى القيم الرقمية للـ OBV، بل ركز على اتصال الحركة والاتجاه:
• رسم خطوط الاتجاه (Trendlines) على الـ OBV:
يمكنك رسم خط ترند على القمم أو القيعان الخاصة بالمؤشر نفسه. عندما يكسر الـ OBV خط ترند هابط، فهذه إسبقية صريحة لكسر الترند على السعر أيضاً.
• تأكيد الاتجاه العام (Trend Confirmation):
- اتجاه صاعد صحي: السعر يصنع قمم وقيعان صاعدة، والـ OBV يصنع بالتوازي قمم وقيعان صاعدة.
- تنبيه الهشاشة: إذا استمر السعر في القمم الصاعدة بينما خط الـ OBV أصبح أفقياً (Flat)، فهذا يدل على جفاف السيولة.
---
⚖️ خلاصة الدرس الرابع:
"الأسعار تدفعها الأوهام أحياناً، أما مؤشر OBV فتسيره الحقائق الرقمية. عندما يختلف السعر مع الفوليوم التراكمي، ثق دائماً برواية الفوليوم."
---
💬 شاركونا في التعليقات:
هل استخدمت مؤشر OBV من قبل لاكتشاف مناطق التجميع، أم كنت تعتمد فقط على مؤشرات الزخم المعتادة مثل RSI؟
#BinanceSquare #cryptotrading #Volume #القعقاع_1
2
567
Log in to explore more content
Join global crypto users on Binance Square
⚡️ Get latest and useful information about crypto.
💬 Trusted by the world’s largest crypto exchange.
👍 Discover real insights from verified creators.
Email / Phone number
Trending Topics
1
#BinancePick
2.7M views
144,642 Discussing
2
#EarningsSeason
5M views
24,804 Discussing
3
#SouthKoreaReportedlyWeighsFourthCryptoTaxDelay
4,117 views
168 Discussing
4
#FranklinTempletonFilesForTwoDividendToBitcoinETFs
9,473 views
287 Discussing
5
#StrategyMSTRSurpassesNasdaqInMarketCap
8,399 views
238 Discussing
6
#CanadaProposesStablecoinRedemptionWithin3BusinessDays
285 views
25 Discussing
7
#ElectrumWalletBugLetRogueServersStealFunds
13,786 views
364 Discussing
8
#ArgentineCourtDismissesLIBRACaseAgainstMilei
23,973 views
428 Discussing
9
#SKHynixReportedlyPlansSpecialDividendFromKioxiaStakeSale
3,638 views
52 Discussing
10
#KeystoneWebsiteBreachExposesBuyersShippingAddresses
1,897 views
45 Discussing