
#mr320
mr320
1.1M views
2,268 Discussing
Hot
Latest

·
--
Bullish
$XRP
{spot}(XRPUSDT)
XRP is currently trading at $1.253, maintaining a bearish outlook as it stays below its key 50, 100, and 200-day EMAs. A low RSI of 37 and a negative MACD confirm that sellers still control the market momentum.
To reverse this downward trend and push toward $1.900, XRP must first break past initial resistance at $1.300 and clear the critical $1.540 level. Without immediate support, falling below $1.250 could trigger deeper losses before finding fresh buyer demand.
#xrp320 #mr320 #Trendingissue #writetoearn320 #Trendingcoin320
$XRP
XRP is currently trading at $1.253, maintaining a bearish outlook as it stays below its key 50, 100, and 200-day EMAs. A low RSI of 37 and a negative MACD confirm that sellers still control the market momentum.
To reverse this downward trend and push toward $1.900, XRP must first break past initial resistance at $1.300 and clear the critical $1.540 level. Without immediate support, falling below $1.250 could trigger deeper losses before finding fresh buyer demand.
#xrp320 #mr320 #Trendingissue #writetoearn320 #Trendingcoin320
XRP is currently trading at $1.253, maintaining a bearish outlook as it stays below its key 50, 100, and 200-day EMAs. A low RSI of 37 and a negative MACD confirm that sellers still control the market momentum.
To reverse this downward trend and push toward $1.900, XRP must first break past initial resistance at $1.300 and clear the critical $1.540 level. Without immediate support, falling below $1.250 could trigger deeper losses before finding fresh buyer demand.
#xrp320 #mr320 #Trendingissue #writetoearn320 #Trendingcoin320
575
·
--
Bullish
$ETH
{spot}(ETHUSDT)
Ethereum is currently trading at $2,295, maintaining a short-term bearish bias as it holds below key Exponential Moving Averages (EMAs). If the price attempts a recovery, it faces immediate overhead resistance at the 200-day EMA near $2,313, followed by the 100-day EMA at $2,353, and a broken ascending trendline pivot at $2,385. Higher horizontal and moving average barriers stand at $2,400 and $2,417 respectively, with a major cap further off at $2,770. On the downside, if the current pullback extends, the next critical structural support sits near $1,823, where buyers are expected to step in and defend the broader uptrend. This bearish outlook is supported by technical indicators, as the RSI remains weak at 37 and the MACD is negative, suggesting that any upward bounces will likely trigger selling pressure into nearby resistance.
#ETH320 #Trendingissue #Trendingcoin320 #mr320 #writetoearn320
$ETH
Ethereum is currently trading at $2,295, maintaining a short-term bearish bias as it holds below key Exponential Moving Averages (EMAs). If the price attempts a recovery, it faces immediate overhead resistance at the 200-day EMA near $2,313, followed by the 100-day EMA at $2,353, and a broken ascending trendline pivot at $2,385. Higher horizontal and moving average barriers stand at $2,400 and $2,417 respectively, with a major cap further off at $2,770. On the downside, if the current pullback extends, the next critical structural support sits near $1,823, where buyers are expected to step in and defend the broader uptrend. This bearish outlook is supported by technical indicators, as the RSI remains weak at 37 and the MACD is negative, suggesting that any upward bounces will likely trigger selling pressure into nearby resistance.
#ETH320 #Trendingissue #Trendingcoin320 #mr320 #writetoearn320
Ethereum is currently trading at $2,295, maintaining a short-term bearish bias as it holds below key Exponential Moving Averages (EMAs). If the price attempts a recovery, it faces immediate overhead resistance at the 200-day EMA near $2,313, followed by the 100-day EMA at $2,353, and a broken ascending trendline pivot at $2,385. Higher horizontal and moving average barriers stand at $2,400 and $2,417 respectively, with a major cap further off at $2,770. On the downside, if the current pullback extends, the next critical structural support sits near $1,823, where buyers are expected to step in and defend the broader uptrend. This bearish outlook is supported by technical indicators, as the RSI remains weak at 37 and the MACD is negative, suggesting that any upward bounces will likely trigger selling pressure into nearby resistance.
#ETH320 #Trendingissue #Trendingcoin320 #mr320 #writetoearn320

151
·
--
Bullish
$BTC
{spot}(BTCUSDT)
Bitcoin is currently consolidating at $78,462 as short-term momentum shifts bearish, wedged tightly between key Exponential Moving Averages (EMAs). While the 50-day EMA at $80,307 presents strong overhead resistance and caps bullish recovery, the 100-day and 200-day EMAs at $77,831 and $76,471 provide solid underlying support that keeps the macro structure intact. Momentum indicators are weak—with the RSI near 40 and a negative MACD—reflecting exhausted buying pressure rather than market panic.
Ultimately, Bitcoin remains locked in a range-bound phase until a decisive breakout occurs. Bulls must reclaim the 50-day EMA at $80,307 to target the next major resistance at $85,000. Conversely, immediate downside protection sits at $77,831, but a daily close below the critical $76,471 floor would break the macro structure and trigger a much deeper market correction.
#BTC320 #Trendingissue #Trendingcoin320 #writetoearn320 #mr320
$BTC
Bitcoin is currently consolidating at $78,462 as short-term momentum shifts bearish, wedged tightly between key Exponential Moving Averages (EMAs). While the 50-day EMA at $80,307 presents strong overhead resistance and caps bullish recovery, the 100-day and 200-day EMAs at $77,831 and $76,471 provide solid underlying support that keeps the macro structure intact. Momentum indicators are weak—with the RSI near 40 and a negative MACD—reflecting exhausted buying pressure rather than market panic.
Ultimately, Bitcoin remains locked in a range-bound phase until a decisive breakout occurs. Bulls must reclaim the 50-day EMA at $80,307 to target the next major resistance at $85,000. Conversely, immediate downside protection sits at $77,831, but a daily close below the critical $76,471 floor would break the macro structure and trigger a much deeper market correction.
#BTC320 #Trendingissue #Trendingcoin320 #writetoearn320 #mr320
Bitcoin is currently consolidating at $78,462 as short-term momentum shifts bearish, wedged tightly between key Exponential Moving Averages (EMAs). While the 50-day EMA at $80,307 presents strong overhead resistance and caps bullish recovery, the 100-day and 200-day EMAs at $77,831 and $76,471 provide solid underlying support that keeps the macro structure intact. Momentum indicators are weak—with the RSI near 40 and a negative MACD—reflecting exhausted buying pressure rather than market panic.
Ultimately, Bitcoin remains locked in a range-bound phase until a decisive breakout occurs. Bulls must reclaim the 50-day EMA at $80,307 to target the next major resistance at $85,000. Conversely, immediate downside protection sits at $77,831, but a daily close below the critical $76,471 floor would break the macro structure and trigger a much deeper market correction.
#BTC320 #Trendingissue #Trendingcoin320 #writetoearn320 #mr320

216
·
--
Bullish
$XRP
{spot}(XRPUSDT)
XRP is in a strong bullish trend but shows some short-term caution.
• Bullish Signals: The price is trading above key moving averages (hourly MA-20, MA-50, and daily MA-200), indicating strong upward momentum. Main indicators like MACD, ADX, RSI, and Stoch RSI all confirm firm buyer control and strong buying conditions.
• Support Level: The Ichimoku Kijun provides immediate support at $1.3184.
• Caution: Despite the overall bullish setup, XRP is currently trading near its session low with low volatility, suggesting a slow or cautious intraday outlook.
#xrp320 #Trendingissue #Trendingcoin320 #writetoearn320 #mr320
$XRP
XRP is in a strong bullish trend but shows some short-term caution.
• Bullish Signals: The price is trading above key moving averages (hourly MA-20, MA-50, and daily MA-200), indicating strong upward momentum. Main indicators like MACD, ADX, RSI, and Stoch RSI all confirm firm buyer control and strong buying conditions.
• Support Level: The Ichimoku Kijun provides immediate support at $1.3184.
• Caution: Despite the overall bullish setup, XRP is currently trading near its session low with low volatility, suggesting a slow or cautious intraday outlook.
#xrp320 #Trendingissue #Trendingcoin320 #writetoearn320 #mr320
XRP is in a strong bullish trend but shows some short-term caution.
• Bullish Signals: The price is trading above key moving averages (hourly MA-20, MA-50, and daily MA-200), indicating strong upward momentum. Main indicators like MACD, ADX, RSI, and Stoch RSI all confirm firm buyer control and strong buying conditions.
• Support Level: The Ichimoku Kijun provides immediate support at $1.3184.
• Caution: Despite the overall bullish setup, XRP is currently trading near its session low with low volatility, suggesting a slow or cautious intraday outlook.
#xrp320 #Trendingissue #Trendingcoin320 #writetoearn320 #mr320
1
284
·
--
Bullish
$BNB
{spot}(BNBUSDT)
BNB trades at $771.57 today, up 1.09% in 24 hours, per CoinMarketCap. For today, the line to watch is $780. KuCoin traders mark it as support right under the $800 wall. BNB has not closed above $800 since early 2026, Criptolog notes, so a close there would be big news.
For this week, Brave New Coin says a firm move past $807.49 is the step that matters most. For this month, the same report sets $869.15 as the next chart target, then $959.52, the last big high. On the way down, support sits at $750 to $760. Reaching $959 would be a gain of about 23%. That is a fine move for a coin worth over $100 billion. It is also a move that takes months, not days.
#BNB320 #Trendingcoin320 #mr320 #Trendingissue #WriteToEarn2026
$BNB
BNB trades at $771.57 today, up 1.09% in 24 hours, per CoinMarketCap. For today, the line to watch is $780. KuCoin traders mark it as support right under the $800 wall. BNB has not closed above $800 since early 2026, Criptolog notes, so a close there would be big news.
For this week, Brave New Coin says a firm move past $807.49 is the step that matters most. For this month, the same report sets $869.15 as the next chart target, then $959.52, the last big high. On the way down, support sits at $750 to $760. Reaching $959 would be a gain of about 23%. That is a fine move for a coin worth over $100 billion. It is also a move that takes months, not days.
#BNB320 #Trendingcoin320 #mr320 #Trendingissue #WriteToEarn2026
BNB trades at $771.57 today, up 1.09% in 24 hours, per CoinMarketCap. For today, the line to watch is $780. KuCoin traders mark it as support right under the $800 wall. BNB has not closed above $800 since early 2026, Criptolog notes, so a close there would be big news.
For this week, Brave New Coin says a firm move past $807.49 is the step that matters most. For this month, the same report sets $869.15 as the next chart target, then $959.52, the last big high. On the way down, support sits at $750 to $760. Reaching $959 would be a gain of about 23%. That is a fine move for a coin worth over $100 billion. It is also a move that takes months, not days.
#BNB320 #Trendingcoin320 #mr320 #Trendingissue #WriteToEarn2026

52
·
--
Bullish
$SHIB
{spot}(SHIBUSDT)
Shiba Inu (SHIB) was valued at $0.00000572 at the time of the CoinGape analysis, reflecting a 2.30% depreciation over the assessment period alongside a market capitalization of $3.37 billion. The prevailing market sentiment skewed neutral-to-bearish, reinforced by a Relative Strength Index (RSI) of 49 and a MACD trailing below both its signal line and the zero threshold. On-chain metrics corroborated this downward pressure, with liquid exchange reserves escalating to a multi-month high of 88,076,900,000,000 SHIB on October 3 following a net inflow exceeding 288 billion tokens.
Meanwhile, an exponential spike in the token's burn rate failed to catalyze a price recovery, as the percentage surge was merely a function of a low statistical baseline; the absolute value of the destroyed tokens amounted to a negligible $17, and the largest transaction remained unverified as a definitive supply reduction. Consequently, traders must monitor two pivotal structural levels to determine the asset's next macro direction. A sustained, decisive breakthrough above the $0.000006 resistance level is strictly required to validate a bullish reversal, whereas a four-hour candlestick close beneath $0.00000550 will weaken the current stabilization setup and bring the psychological $0.000005 support level back into focus.
#shib320 #Trendingissue #writetoearn320 #Trendingcoin320 #mr320
$SHIB
Shiba Inu (SHIB) was valued at $0.00000572 at the time of the CoinGape analysis, reflecting a 2.30% depreciation over the assessment period alongside a market capitalization of $3.37 billion. The prevailing market sentiment skewed neutral-to-bearish, reinforced by a Relative Strength Index (RSI) of 49 and a MACD trailing below both its signal line and the zero threshold. On-chain metrics corroborated this downward pressure, with liquid exchange reserves escalating to a multi-month high of 88,076,900,000,000 SHIB on October 3 following a net inflow exceeding 288 billion tokens.
Meanwhile, an exponential spike in the token's burn rate failed to catalyze a price recovery, as the percentage surge was merely a function of a low statistical baseline; the absolute value of the destroyed tokens amounted to a negligible $17, and the largest transaction remained unverified as a definitive supply reduction. Consequently, traders must monitor two pivotal structural levels to determine the asset's next macro direction. A sustained, decisive breakthrough above the $0.000006 resistance level is strictly required to validate a bullish reversal, whereas a four-hour candlestick close beneath $0.00000550 will weaken the current stabilization setup and bring the psychological $0.000005 support level back into focus.
#shib320 #Trendingissue #writetoearn320 #Trendingcoin320 #mr320
Shiba Inu (SHIB) was valued at $0.00000572 at the time of the CoinGape analysis, reflecting a 2.30% depreciation over the assessment period alongside a market capitalization of $3.37 billion. The prevailing market sentiment skewed neutral-to-bearish, reinforced by a Relative Strength Index (RSI) of 49 and a MACD trailing below both its signal line and the zero threshold. On-chain metrics corroborated this downward pressure, with liquid exchange reserves escalating to a multi-month high of 88,076,900,000,000 SHIB on October 3 following a net inflow exceeding 288 billion tokens.
Meanwhile, an exponential spike in the token's burn rate failed to catalyze a price recovery, as the percentage surge was merely a function of a low statistical baseline; the absolute value of the destroyed tokens amounted to a negligible $17, and the largest transaction remained unverified as a definitive supply reduction. Consequently, traders must monitor two pivotal structural levels to determine the asset's next macro direction. A sustained, decisive breakthrough above the $0.000006 resistance level is strictly required to validate a bullish reversal, whereas a four-hour candlestick close beneath $0.00000550 will weaken the current stabilization setup and bring the psychological $0.000005 support level back into focus.
#shib320 #Trendingissue #writetoearn320 #Trendingcoin320 #mr320
1
157
·
--
Bullish
$XRP
{spot}(XRPUSDT)
XRP trades around $1.51, holding steady near the $1.50 mark since late September. A key event is the shareholder vote in New York on the merger creating Evernorth, a company holding 473 million XRP, which would list on Nasdaq under ticker XRPN. This could influence XRP supply and price dynamics. Additionally, Ripple's monthly escrow window opens, potentially releasing up to 1 billion XRP into the market, a significant volume relative to daily trading. German investors should note tax differences between owning XRP tokens directly and shares like XRPN. The market awaits these developments, with price levels between $1.28 and $1.57 critical for near-term movements.
#xrp320 #mr320 #Trendingcoin320 #Trendingissue #WriteToEarn2026
$XRP
XRP trades around $1.51, holding steady near the $1.50 mark since late September. A key event is the shareholder vote in New York on the merger creating Evernorth, a company holding 473 million XRP, which would list on Nasdaq under ticker XRPN. This could influence XRP supply and price dynamics. Additionally, Ripple's monthly escrow window opens, potentially releasing up to 1 billion XRP into the market, a significant volume relative to daily trading. German investors should note tax differences between owning XRP tokens directly and shares like XRPN. The market awaits these developments, with price levels between $1.28 and $1.57 critical for near-term movements.
#xrp320 #mr320 #Trendingcoin320 #Trendingissue #WriteToEarn2026
XRP trades around $1.51, holding steady near the $1.50 mark since late September. A key event is the shareholder vote in New York on the merger creating Evernorth, a company holding 473 million XRP, which would list on Nasdaq under ticker XRPN. This could influence XRP supply and price dynamics. Additionally, Ripple's monthly escrow window opens, potentially releasing up to 1 billion XRP into the market, a significant volume relative to daily trading. German investors should note tax differences between owning XRP tokens directly and shares like XRPN. The market awaits these developments, with price levels between $1.28 and $1.57 critical for near-term movements.
#xrp320 #mr320 #Trendingcoin320 #Trendingissue #WriteToEarn2026
XRP-0.47%
XRPNUS-5.86%
93
·
--
Bearish
$XRP
{spot}(XRPUSDT)
🚨Bearish momentum persists as XRP fails to reclaim resistance🚨
On the technical front, XRP is positioned above its MA-20 at $1.104 but remains capped below the MA-50 at $1.121 and firmly beneath the MA-200 at $1.5343. The immediate resistance is defined by the Ichimoku Kijun at $1.1109. Key momentum indicators are negative: MACD signals a strong sell and ADX also points to a sell, while RSI sits at 37.64 and CCI continues to indicate selling pressure. Stoch RSI remains neutral, BBP highlights seller dominance intraday, and the Awesome Oscillator aligns with broad downside momentum.
#xrp320 #Trendingissue #mr320 #100kUser #WriteToEarn2026
$XRP
🚨Bearish momentum persists as XRP fails to reclaim resistance🚨
On the technical front, XRP is positioned above its MA-20 at $1.104 but remains capped below the MA-50 at $1.121 and firmly beneath the MA-200 at $1.5343. The immediate resistance is defined by the Ichimoku Kijun at $1.1109. Key momentum indicators are negative: MACD signals a strong sell and ADX also points to a sell, while RSI sits at 37.64 and CCI continues to indicate selling pressure. Stoch RSI remains neutral, BBP highlights seller dominance intraday, and the Awesome Oscillator aligns with broad downside momentum.
#xrp320 #Trendingissue #mr320 #100kUser #WriteToEarn2026
🚨Bearish momentum persists as XRP fails to reclaim resistance🚨
On the technical front, XRP is positioned above its MA-20 at $1.104 but remains capped below the MA-50 at $1.121 and firmly beneath the MA-200 at $1.5343. The immediate resistance is defined by the Ichimoku Kijun at $1.1109. Key momentum indicators are negative: MACD signals a strong sell and ADX also points to a sell, while RSI sits at 37.64 and CCI continues to indicate selling pressure. Stoch RSI remains neutral, BBP highlights seller dominance intraday, and the Awesome Oscillator aligns with broad downside momentum.
#xrp320 #Trendingissue #mr320 #100kUser #WriteToEarn2026

3
210
·
--
Bullish
$ETH
{spot}(ETHUSDT)
🚨 Ethereum bulls show signs of exhaustion 🚨
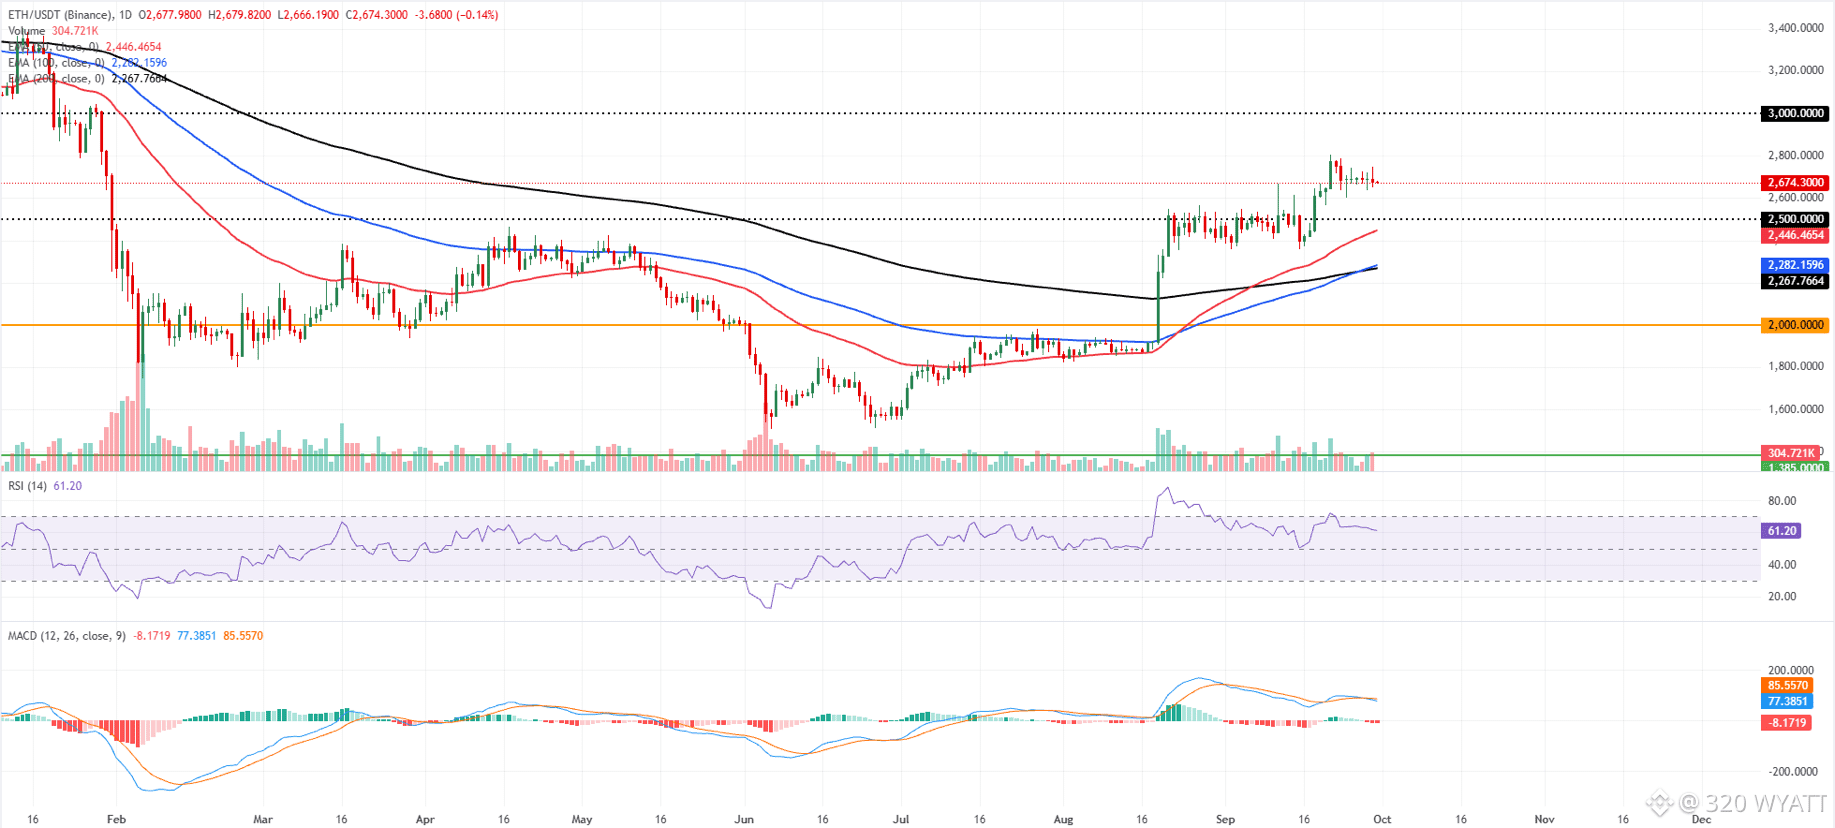
Ethereum price trades at $2,674 on Wednesday, consolidating near recent highs as bulls show signs of exhaustion. Despite pauses in its rally, ETH holds a constructive bias as it remains well above the 50-day, 100-day and 200-day EMAs at $2,446, $2,282 and $2,267, respectively.
The cluster of underlying EMAs and the horizontal level at $2,500 reinforce a supportive backdrop. At the same time, the RSI around 61 suggests steady, but not overextended, upside momentum even as the MACD indicator slips further below zero, hinting at a mild loss of short-term upside conviction rather than a full-fledged reversal.
On the downside, immediate support is seen at the $2,500 horizontal line, followed closely by the 50-day EMA at $2,446, with the 100-day and 200-day EMAs at $2,282 and $2,267 providing a deeper demand band ahead of the more distant $2,000 and $1,385 structural floors.
On the topside, the next relevant resistance is the psychological $3,000 barrier, and a decisive daily close above it would likely open the way for an extension of the prevailing uptrend despite the currently cautious MACD signal.
#ETH320 #mr320 #Trendingissue #Trendingcoin320 #writetoearn320
$ETH
🚨 Ethereum bulls show signs of exhaustion 🚨
Ethereum price trades at $2,674 on Wednesday, consolidating near recent highs as bulls show signs of exhaustion. Despite pauses in its rally, ETH holds a constructive bias as it remains well above the 50-day, 100-day and 200-day EMAs at $2,446, $2,282 and $2,267, respectively.
The cluster of underlying EMAs and the horizontal level at $2,500 reinforce a supportive backdrop. At the same time, the RSI around 61 suggests steady, but not overextended, upside momentum even as the MACD indicator slips further below zero, hinting at a mild loss of short-term upside conviction rather than a full-fledged reversal.
On the downside, immediate support is seen at the $2,500 horizontal line, followed closely by the 50-day EMA at $2,446, with the 100-day and 200-day EMAs at $2,282 and $2,267 providing a deeper demand band ahead of the more distant $2,000 and $1,385 structural floors.
On the topside, the next relevant resistance is the psychological $3,000 barrier, and a decisive daily close above it would likely open the way for an extension of the prevailing uptrend despite the currently cautious MACD signal.
#ETH320 #mr320 #Trendingissue #Trendingcoin320 #writetoearn320
🚨 Ethereum bulls show signs of exhaustion 🚨
Ethereum price trades at $2,674 on Wednesday, consolidating near recent highs as bulls show signs of exhaustion. Despite pauses in its rally, ETH holds a constructive bias as it remains well above the 50-day, 100-day and 200-day EMAs at $2,446, $2,282 and $2,267, respectively.
The cluster of underlying EMAs and the horizontal level at $2,500 reinforce a supportive backdrop. At the same time, the RSI around 61 suggests steady, but not overextended, upside momentum even as the MACD indicator slips further below zero, hinting at a mild loss of short-term upside conviction rather than a full-fledged reversal.
On the downside, immediate support is seen at the $2,500 horizontal line, followed closely by the 50-day EMA at $2,446, with the 100-day and 200-day EMAs at $2,282 and $2,267 providing a deeper demand band ahead of the more distant $2,000 and $1,385 structural floors.
On the topside, the next relevant resistance is the psychological $3,000 barrier, and a decisive daily close above it would likely open the way for an extension of the prevailing uptrend despite the currently cautious MACD signal.
#ETH320 #mr320 #Trendingissue #Trendingcoin320 #writetoearn320
88
·
--
Bullish
$PEPE
{spot}(PEPEUSDT)
PEPE needs another wave of sustained demand to move from $0.00000382 to $0.00001. Its recent weekly gain and trading volume have returned the target to retail watchlists, but a token of its size needs serious buying pressure to complete a 2.6-times move.
#pepe320 #Trendingissue #writetoearn2026 #mr320 #PEPE
$PEPE
PEPE needs another wave of sustained demand to move from $0.00000382 to $0.00001. Its recent weekly gain and trading volume have returned the target to retail watchlists, but a token of its size needs serious buying pressure to complete a 2.6-times move.
#pepe320 #Trendingissue #writetoearn2026 #mr320 #PEPE
PEPE needs another wave of sustained demand to move from $0.00000382 to $0.00001. Its recent weekly gain and trading volume have returned the target to retail watchlists, but a token of its size needs serious buying pressure to complete a 2.6-times move.
#pepe320 #Trendingissue #writetoearn2026 #mr320 #PEPE

1
2
401
·
--
Bullish
$BTC
{spot}(BTCUSDT)
PRESIDENT TRUMP: 🇺🇸 “Bitcoin and crypto is the future.”
#BTC320 #Trendingissue #Trendingcoin320 #mr320 #WriteToEarn2026
$BTC
PRESIDENT TRUMP: 🇺🇸 “Bitcoin and crypto is the future.”
#BTC320 #Trendingissue #Trendingcoin320 #mr320 #WriteToEarn2026
PRESIDENT TRUMP: 🇺🇸 “Bitcoin and crypto is the future.”
#BTC320 #Trendingissue #Trendingcoin320 #mr320 #WriteToEarn2026


1
69
·
--
Bullish
$SOL
{spot}(SOLUSDT)
🚨NOT FINANCIAL ADVICE 🚨
Aggressive demand absorption continues to forge higher lows against a rigid $125 supply wall, locking Solana into a textbook ascending triangle structure. A decisive breakout above this pivotal resistance will likely trigger a short-squeeze, rapidly propelling the price through a thin liquidity void toward the $128 target. Conversely, a breakdown below the $117 trend invalidation shelf shifts the immediate tactical bias bearish, exposing the asset to a deeper retest of the macro demand zone at $111.
#solana320 #Trendingissue #Trendingcoin320 #mr320 #writetoearn320
$SOL
🚨NOT FINANCIAL ADVICE 🚨
Aggressive demand absorption continues to forge higher lows against a rigid $125 supply wall, locking Solana into a textbook ascending triangle structure. A decisive breakout above this pivotal resistance will likely trigger a short-squeeze, rapidly propelling the price through a thin liquidity void toward the $128 target. Conversely, a breakdown below the $117 trend invalidation shelf shifts the immediate tactical bias bearish, exposing the asset to a deeper retest of the macro demand zone at $111.
#solana320 #Trendingissue #Trendingcoin320 #mr320 #writetoearn320
🚨NOT FINANCIAL ADVICE 🚨
Aggressive demand absorption continues to forge higher lows against a rigid $125 supply wall, locking Solana into a textbook ascending triangle structure. A decisive breakout above this pivotal resistance will likely trigger a short-squeeze, rapidly propelling the price through a thin liquidity void toward the $128 target. Conversely, a breakdown below the $117 trend invalidation shelf shifts the immediate tactical bias bearish, exposing the asset to a deeper retest of the macro demand zone at $111.
#solana320 #Trendingissue #Trendingcoin320 #mr320 #writetoearn320

85
·
--
Bearish
$XRP
{spot}(XRPUSDT)
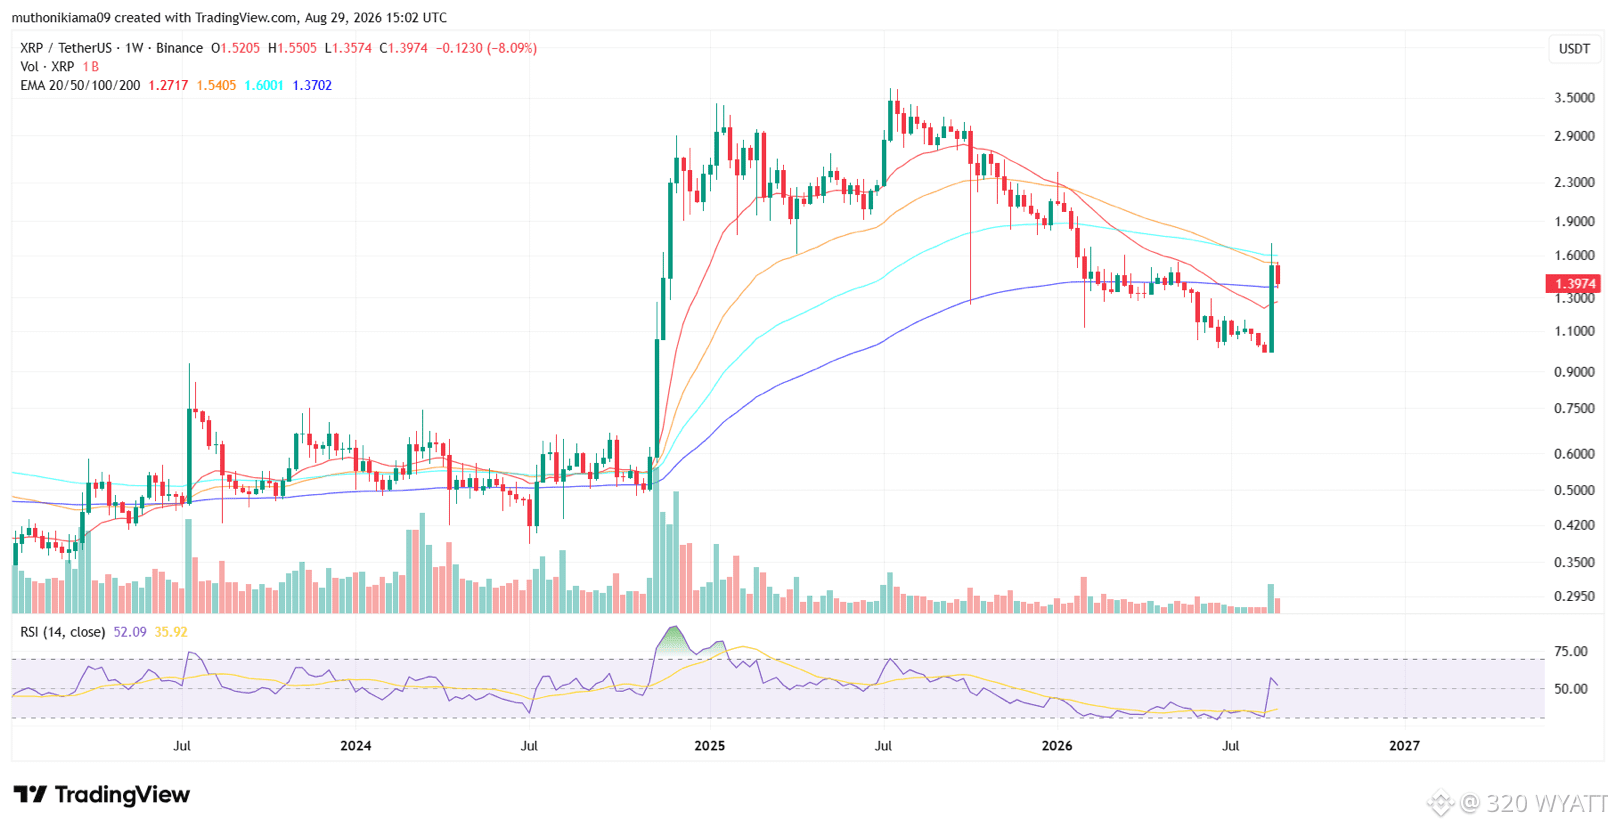
The one-week chart for XRP shows that the price has dropped to the support at the 200-week EMA of $1.37. If XRP moves below this EMA, it will suggest that the long-term outlook is now bearish.
XRP’s move to this 200-week EMA also comes as the traders who made profits after the price moved from $1 to $1.66 begin to sell. If these traders continue to book profits, the price could drop to the 20-week EMA of $1.27.
However, if the selling pressure eases and buyers return, XRP could remain above this EMA of $1.37 before making another gain to the 100-week EMA of $1.569.
#xrp320 #xrp #mr320 #Trendingissue #WriteToEarn2026
$XRP
The one-week chart for XRP shows that the price has dropped to the support at the 200-week EMA of $1.37. If XRP moves below this EMA, it will suggest that the long-term outlook is now bearish.
XRP’s move to this 200-week EMA also comes as the traders who made profits after the price moved from $1 to $1.66 begin to sell. If these traders continue to book profits, the price could drop to the 20-week EMA of $1.27.
However, if the selling pressure eases and buyers return, XRP could remain above this EMA of $1.37 before making another gain to the 100-week EMA of $1.569.
#xrp320 #xrp #mr320 #Trendingissue #WriteToEarn2026
The one-week chart for XRP shows that the price has dropped to the support at the 200-week EMA of $1.37. If XRP moves below this EMA, it will suggest that the long-term outlook is now bearish.
XRP’s move to this 200-week EMA also comes as the traders who made profits after the price moved from $1 to $1.66 begin to sell. If these traders continue to book profits, the price could drop to the 20-week EMA of $1.27.
However, if the selling pressure eases and buyers return, XRP could remain above this EMA of $1.37 before making another gain to the 100-week EMA of $1.569.
#xrp320 #xrp #mr320 #Trendingissue #WriteToEarn2026
48
·
--
Bullish
$BTC
{spot}(BTCUSDT)
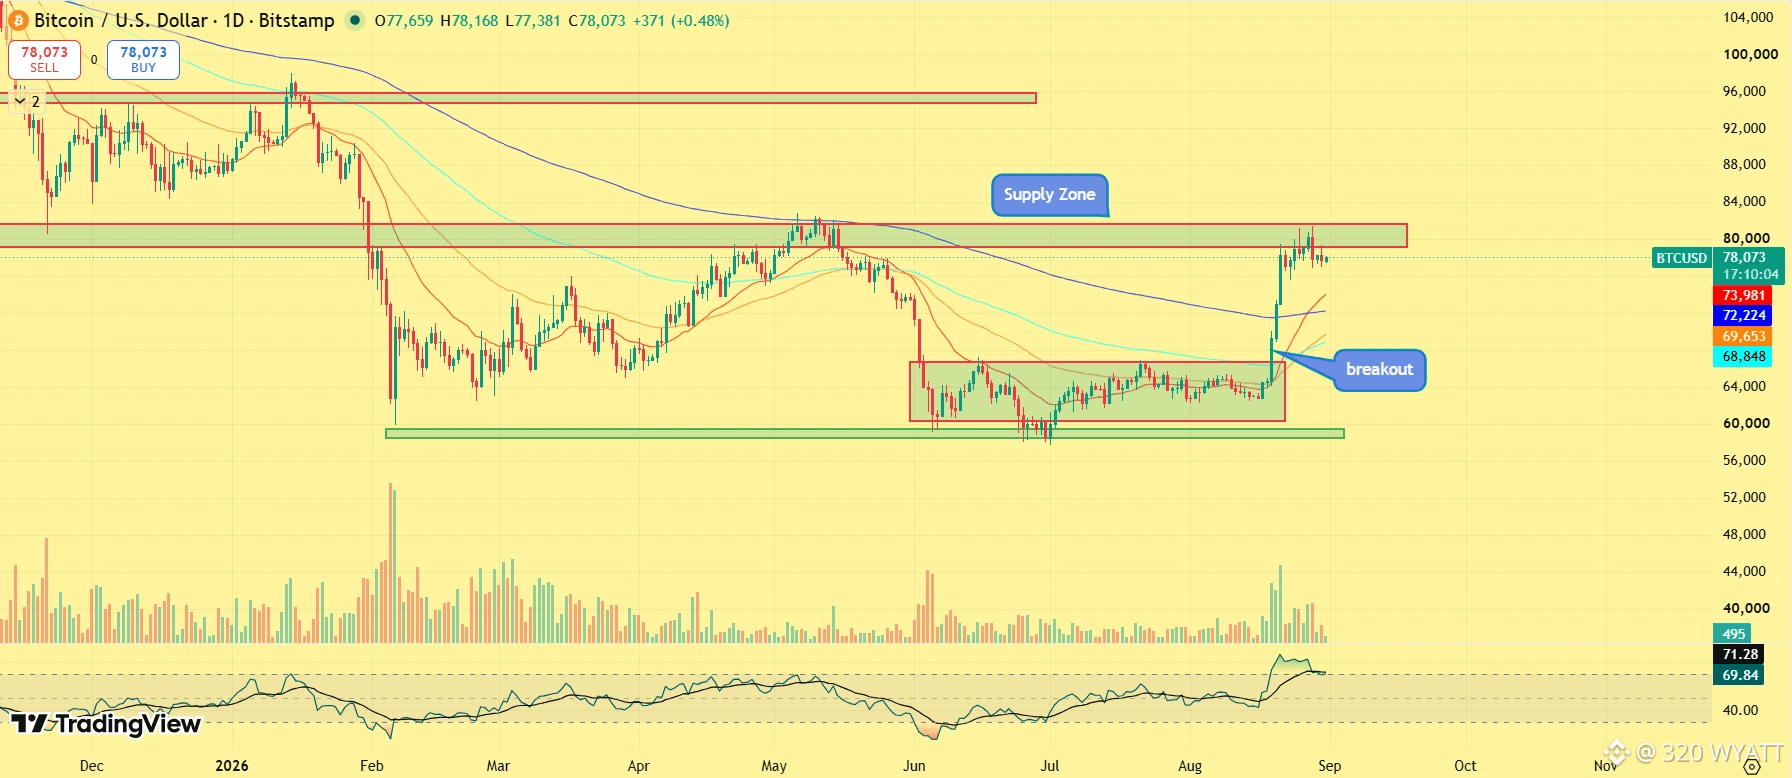
Bitcoin recently attempted to reach downside liquidity on the liquidation heat map but fell short. The key liquidity zone is currently concentrated around $76,400–$76,800, with approximately $76,600 emerging as the level to watch.
A move toward this area would represent a short-term pullback rather than a major trend reversal. Bitcoin could also continue trading sideways as bullish momentum cools.
The broader trend remains more constructive on higher time frames, where the current pullback would have a relatively limited impact on the larger price structure.
#btc #BTC320 #writetoearn2026 #Trendingissue #mr320
$BTC
Bitcoin recently attempted to reach downside liquidity on the liquidation heat map but fell short. The key liquidity zone is currently concentrated around $76,400–$76,800, with approximately $76,600 emerging as the level to watch.
A move toward this area would represent a short-term pullback rather than a major trend reversal. Bitcoin could also continue trading sideways as bullish momentum cools.
The broader trend remains more constructive on higher time frames, where the current pullback would have a relatively limited impact on the larger price structure.
#btc #BTC320 #writetoearn2026 #Trendingissue #mr320
Bitcoin recently attempted to reach downside liquidity on the liquidation heat map but fell short. The key liquidity zone is currently concentrated around $76,400–$76,800, with approximately $76,600 emerging as the level to watch.
A move toward this area would represent a short-term pullback rather than a major trend reversal. Bitcoin could also continue trading sideways as bullish momentum cools.
The broader trend remains more constructive on higher time frames, where the current pullback would have a relatively limited impact on the larger price structure.
#btc #BTC320 #writetoearn2026 #Trendingissue #mr320
115
·
--
Bullish
$SOL
{spot}(SOLUSDT)
🚨Solana price must reclaim $80 to confirm a bullish reversal🚨
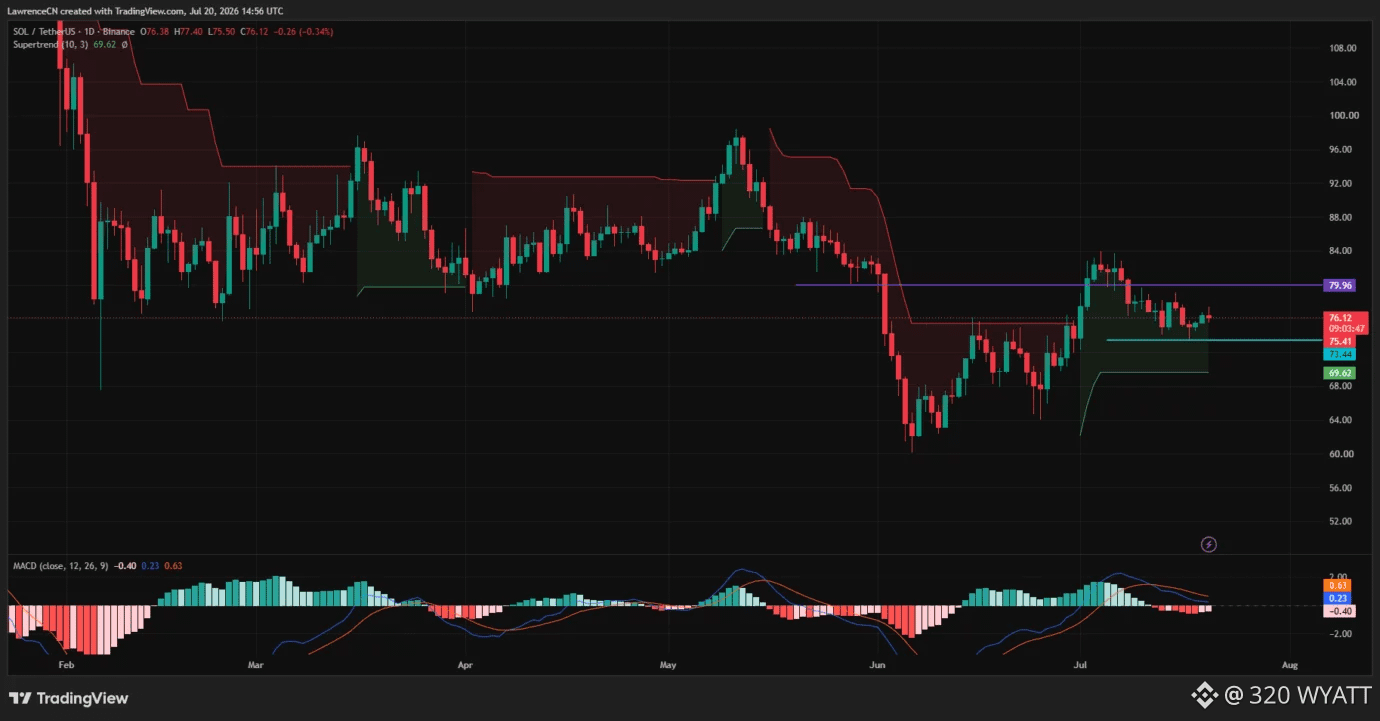
The daily chart places the main resistance at $79.96, where SOL’s early-July recovery failed, and sellers pushed the price back toward $75. A daily close above $80 would clear the psychological barrier and reopen the route toward the July swing high around $83, followed by the $90–$98 region.
#solana320 #solana #mr320 #Trendingissue #writetoearn2026
$SOL
🚨Solana price must reclaim $80 to confirm a bullish reversal🚨
The daily chart places the main resistance at $79.96, where SOL’s early-July recovery failed, and sellers pushed the price back toward $75. A daily close above $80 would clear the psychological barrier and reopen the route toward the July swing high around $83, followed by the $90–$98 region.
#solana320 #solana #mr320 #Trendingissue #writetoearn2026
🚨Solana price must reclaim $80 to confirm a bullish reversal🚨
The daily chart places the main resistance at $79.96, where SOL’s early-July recovery failed, and sellers pushed the price back toward $75. A daily close above $80 would clear the psychological barrier and reopen the route toward the July swing high around $83, followed by the $90–$98 region.
#solana320 #solana #mr320 #Trendingissue #writetoearn2026
2
1.6k
·
--
Bullish
$PEPE
{spot}(PEPEUSDT)
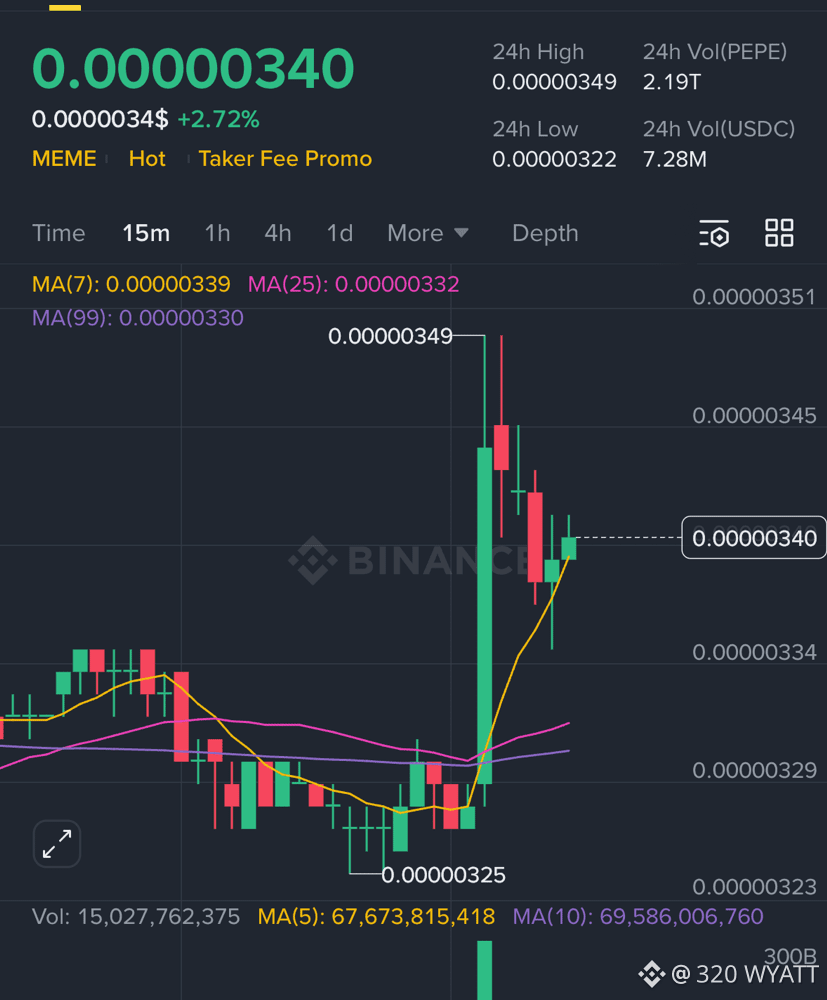
PEPE trades near $0.0000034 as of March 23, down 85% from its all time high of $0.000028, according to CoinMarketCap. The original meme coin proved that 420 trillion tokens and community energy can build $11 billion with zero products.
But from $0.0000034, a 10x requires levels it held only briefly. Pepeto has the same supply, the same cofounder, and the exchange Pepe never built.
#pepe320 #Trendingissue #WriteToEarn2026 #100kUser #mr320
$PEPE
PEPE trades near $0.0000034 as of March 23, down 85% from its all time high of $0.000028, according to CoinMarketCap. The original meme coin proved that 420 trillion tokens and community energy can build $11 billion with zero products.
But from $0.0000034, a 10x requires levels it held only briefly. Pepeto has the same supply, the same cofounder, and the exchange Pepe never built.
#pepe320 #Trendingissue #WriteToEarn2026 #100kUser #mr320
PEPE trades near $0.0000034 as of March 23, down 85% from its all time high of $0.000028, according to CoinMarketCap. The original meme coin proved that 420 trillion tokens and community energy can build $11 billion with zero products.
But from $0.0000034, a 10x requires levels it held only briefly. Pepeto has the same supply, the same cofounder, and the exchange Pepe never built.
#pepe320 #Trendingissue #WriteToEarn2026 #100kUser #mr320
1
8
1.6k
·
--
Bullish
$BTC
{spot}(BTCUSDT)
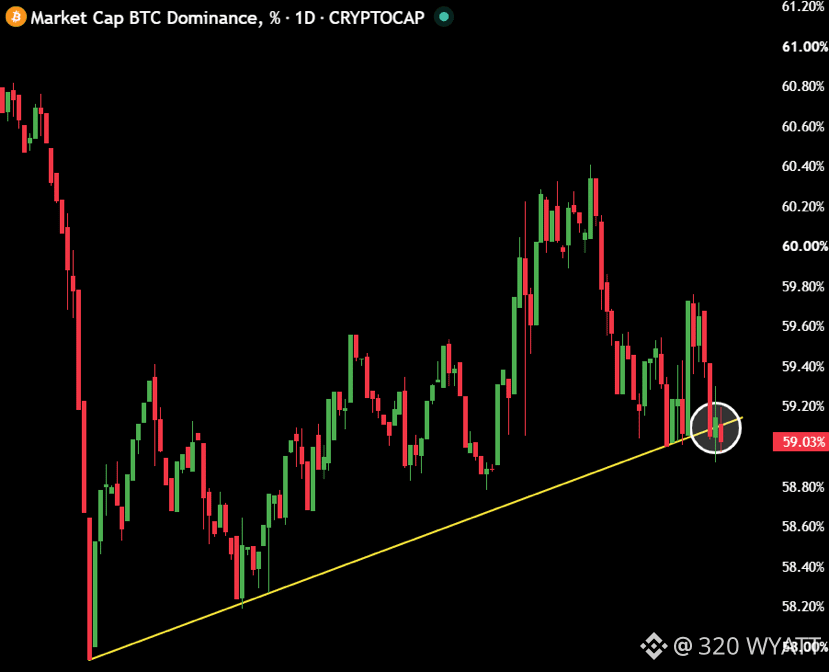
Bitcoin dominance has lost its 11-week uptrend.
BULLISH FOR ALTS.
#BTC320 #Trendingissue #Trendingcoin320 #mr320 #writetoearn320
$BTC
Bitcoin dominance has lost its 11-week uptrend.
BULLISH FOR ALTS.
#BTC320 #Trendingissue #Trendingcoin320 #mr320 #writetoearn320
Bitcoin dominance has lost its 11-week uptrend.
BULLISH FOR ALTS.
#BTC320 #Trendingissue #Trendingcoin320 #mr320 #writetoearn320
107
·
--
Bullish
$XRP
{spot}(XRPUSDT)
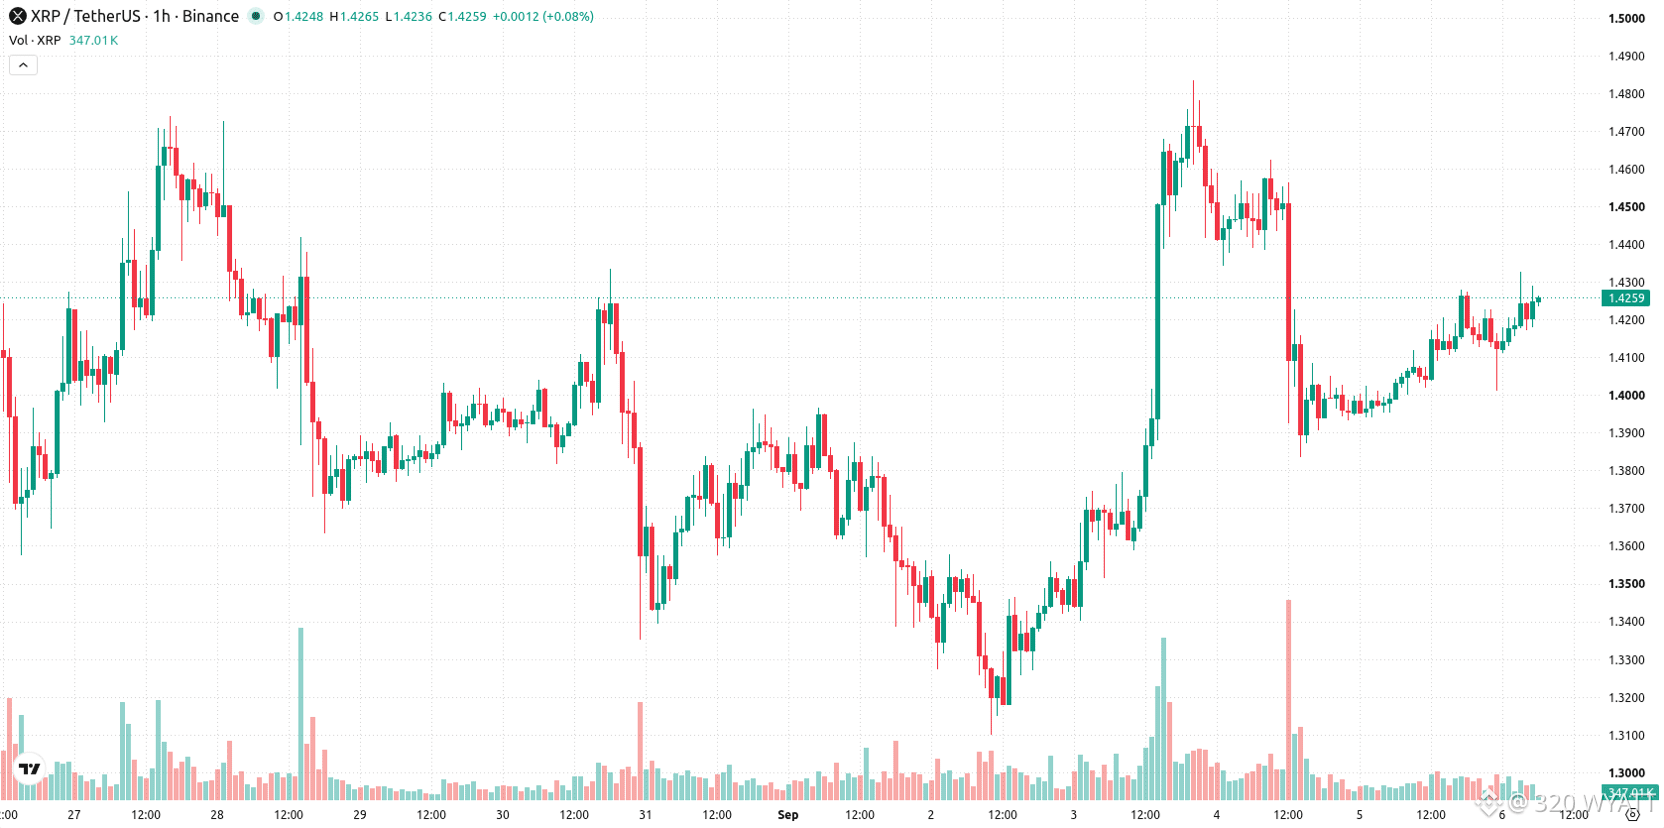
On the technical front, XRP is trading above its MA-20 ($1.4154), MA-50 ($1.415) on the hourly chart, and MA-200 ($1.2745) on the daily, with the Ichimoku Kijun providing immediate support at $1.4141. Momentum indicators produce a mixed picture: while MACD and RSI (59.7, Buy) signal bullish momentum, ADX and Stochastic RSI are neutral, and CCI is in overbought territory, warning of possible short-term exhaustion. Bull/Bear Power indicates buyers remain in control intraday, and the Awesome Oscillator aligns with the existing uptrend, though overbought signals point to the risk of some divergence.
#xrp320 #xrp #WriteToEarn2026 #Trendingissue #mr320
$XRP
On the technical front, XRP is trading above its MA-20 ($1.4154), MA-50 ($1.415) on the hourly chart, and MA-200 ($1.2745) on the daily, with the Ichimoku Kijun providing immediate support at $1.4141. Momentum indicators produce a mixed picture: while MACD and RSI (59.7, Buy) signal bullish momentum, ADX and Stochastic RSI are neutral, and CCI is in overbought territory, warning of possible short-term exhaustion. Bull/Bear Power indicates buyers remain in control intraday, and the Awesome Oscillator aligns with the existing uptrend, though overbought signals point to the risk of some divergence.
#xrp320 #xrp #WriteToEarn2026 #Trendingissue #mr320
On the technical front, XRP is trading above its MA-20 ($1.4154), MA-50 ($1.415) on the hourly chart, and MA-200 ($1.2745) on the daily, with the Ichimoku Kijun providing immediate support at $1.4141. Momentum indicators produce a mixed picture: while MACD and RSI (59.7, Buy) signal bullish momentum, ADX and Stochastic RSI are neutral, and CCI is in overbought territory, warning of possible short-term exhaustion. Bull/Bear Power indicates buyers remain in control intraday, and the Awesome Oscillator aligns with the existing uptrend, though overbought signals point to the risk of some divergence.
#xrp320 #xrp #WriteToEarn2026 #Trendingissue #mr320
196
·
--
Bullish
$XRP
{spot}(XRPUSDT)
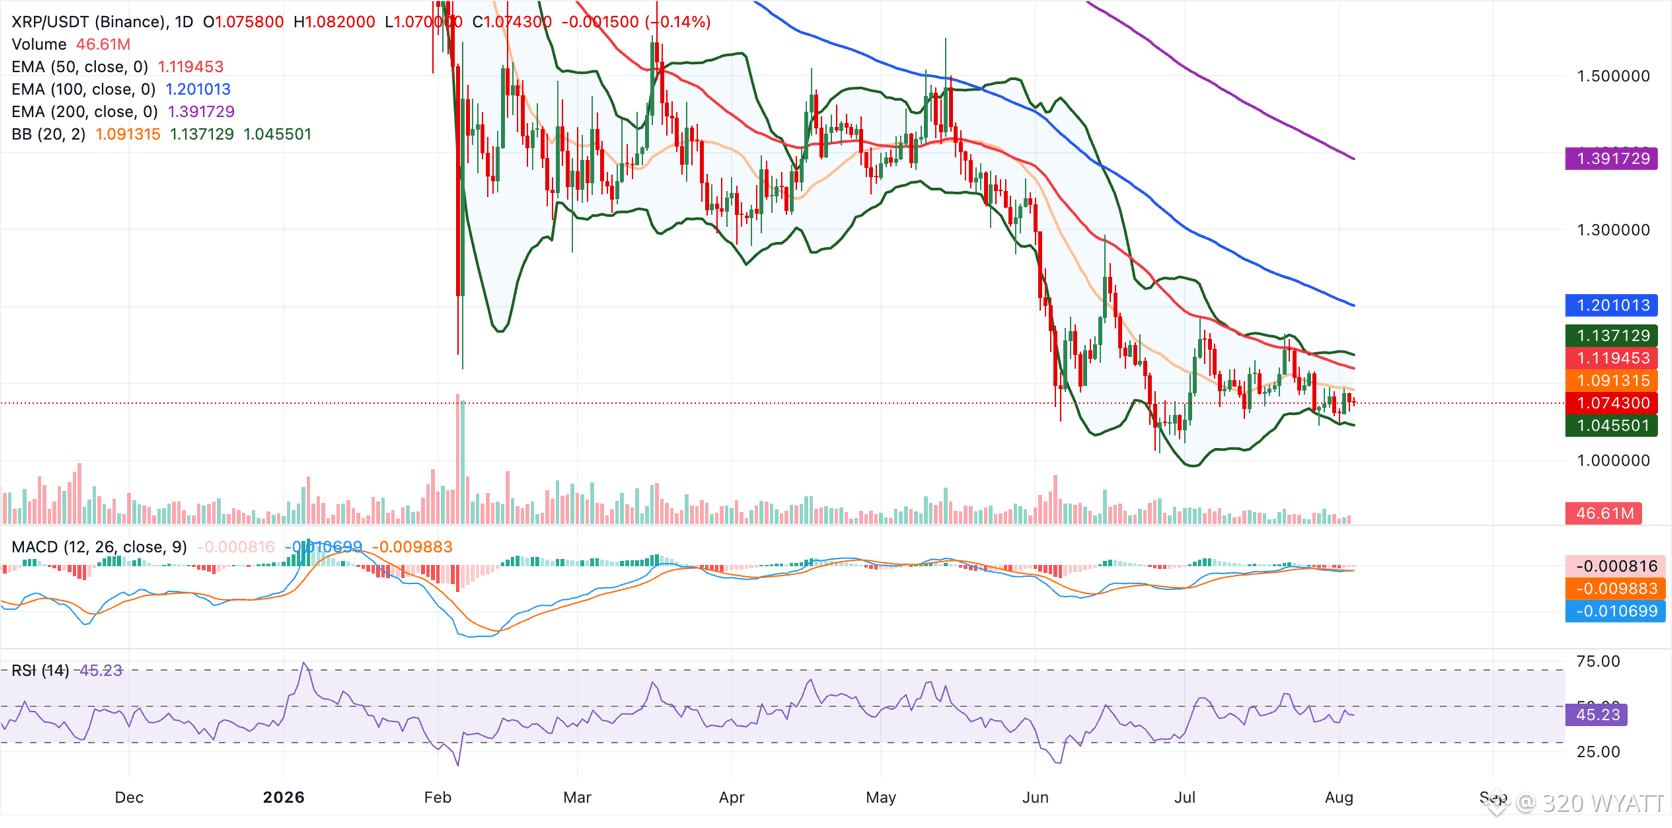
XRP trades at $1.07, keeping a bearish near-term bias as it remains below the 50-day Exponential Moving Average (EMA) at $1.12 and the Bollinger middle band at $1.09. The 100-day EMA at $1.20 and the 200-day EMA at $1.39 stay well above price, reinforcing a broader downside skew.
The Moving Average Convergence Divergence (MACD) indicator holds marginally below the zero line on the daily chart, and the Relative Strength Index (RSI) at 45 suggests subdued, slightly negative momentum rather than an oversold condition.
On the topside, initial resistance emerges at the Bollinger middle band near $1.09, followed by the 50-day EMA at $1.12 and the Bollinger upper band at $1.14, with higher hurdles at the 100-day EMA at $1.20 and the 200-day EMA at $1.39. On the downside, the first notable support is aligned with the Bollinger lower band around $1.05, where a break would open the door to further weakness in the pair.
#xrp320 #mr320 #writetoearn2026 #xrp #Trendingissue
$XRP
XRP trades at $1.07, keeping a bearish near-term bias as it remains below the 50-day Exponential Moving Average (EMA) at $1.12 and the Bollinger middle band at $1.09. The 100-day EMA at $1.20 and the 200-day EMA at $1.39 stay well above price, reinforcing a broader downside skew.
The Moving Average Convergence Divergence (MACD) indicator holds marginally below the zero line on the daily chart, and the Relative Strength Index (RSI) at 45 suggests subdued, slightly negative momentum rather than an oversold condition.
On the topside, initial resistance emerges at the Bollinger middle band near $1.09, followed by the 50-day EMA at $1.12 and the Bollinger upper band at $1.14, with higher hurdles at the 100-day EMA at $1.20 and the 200-day EMA at $1.39. On the downside, the first notable support is aligned with the Bollinger lower band around $1.05, where a break would open the door to further weakness in the pair.
#xrp320 #mr320 #writetoearn2026 #xrp #Trendingissue
XRP trades at $1.07, keeping a bearish near-term bias as it remains below the 50-day Exponential Moving Average (EMA) at $1.12 and the Bollinger middle band at $1.09. The 100-day EMA at $1.20 and the 200-day EMA at $1.39 stay well above price, reinforcing a broader downside skew.
The Moving Average Convergence Divergence (MACD) indicator holds marginally below the zero line on the daily chart, and the Relative Strength Index (RSI) at 45 suggests subdued, slightly negative momentum rather than an oversold condition.
On the topside, initial resistance emerges at the Bollinger middle band near $1.09, followed by the 50-day EMA at $1.12 and the Bollinger upper band at $1.14, with higher hurdles at the 100-day EMA at $1.20 and the 200-day EMA at $1.39. On the downside, the first notable support is aligned with the Bollinger lower band around $1.05, where a break would open the door to further weakness in the pair.
#xrp320 #mr320 #writetoearn2026 #xrp #Trendingissue
1
230
·
--
Bearish
$SOL
{spot}(SOLUSDT)
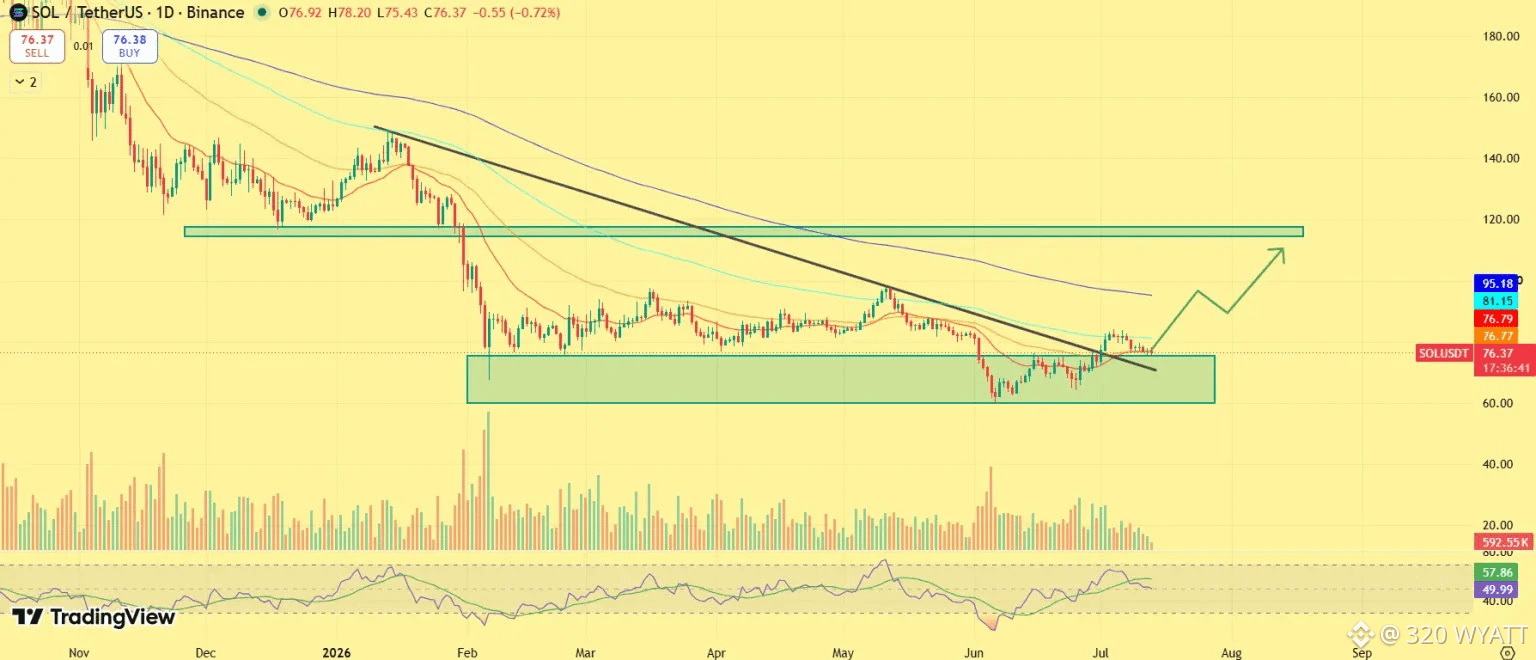
🚨SOL Price Analysis: Breakout Structure Remains Intact🚨
Solana has already delivered one encouraging signal by breaking above a multi-month descending trendline that had capped price action since early this year. The breakout followed several successful defenses of the $68-$72 demand zone, indicating that buyers continue accumulating at lower levels. Momentum indicators are also beginning to improve. Although SOL still trades below its longer-term moving averages, the Relative Strength Index (RSI) is recovering toward neutral territory, suggesting bullish momentum is gradually returning without entering overbought conditions.
The immediate hurdle remains $82, which also coincides with the largest short liquidation cluster. A decisive breakout above this level could expose $95 as the next resistance before opening the path toward the broader $115-$120 supply zone. However, failure to reclaim $82 may trigger another pullback toward $70-$72, where bulls are expected to defend support.
#solana320 #sol #WriteToEarn2026 #mr320 #BinanceTurns9
$SOL
🚨SOL Price Analysis: Breakout Structure Remains Intact🚨
Solana has already delivered one encouraging signal by breaking above a multi-month descending trendline that had capped price action since early this year. The breakout followed several successful defenses of the $68-$72 demand zone, indicating that buyers continue accumulating at lower levels. Momentum indicators are also beginning to improve. Although SOL still trades below its longer-term moving averages, the Relative Strength Index (RSI) is recovering toward neutral territory, suggesting bullish momentum is gradually returning without entering overbought conditions.
The immediate hurdle remains $82, which also coincides with the largest short liquidation cluster. A decisive breakout above this level could expose $95 as the next resistance before opening the path toward the broader $115-$120 supply zone. However, failure to reclaim $82 may trigger another pullback toward $70-$72, where bulls are expected to defend support.
#solana320 #sol #WriteToEarn2026 #mr320 #BinanceTurns9
🚨SOL Price Analysis: Breakout Structure Remains Intact🚨
Solana has already delivered one encouraging signal by breaking above a multi-month descending trendline that had capped price action since early this year. The breakout followed several successful defenses of the $68-$72 demand zone, indicating that buyers continue accumulating at lower levels. Momentum indicators are also beginning to improve. Although SOL still trades below its longer-term moving averages, the Relative Strength Index (RSI) is recovering toward neutral territory, suggesting bullish momentum is gradually returning without entering overbought conditions.
The immediate hurdle remains $82, which also coincides with the largest short liquidation cluster. A decisive breakout above this level could expose $95 as the next resistance before opening the path toward the broader $115-$120 supply zone. However, failure to reclaim $82 may trigger another pullback toward $70-$72, where bulls are expected to defend support.
#solana320 #sol #WriteToEarn2026 #mr320 #BinanceTurns9
194
Log in to explore more content
Join global crypto users on Binance Square
⚡️ Get latest and useful information about crypto.
💬 Trusted by the world’s largest crypto exchange.
👍 Discover real insights from verified creators.
Email / Phone number
Trending Topics
1
#A Packed Week of Earnings and Data Tests Markets
68,063 views
430 Discussing
2
#AnthropicIPOTestsInvestorAppetiteForAI
133,741 views
1,481 Discussing
3
#NvidiaBoardNotConsideringHuang’sReturnasCEO
1,929 views
63 Discussing
4
#WhatInvestmentSignalsDo13FFilingsReveal?
908 views
36 Discussing
5
#SevenUSBanksDisclose$29.4MInXRPETFHoldings
22 views
2 Discussing
6
#InvescoStablecoinReservesFundLaunchesOnEthereum
82 views
6 Discussing
7
#CypherpunkReports$306MQ3NetProfit
408 views
8 Discussing
8
#OPTIMJACKAttackInfectsAtLeast186Websites
1,378 views
45 Discussing
9
#StrategySells2.09MMSTRSharesFor$244.7M
823 views
13 Discussing
10
#StablecoinMarketShrinksAtFastestPaceSinceTerraLuna
1,454 views
34 Discussing