
#nvdab
nvdab
61,854 views
1,687 Discussing
Hot
Latest

·
--
$TIA +3.65% | $DEXE +3.48% | $NVDAB +3.46%
#TIA edged up to $0.4226, gaining +3.65% on $12.6 M of volume. Its role in Celestia’s data availability network keeps it in focus as developers experiment with new chains.
#DEXE nudged higher to $1.25, up +3.48% with $2.8 M traded. The modest flow suggests a steady interest rather than a frenzy.
#NVDAB rose to $166.77, climbing +3.46% on a robust $213.8 M of volume. Such heavy turnover could hint at larger players adjusting positions.
📈 Watch the contrast between NVDAB’s deep liquidity and the lighter streams for TIA and DEXE; the disparity may shape short‑term momentum.
#Write2Earn #Binance
$TIA +3.65% | $DEXE +3.48% | $NVDAB +3.46%
#TIA edged up to $0.4226, gaining +3.65% on $12.6 M of volume. Its role in Celestia’s data availability network keeps it in focus as developers experiment with new chains.
#DEXE nudged higher to $1.25, up +3.48% with $2.8 M traded. The modest flow suggests a steady interest rather than a frenzy.
#NVDAB rose to $166.77, climbing +3.46% on a robust $213.8 M of volume. Such heavy turnover could hint at larger players adjusting positions.
📈 Watch the contrast between NVDAB’s deep liquidity and the lighter streams for TIA and DEXE; the disparity may shape short‑term momentum.
#Write2Earn #Binance
#TIA edged up to $0.4226, gaining +3.65% on $12.6 M of volume. Its role in Celestia’s data availability network keeps it in focus as developers experiment with new chains.
#DEXE nudged higher to $1.25, up +3.48% with $2.8 M traded. The modest flow suggests a steady interest rather than a frenzy.
#NVDAB rose to $166.77, climbing +3.46% on a robust $213.8 M of volume. Such heavy turnover could hint at larger players adjusting positions.
📈 Watch the contrast between NVDAB’s deep liquidity and the lighter streams for TIA and DEXE; the disparity may shape short‑term momentum.
#Write2Earn #Binance
2

·
--
{spot}(NVDABUSDT)
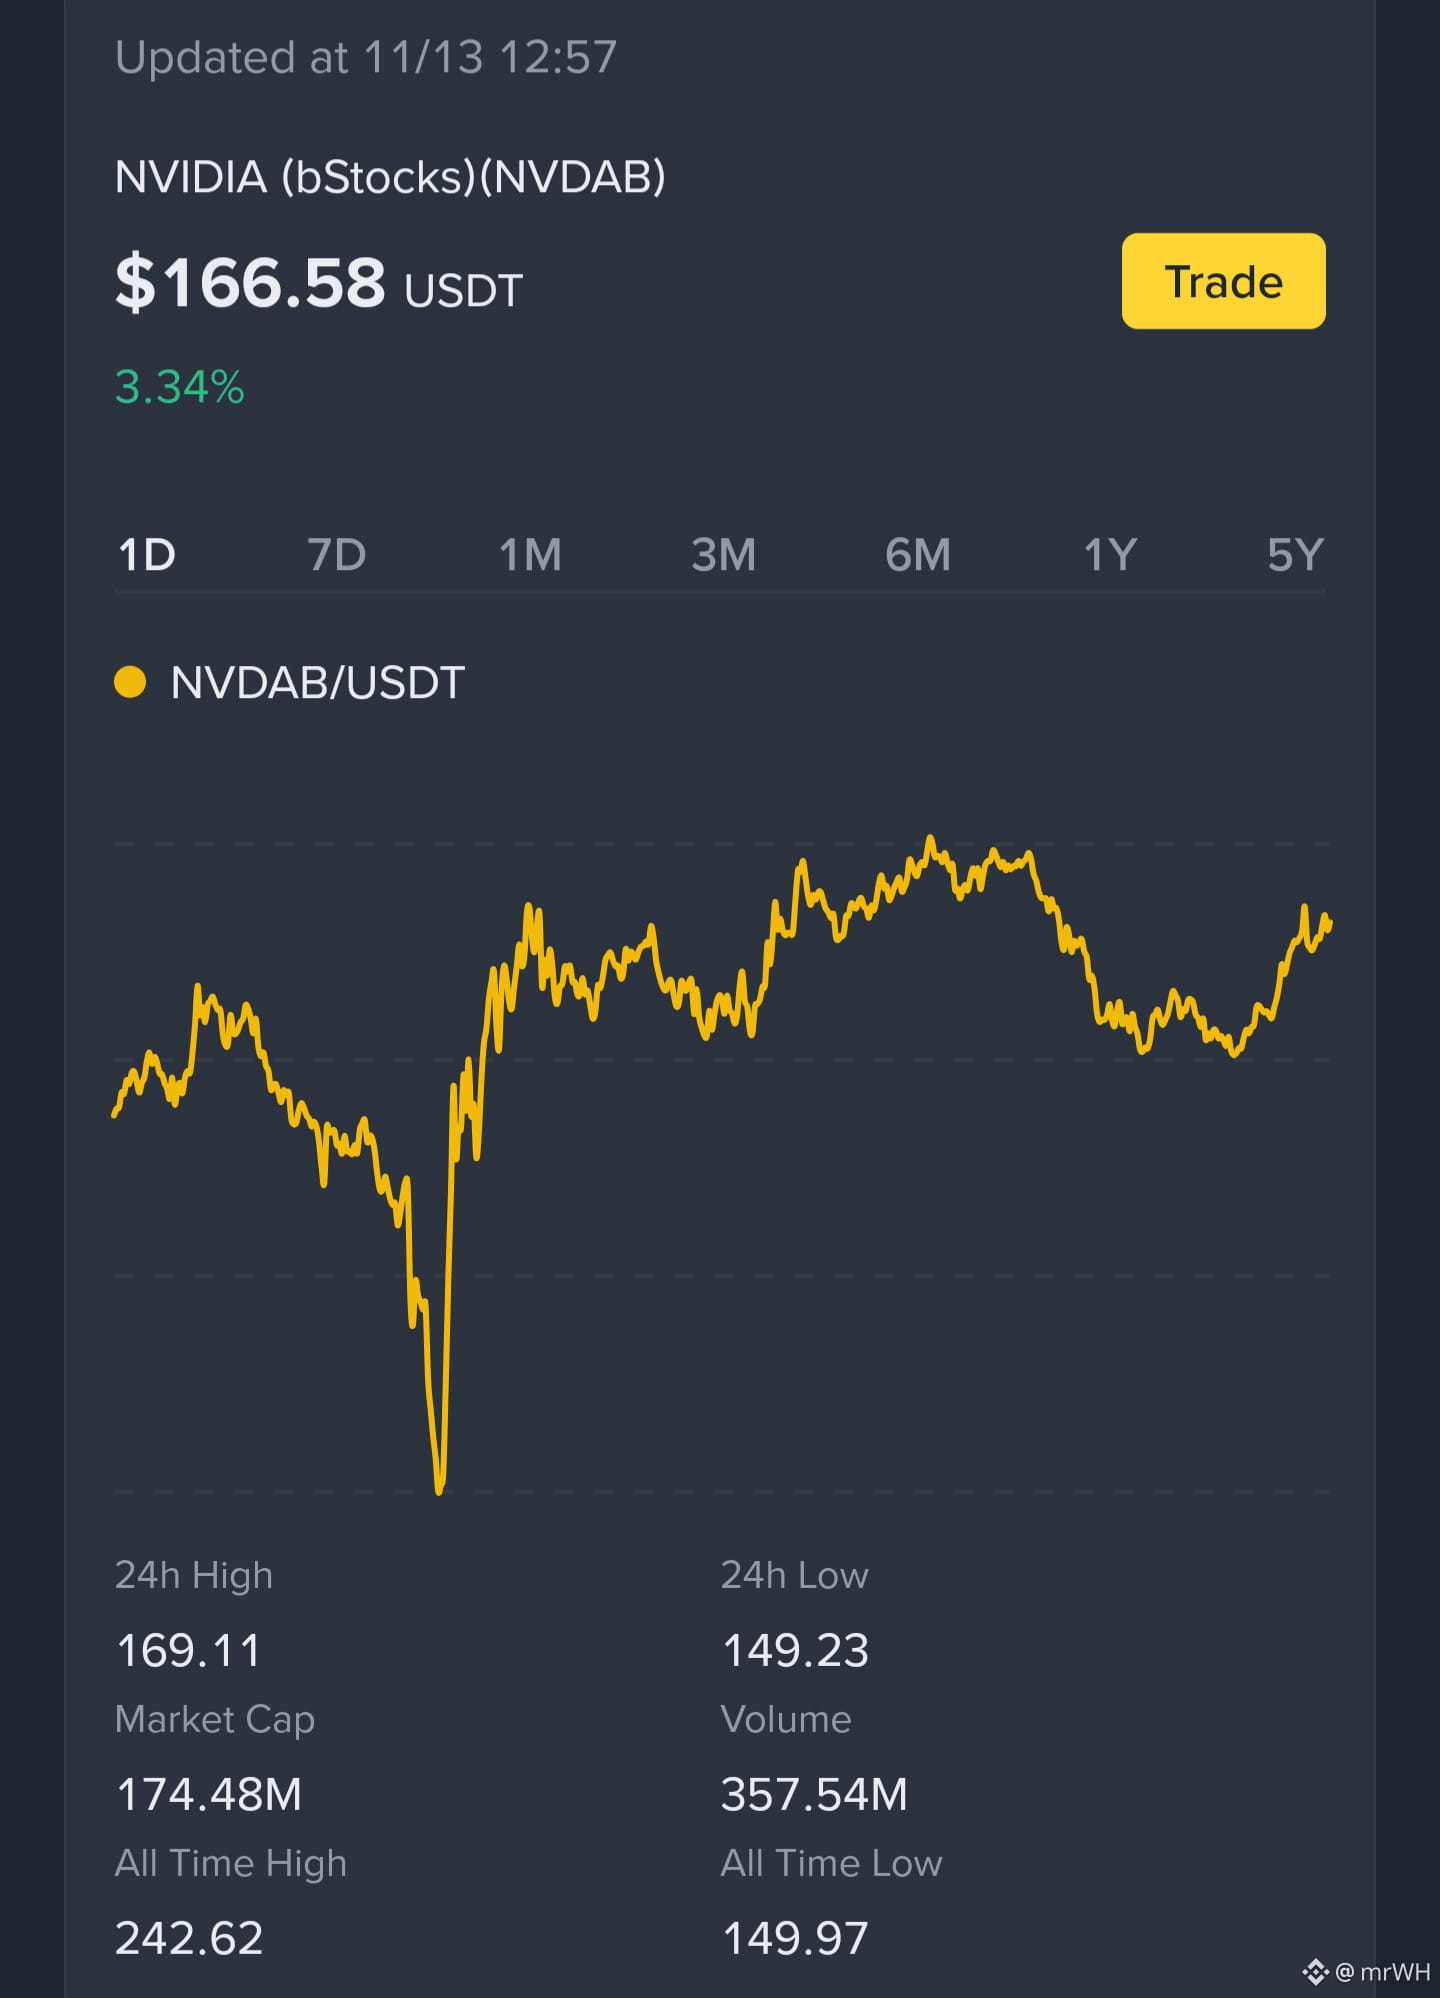
NVDAB is trading at $166.37, up 3.23% in 24h, but still down 11.63% over 7d and 23.29% over 30d. The 1D RSI is 28.53, indicating oversold momentum, while price remains well below the 99-day EMA at $210.41. The latest closed daily candle reached $149.23 and closed at $168.16; large-order flow was a $7.56M net outflow.
Takeaway: This looks like a high-volatility rebound within a broader weak structure—not confirmation of a trend reversal. Headline risk remains significant.
#NVDAB #TradFiForBeginners
NVDAB is trading at $166.37, up 3.23% in 24h, but still down 11.63% over 7d and 23.29% over 30d. The 1D RSI is 28.53, indicating oversold momentum, while price remains well below the 99-day EMA at $210.41. The latest closed daily candle reached $149.23 and closed at $168.16; large-order flow was a $7.56M net outflow.
Takeaway: This looks like a high-volatility rebound within a broader weak structure—not confirmation of a trend reversal. Headline risk remains significant.
#NVDAB #TradFiForBeginners
Takeaway: This looks like a high-volatility rebound within a broader weak structure—not confirmation of a trend reversal. Headline risk remains significant.
#NVDAB #TradFiForBeginners
27

·
--
Bullish
AI MARKET INTEREST MEETS TOKENIZATION: NVDAB IS AN INTERESTING CASE!
$NVDAB represents an intersection between digital asset infrastructure and exposure linked to a major name in the artificial intelligence industry.
AI continues to influence discussions across technology and financial markets. However, traders should not assume that enthusiasm around artificial intelligence automatically translates into gains for every related tokenized product.
{spot}(NVDABUSDT)
Before considering a position, verify the product's structure, underlying exposure, issuer information, liquidity, and trading conditions. Good research is more valuable than following a popular trend without understanding the risks.
#NVDAB #Binance #altcoins #TrendingTopic #AI
AI MARKET INTEREST MEETS TOKENIZATION: NVDAB IS AN INTERESTING CASE!
$NVDAB represents an intersection between digital asset infrastructure and exposure linked to a major name in the artificial intelligence industry.
AI continues to influence discussions across technology and financial markets. However, traders should not assume that enthusiasm around artificial intelligence automatically translates into gains for every related tokenized product.
Before considering a position, verify the product's structure, underlying exposure, issuer information, liquidity, and trading conditions. Good research is more valuable than following a popular trend without understanding the risks.
#NVDAB #Binance #altcoins #TrendingTopic #AI
$NVDAB represents an intersection between digital asset infrastructure and exposure linked to a major name in the artificial intelligence industry.
AI continues to influence discussions across technology and financial markets. However, traders should not assume that enthusiasm around artificial intelligence automatically translates into gains for every related tokenized product.
Before considering a position, verify the product's structure, underlying exposure, issuer information, liquidity, and trading conditions. Good research is more valuable than following a popular trend without understanding the risks.
#NVDAB #Binance #altcoins #TrendingTopic #AI

1
1
·
--
Bullish
$NVDAB : THE GROWING INTEREST IN TOKENIZED REAL-WORLD ASSETS
$NVDAB highlights an interesting connection between traditional financial markets and blockchain-based asset representation.
Tokenization can make certain forms of market exposure accessible through digital infrastructure, but the structure of each product matters. Traders should verify the underlying issuer, ownership rights, trading availability, and any applicable restrictions before investing.
{spot}(NVDABUSDT)
AI-related market enthusiasm can influence interest in NVIDIA-linked exposure, but that does not guarantee a tokenized product will rise in value. I would focus on verified product information and market liquidity before making a decision.
#NVDAB #Binance #altcoins #TrendingTopic #AI
$NVDAB : THE GROWING INTEREST IN TOKENIZED REAL-WORLD ASSETS
$NVDAB highlights an interesting connection between traditional financial markets and blockchain-based asset representation.
Tokenization can make certain forms of market exposure accessible through digital infrastructure, but the structure of each product matters. Traders should verify the underlying issuer, ownership rights, trading availability, and any applicable restrictions before investing.
AI-related market enthusiasm can influence interest in NVIDIA-linked exposure, but that does not guarantee a tokenized product will rise in value. I would focus on verified product information and market liquidity before making a decision.
#NVDAB #Binance #altcoins #TrendingTopic #AI
$NVDAB highlights an interesting connection between traditional financial markets and blockchain-based asset representation.
Tokenization can make certain forms of market exposure accessible through digital infrastructure, but the structure of each product matters. Traders should verify the underlying issuer, ownership rights, trading availability, and any applicable restrictions before investing.
AI-related market enthusiasm can influence interest in NVIDIA-linked exposure, but that does not guarantee a tokenized product will rise in value. I would focus on verified product information and market liquidity before making a decision.
#NVDAB #Binance #altcoins #TrendingTopic #AI


Everyone sees a +3.2% bounce and thinks the bottom is in.
They're watching the wrong candle.
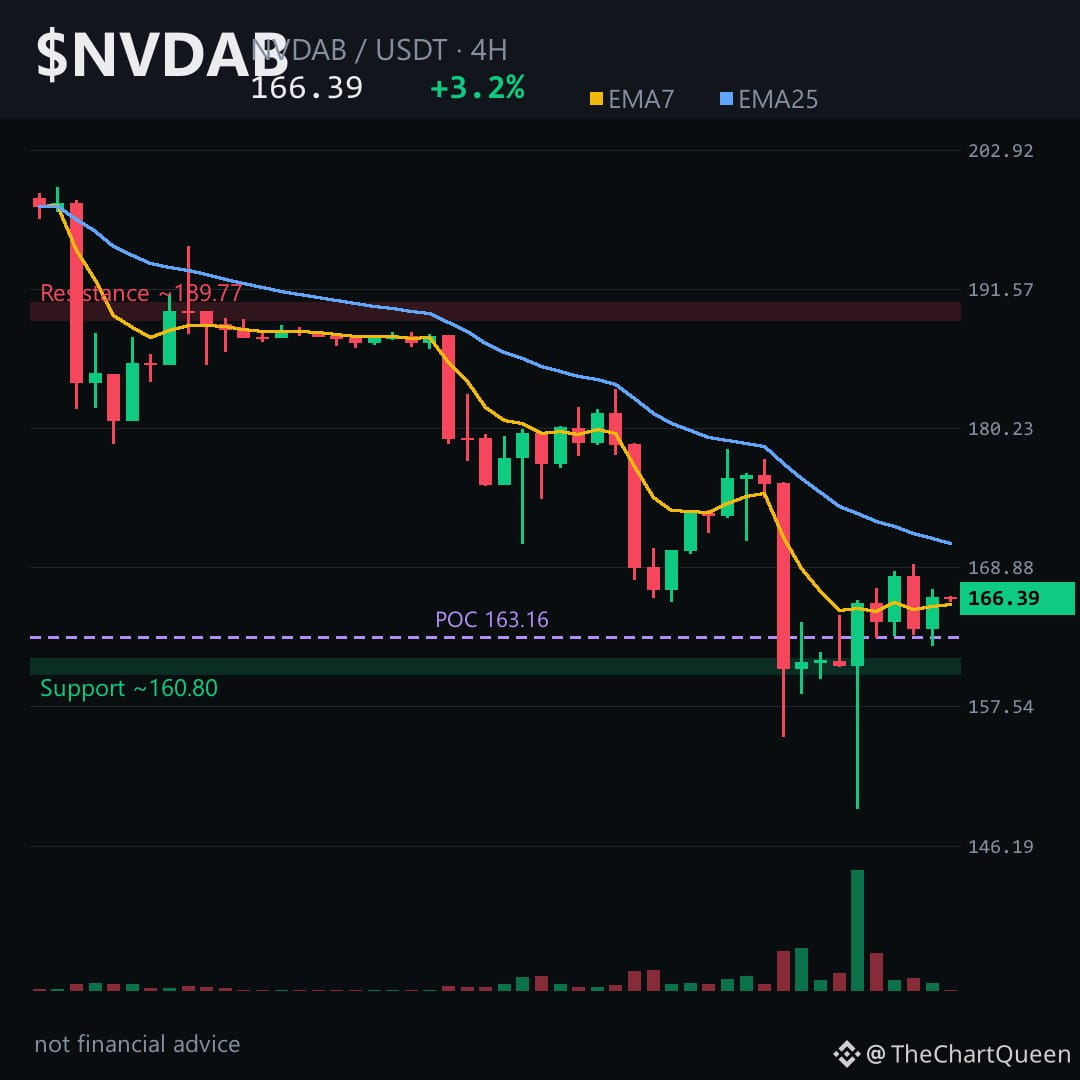
That 8.57% dump two sessions ago carved a bearish gap from roughly 175 down to 164. Price is now sitting inside that gap, not above it. The 4H chart shows EMA7 still buried under EMA25, and RSI is only at 42 — this is a weak bounce inside a downtrend, not a reversal.
The 4H picture is the cleanest read. The volume profile's point of control sits near 163, and price is hovering just above it around 167. That's the line in the sand. If $NVDAB loses the ~163 area, the next liquidity pocket doesn't appear until the low 150s — that's where the bounce started.
The thesis dies on a 4H close back above ~175, reclaiming the top of that unfilled gap. Until then, the path of least resistance points lower, toward the ~152 zone.
My read: this bounce is a relief rally inside a larger bleed. The real risk isn't missing the bottom — it's catching a knife before the gap fills.
Tap $NVDAB to pull up the chart and check these levels yourself. I'll keep tracking whether the 163 floor holds or folds — follow so that read lands in your feed.
Which zone matters more to you right now — 163 support or that 175 gap above $NVDAB? 👇
⚠️ Not financial advice. DYOR.
#NVDAB #Crypto #BinanceSquare
Everyone sees a +3.2% bounce and thinks the bottom is in.
They're watching the wrong candle.
That 8.57% dump two sessions ago carved a bearish gap from roughly 175 down to 164. Price is now sitting inside that gap, not above it. The 4H chart shows EMA7 still buried under EMA25, and RSI is only at 42 — this is a weak bounce inside a downtrend, not a reversal.
The 4H picture is the cleanest read. The volume profile's point of control sits near 163, and price is hovering just above it around 167. That's the line in the sand. If $NVDAB loses the ~163 area, the next liquidity pocket doesn't appear until the low 150s — that's where the bounce started.
The thesis dies on a 4H close back above ~175, reclaiming the top of that unfilled gap. Until then, the path of least resistance points lower, toward the ~152 zone.
My read: this bounce is a relief rally inside a larger bleed. The real risk isn't missing the bottom — it's catching a knife before the gap fills.
Tap $NVDAB to pull up the chart and check these levels yourself. I'll keep tracking whether the 163 floor holds or folds — follow so that read lands in your feed.
Which zone matters more to you right now — 163 support or that 175 gap above $NVDAB ? 👇
⚠️ Not financial advice. DYOR.
#NVDAB #Crypto #BinanceSquare
They're watching the wrong candle.
That 8.57% dump two sessions ago carved a bearish gap from roughly 175 down to 164. Price is now sitting inside that gap, not above it. The 4H chart shows EMA7 still buried under EMA25, and RSI is only at 42 — this is a weak bounce inside a downtrend, not a reversal.
The 4H picture is the cleanest read. The volume profile's point of control sits near 163, and price is hovering just above it around 167. That's the line in the sand. If $NVDAB loses the ~163 area, the next liquidity pocket doesn't appear until the low 150s — that's where the bounce started.
The thesis dies on a 4H close back above ~175, reclaiming the top of that unfilled gap. Until then, the path of least resistance points lower, toward the ~152 zone.
My read: this bounce is a relief rally inside a larger bleed. The real risk isn't missing the bottom — it's catching a knife before the gap fills.
Tap $NVDAB to pull up the chart and check these levels yourself. I'll keep tracking whether the 163 floor holds or folds — follow so that read lands in your feed.
Which zone matters more to you right now — 163 support or that 175 gap above $NVDAB ? 👇
⚠️ Not financial advice. DYOR.
#NVDAB #Crypto #BinanceSquare
51
·
--
Bullish
$NVDAB GAINS ATTENTION: TOKENIZED STOCK EXPOSURE IN FOCUS
$NVDAB was showing a 2.23% gain at 164.38 in the supplied snapshot. Its connection to NVIDIA-related tokenized exposure makes it an interesting asset to watch at the intersection of traditional equities and crypto markets.
Still, traders should understand what they are buying. Tokenized stock products can have different structures, risks, trading conditions, and access restrictions compared with ordinary shares or blockchain-native tokens.
The recent positive movement is worth monitoring, but one green session does not confirm a sustained trend. I would focus on liquidity, product details, and whether buying momentum continues.
{spot}(NVDABUSDT)
#NVDAB #Binance #BinanceSquare #TrendingTopic #AI
$NVDAB GAINS ATTENTION: TOKENIZED STOCK EXPOSURE IN FOCUS
$NVDAB was showing a 2.23% gain at 164.38 in the supplied snapshot. Its connection to NVIDIA-related tokenized exposure makes it an interesting asset to watch at the intersection of traditional equities and crypto markets.
Still, traders should understand what they are buying. Tokenized stock products can have different structures, risks, trading conditions, and access restrictions compared with ordinary shares or blockchain-native tokens.
The recent positive movement is worth monitoring, but one green session does not confirm a sustained trend. I would focus on liquidity, product details, and whether buying momentum continues.
#NVDAB #Binance #BinanceSquare #TrendingTopic #AI
$NVDAB was showing a 2.23% gain at 164.38 in the supplied snapshot. Its connection to NVIDIA-related tokenized exposure makes it an interesting asset to watch at the intersection of traditional equities and crypto markets.
Still, traders should understand what they are buying. Tokenized stock products can have different structures, risks, trading conditions, and access restrictions compared with ordinary shares or blockchain-native tokens.
The recent positive movement is worth monitoring, but one green session does not confirm a sustained trend. I would focus on liquidity, product details, and whether buying momentum continues.
#NVDAB #Binance #BinanceSquare #TrendingTopic #AI

1
·
--
Bullish
🔥 NVDAB IS GREEN WHILE THE CRYPTO MARKET STRUGGLES!
$NVDAB — $164.38 | +2.23%
$NVDAB is attracting attention with positive movement in the latest market snapshot. Its connection to tokenized NVIDIA stock exposure makes it different from traditional cryptocurrencies. NVIDIA's position in artificial intelligence, GPUs and data-center infrastructure gives traders another market narrative to follow. However, tokenized exposure also involves issuer, custody and market-access risks. I would monitor its underlying stock performance and trading liquidity before considering a position.
Can $NVDAB maintain its positive momentum?
NFA. DYOR. Follow for more tokenized asset analysis.
{spot}(NVDABUSDT)
#NVDAB #NVIDIA #TokenizedAssets #ArtificialIntelligence #TrendingTopic
🔥 NVDAB IS GREEN WHILE THE CRYPTO MARKET STRUGGLES!
$NVDAB — $164.38 | +2.23%
$NVDAB is attracting attention with positive movement in the latest market snapshot. Its connection to tokenized NVIDIA stock exposure makes it different from traditional cryptocurrencies. NVIDIA's position in artificial intelligence, GPUs and data-center infrastructure gives traders another market narrative to follow. However, tokenized exposure also involves issuer, custody and market-access risks. I would monitor its underlying stock performance and trading liquidity before considering a position.
Can $NVDAB maintain its positive momentum?
NFA. DYOR. Follow for more tokenized asset analysis.
#NVDAB #NVIDIA #TokenizedAssets #ArtificialIntelligence #TrendingTopic
$NVDAB — $164.38 | +2.23%
$NVDAB is attracting attention with positive movement in the latest market snapshot. Its connection to tokenized NVIDIA stock exposure makes it different from traditional cryptocurrencies. NVIDIA's position in artificial intelligence, GPUs and data-center infrastructure gives traders another market narrative to follow. However, tokenized exposure also involves issuer, custody and market-access risks. I would monitor its underlying stock performance and trading liquidity before considering a position.
Can $NVDAB maintain its positive momentum?
NFA. DYOR. Follow for more tokenized asset analysis.
#NVDAB #NVIDIA #TokenizedAssets #ArtificialIntelligence #TrendingTopic

🚀 NVDAB MOVES HIGHER WHILE CRYPTO FACES PRESSURE!
$NVDAB — $164.38 (+2.23%)
$ETH — $1,925.42 (-6.06%)
$XRP — $1.0053 (-3.74%)
NVDAB is showing positive movement while Ethereum and XRP remain under pressure. NVDAB represents tokenized exposure linked to NVIDIA shares, so its market drivers differ from those of blockchain-native cryptocurrencies. This divergence deserves attention. Traders should analyze each asset independently, monitor liquidity and avoid assuming that every digital asset follows the same trend. Confirmation is more important than excitement around a green candle.
NFA. DYOR. Follow for more trading discussions.
#NVDAB #ETH #XRP #TokenizedAssets #CryptoAnalysis
POLL QUESTION:
Which asset has the most interesting setup right now?
{spot}(NVDABUSDT)
{spot}(ETHUSDT)
{spot}(XRPUSDT)
🚀 NVDAB MOVES HIGHER WHILE CRYPTO FACES PRESSURE!
$NVDAB — $164.38 (+2.23%)
$ETH — $1,925.42 (-6.06%)
$XRP — $1.0053 (-3.74%)
NVDAB is showing positive movement while Ethereum and XRP remain under pressure. NVDAB represents tokenized exposure linked to NVIDIA shares, so its market drivers differ from those of blockchain-native cryptocurrencies. This divergence deserves attention. Traders should analyze each asset independently, monitor liquidity and avoid assuming that every digital asset follows the same trend. Confirmation is more important than excitement around a green candle.
NFA. DYOR. Follow for more trading discussions.
#NVDAB #ETH #XRP #TokenizedAssets #CryptoAnalysis
POLL QUESTION:
Which asset has the most interesting setup right now?
$NVDAB — $164.38 (+2.23%)
$ETH — $1,925.42 (-6.06%)
$XRP — $1.0053 (-3.74%)
NVDAB is showing positive movement while Ethereum and XRP remain under pressure. NVDAB represents tokenized exposure linked to NVIDIA shares, so its market drivers differ from those of blockchain-native cryptocurrencies. This divergence deserves attention. Traders should analyze each asset independently, monitor liquidity and avoid assuming that every digital asset follows the same trend. Confirmation is more important than excitement around a green candle.
NFA. DYOR. Follow for more trading discussions.
#NVDAB #ETH #XRP #TokenizedAssets #CryptoAnalysis
POLL QUESTION:
Which asset has the most interesting setup right now?
A. NVDAB
B. ETH
C. XRP
D. None at the moment
20 hr(s) left
1
60

·
--
$NVDAB +1.49% | $SOL -5.67% | $USD1 -0.00%
#NVDAB is holding at $163.78, up 1.49% on $216.6 M of trade. The modest gain paired with solid turnover suggests some continued interest.
#SOL sits at $78.57, down 5.67% despite $211.5 M moving through its order books. As a high‑performance Layer 1 aimed at mass adoption, the dip may be temporary, especially with that level of volume. 📈
#USD1 trades near its peg at $0.9993, essentially flat with $172.5 M exchanged.
SOL’s volume remains robust even as the price slides, a sign worth watching for potential accumulation.
#Write2Earn #Binance
$NVDAB +1.49% | $SOL -5.67% | $USD1 -0.00%
#NVDAB is holding at $163.78, up 1.49% on $216.6 M of trade. The modest gain paired with solid turnover suggests some continued interest.
#SOL sits at $78.57, down 5.67% despite $211.5 M moving through its order books. As a high‑performance Layer 1 aimed at mass adoption, the dip may be temporary, especially with that level of volume. 📈
#USD1 trades near its peg at $0.9993, essentially flat with $172.5 M exchanged.
SOL’s volume remains robust even as the price slides, a sign worth watching for potential accumulation.
#Write2Earn #Binance
#NVDAB is holding at $163.78, up 1.49% on $216.6 M of trade. The modest gain paired with solid turnover suggests some continued interest.
#SOL sits at $78.57, down 5.67% despite $211.5 M moving through its order books. As a high‑performance Layer 1 aimed at mass adoption, the dip may be temporary, especially with that level of volume. 📈
#USD1 trades near its peg at $0.9993, essentially flat with $172.5 M exchanged.
SOL’s volume remains robust even as the price slides, a sign worth watching for potential accumulation.
#Write2Earn #Binance
13

🩸 $NVDAB BLOODBATH OR A TEXTBOOK ACCUMULATION WINDOW FOR THE BRAVE? 🦈
Late-night price velocity just flashed red across the board, triggering a wave of retail panic. Weak hands are puking their positions while the market tests everyone's psychological resolve. 📊
This is where institutional discipline separates the tourists from the veterans. When heavy volatility shakes out emotional sellers, foundational assets like $NVDAB hold their structural weight because core value never sleeps. ⚡
Cool heads survive the blender and position early for the inevitable trend reversal. 💬 Are you weathering this storm with diamond hands or sweating your allocations right now? 👇
⚠️ Not financial advice. Always manage your risk. 🛡️
🏷️ #NVDAB #Crypto #MarketCorrection #LongTermInvesting #TradingPsychology
🔥 💎
🩸 $NVDAB BLOODBATH OR A TEXTBOOK ACCUMULATION WINDOW FOR THE BRAVE? 🦈
Late-night price velocity just flashed red across the board, triggering a wave of retail panic. Weak hands are puking their positions while the market tests everyone's psychological resolve. 📊
This is where institutional discipline separates the tourists from the veterans. When heavy volatility shakes out emotional sellers, foundational assets like $NVDAB hold their structural weight because core value never sleeps. ⚡
Cool heads survive the blender and position early for the inevitable trend reversal. 💬 Are you weathering this storm with diamond hands or sweating your allocations right now? 👇
⚠️ Not financial advice. Always manage your risk. 🛡️
🏷️ #NVDAB #Crypto #MarketCorrection #LongTermInvesting #TradingPsychology
🔥 💎
Late-night price velocity just flashed red across the board, triggering a wave of retail panic. Weak hands are puking their positions while the market tests everyone's psychological resolve. 📊
This is where institutional discipline separates the tourists from the veterans. When heavy volatility shakes out emotional sellers, foundational assets like $NVDAB hold their structural weight because core value never sleeps. ⚡
Cool heads survive the blender and position early for the inevitable trend reversal. 💬 Are you weathering this storm with diamond hands or sweating your allocations right now? 👇
⚠️ Not financial advice. Always manage your risk. 🛡️
🏷️ #NVDAB #Crypto #MarketCorrection #LongTermInvesting #TradingPsychology
🔥 💎

8

·
--
🚨 $NVDAB — BE CAREFUL! NVIDIA SELLING PRESSURE! 📉
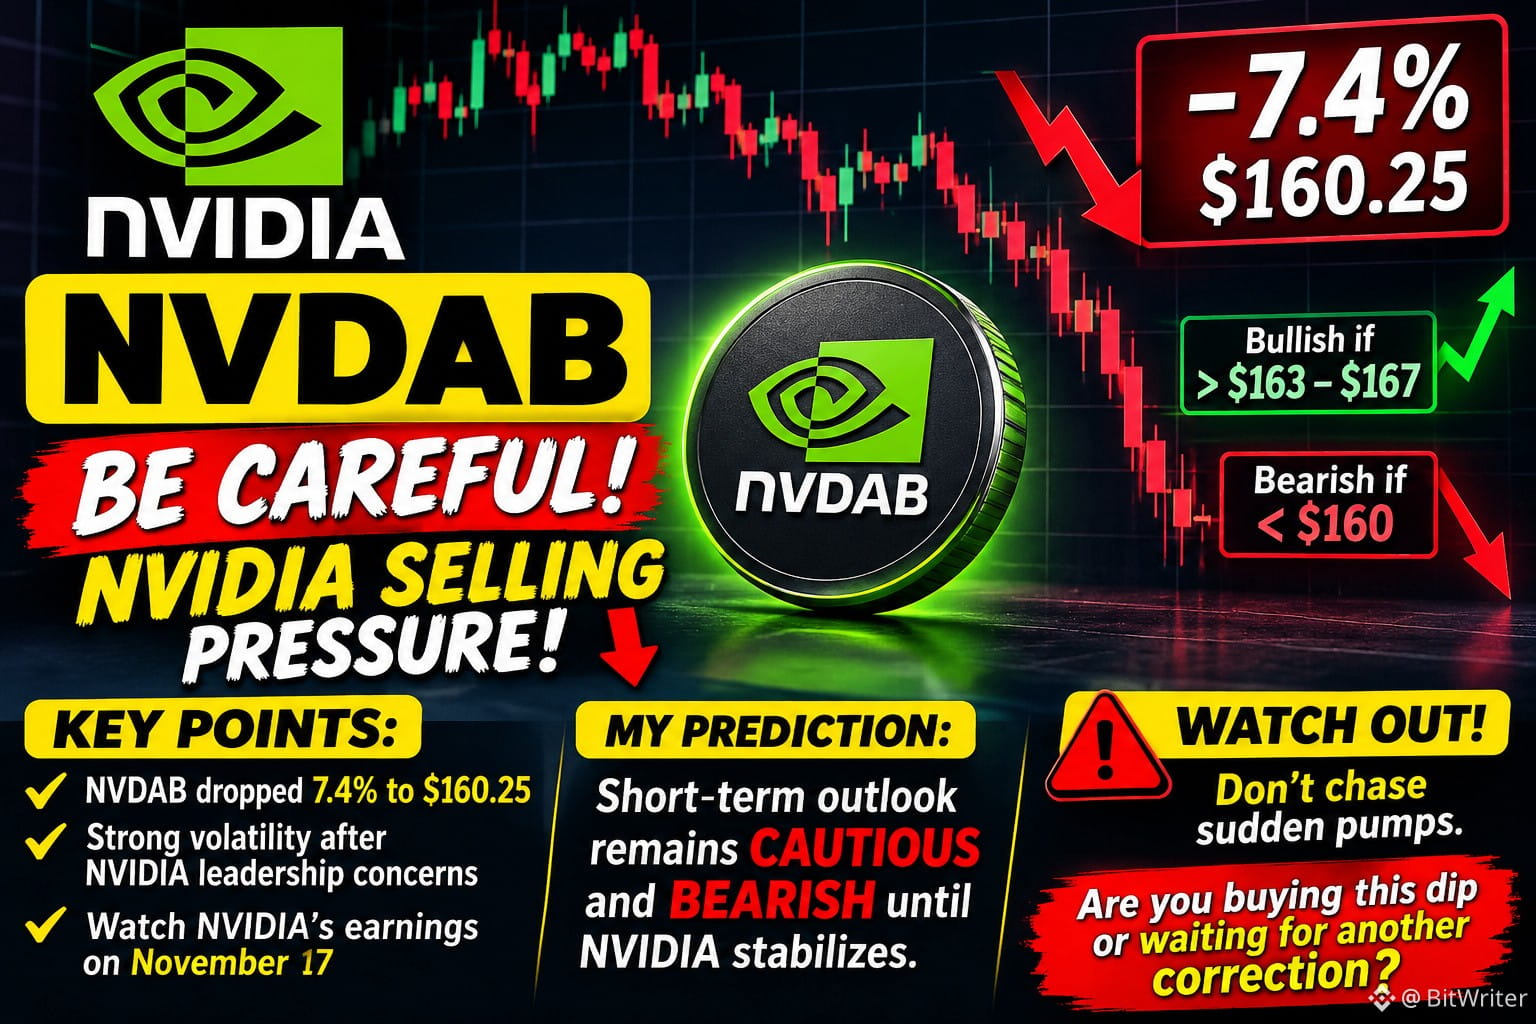
NVDAB is facing strong volatility after a sharp decline linked to concerns surrounding NVIDIA's leadership. The token dropped around 7.4% to $160.25 in the latest November 12 report.
🔴 Bearish scenario: A break below $160 could trigger further downside.
🟢 Bullish scenario: Recovery above $163–$167 could bring buyers back.
My prediction: Short-term outlook remains cautious and bearish until NVIDIA stabilizes.
⚠️ Watch NVIDIA's stock price and upcoming earnings on November 17. Don't chase sudden pumps.
Are you buying this dip or waiting for another correction? 👇
#NVDAB #NVDA
{spot}(NVDABUSDT)
🚨 $NVDAB — BE CAREFUL! NVIDIA SELLING PRESSURE! 📉
NVDAB is facing strong volatility after a sharp decline linked to concerns surrounding NVIDIA's leadership. The token dropped around 7.4% to $160.25 in the latest November 12 report.
🔴 Bearish scenario: A break below $160 could trigger further downside.
🟢 Bullish scenario: Recovery above $163–$167 could bring buyers back.
My prediction: Short-term outlook remains cautious and bearish until NVIDIA stabilizes.
⚠️ Watch NVIDIA's stock price and upcoming earnings on November 17. Don't chase sudden pumps.
Are you buying this dip or waiting for another correction? 👇
#NVDAB #NVDA
NVDAB is facing strong volatility after a sharp decline linked to concerns surrounding NVIDIA's leadership. The token dropped around 7.4% to $160.25 in the latest November 12 report.
🔴 Bearish scenario: A break below $160 could trigger further downside.
🟢 Bullish scenario: Recovery above $163–$167 could bring buyers back.
My prediction: Short-term outlook remains cautious and bearish until NVIDIA stabilizes.
⚠️ Watch NVIDIA's stock price and upcoming earnings on November 17. Don't chase sudden pumps.
Are you buying this dip or waiting for another correction? 👇
#NVDAB #NVDA
107
·
--
$NVDAB +4.87% | $USD1 +0.02% | $ZEC -3.79%
#NVDAB trades at $168.46, up +4.87% on $230.2 M of volume. The surge hints at renewed buying interest, though the move could be short‑lived.
#USD1 hovers around $0.9995, edging up +0.02% with $161.7 M changing hands. Stability is evident, but the thin margin leaves room for volatility.
#ZEC sits at $954.69, down ‑3.79% on $155.0 M of volume. The dip may reflect broader risk‑off sentiment, yet ZEC’s price still holds above the $900 mark.
👀 Watch the relative volume shift: NVDAB’s spike versus ZEC’s decline could signal traders rotating into higher‑growth tech assets.
#Write2Earn #Binance
$NVDAB +4.87% | $USD1 +0.02% | $ZEC -3.79%
#NVDAB trades at $168.46, up +4.87% on $230.2 M of volume. The surge hints at renewed buying interest, though the move could be short‑lived.
#USD1 hovers around $0.9995, edging up +0.02% with $161.7 M changing hands. Stability is evident, but the thin margin leaves room for volatility.
#ZEC sits at $954.69, down ‑3.79% on $155.0 M of volume. The dip may reflect broader risk‑off sentiment, yet ZEC’s price still holds above the $900 mark.
👀 Watch the relative volume shift: NVDAB’s spike versus ZEC’s decline could signal traders rotating into higher‑growth tech assets.
#Write2Earn #Binance
#NVDAB trades at $168.46, up +4.87% on $230.2 M of volume. The surge hints at renewed buying interest, though the move could be short‑lived.
#USD1 hovers around $0.9995, edging up +0.02% with $161.7 M changing hands. Stability is evident, but the thin margin leaves room for volatility.
#ZEC sits at $954.69, down ‑3.79% on $155.0 M of volume. The dip may reflect broader risk‑off sentiment, yet ZEC’s price still holds above the $900 mark.
👀 Watch the relative volume shift: NVDAB’s spike versus ZEC’s decline could signal traders rotating into higher‑growth tech assets.
#Write2Earn #Binance
4

·
--
📊 $NVDAB /USDT – LONG SIGNAL
Trade Plan:
* Entry: 167.00 – 168.50
* Stop Loss (SL): 163.80
Take Profit Targets:
* TP1: 171.00
* TP2: 174.00
* TP3: 178.00
Trade here $NVDAB
{spot}(NVDABUSDT)
Analysis:
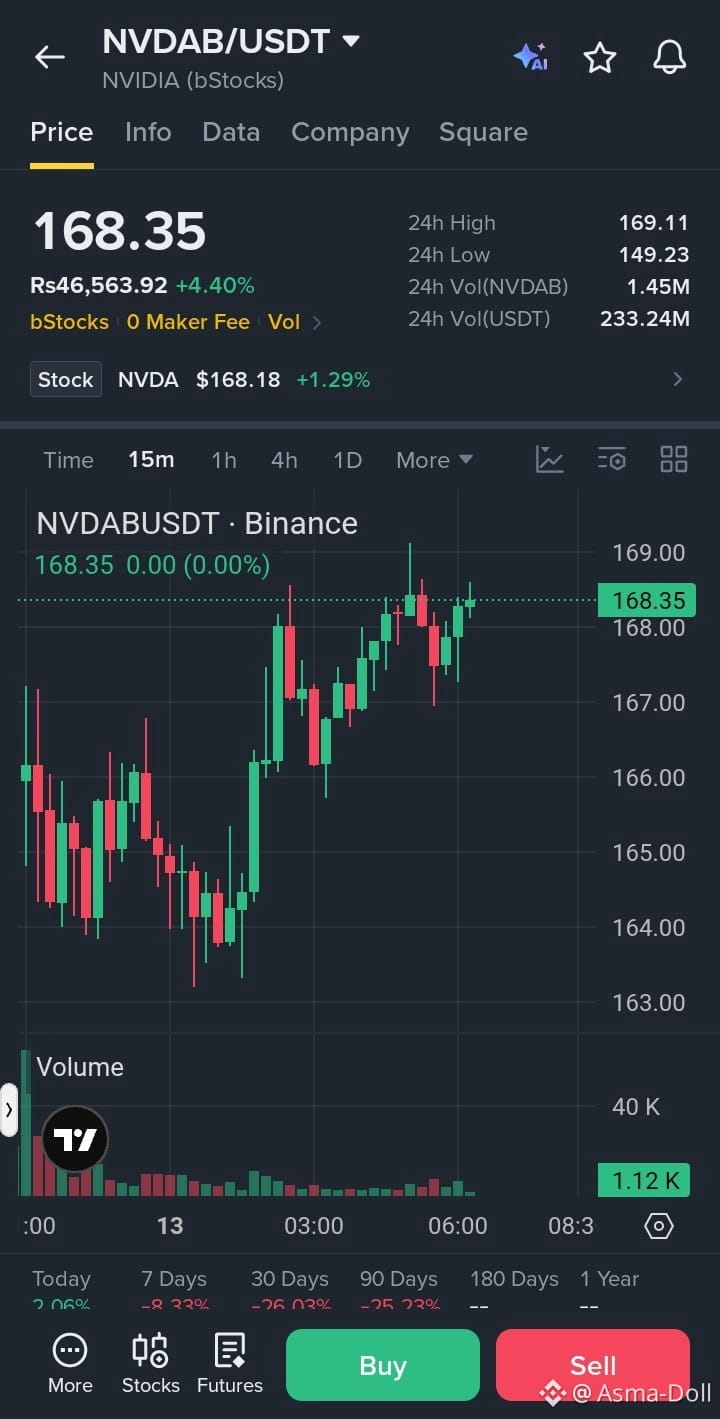
* Strong +4.40% daily price movement.
* Price trading near 24H high of 169.11.
* Strong buying momentum with high trading volume.
* Immediate resistance around 169.00–170.00.
* Breakout above 169.11 could trigger further upside.
* Rejection at resistance may cause a short-term pullback.
Confirmation:
* Sustained 15m candle close above 169.11 with strong volume confirms bullish continuation.
* If price loses 167.00, avoid fresh longs.
Risk-to-Reward:
| Target | Approx. R:R |
| ------ | ----------- |
| TP1 | 1:0.8 |
| TP2 | 1:1.7 |
| TP3 | 1:2.9 |
⚠️ Wait for breakout confirmation. These are indicative levels based on your supplied snapshot, not live-verified prices. NVDAB is a stock-linked token and can be volatile.
#NVDAB #NVDA #BinanceTrading #CryptoSignals #LongSetup
📊 $NVDAB /USDT – LONG SIGNAL
Trade Plan:
* Entry: 167.00 – 168.50
* Stop Loss (SL): 163.80
Take Profit Targets:
* TP1: 171.00
* TP2: 174.00
* TP3: 178.00
Trade here $NVDAB
Analysis:
* Strong +4.40% daily price movement.
* Price trading near 24H high of 169.11.
* Strong buying momentum with high trading volume.
* Immediate resistance around 169.00–170.00.
* Breakout above 169.11 could trigger further upside.
* Rejection at resistance may cause a short-term pullback.
Confirmation:
* Sustained 15m candle close above 169.11 with strong volume confirms bullish continuation.
* If price loses 167.00, avoid fresh longs.
Risk-to-Reward:
| Target | Approx. R:R |
| ------ | ----------- |
| TP1 | 1:0.8 |
| TP2 | 1:1.7 |
| TP3 | 1:2.9 |
⚠️ Wait for breakout confirmation. These are indicative levels based on your supplied snapshot, not live-verified prices. NVDAB is a stock-linked token and can be volatile.
#NVDAB #NVDA #BinanceTrading #CryptoSignals #LongSetup
Trade Plan:
* Entry: 167.00 – 168.50
* Stop Loss (SL): 163.80
Take Profit Targets:
* TP1: 171.00
* TP2: 174.00
* TP3: 178.00
Trade here $NVDAB
Analysis:
* Strong +4.40% daily price movement.
* Price trading near 24H high of 169.11.
* Strong buying momentum with high trading volume.
* Immediate resistance around 169.00–170.00.
* Breakout above 169.11 could trigger further upside.
* Rejection at resistance may cause a short-term pullback.
Confirmation:
* Sustained 15m candle close above 169.11 with strong volume confirms bullish continuation.
* If price loses 167.00, avoid fresh longs.
Risk-to-Reward:
| Target | Approx. R:R |
| ------ | ----------- |
| TP1 | 1:0.8 |
| TP2 | 1:1.7 |
| TP3 | 1:2.9 |
⚠️ Wait for breakout confirmation. These are indicative levels based on your supplied snapshot, not live-verified prices. NVDAB is a stock-linked token and can be volatile.
#NVDAB #NVDA #BinanceTrading #CryptoSignals #LongSetup
24
·
--
$NVDAB +4.86% | $SOXLB +9.86% | $SCRT -22.83%
#NVDAB trades at $168.25, up 4.86% with $235.2 M of volume. The modest gain is supported by solid turnover, suggesting some buying interest.
#SOXLB is at $67.53, climbing 9.86% on $42.6 M of volume. The near‑10% jump paired with decent liquidity hints at a short‑term rally.
#SCRT sits at $0.00710000, down 22.83% with $1.5 M of volume. The steep drop and thin trading may signal heightened risk for the token.
⚡️ Keep an eye on whether SCRT can find support above the $0.0072 level amid the slump.
#Write2Earn #Binance
$NVDAB +4.86% | $SOXLB +9.86% | $SCRT -22.83%
#NVDAB trades at $168.25, up 4.86% with $235.2 M of volume. The modest gain is supported by solid turnover, suggesting some buying interest.
#SOXLB is at $67.53, climbing 9.86% on $42.6 M of volume. The near‑10% jump paired with decent liquidity hints at a short‑term rally.
#SCRT sits at $0.00710000, down 22.83% with $1.5 M of volume. The steep drop and thin trading may signal heightened risk for the token.
⚡️ Keep an eye on whether SCRT can find support above the $0.0072 level amid the slump.
#Write2Earn #Binance
#NVDAB trades at $168.25, up 4.86% with $235.2 M of volume. The modest gain is supported by solid turnover, suggesting some buying interest.
#SOXLB is at $67.53, climbing 9.86% on $42.6 M of volume. The near‑10% jump paired with decent liquidity hints at a short‑term rally.
#SCRT sits at $0.00710000, down 22.83% with $1.5 M of volume. The steep drop and thin trading may signal heightened risk for the token.
⚡️ Keep an eye on whether SCRT can find support above the $0.0072 level amid the slump.
#Write2Earn #Binance
63

·
--
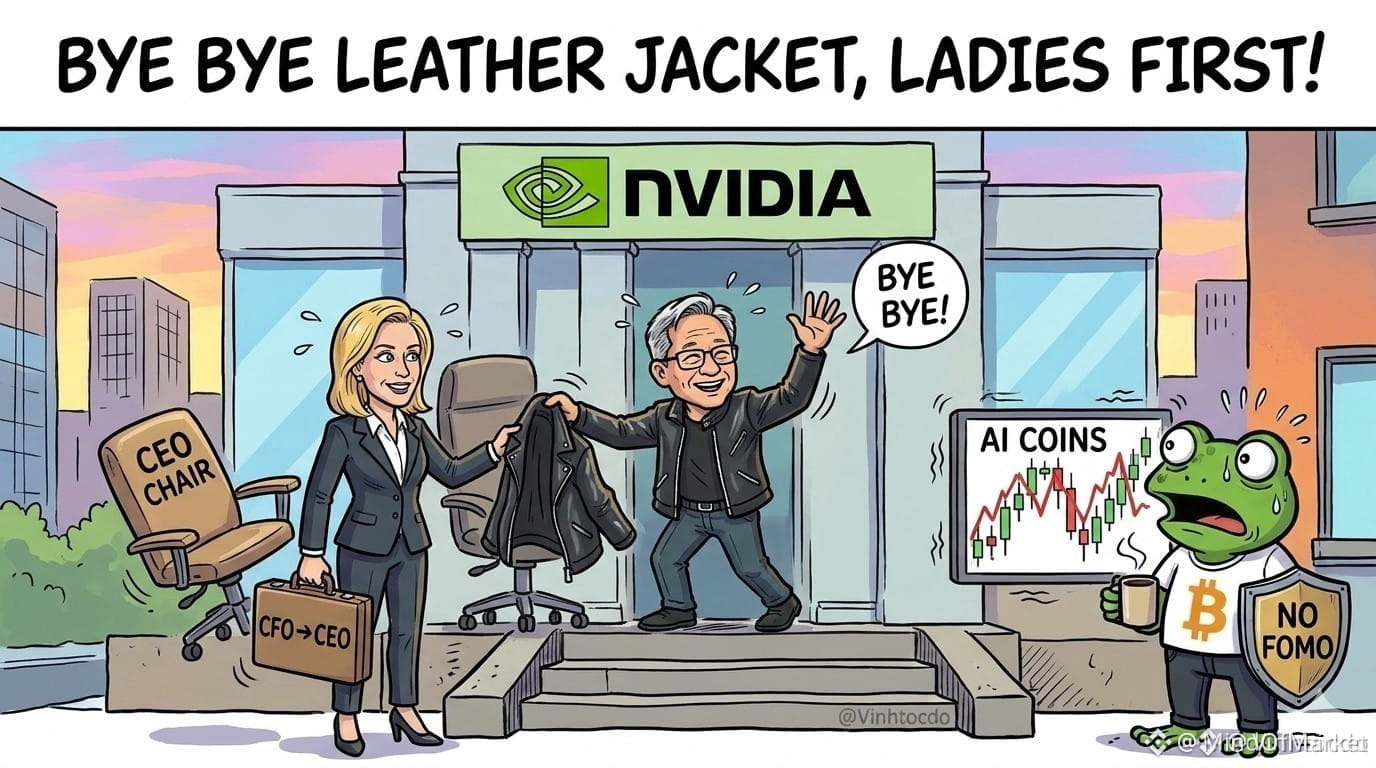
🚨 $NVDAB LEADERSHIP SHIFT TRIGGERS INSTITUTIONAL LIQUIDITY SWEEPS ACROSS AI ASSETS! ⚡
The sudden executive transition at the top of Nvidia introduces a wave of structural volatility across AI-linked sectors like $NVDAB and $AMDB . 📊 Smart money is currently tracking order book depth rather than chasing emotional momentum. 🔍
Instead of forcing positions into a liquidity vacuum, wait for the market to print a confirmed range reclaim or a clear fair value gap mitigation. ⚡ Patience remains our highest-yielding edge when institutional footprints shift.
How are you managing risk during this order flow rotation? 👇
⚠️ Not financial advice. Always manage your risk. 🛡️
🏷️ #NVDAB #MarketStructure #OrderFlow #RiskManagement
🦈 💎
🚨 $NVDAB LEADERSHIP SHIFT TRIGGERS INSTITUTIONAL LIQUIDITY SWEEPS ACROSS AI ASSETS! ⚡
The sudden executive transition at the top of Nvidia introduces a wave of structural volatility across AI-linked sectors like $NVDAB and $AMDB . 📊 Smart money is currently tracking order book depth rather than chasing emotional momentum. 🔍
Instead of forcing positions into a liquidity vacuum, wait for the market to print a confirmed range reclaim or a clear fair value gap mitigation. ⚡ Patience remains our highest-yielding edge when institutional footprints shift.
How are you managing risk during this order flow rotation? 👇
⚠️ Not financial advice. Always manage your risk. 🛡️
🏷️ #NVDAB #MarketStructure #OrderFlow #RiskManagement
🦈 💎
The sudden executive transition at the top of Nvidia introduces a wave of structural volatility across AI-linked sectors like $NVDAB and $AMDB . 📊 Smart money is currently tracking order book depth rather than chasing emotional momentum. 🔍
Instead of forcing positions into a liquidity vacuum, wait for the market to print a confirmed range reclaim or a clear fair value gap mitigation. ⚡ Patience remains our highest-yielding edge when institutional footprints shift.
How are you managing risk during this order flow rotation? 👇
⚠️ Not financial advice. Always manage your risk. 🛡️
🏷️ #NVDAB #MarketStructure #OrderFlow #RiskManagement
🦈 💎
6

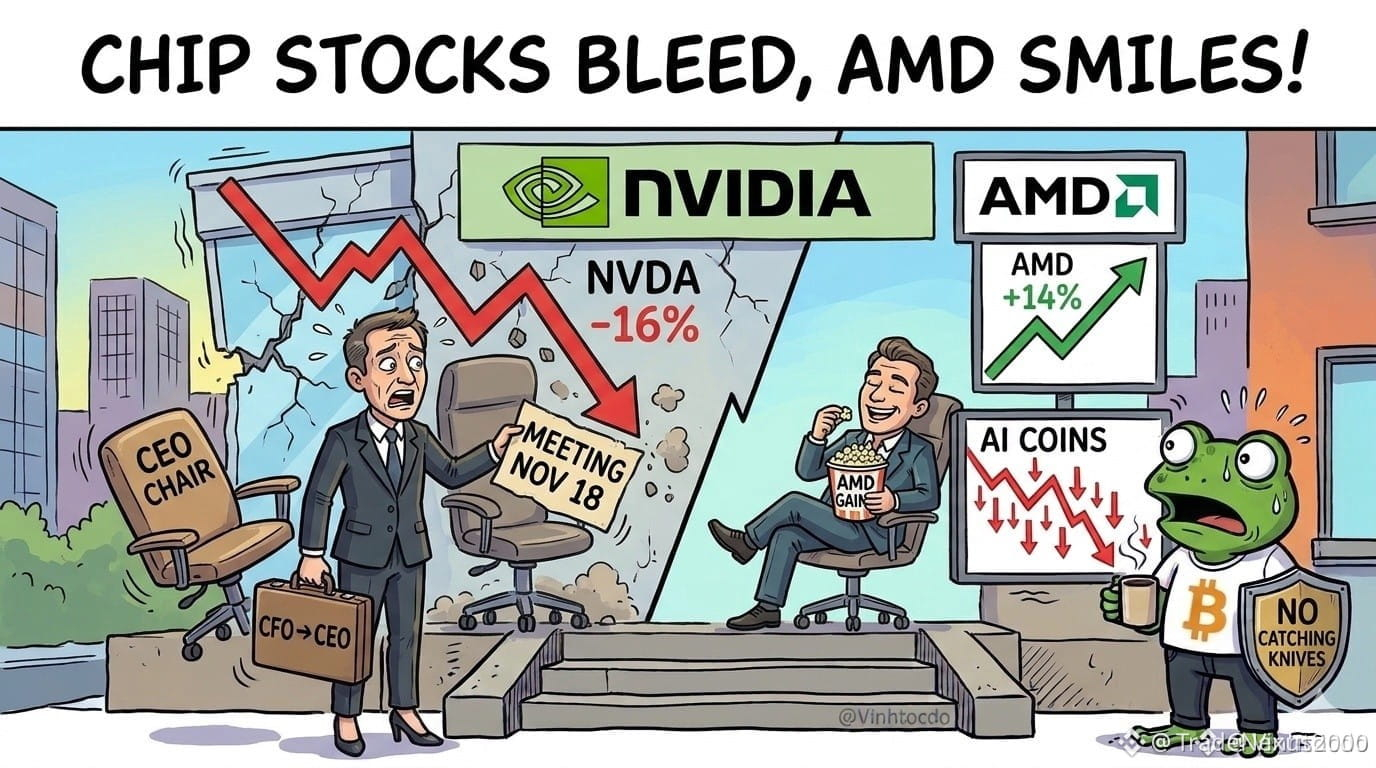
🚨 $NVDAB LIQUIDITY SWEEP AND LEADERSHIP VACUUM TRIGGERS A MASSIVE SECTOR ROTATION! 💥
📊 Smart money is actively reallocating capital as $NVDAB suffers a 16 percent liquidity drain following structural leadership shifts, creating severe overhead supply.
⚡ Meanwhile, $AMDB captures surging institutional bid flow with a 14 percent markup, exploiting the vacuum while market participants await the November 18 clarity meeting.
💡 Patience remains your primary risk shield rather than chasing falling knives in weakened supply zones. 💬 Are you rotating into relative strength or waiting for the structural dust to settle?
⚠️ Not financial advice. Always manage your risk. 🛡️
🏷️ #NVDAB #SectorRotation #SmartMoney #Equities
🔥 💎
🚨 $NVDAB LIQUIDITY SWEEP AND LEADERSHIP VACUUM TRIGGERS A MASSIVE SECTOR ROTATION! 💥
📊 Smart money is actively reallocating capital as $NVDAB suffers a 16 percent liquidity drain following structural leadership shifts, creating severe overhead supply.
⚡ Meanwhile, $AMDB captures surging institutional bid flow with a 14 percent markup, exploiting the vacuum while market participants await the November 18 clarity meeting.
💡 Patience remains your primary risk shield rather than chasing falling knives in weakened supply zones. 💬 Are you rotating into relative strength or waiting for the structural dust to settle?
⚠️ Not financial advice. Always manage your risk. 🛡️
🏷️ #NVDAB #SectorRotation #SmartMoney #Equities
🔥 💎
📊 Smart money is actively reallocating capital as $NVDAB suffers a 16 percent liquidity drain following structural leadership shifts, creating severe overhead supply.
⚡ Meanwhile, $AMDB captures surging institutional bid flow with a 14 percent markup, exploiting the vacuum while market participants await the November 18 clarity meeting.
💡 Patience remains your primary risk shield rather than chasing falling knives in weakened supply zones. 💬 Are you rotating into relative strength or waiting for the structural dust to settle?
⚠️ Not financial advice. Always manage your risk. 🛡️
🏷️ #NVDAB #SectorRotation #SmartMoney #Equities
🔥 💎
72

·
--
Traders are watching whether $NVDAB can turn this retest into continuation.
$NVDAB – Price is trying to stabilize near support, and buyers are watching for continuation from this area.
Trading Plan LONG $NVDAB (max 10x)
🎯 Entry: 166.27 - 167.6
🛑 SL: 165.3
✅ TP1: 169.28
✅ TP2: 171.45
✅ TP3: 173.96
• Fresh 24h volatility is creating a cleaner setup
• Relative volume is keeping this chart active on watchlists
Would you long the retest on $NVDAB, or wait for a reclaim first?
Trade $NVDAB here 👇
#NVDAB #Crypto #PriceAction
Traders are watching whether $NVDAB can turn this retest into continuation.
$NVDAB – Price is trying to stabilize near support, and buyers are watching for continuation from this area.
Trading Plan LONG $NVDAB (max 10x)
🎯 Entry: 166.27 - 167.6
🛑 SL: 165.3
✅ TP1: 169.28
✅ TP2: 171.45
✅ TP3: 173.96
• Fresh 24h volatility is creating a cleaner setup
• Relative volume is keeping this chart active on watchlists
Would you long the retest on $NVDAB , or wait for a reclaim first?
Trade $NVDAB here 👇
#NVDAB #Crypto #PriceAction
$NVDAB – Price is trying to stabilize near support, and buyers are watching for continuation from this area.
Trading Plan LONG $NVDAB (max 10x)
🎯 Entry: 166.27 - 167.6
🛑 SL: 165.3
✅ TP1: 169.28
✅ TP2: 171.45
✅ TP3: 173.96
• Fresh 24h volatility is creating a cleaner setup
• Relative volume is keeping this chart active on watchlists
Would you long the retest on $NVDAB , or wait for a reclaim first?
Trade $NVDAB here 👇
#NVDAB #Crypto #PriceAction
1

·
--
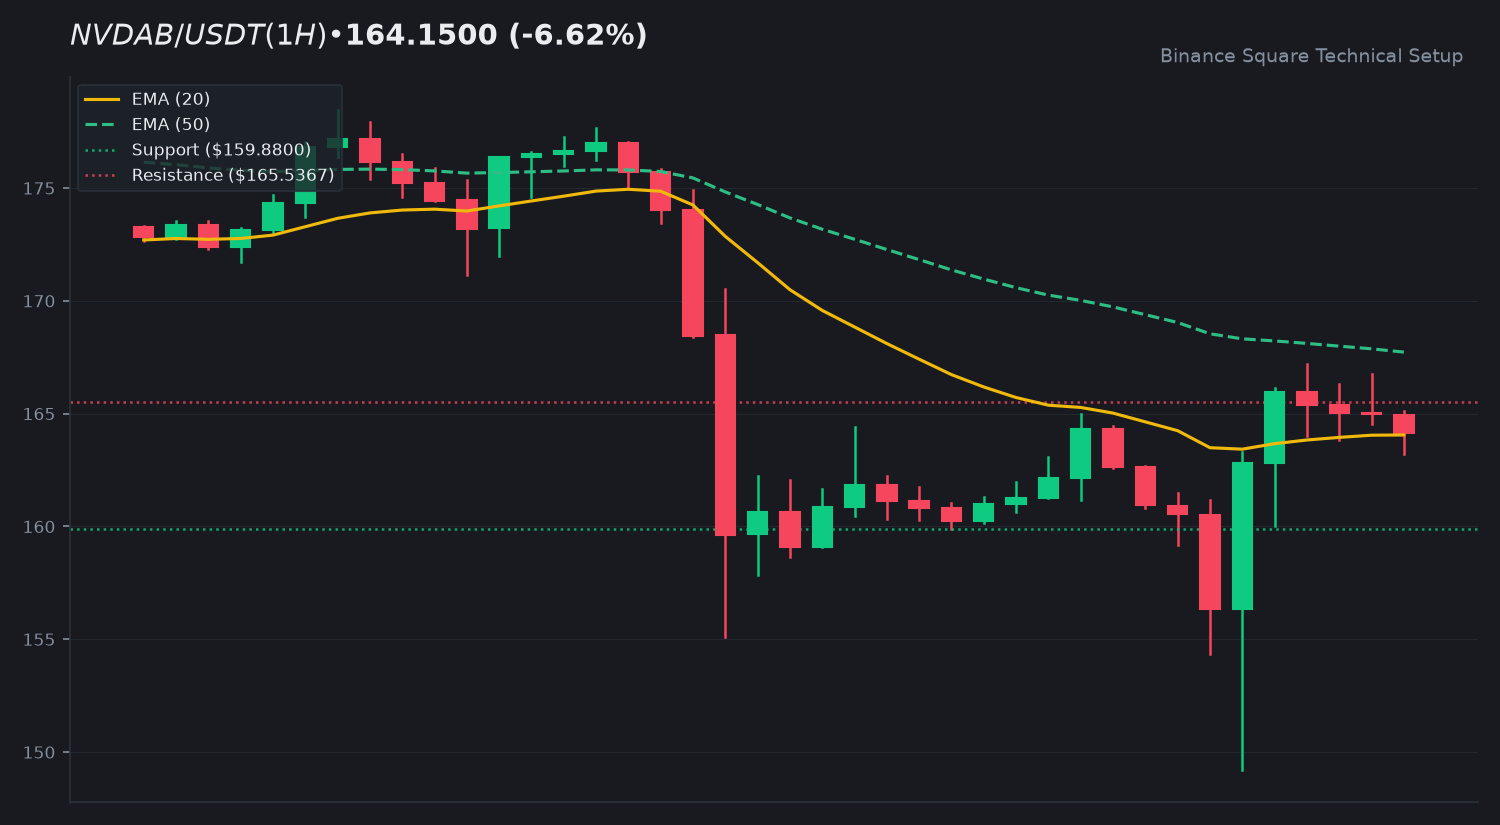
🔥 $NVDAB Technical Update: Key Levels & Momentum Breakdown
📊 1. Market Snapshot
$NVDAB is currently trading at $164.1500, recording a 24-hour correction of -6.62 percent. The asset established a daily trading range between a low of 149.2300 and a high of 176.0000, backed by a robust 24-hour quote volume of 277,593,796 USDT on the pair.
📈 2. Technical Momentum & Indicator Bias
Price action is hovering near the EMA 20 sitting at $164.0560, while remaining just below the EMA 50 positioned at 167.7286. The RSI (14) prints at 48.26, indicating neutral market momentum without overbought or oversold conditions. Meanwhile, the MACD histogram shows a positive reading of +0.8588 as the MACD line converges toward the signal line, pointing toward ongoing consolidation efforts.
🎯 3. Key Technical Levels to Watch
• 🟢 Resistance Zone: First resistance stands at 165.5367, with a secondary target extension near 180.2017.
• 🔴 Support Zone: Immediate support floor is located at 159.8800, with deeper downside tracking at 155.1000.
• 🛡️ Pivot Confluence: The EMA 20 at $164.0560 serves as the primary short-term directional pivot.
💡 4. Technical Takeaway & Risk Management
The current low volume profile suggests weak immediate conviction from market participants. Traders should monitor how price reacts around the EMA convergence zone to gauge potential trend continuation versus range-bound movement.
💬 5. Community Discussion
What is your technical outlook for $NVDAB this week? Are you tracking the current consolidation or waiting for confirmation? Drop your thoughts below! 👇
⚠️ 6. Disclaimer
Educational technical analysis only. Not financial advice (NFA). Crypto markets involve risk. Always DYOR.
$NVDAB #NVDAB #BinanceSquare
🔥 $NVDAB Technical Update: Key Levels & Momentum Breakdown
📊 1. Market Snapshot
$NVDAB is currently trading at $164.1500, recording a 24-hour correction of -6.62 percent. The asset established a daily trading range between a low of 149.2300 and a high of 176.0000, backed by a robust 24-hour quote volume of 277,593,796 USDT on the pair.
📈 2. Technical Momentum & Indicator Bias
Price action is hovering near the EMA 20 sitting at $164.0560, while remaining just below the EMA 50 positioned at 167.7286. The RSI (14) prints at 48.26, indicating neutral market momentum without overbought or oversold conditions. Meanwhile, the MACD histogram shows a positive reading of +0.8588 as the MACD line converges toward the signal line, pointing toward ongoing consolidation efforts.
🎯 3. Key Technical Levels to Watch
• 🟢 Resistance Zone: First resistance stands at 165.5367, with a secondary target extension near 180.2017.
• 🔴 Support Zone: Immediate support floor is located at 159.8800, with deeper downside tracking at 155.1000.
• 🛡️ Pivot Confluence: The EMA 20 at $164.0560 serves as the primary short-term directional pivot.
💡 4. Technical Takeaway & Risk Management
The current low volume profile suggests weak immediate conviction from market participants. Traders should monitor how price reacts around the EMA convergence zone to gauge potential trend continuation versus range-bound movement.
💬 5. Community Discussion
What is your technical outlook for $NVDAB this week? Are you tracking the current consolidation or waiting for confirmation? Drop your thoughts below! 👇
⚠️ 6. Disclaimer
Educational technical analysis only. Not financial advice (NFA). Crypto markets involve risk. Always DYOR.
$NVDAB #NVDAB #BinanceSquare
📊 1. Market Snapshot
$NVDAB is currently trading at $164.1500, recording a 24-hour correction of -6.62 percent. The asset established a daily trading range between a low of 149.2300 and a high of 176.0000, backed by a robust 24-hour quote volume of 277,593,796 USDT on the pair.
📈 2. Technical Momentum & Indicator Bias
Price action is hovering near the EMA 20 sitting at $164.0560, while remaining just below the EMA 50 positioned at 167.7286. The RSI (14) prints at 48.26, indicating neutral market momentum without overbought or oversold conditions. Meanwhile, the MACD histogram shows a positive reading of +0.8588 as the MACD line converges toward the signal line, pointing toward ongoing consolidation efforts.
🎯 3. Key Technical Levels to Watch
• 🟢 Resistance Zone: First resistance stands at 165.5367, with a secondary target extension near 180.2017.
• 🔴 Support Zone: Immediate support floor is located at 159.8800, with deeper downside tracking at 155.1000.
• 🛡️ Pivot Confluence: The EMA 20 at $164.0560 serves as the primary short-term directional pivot.
💡 4. Technical Takeaway & Risk Management
The current low volume profile suggests weak immediate conviction from market participants. Traders should monitor how price reacts around the EMA convergence zone to gauge potential trend continuation versus range-bound movement.
💬 5. Community Discussion
What is your technical outlook for $NVDAB this week? Are you tracking the current consolidation or waiting for confirmation? Drop your thoughts below! 👇
⚠️ 6. Disclaimer
Educational technical analysis only. Not financial advice (NFA). Crypto markets involve risk. Always DYOR.
$NVDAB #NVDAB #BinanceSquare
6

·
--
Silicon Surge Pause: NVIDIA bStock Holds Ground on Binance Spot 🚀
Price action – $NVDAB trades at $165.92 on Binance Spot (NVDAB/USDT), down 6.13% over the last 24 hours. The dip reflects broader AI‑chip sector cooling after a week of strong earnings reports, even though no direct news hit Nvidia.
Key levels – Immediate support sits around $160.00, with a secondary floor near $155.00. Resistance caps the recent range at $170.00, while the mid‑range pivot is close to $165.00. A clean break above $170 could spark a new rally, while a slip back to $160 may reinforce the current consolidation.
Outlook – Neutral. The bStock appears to be consolidating within a tight $155‑$170 band. Traders should wait for a decisive breakout either way before taking directional bias. Volume remains moderate, suggesting the market is watching for the next catalyst from the AI hardware cycle.
#NVDAB #Stocks #BinanceSquare
Silicon Surge Pause: NVIDIA bStock Holds Ground on Binance Spot 🚀
Price action – $NVDAB trades at $165.92 on Binance Spot (NVDAB/USDT), down 6.13% over the last 24 hours. The dip reflects broader AI‑chip sector cooling after a week of strong earnings reports, even though no direct news hit Nvidia.
Key levels – Immediate support sits around $160.00, with a secondary floor near $155.00. Resistance caps the recent range at $170.00, while the mid‑range pivot is close to $165.00. A clean break above $170 could spark a new rally, while a slip back to $160 may reinforce the current consolidation.
Outlook – Neutral. The bStock appears to be consolidating within a tight $155‑$170 band. Traders should wait for a decisive breakout either way before taking directional bias. Volume remains moderate, suggesting the market is watching for the next catalyst from the AI hardware cycle.
#NVDAB #Stocks #BinanceSquare
Price action – $NVDAB trades at $165.92 on Binance Spot (NVDAB/USDT), down 6.13% over the last 24 hours. The dip reflects broader AI‑chip sector cooling after a week of strong earnings reports, even though no direct news hit Nvidia.
Key levels – Immediate support sits around $160.00, with a secondary floor near $155.00. Resistance caps the recent range at $170.00, while the mid‑range pivot is close to $165.00. A clean break above $170 could spark a new rally, while a slip back to $160 may reinforce the current consolidation.
Outlook – Neutral. The bStock appears to be consolidating within a tight $155‑$170 band. Traders should wait for a decisive breakout either way before taking directional bias. Volume remains moderate, suggesting the market is watching for the next catalyst from the AI hardware cycle.
#NVDAB #Stocks #BinanceSquare
3

·
--
Bearish Pressure Deepens
NVDAB is down 6.49% to 165.31 USDT. Bearish sentiment dominates, pushing prices lower. Volume remains a critical factor as selling pressure mounts.
🔥 Market Focus: $NVDAB $NBISB
NVDAB struggles near 165, eyeing 160 as key support. Resistance forms at 170. NBISB shows similar weakness; watch for volume spikes confirming further downside or potential bounces.
Are you holding or shorting these levels? Share your chart setups and what you're seeing.
#NVDAB #NBISB #Crypto #WhaleAlert #CryptoNews
Bearish Pressure Deepens
NVDAB is down 6.49% to 165.31 USDT. Bearish sentiment dominates, pushing prices lower. Volume remains a critical factor as selling pressure mounts.
🔥 Market Focus: $NVDAB $NBISB
NVDAB struggles near 165, eyeing 160 as key support. Resistance forms at 170. NBISB shows similar weakness; watch for volume spikes confirming further downside or potential bounces.
Are you holding or shorting these levels? Share your chart setups and what you're seeing.
#NVDAB #NBISB #Crypto #WhaleAlert #CryptoNews
NVDAB is down 6.49% to 165.31 USDT. Bearish sentiment dominates, pushing prices lower. Volume remains a critical factor as selling pressure mounts.
🔥 Market Focus: $NVDAB $NBISB
NVDAB struggles near 165, eyeing 160 as key support. Resistance forms at 170. NBISB shows similar weakness; watch for volume spikes confirming further downside or potential bounces.
Are you holding or shorting these levels? Share your chart setups and what you're seeing.
#NVDAB #NBISB #Crypto #WhaleAlert #CryptoNews
1
152
Log in to explore more content
Join global crypto users on Binance Square
⚡️ Get latest and useful information about crypto.
💬 Trusted by the world’s largest crypto exchange.
👍 Discover real insights from verified creators.
Email / Phone number
Trending Topics
1
#WhatWillDriveCryptoandStocks’NextRebound?
26,688 views
442 Discussing
2
#Anthropic’s6xIPODemandSignalsPotentialRecordRaise
8,124 views
194 Discussing
3
#HuangExitNvidiaStrategyInFocus
170,130 views
1,520 Discussing
4
#AnthropicRejectsIPODelayValuationinQuestion
788,365 views
5,697 Discussing
5
#HedgeFundsCMEBitcoinNetShortsFall89%
13,397 views
210 Discussing
6
#BitMineReports$6.3BNetLossForFiscal2026
23,769 views
188 Discussing
7
#BitcoinETFOutflowsHit1.6B
0 views
0 Discussing
8
#TradFiForBeginners
565,040 views
3,952 Discussing
9
#SoFiExpandsSoFiUSDStablecoinToPolygon
8,180 views
122 Discussing
10
#TetherGoldXAUTCompletesKPMGAudit
11,666 views
132 Discussing