Binance Square
#bitcoinrejectedat$81k50weekma

bitcoinrejectedat$81k50weekma

Bluechip
·
--
$BTC perfectly tagged the 50-week MA and rejected from it (so far). From just August 17 to August 25, a mere 8 days, the move up to the 50-week MA has been an impressive 29%. Observations: There's a pretty big upper wick on that last candle. Combined with the extreme move up in the last 8 days, it wouldn't be impossible to see this becoming a short term exhaustion point. It would be difficult for anyone to argue a bear case if BTC closes above the previous high of $82.8k and the 50 week MA. The big question: is a further move sustainable? The daily candle hasn't closed yet and that will provide more reliable information. #BitcoinRejectedAt$81K50WeekMA {future}(BTCUSDT)
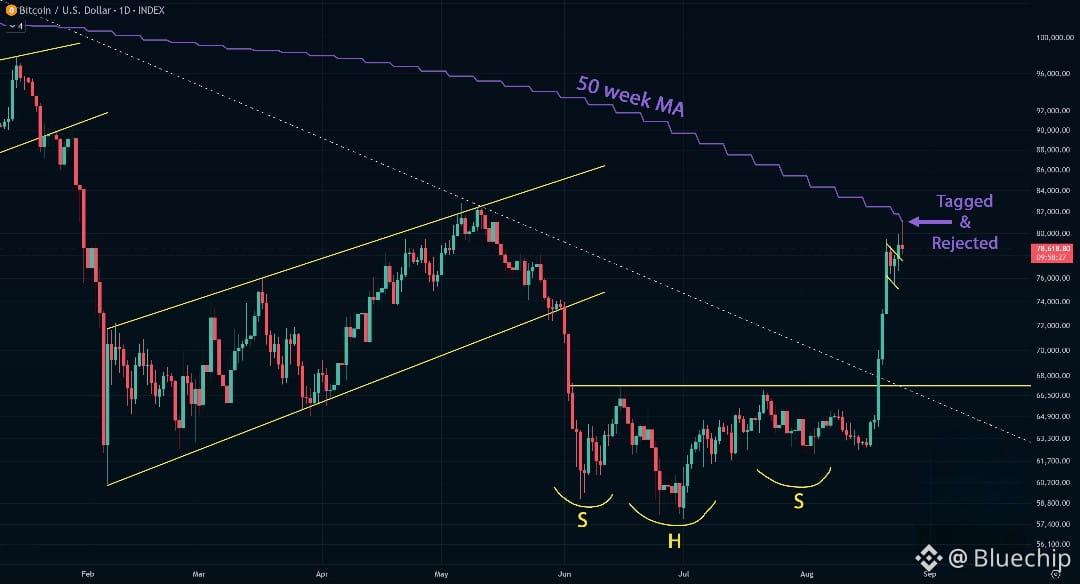
$BTC perfectly tagged the 50-week MA and rejected from it (so far).

From just August 17 to August 25, a mere 8 days, the move up to the 50-week MA has been an impressive 29%.

Observations: There's a pretty big upper wick on that last candle. Combined with the extreme move up in the last 8 days, it wouldn't be impossible to see this becoming a short term exhaustion point.

It would be difficult for anyone to argue a bear case if BTC closes above the previous high of $82.8k and the 50 week MA.

The big question: is a further move sustainable?

The daily candle hasn't closed yet and that will provide more reliable information.
#BitcoinRejectedAt$81K50WeekMA
Ronny Timmel B2wz:
ok

·
--
Bullish
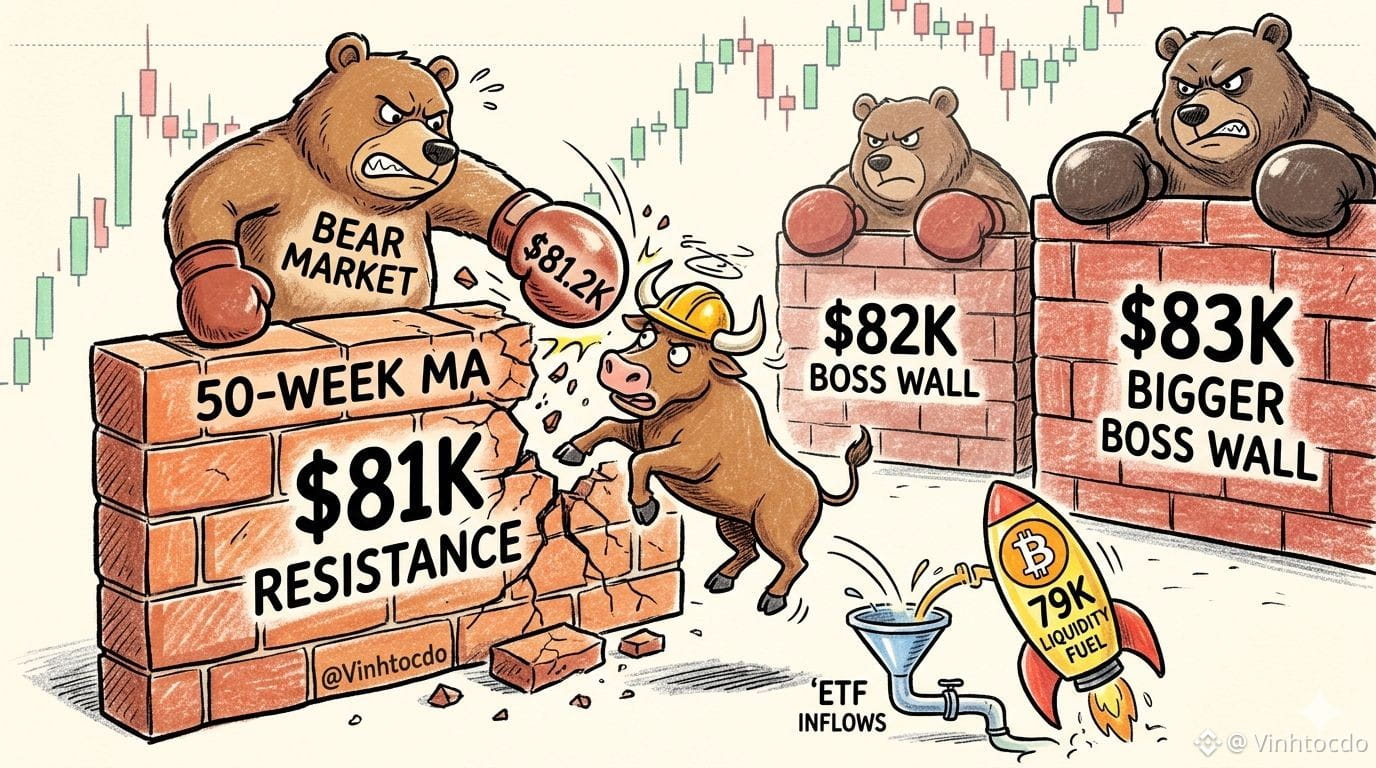
#BitcoinRejectedAt$81K50WeekMA 🐻 Bitcoin got rejected at the $81K 50-week MA wall! 🧱 BTC smashed $81.2K before the bears pushed it back under $80K. And guess what? There are even bigger boss walls waiting at $82K-$83K! 🥊 But don't look away just yet. BTC is currently pulling back to $79K to gather liquidity. Is this enough fuel for a massive rocket jump, especially with ETF inflows going strong for 6 straight days? 🚀 What should traders do? Don't panic! Nasty resistances rarely break on the first try. Watch the $79K support level, look for spot buying strength, and don't overleverage! 📉 ⚠️ This is not financial advice. Ready to trade the Bitcoin breakout? Join Binance! 🚀 Use code: VINHTOCDO 🔗 Link: https://www.binance.com/register?ref=VINHTOCDO #BitcoinETF #BTC81K #CryptoMarket2026 #VINHTOCDO $BTC {future}(BTCUSDT) $ETH {future}(ETHUSDT) $BNB {future}(BNBUSDT)
#BitcoinRejectedAt$81K50WeekMA
🐻 Bitcoin got rejected at the $81K 50-week MA wall! 🧱
BTC smashed $81.2K before the bears pushed it back under $80K. And guess what? There are even bigger boss walls waiting at $82K-$83K! 🥊 But don't look away just yet. BTC is currently pulling back to $79K to gather liquidity. Is this enough fuel for a massive rocket jump, especially with ETF inflows going strong for 6 straight days? 🚀
What should traders do?
Don't panic! Nasty resistances rarely break on the first try. Watch the $79K support level, look for spot buying strength, and don't overleverage! 📉
⚠️ This is not financial advice.
Ready to trade the Bitcoin breakout? Join Binance!
🚀 Use code: VINHTOCDO
🔗 Link: https://www.binance.com/register?ref=VINHTOCDO
#BitcoinETF #BTC81K #CryptoMarket2026 #VINHTOCDO
$BTC
$ETH
$BNB
Square-Creator-8b60ec522:
No entiendo porque no liquidan en 83 si total llaman mas peces chicos.

Article
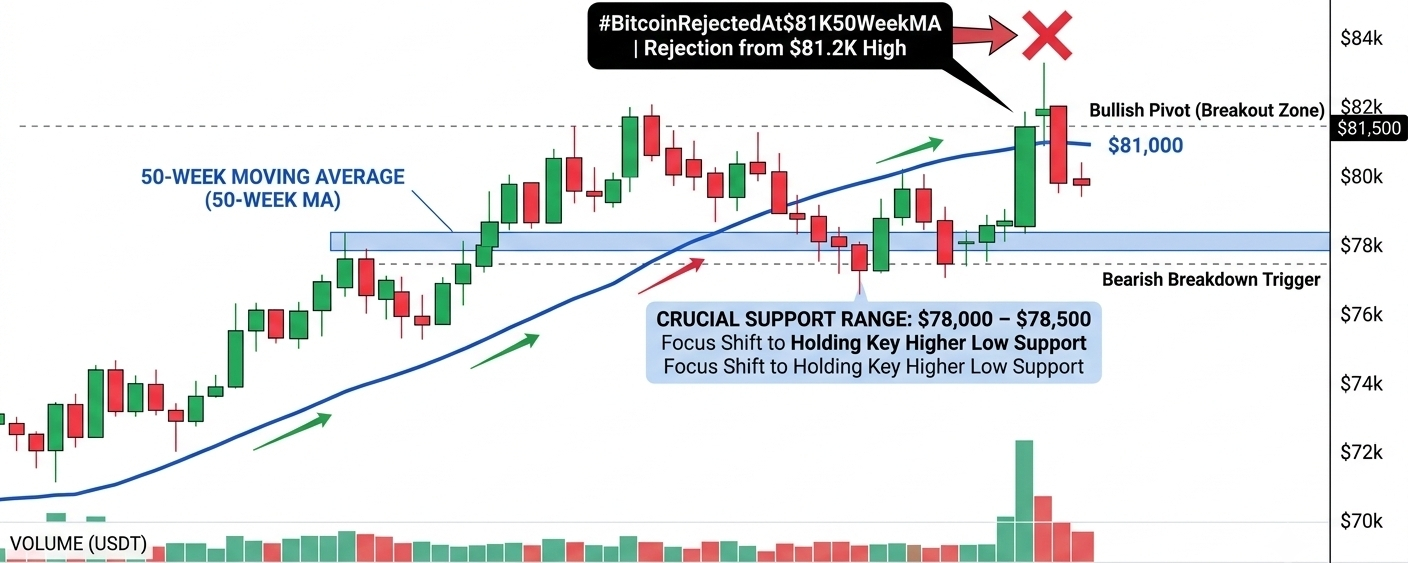
Bitcoin Faces Resistance: Rejection at $81K and the 50-Week MABitcoin ($BTC ) briefly surged past $81,200 before encountering heavy selling pressure that dragged prices back below $80,000. This reaction directly at the 50-week Moving Average (50-week MA) highlights the strength of macro resistance overhead. ​Key Takeaways ​Institutional Overhead: The 50-week MA is a crucial benchmark for institutional trend health. Defending this boundary proves bears remain aggressive at macro supply zones.​Volume Shortfall: Pushing to $81.2K generated initial optimism, but a lack of follow-through spot buying prevented a sustained breakout above $81,000.​Support to Watch: Retracting under $80,000 shifts focus toward $78,000–$78,500. Defense of this zone is critical to maintain a constructive higher-low structure. ​Technical Outlook ​From a structural standpoint, the market is navigating three distinct paths: a bullish breakout requires a decisive daily close above $81,500 to confirm trend continuation and target the $84,000–$86,000 range; a neutral consolidation phase will see $BTC bounce between $78,000 and $80,000 to build localized support; and a bearish breakdown below $77,500 risks accelerating downside momentum toward major $74,000 support levels. ​Rejection at key moving averages urges caution against chasing premature breakouts. Traders should track spot volume and weekly closes near $81,000 before taking leveraged positions. ​Disclaimer: Educational content only. DYOR. #BitcoinRejectedAt$81K50WeekMA #BTC #BTCReaches$80000 #btcbullrun

Bitcoin Faces Resistance: Rejection at $81K and the 50-Week MA

Bitcoin ($BTC ) briefly surged past $81,200 before encountering heavy selling pressure that dragged prices back below $80,000. This reaction directly at the 50-week Moving Average (50-week MA) highlights the strength of macro resistance overhead.
​Key Takeaways
​Institutional Overhead: The 50-week MA is a crucial benchmark for institutional trend health. Defending this boundary proves bears remain aggressive at macro supply zones.​Volume Shortfall: Pushing to $81.2K generated initial optimism, but a lack of follow-through spot buying prevented a sustained breakout above $81,000.​Support to Watch: Retracting under $80,000 shifts focus toward $78,000–$78,500. Defense of this zone is critical to maintain a constructive higher-low structure.
​Technical Outlook
​From a structural standpoint, the market is navigating three distinct paths: a bullish breakout requires a decisive daily close above $81,500 to confirm trend continuation and target the $84,000–$86,000 range; a neutral consolidation phase will see $BTC bounce between $78,000 and $80,000 to build localized support; and a bearish breakdown below $77,500 risks accelerating downside momentum toward major $74,000 support levels.
​Rejection at key moving averages urges caution against chasing premature breakouts. Traders should track spot volume and weekly closes near $81,000 before taking leveraged positions.
​Disclaimer: Educational content only. DYOR.
#BitcoinRejectedAt$81K50WeekMA #BTC #BTCReaches$80000 #btcbullrun
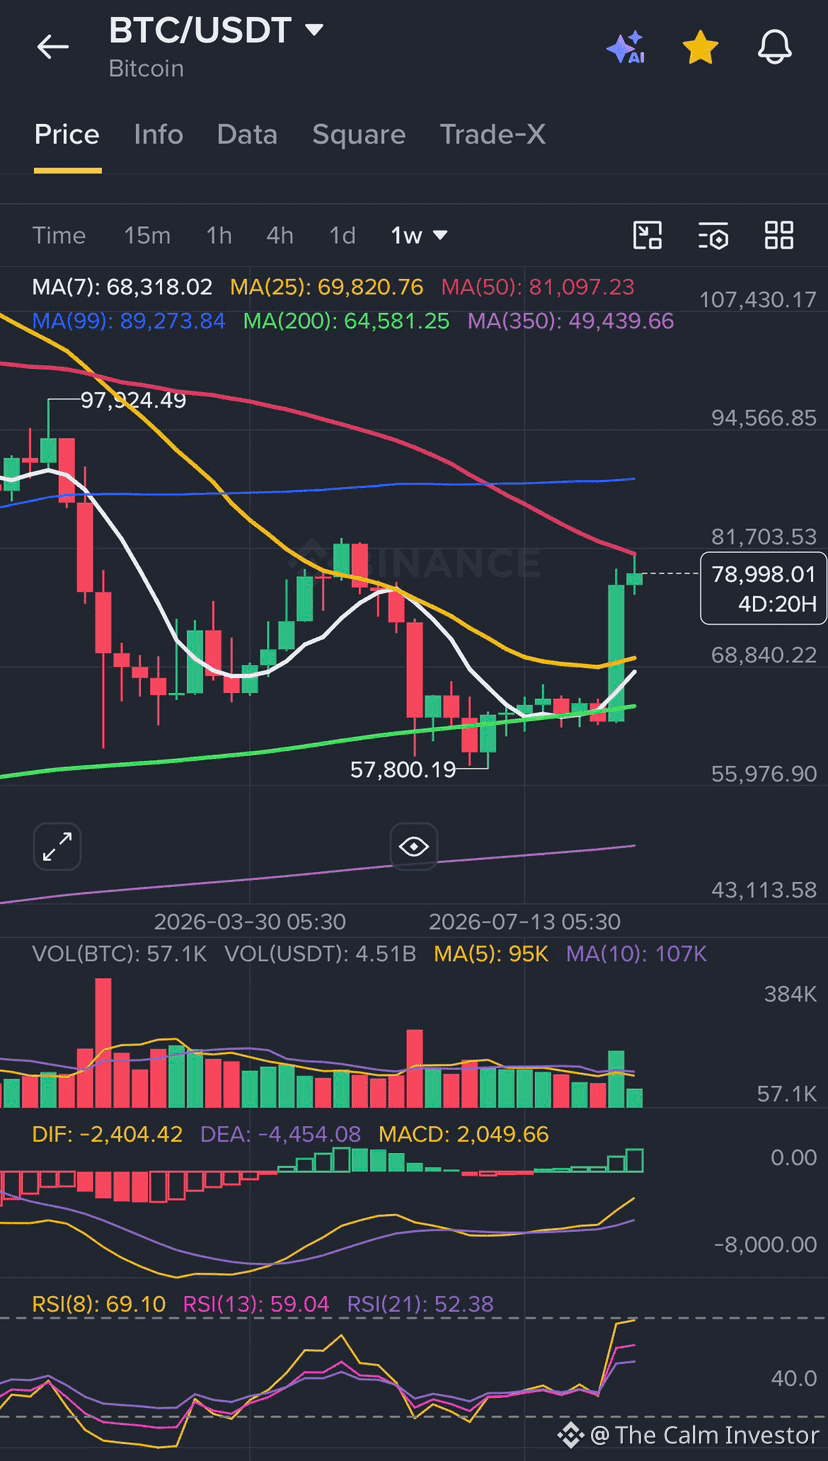
ARE WE IN BULL MARKET? Then the answer is NO If you see a Technical chart then MA50 on weekly chart is a major resistance which BTC needs to break. And we are still below Weekly MA50 MACD signals are still below 0 line and needs to cross for a Bull market BTC dominace is still high at 59.82 % and Altcoin season index is going down and not even above 50 level. Above 75 is a real bull market. So if BTC fails to cross 82K mark again then bears can bring BTC again to 69K at 200MA level and the propaganda of 50K will be again amplified. So this week is important and 15 September most important calendar events will decide the next move of BTC #BitcoinRejectedAt$81K50WeekMA $BTC
ARE WE IN BULL MARKET?
Then the answer is NO

If you see a Technical chart then MA50 on weekly chart is a major resistance which BTC needs to break. And we are still below Weekly MA50

MACD signals are still below 0 line and needs to cross for a Bull market

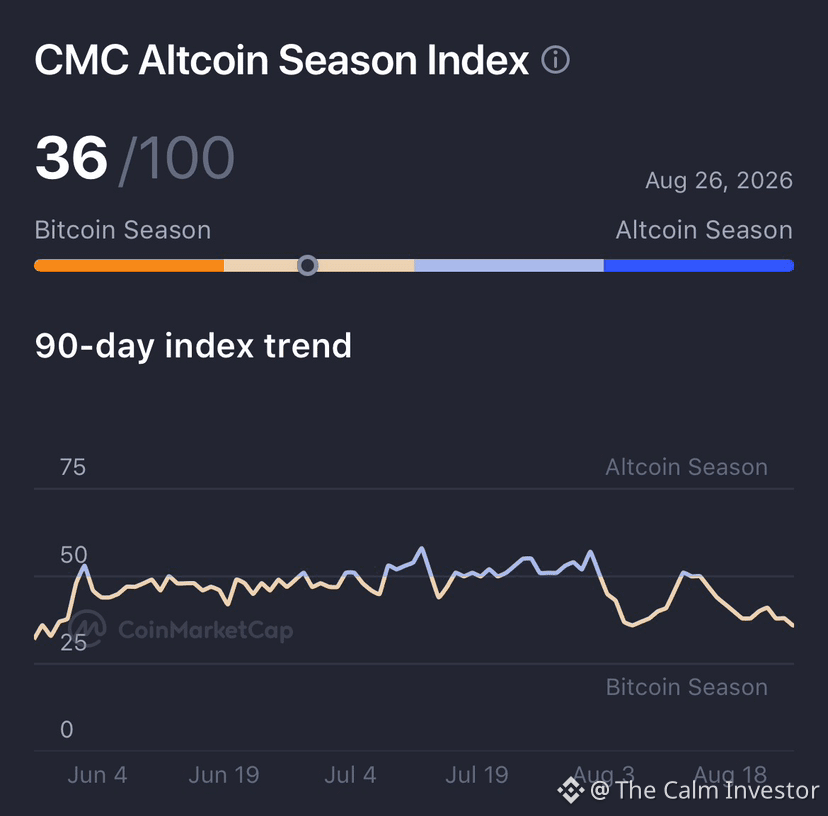
BTC dominace is still high at 59.82 % and Altcoin season index is going down and not even above 50 level. Above 75 is a real bull market.

So if BTC fails to cross 82K mark again then bears can bring BTC again to 69K at 200MA level and the propaganda of 50K will be again amplified.

So this week is important and 15 September most important calendar events will decide the next move of BTC
#BitcoinRejectedAt$81K50WeekMA
$BTC
Article
Bitcoin Was Rejected at $81K — Now the 50-Week Moving Average Really MattersI have watched Bitcoin make enough strange moves over the years to know that the first reaction at an important level rarely tells the whole story. Sometimes a rejection is the beginning of a much deeper sell-off. Sometimes it is nothing more than the market taking a breath before trying again. Right now, Bitcoin is sitting in that uncomfortable middle ground. The price pushed above $80,000 and reached roughly $81,265 before running into the 50-week moving average, which was sitting close to $81,000. That is not just another line on a chart. It is one of those levels that longer-term traders tend to notice, especially after Bitcoin has spent a meaningful amount of time trading below it. And the reaction was immediate. Bitcoin could not hold above the area. For the moment, sellers are still there. But I don't think the right conclusion is simply, "Bitcoin got rejected, so the rally is over." That is too easy. What interests me much more is how Bitcoin got there in the first place. The market did not slowly grind from one level to another. It moved aggressively. Bitcoin gained roughly 25% over a seven-day period, reclaiming levels that had looked difficult to reach only a short time earlier. That kind of move changes everything. People who were comfortable being bearish suddenly have to reconsider. Traders who were waiting for confirmation start entering late. Short sellers begin closing positions. Momentum traders start chasing the move. Long-term holders begin wondering whether this is finally the beginning of another major recovery. And somewhere in the middle of all that excitement, somebody is selling. That's normal. Markets don't move higher because everyone agrees. They move higher because buyers are willing to absorb the supply being offered. That is why I am less interested in the fact that Bitcoin touched $81K and more interested in what happens after the rejection. If the price simply pulls back, finds support and tries again, the story is very different from a situation where Bitcoin starts losing every level it just reclaimed. There is another reason I am taking this move seriously. The spot Bitcoin ETF flows have improved at almost exactly the right time. Recent data showed strong inflows into U.S. spot Bitcoin ETFs, with more than $1.9 billion entering during one recent week. Additional inflows followed on August 24. That tells me there is real demand behind at least part of this move rather than the entire rally being driven by derivatives. But I would still be careful about turning ETF inflows into a guaranteed bullish signal. Money can enter ETFs while Bitcoin consolidates. Money can enter ETFs while older holders sell. Money can enter ETFs while leverage gets washed out. The important thing is what the combination of those flows and price action eventually produces. And that is still developing. The short squeeze also played a major role. Billions of dollars in short positions were reportedly liquidated as Bitcoin moved sharply higher. When shorts are forced to close, they have to buy. Those forced purchases can create a feedback loop: price rises, more shorts get liquidated, those shorts buy back, price rises again. It can look incredibly powerful on a chart. But there is a catch. Forced buying eventually runs out. Once the shorts have covered, Bitcoin needs normal buyers to keep the move alive. That is where I think the current market becomes much more interesting. The easy part of the rally may already be behind us. Now Bitcoin has to deal with people who are not forced to buy. The 50-week moving average is important for precisely this reason. A 50-week moving average is slow. It does not react to every little move. It represents a much broader view of Bitcoin's trend, which is why a sustained move above it would mean more than a few minutes spent trading over $81K. Bitcoin touching the average is one thing. Closing above it is another. Holding above it is something else entirely. That sequence matters. I would much rather see Bitcoin spend several days fighting around $81K, eventually break through, pull back and successfully defend the same area than watch it shoot straight toward $90K in a few hours. That might sound less exciting. But it would be healthier. A breakout becomes much more convincing when the market gets an opportunity to reject it and fails to do so. This is where I think many traders get impatient. They want the breakout candle. They want the next target. They want to know whether $100K is coming. But the market doesn't work according to our preferred timetable. Sometimes Bitcoin needs to move sideways before it can move higher. And after a roughly 25% weekly rally, I would actually expect some cooling-off to be normal. There is nothing unhealthy about Bitcoin taking a pause after a move like that. In fact, a pause could be constructive. If Bitcoin can consolidate somewhere around the high-$70,000s while ETF demand remains positive, leverage cools down and sellers fail to push it substantially lower, that would tell me much more than another huge green candle. It would show that buyers are comfortable holding their positions. That is different from chasing. The macro picture is also playing a role. Bitcoin's recent strength came at a time when the dollar was weakening and investors were paying more attention to concerns surrounding currency debasement and government debt. The U.S. Treasury has also announced plans to increase the size of certain buyback operations involving longer-dated Treasury securities. Markets have interpreted the broader environment as potentially supportive for liquidity and risk assets. But I don't think it is accurate to reduce that story to "Treasury buybacks mean easy money, therefore Bitcoin goes up." Financial markets are more complicated than that. Treasury buybacks are not the same thing as Federal Reserve quantitative easing. And the Federal Reserve itself still has an inflation problem to think about. Recent meeting minutes showed that several policymakers had become more concerned about inflation. If inflation stays stubborn and interest-rate expectations become more restrictive, that could create a very different environment for Bitcoin and other risk assets. So there are two competing forces here. On one side, there is the weaker-dollar and liquidity argument. On the other, there is the possibility that inflation keeps monetary policy tighter than investors would like. Bitcoin is sitting between those two stories. That is one reason I don't want to make a dramatic prediction from one rejection. There is also something else worth remembering. Bitcoin's current move has not happened because of one single piece of news. There is ETF demand. There is short covering. There is renewed confidence around the regulatory environment. There is the dollar. There are Treasury-market developments. There is the possibility that Bitcoin already formed a meaningful low. All of these things are contributing to the same price action. But they don't all have the same lifespan. A short squeeze can disappear within days. ETF demand can continue for months. A regulatory headline can change overnight. The dollar can reverse. And technical levels can remain important until the market proves otherwise. That is why the $81K area is so useful. It gives us something objective to watch. We don't have to guess what Bitcoin "should" do. We can simply watch what it actually does. If Bitcoin keeps getting rejected around $81K–$82K and starts producing lower highs, sellers are clearly defending the area. If Bitcoin pulls back toward $78K–$80K and buyers step in, that could be healthy consolidation. And if Bitcoin eventually breaks above $81K–$82K, closes above the 50-week moving average and then comes back to test the same area without losing it, that would be a much stronger signal that the market structure is changing. That last part is the one I would pay the most attention to. The retest. Anyone can break resistance once. The market has to prove it can hold the breakout. That's where the difference between a rally and a trend often becomes visible. There is also a psychological side to this. Imagine someone bought Bitcoin much lower. At $81K, they have a reason to take some profit. Now imagine someone who missed the entire move and is only thinking about buying because Bitcoin just crossed $80K. They are entering into resistance. Those two traders are looking at exactly the same chart but making completely different decisions. This is why markets can become extremely volatile around obvious levels. One group is selling into strength. Another group is chasing strength. And the price becomes the battlefield between them. The same thing happened during many previous Bitcoin cycles. The market rarely moves cleanly from "bearish" to "bullish." There are usually false starts, failed breakouts, sharp pullbacks and periods where nobody is quite sure what comes next. That uncertainty is not necessarily a problem. It is often part of the transition. One thing I would not ignore is the possibility that Bitcoin simply needs more time. The market has moved so quickly that expecting an immediate continuation higher may actually be the wrong way to think about it. A few days of sideways trading around $78K–$81K could do more for the market than another sudden 8% rally. It could flush out excessive leverage. It could allow late buyers to settle. It could give ETF demand time to build. It could allow the market to test whether sellers still have enough supply to keep Bitcoin below the 50-week average. And if Bitcoin eventually breaks out after that process, the breakout could be much more meaningful. This is also why I am not particularly interested in making a prediction about $90K or $100K right now. Those numbers make for good headlines. But they do not help much with understanding the current market. The immediate question is much simpler: Can Bitcoin turn $81K from resistance into support? If the answer eventually becomes yes, the market will have given us something tangible. If the answer remains no and Bitcoin begins losing the support underneath the recent rally, then the recovery deserves a much more cautious interpretation. There is another scenario that I think deserves attention. Bitcoin could reject $81K, fall toward the upper-$70,000s, and then spend a considerable amount of time building a base. That would not necessarily mean the bullish thesis has failed. Markets sometimes need to consolidate before making their next important move. The problem would begin if every bounce becomes weaker and the market starts making lower lows. That would tell us that sellers are gaining control. For now, I don't think we have enough evidence to say that. The rejection is real. The resistance is real. But the broader recovery is also real. ETF demand has improved. Bitcoin has reclaimed important price levels. The dollar has been weaker. The market's perception of the regulatory environment has improved. And the speed of the recovery tells us that there is clearly a large amount of demand willing to step in when conditions change. The question is whether that demand is strong enough to absorb the sellers waiting around the 50-week moving average. That is the real battle. Not bulls versus bears on social media. Not one analyst against another. Actual supply versus actual demand. And Bitcoin has a very simple way of settling that argument. Price. If buyers eventually absorb the supply around $81K–$82K, the market will show it. If sellers remain dominant, the market will show that too. I think this is where experience matters. After watching enough Bitcoin cycles, you stop trying to predict every candle. You start watching behavior. A strong market usually tells you when it is strong. It holds levels. It recovers quickly after pullbacks. It refuses to give back important gains. Weak markets do the opposite. They break support, bounce weakly, get rejected again and gradually lose the confidence that brought buyers in. Bitcoin is not showing that kind of weakness yet. But it has not proven the opposite either. That is why the 50-week moving average matters so much right now. It is sitting directly where the market's confidence is being tested. Bitcoin has recovered enough to reach it. Now it needs to show that it can live above it. The August 25 rejection at roughly $81K was therefore not the end of the story. It was the first serious question. Can buyers come back? Can they absorb the sellers? Can Bitcoin reclaim the 50-week average? And, most importantly, can it hold that level when the excitement disappears? That last question is the one I would keep in mind. Because a market does not become healthy simply by moving higher. It becomes healthy when higher prices stop feeling temporary. Right now, Bitcoin is somewhere between those two states. The recovery has become too strong to ignore. The rejection has become too important to dismiss. And the 50-week moving average has become the line where those two realities meet. Bitcoin has already shown that it can reach $81K. Now the market has to show whether it belongs there. That is the part I am watching. $NVDAB #BitcoinRejectedAt$81K50WeekMA

Bitcoin Was Rejected at $81K — Now the 50-Week Moving Average Really Matters

I have watched Bitcoin make enough strange moves over the years to know that the first reaction at an important level rarely tells the whole story.
Sometimes a rejection is the beginning of a much deeper sell-off. Sometimes it is nothing more than the market taking a breath before trying again.
Right now, Bitcoin is sitting in that uncomfortable middle ground.
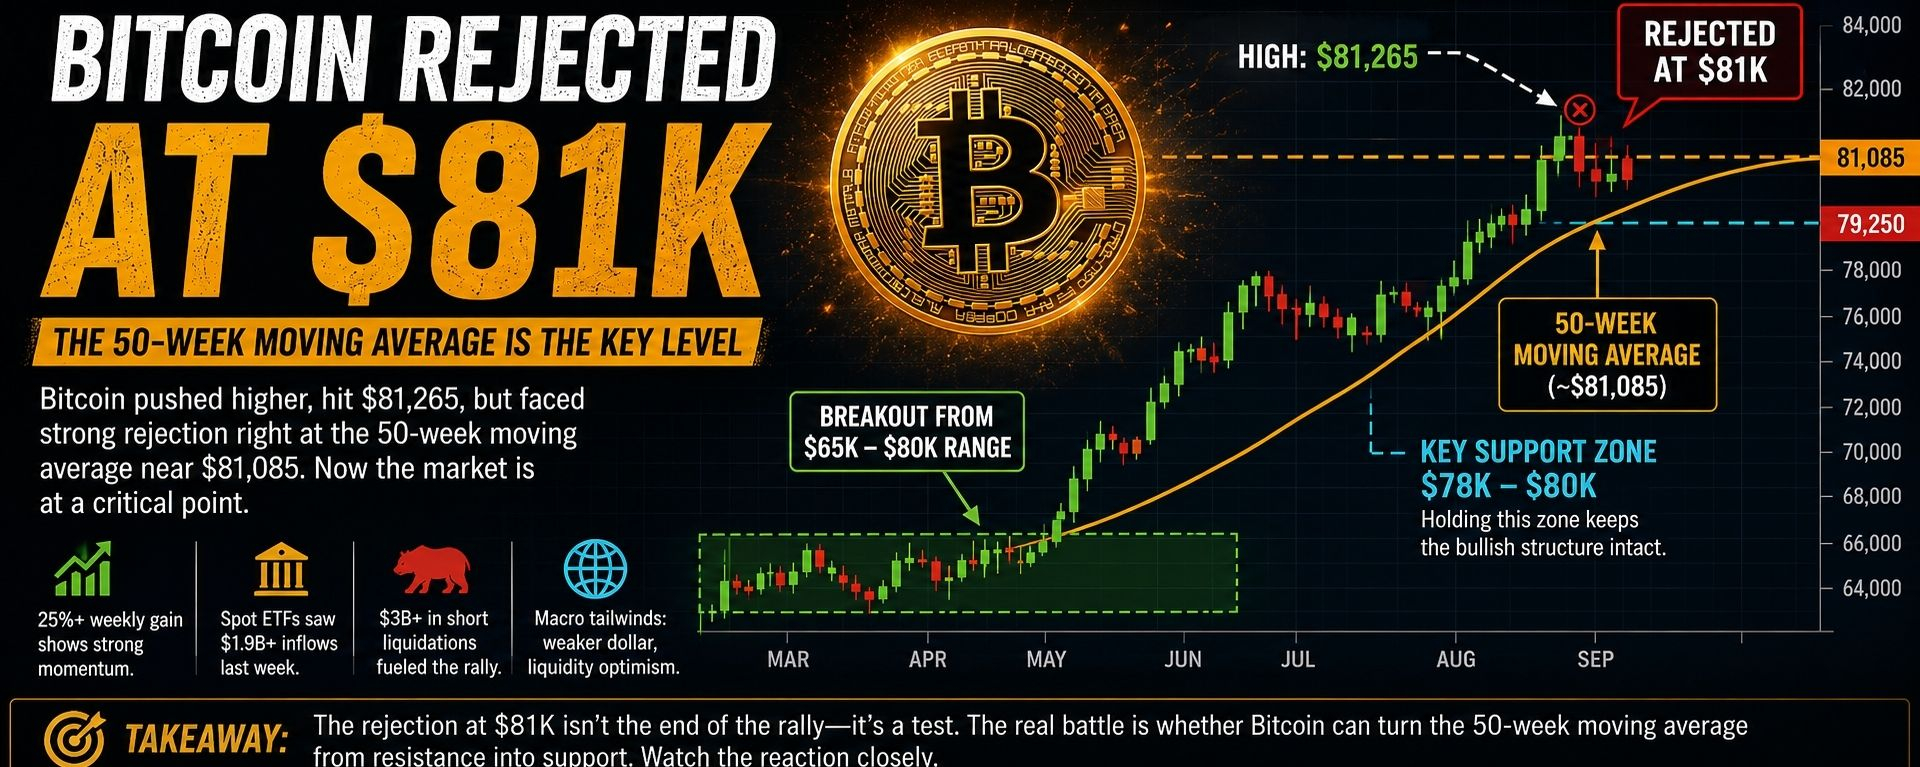
The price pushed above $80,000 and reached roughly $81,265 before running into the 50-week moving average, which was sitting close to $81,000. That is not just another line on a chart. It is one of those levels that longer-term traders tend to notice, especially after Bitcoin has spent a meaningful amount of time trading below it.
And the reaction was immediate.
Bitcoin could not hold above the area.
For the moment, sellers are still there.
But I don't think the right conclusion is simply, "Bitcoin got rejected, so the rally is over."
That is too easy.
What interests me much more is how Bitcoin got there in the first place.
The market did not slowly grind from one level to another. It moved aggressively. Bitcoin gained roughly 25% over a seven-day period, reclaiming levels that had looked difficult to reach only a short time earlier.
That kind of move changes everything.
People who were comfortable being bearish suddenly have to reconsider. Traders who were waiting for confirmation start entering late. Short sellers begin closing positions. Momentum traders start chasing the move. Long-term holders begin wondering whether this is finally the beginning of another major recovery.
And somewhere in the middle of all that excitement, somebody is selling.
That's normal.
Markets don't move higher because everyone agrees. They move higher because buyers are willing to absorb the supply being offered.
That is why I am less interested in the fact that Bitcoin touched $81K and more interested in what happens after the rejection.
If the price simply pulls back, finds support and tries again, the story is very different from a situation where Bitcoin starts losing every level it just reclaimed.
There is another reason I am taking this move seriously.
The spot Bitcoin ETF flows have improved at almost exactly the right time.
Recent data showed strong inflows into U.S. spot Bitcoin ETFs, with more than $1.9 billion entering during one recent week. Additional inflows followed on August 24. That tells me there is real demand behind at least part of this move rather than the entire rally being driven by derivatives.
But I would still be careful about turning ETF inflows into a guaranteed bullish signal.
Money can enter ETFs while Bitcoin consolidates.
Money can enter ETFs while older holders sell.
Money can enter ETFs while leverage gets washed out.
The important thing is what the combination of those flows and price action eventually produces.
And that is still developing.
The short squeeze also played a major role.
Billions of dollars in short positions were reportedly liquidated as Bitcoin moved sharply higher. When shorts are forced to close, they have to buy. Those forced purchases can create a feedback loop: price rises, more shorts get liquidated, those shorts buy back, price rises again.
It can look incredibly powerful on a chart.
But there is a catch.
Forced buying eventually runs out.
Once the shorts have covered, Bitcoin needs normal buyers to keep the move alive.
That is where I think the current market becomes much more interesting.
The easy part of the rally may already be behind us.
Now Bitcoin has to deal with people who are not forced to buy.
The 50-week moving average is important for precisely this reason.
A 50-week moving average is slow. It does not react to every little move. It represents a much broader view of Bitcoin's trend, which is why a sustained move above it would mean more than a few minutes spent trading over $81K.
Bitcoin touching the average is one thing.
Closing above it is another.
Holding above it is something else entirely.
That sequence matters.
I would much rather see Bitcoin spend several days fighting around $81K, eventually break through, pull back and successfully defend the same area than watch it shoot straight toward $90K in a few hours.
That might sound less exciting.
But it would be healthier.
A breakout becomes much more convincing when the market gets an opportunity to reject it and fails to do so.
This is where I think many traders get impatient.
They want the breakout candle.
They want the next target.
They want to know whether $100K is coming.
But the market doesn't work according to our preferred timetable.
Sometimes Bitcoin needs to move sideways before it can move higher.
And after a roughly 25% weekly rally, I would actually expect some cooling-off to be normal.
There is nothing unhealthy about Bitcoin taking a pause after a move like that.
In fact, a pause could be constructive.
If Bitcoin can consolidate somewhere around the high-$70,000s while ETF demand remains positive, leverage cools down and sellers fail to push it substantially lower, that would tell me much more than another huge green candle.
It would show that buyers are comfortable holding their positions.
That is different from chasing.
The macro picture is also playing a role.
Bitcoin's recent strength came at a time when the dollar was weakening and investors were paying more attention to concerns surrounding currency debasement and government debt.
The U.S. Treasury has also announced plans to increase the size of certain buyback operations involving longer-dated Treasury securities. Markets have interpreted the broader environment as potentially supportive for liquidity and risk assets.
But I don't think it is accurate to reduce that story to "Treasury buybacks mean easy money, therefore Bitcoin goes up."
Financial markets are more complicated than that.
Treasury buybacks are not the same thing as Federal Reserve quantitative easing.
And the Federal Reserve itself still has an inflation problem to think about.
Recent meeting minutes showed that several policymakers had become more concerned about inflation. If inflation stays stubborn and interest-rate expectations become more restrictive, that could create a very different environment for Bitcoin and other risk assets.
So there are two competing forces here.
On one side, there is the weaker-dollar and liquidity argument.
On the other, there is the possibility that inflation keeps monetary policy tighter than investors would like.
Bitcoin is sitting between those two stories.
That is one reason I don't want to make a dramatic prediction from one rejection.
There is also something else worth remembering.
Bitcoin's current move has not happened because of one single piece of news.
There is ETF demand.
There is short covering.
There is renewed confidence around the regulatory environment.
There is the dollar.
There are Treasury-market developments.
There is the possibility that Bitcoin already formed a meaningful low.
All of these things are contributing to the same price action.
But they don't all have the same lifespan.
A short squeeze can disappear within days.
ETF demand can continue for months.
A regulatory headline can change overnight.
The dollar can reverse.
And technical levels can remain important until the market proves otherwise.
That is why the $81K area is so useful.
It gives us something objective to watch.
We don't have to guess what Bitcoin "should" do.
We can simply watch what it actually does.
If Bitcoin keeps getting rejected around $81K–$82K and starts producing lower highs, sellers are clearly defending the area.
If Bitcoin pulls back toward $78K–$80K and buyers step in, that could be healthy consolidation.
And if Bitcoin eventually breaks above $81K–$82K, closes above the 50-week moving average and then comes back to test the same area without losing it, that would be a much stronger signal that the market structure is changing.
That last part is the one I would pay the most attention to.
The retest.
Anyone can break resistance once.
The market has to prove it can hold the breakout.
That's where the difference between a rally and a trend often becomes visible.
There is also a psychological side to this.
Imagine someone bought Bitcoin much lower.
At $81K, they have a reason to take some profit.
Now imagine someone who missed the entire move and is only thinking about buying because Bitcoin just crossed $80K.
They are entering into resistance.
Those two traders are looking at exactly the same chart but making completely different decisions.
This is why markets can become extremely volatile around obvious levels.
One group is selling into strength.
Another group is chasing strength.
And the price becomes the battlefield between them.
The same thing happened during many previous Bitcoin cycles.
The market rarely moves cleanly from "bearish" to "bullish."
There are usually false starts, failed breakouts, sharp pullbacks and periods where nobody is quite sure what comes next.
That uncertainty is not necessarily a problem.
It is often part of the transition.
One thing I would not ignore is the possibility that Bitcoin simply needs more time.
The market has moved so quickly that expecting an immediate continuation higher may actually be the wrong way to think about it.
A few days of sideways trading around $78K–$81K could do more for the market than another sudden 8% rally.
It could flush out excessive leverage.
It could allow late buyers to settle.
It could give ETF demand time to build.
It could allow the market to test whether sellers still have enough supply to keep Bitcoin below the 50-week average.
And if Bitcoin eventually breaks out after that process, the breakout could be much more meaningful.
This is also why I am not particularly interested in making a prediction about $90K or $100K right now.
Those numbers make for good headlines.
But they do not help much with understanding the current market.
The immediate question is much simpler:
Can Bitcoin turn $81K from resistance into support?
If the answer eventually becomes yes, the market will have given us something tangible.
If the answer remains no and Bitcoin begins losing the support underneath the recent rally, then the recovery deserves a much more cautious interpretation.
There is another scenario that I think deserves attention.
Bitcoin could reject $81K, fall toward the upper-$70,000s, and then spend a considerable amount of time building a base.
That would not necessarily mean the bullish thesis has failed.
Markets sometimes need to consolidate before making their next important move.
The problem would begin if every bounce becomes weaker and the market starts making lower lows.
That would tell us that sellers are gaining control.
For now, I don't think we have enough evidence to say that.
The rejection is real.
The resistance is real.
But the broader recovery is also real.
ETF demand has improved.
Bitcoin has reclaimed important price levels.
The dollar has been weaker.
The market's perception of the regulatory environment has improved.
And the speed of the recovery tells us that there is clearly a large amount of demand willing to step in when conditions change.
The question is whether that demand is strong enough to absorb the sellers waiting around the 50-week moving average.
That is the real battle.
Not bulls versus bears on social media.
Not one analyst against another.
Actual supply versus actual demand.
And Bitcoin has a very simple way of settling that argument.
Price.
If buyers eventually absorb the supply around $81K–$82K, the market will show it.
If sellers remain dominant, the market will show that too.
I think this is where experience matters.
After watching enough Bitcoin cycles, you stop trying to predict every candle.
You start watching behavior.
A strong market usually tells you when it is strong.
It holds levels.
It recovers quickly after pullbacks.
It refuses to give back important gains.
Weak markets do the opposite.
They break support, bounce weakly, get rejected again and gradually lose the confidence that brought buyers in.
Bitcoin is not showing that kind of weakness yet.
But it has not proven the opposite either.
That is why the 50-week moving average matters so much right now.
It is sitting directly where the market's confidence is being tested.
Bitcoin has recovered enough to reach it.
Now it needs to show that it can live above it.
The August 25 rejection at roughly $81K was therefore not the end of the story.
It was the first serious question.
Can buyers come back?
Can they absorb the sellers?
Can Bitcoin reclaim the 50-week average?
And, most importantly, can it hold that level when the excitement disappears?
That last question is the one I would keep in mind.
Because a market does not become healthy simply by moving higher.
It becomes healthy when higher prices stop feeling temporary.
Right now, Bitcoin is somewhere between those two states.
The recovery has become too strong to ignore.
The rejection has become too important to dismiss.
And the 50-week moving average has become the line where those two realities meet.
Bitcoin has already shown that it can reach $81K.
Now the market has to show whether it belongs there.
That is the part I am watching.
$NVDAB
#BitcoinRejectedAt$81K50WeekMA
·
--
Article
Bitcoin Hits 50-Week Moving Average After 29% Rally: Is BTC Facing Short-Term Exhaustion?#BitcoinRejectedAt$81K50WeekMA Bitcoin Hits 50-Week Moving Average After 29% Rally — What Happens Next? Bitcoin has reached a major technical level after an aggressive rally, with $BTC tagging its 50-week moving average and showing signs of rejection so far. The move has been particularly strong, with Bitcoin gaining roughly 29% between August 17 and August 25. That rapid rise has now brought the market to an important technical test. 📊 A Warning Sign on the Chart The latest candle has formed a large upper wick, suggesting sellers became more active around the 50-week moving average. After such a sharp move in a short period, a period of consolidation or a short-term pullback would not be surprising. However, one candle alone doesn't confirm a reversal. 🚀 $82.8K Is the Key Level The previous high around $82.8K is now an important level for Bitcoin bulls. A decisive close above both $82.8K and the 50-week moving average would strengthen the argument that Bitcoin's broader trend is improving. Until that happens, traders should be careful about chasing an extended move. 👀 The Daily Close Matters The current daily candle has not closed yet, meaning the final structure could still change. A rejection could lead to consolidation or a pullback, while a strong close above the major resistance levels could signal that buyers are ready to push higher. For now, the key question isn't simply whether Bitcoin is bullish. It's whether the current momentum is sustainable after a 29% move in only eight days. Can BTC reclaim the 50-week MA and break above $82.8K, or is the market due for a short-term cooldown? $BTC {spot}(BTCUSDT) #bitcoin #BTC #Crypto #BitcoinTrading #TechnicalAnalysis #CryptoMarket

Bitcoin Hits 50-Week Moving Average After 29% Rally: Is BTC Facing Short-Term Exhaustion?

#BitcoinRejectedAt$81K50WeekMA
Bitcoin Hits 50-Week Moving Average After 29% Rally — What Happens Next?
Bitcoin has reached a major technical level after an aggressive rally, with $BTC tagging its 50-week moving average and showing signs of rejection so far.
The move has been particularly strong, with Bitcoin gaining roughly 29% between August 17 and August 25.
That rapid rise has now brought the market to an important technical test.
📊 A Warning Sign on the Chart
The latest candle has formed a large upper wick, suggesting sellers became more active around the 50-week moving average.
After such a sharp move in a short period, a period of consolidation or a short-term pullback would not be surprising.
However, one candle alone doesn't confirm a reversal.
🚀 $82.8K Is the Key Level
The previous high around $82.8K is now an important level for Bitcoin bulls.
A decisive close above both $82.8K and the 50-week moving average would strengthen the argument that Bitcoin's broader trend is improving.
Until that happens, traders should be careful about chasing an extended move.
👀 The Daily Close Matters
The current daily candle has not closed yet, meaning the final structure could still change.
A rejection could lead to consolidation or a pullback, while a strong close above the major resistance levels could signal that buyers are ready to push higher.
For now, the key question isn't simply whether Bitcoin is bullish.
It's whether the current momentum is sustainable after a 29% move in only eight days.
Can BTC reclaim the 50-week MA and break above $82.8K, or is the market due for a short-term cooldown?
$BTC
#bitcoin #BTC #Crypto #BitcoinTrading #TechnicalAnalysis #CryptoMarket
·
--
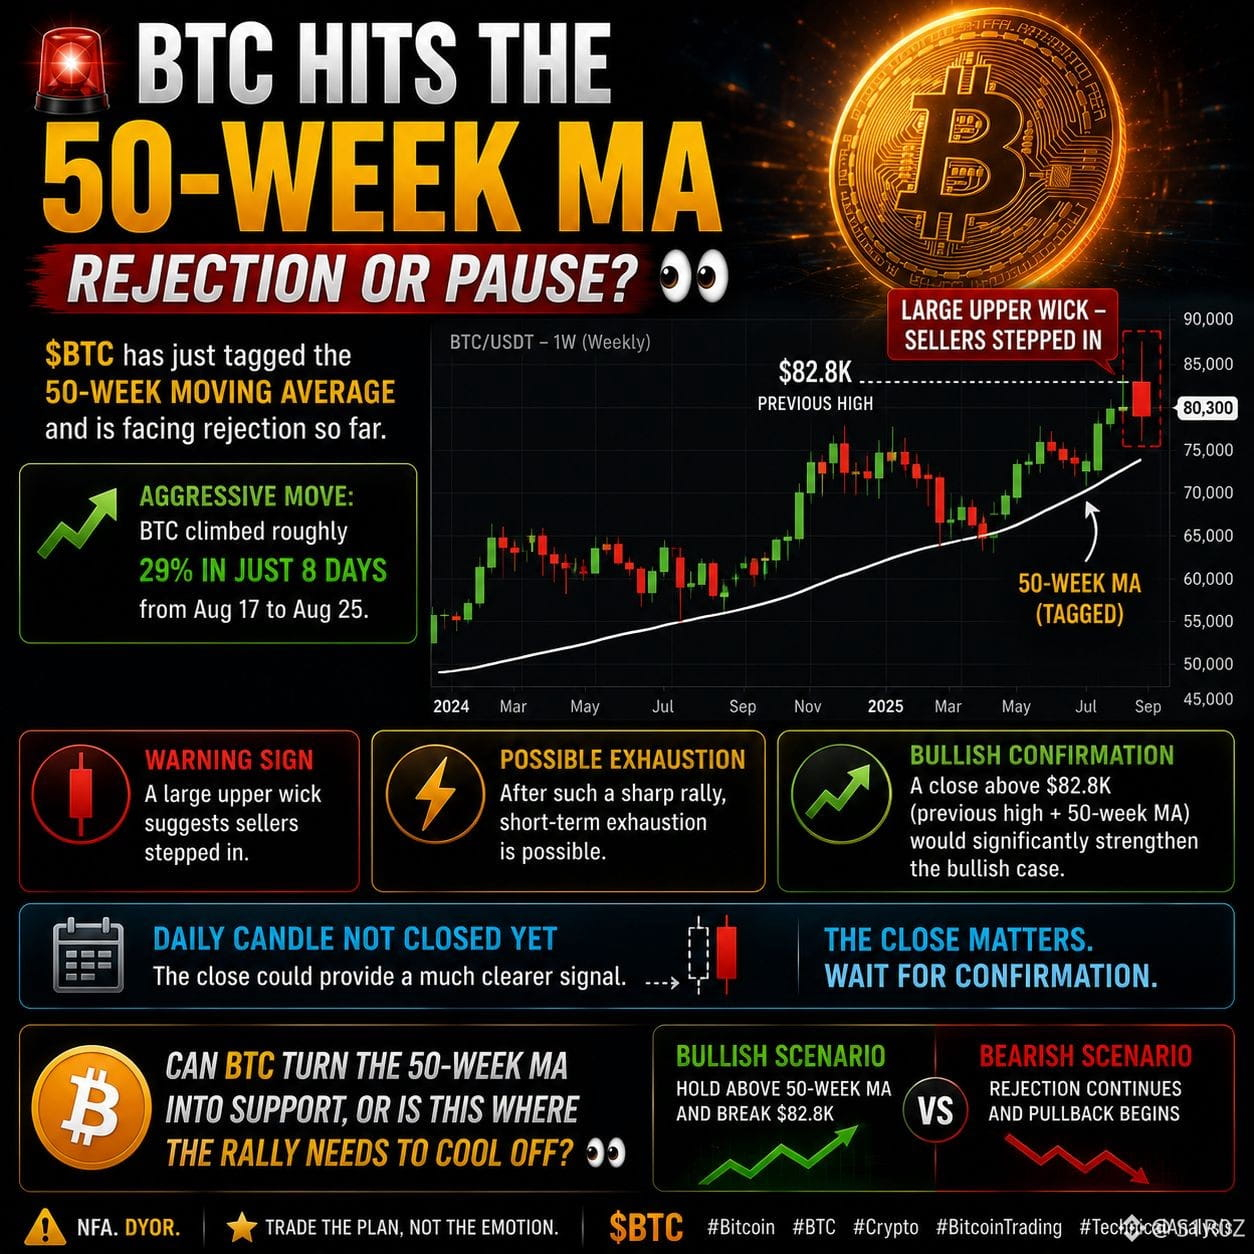
#BitcoinRejectedAt$81K50WeekMA 🚨 BTC HITS THE 50-WEEK MA — REJECTION OR PAUSE? 👀 $BTC has just tagged the 50-week moving average and is facing rejection so far. The move has been aggressive: Bitcoin climbed roughly 29% in just 8 days, from August 17 to August 25. Now the chart is showing a warning sign. 📉 🕯️ A large upper wick suggests sellers stepped in. ⚡ After such a sharp rally, short-term exhaustion is possible. 📈 A close above the $82.8K previous high + 50-week MA would significantly strengthen the bullish case. But the daily candle hasn't closed yet — and that close could provide a much clearer signal. Can BTC turn the 50-week MA into support, or is this where the rally needs to cool off? 👀 $BTC {spot}(BTCUSDT) #bitcoin #BTC #Crypto #BitcoinTrading #TechnicalAnalysis
#BitcoinRejectedAt$81K50WeekMA

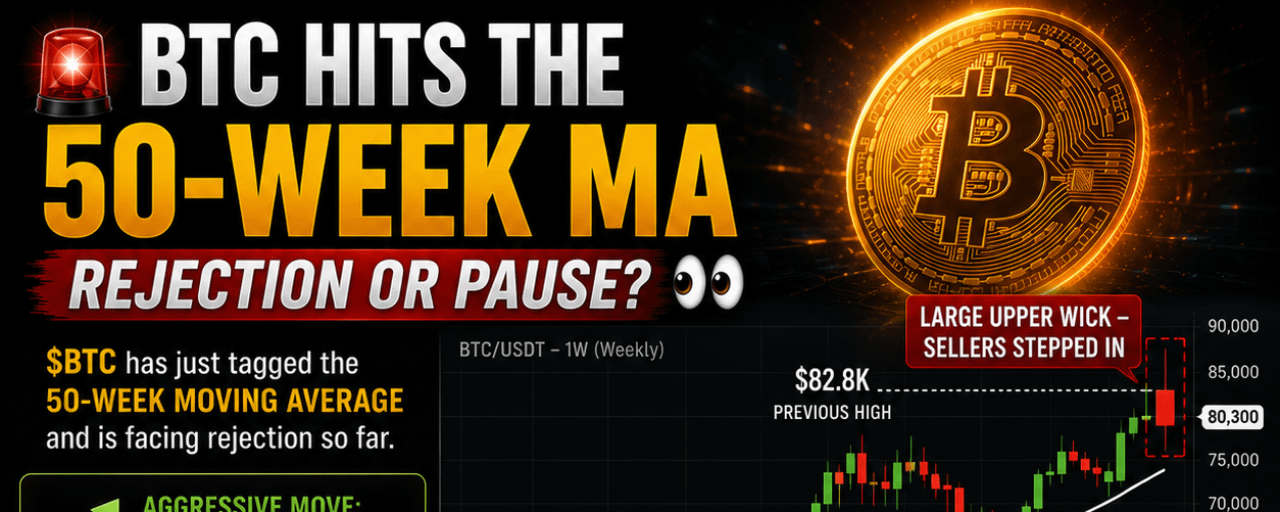
🚨 BTC HITS THE 50-WEEK MA — REJECTION OR PAUSE? 👀

$BTC has just tagged the 50-week moving average and is facing rejection so far.

The move has been aggressive: Bitcoin climbed roughly 29% in just 8 days, from August 17 to August 25.

Now the chart is showing a warning sign. 📉
🕯️ A large upper wick suggests sellers stepped in.
⚡ After such a sharp rally, short-term exhaustion is possible.
📈 A close above the $82.8K previous high + 50-week MA would significantly strengthen the bullish case.

But the daily candle hasn't closed yet — and that close could provide a much clearer signal.

Can BTC turn the 50-week MA into support, or is this where the rally needs to cool off? 👀

$BTC
#bitcoin #BTC #Crypto #BitcoinTrading #TechnicalAnalysis
🚨 $BTC ALERT — THE 50-WEEK SMA MATTERS. I AM NOT BEARISH… BUT THIS IS BTC CHART HISTORY. The 50W SMA isn't just another line on the chart. Historically, it has been one of BTC's most important macro bull/bear levels. Look at the chart: ⚠️ 2018 — 50W rejection → -63% ⚠️ 2022 — 50W rejection → -67% 🚨 2026 — BTC is testing the 50W AGAIN. Does that mean BTC drops 60%? NO. #BitcoinRejectedAt$81K50WeekMA
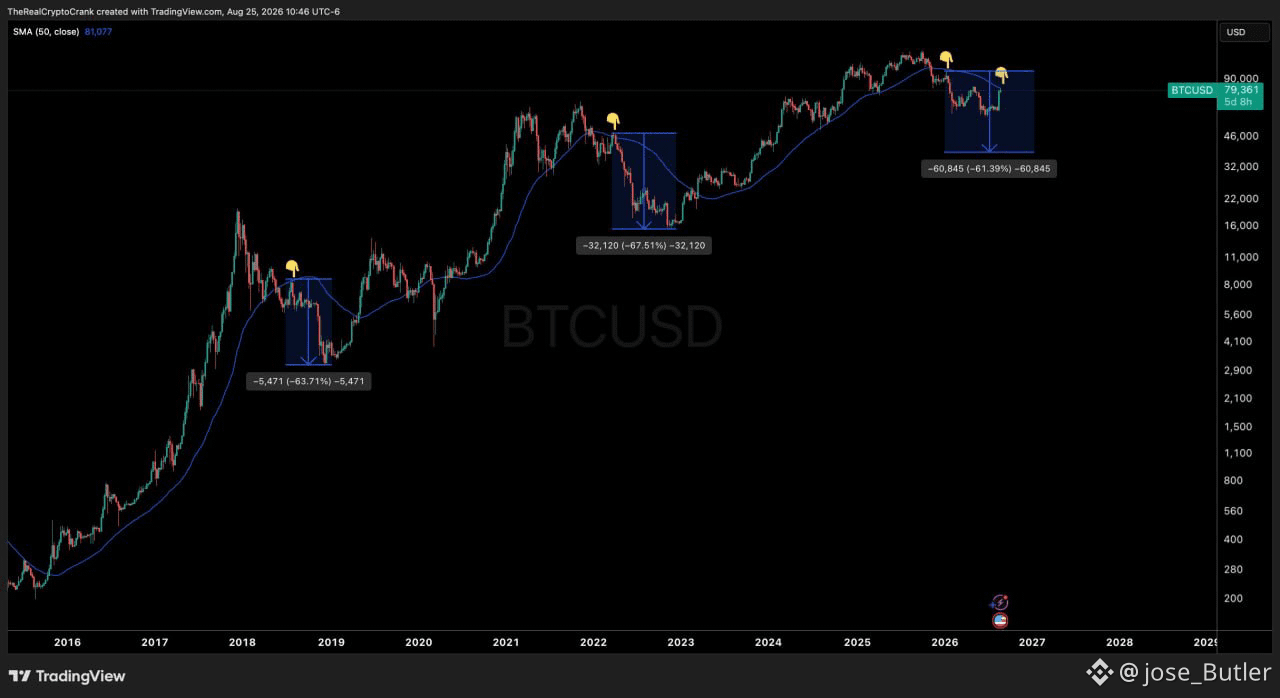
🚨 $BTC ALERT — THE 50-WEEK SMA MATTERS.

I AM NOT BEARISH… BUT THIS IS BTC CHART HISTORY.

The 50W SMA isn't just another line on the chart. Historically, it has been one of BTC's most important macro bull/bear levels.

Look at the chart:

⚠️ 2018 — 50W rejection → -63%
⚠️ 2022 — 50W rejection → -67%
🚨 2026 — BTC is testing the 50W AGAIN.
Does that mean BTC drops 60%? NO.

#BitcoinRejectedAt$81K50WeekMA

#BitcoinRejectedAt$81K50WeekMA Bitcoin at a Turning Point 🚀 The $81,000 resistance is proving difficult for Bitcoin as price gets rejected around the 50-week moving average. This could become a major decision point for the market. Bulls need a convincing breakout above the MA, while bears will look for another rejection to extend downside momentum. One thing is clear: BTC’s reaction around $81K could set the tone for the next move. 📊🔥$SOLV $NBISB $USARB

#BitcoinRejectedAt$81K50WeekMA Bitcoin at a Turning Point 🚀
The $81,000 resistance is proving difficult for Bitcoin as price gets rejected around the 50-week moving average.
This could become a major decision point for the market. Bulls need a convincing breakout above the MA, while bears will look for another rejection to extend downside momentum.
One thing is clear: BTC’s reaction around $81K could set the tone for the next move. 📊🔥$SOLV $NBISB $USARB
#BitcoinRejectedAt$81K50WeekMA BTC Faces a Critical Technical Test Bitcoin’s latest rejection at $81K has placed the 50-week MA firmly in focus. The market now needs to see whether BTC can turn this resistance into support. A successful breakout could strengthen the bullish case, while another rejection may give sellers more confidence. $81K is the battlefield. ⚔️₿$ALICE $YB $AVAX
#BitcoinRejectedAt$81K50WeekMA BTC Faces a Critical Technical Test
Bitcoin’s latest rejection at $81K has placed the 50-week MA firmly in focus.
The market now needs to see whether BTC can turn this resistance into support. A successful breakout could strengthen the bullish case, while another rejection may give sellers more confidence.
$81K is the battlefield. ⚔️₿$ALICE $YB $AVAX

#BitcoinRejectedAt$81K50WeekMA $81K Resistance Stops Bitcoin Bitcoin attempted to push higher but was rejected around $81,000, right near its 50-week moving average. This is an important technical warning for bulls. A failure to reclaim the MA could lead to continued consolidation or further downside. On the other hand, breaking above $81K could invalidate the short-term bearish setup and attract fresh buyers. 📈👀$EUL $ALICE $RENDER

#BitcoinRejectedAt$81K50WeekMA $81K Resistance Stops Bitcoin
Bitcoin attempted to push higher but was rejected around $81,000, right near its 50-week moving average.
This is an important technical warning for bulls. A failure to reclaim the MA could lead to continued consolidation or further downside.
On the other hand, breaking above $81K could invalidate the short-term bearish setup and attract fresh buyers. 📈👀$EUL $ALICE $RENDER
#BitcoinRejectedAt$81K50WeekMA Bitcoin Rejected — What Happens Next? BTC’s rejection near $81,000 is turning the 50-week MA into a critical resistance zone. If Bitcoin continues trading below this level, sellers could attempt to push prices lower. But if bulls manage to reclaim the 50-week MA with strong volume, sentiment could shift rapidly. The battle around $81K is far from over. 🔥$AXTIB $BEB $DOT
#BitcoinRejectedAt$81K50WeekMA Bitcoin Rejected — What Happens Next?
BTC’s rejection near $81,000 is turning the 50-week MA into a critical resistance zone.
If Bitcoin continues trading below this level, sellers could attempt to push prices lower. But if bulls manage to reclaim the 50-week MA with strong volume, sentiment could shift rapidly.
The battle around $81K is far from over. 🔥$AXTIB $BEB $DOT

#BitcoinRejectedAt$81K50WeekMA Bitcoin’s $81K Battle Bitcoin just faced another rejection near $81K, putting the spotlight on the 50-week moving average. This technical level could decide BTC’s next major move. Holding below it may keep bearish pressure alive, while reclaiming it could bring buyers back into the market. For now, $81K remains the level to watch. ⚡📊$POL $MRVLB $SUI
#BitcoinRejectedAt$81K50WeekMA Bitcoin’s $81K Battle
Bitcoin just faced another rejection near $81K, putting the spotlight on the 50-week moving average.
This technical level could decide BTC’s next major move. Holding below it may keep bearish pressure alive, while reclaiming it could bring buyers back into the market.
For now, $81K remains the level to watch. ⚡📊$POL $MRVLB $SUI

Bitcoin got rejected right at the 50-week MA. BTC pushed to about $81,265, while the 50-week MA was around $81,085, then slipped back below $80K. The important part now: 🔴 $81K–$82K: major resistance 🟢 Weekly close above $82K: much stronger confirmation that the broader downtrend may be ending ⚠️ Rejection + loss of $80K: could trigger consolidation/pullback 📈 Next bullish target: $83K+ if BTC reclaims the 50W MA decisively This isn't just another resistance line. The 50-week MA has been below BTC since November 2025, so reclaiming it on a weekly close would be a big structural signal The battle is now $81K → $82K. Bulls need to turn that ceiling into a floor. 🔥 #BitcoinRejectedAt$81K50WeekMA
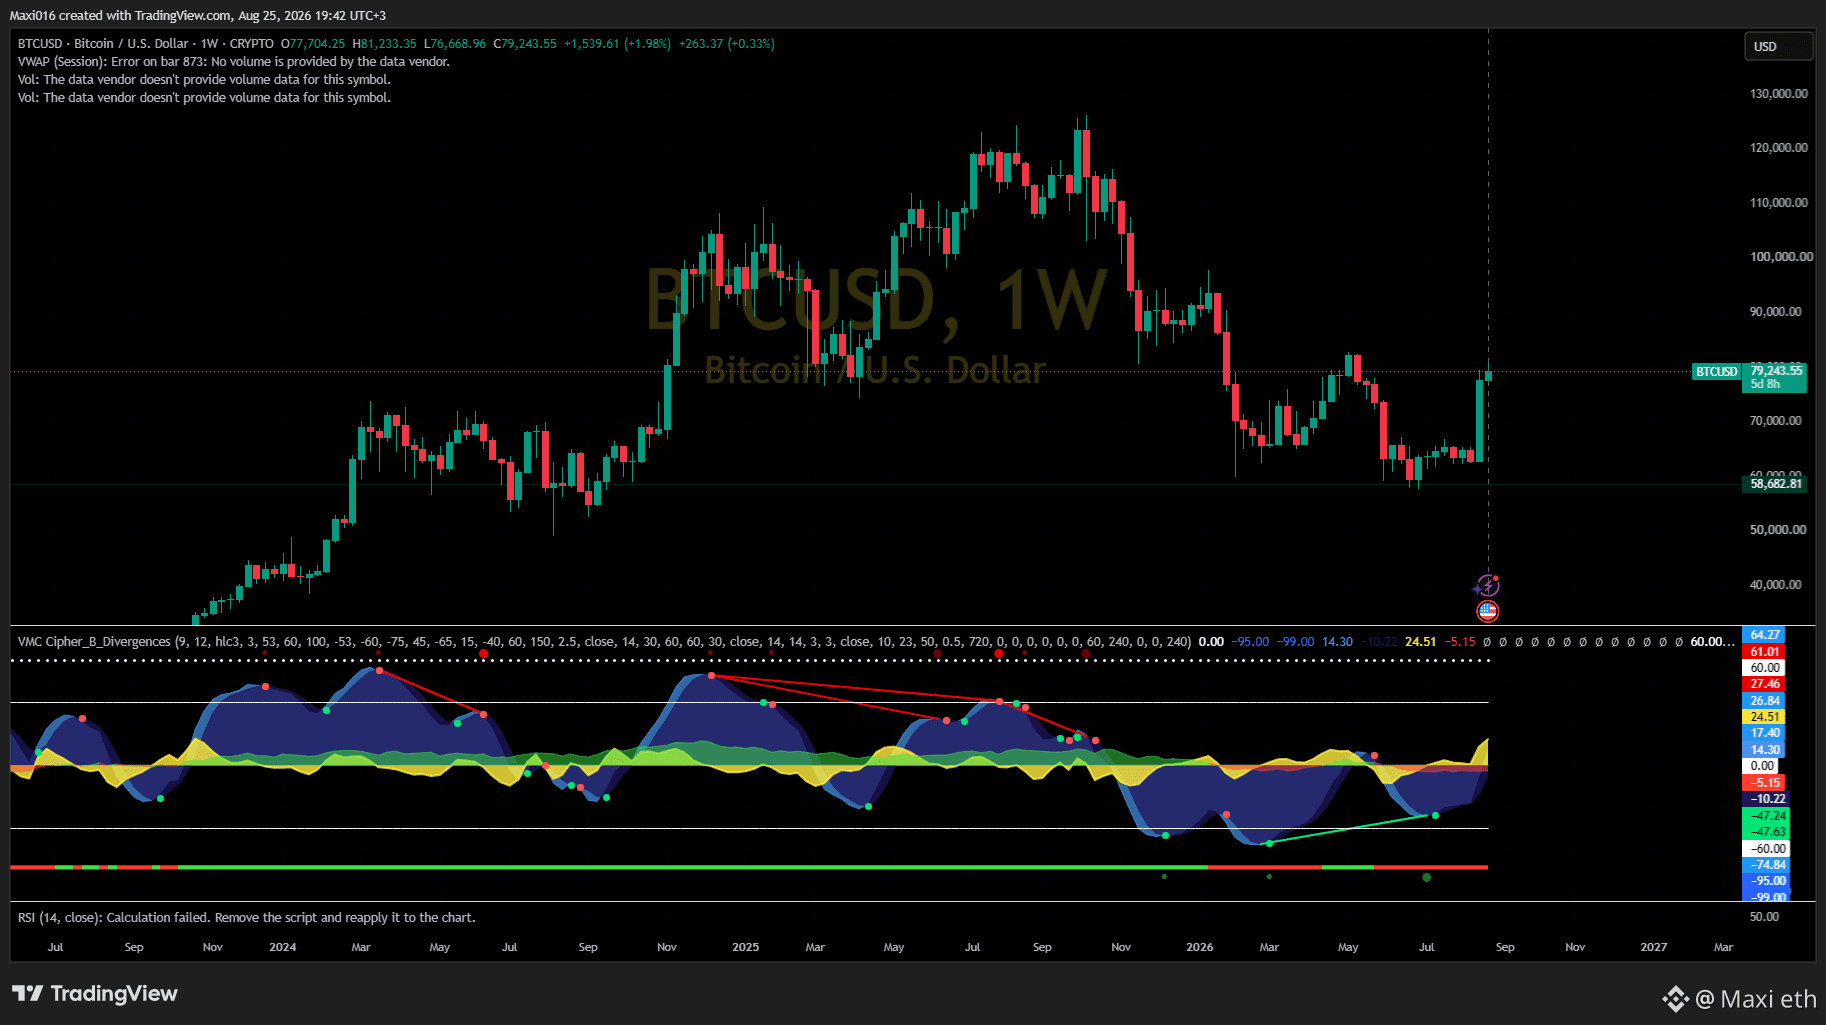
Bitcoin got rejected right at the 50-week MA. BTC pushed to about $81,265, while the 50-week MA was around $81,085, then slipped back below $80K.
The important part now:
🔴 $81K–$82K: major resistance

🟢 Weekly close above $82K: much stronger confirmation that the broader downtrend may be ending

⚠️ Rejection + loss of $80K: could trigger consolidation/pullback

📈 Next bullish target: $83K+ if BTC reclaims the 50W MA decisively
This isn't just another resistance line.
The 50-week MA has been below BTC since November 2025, so reclaiming it on a weekly close would be a big structural signal

The battle is now $81K → $82K. Bulls need to turn that ceiling into a floor. 🔥 #BitcoinRejectedAt$81K50WeekMA
#BitcoinRejectedAt$81K50WeekMA BTC Hits Resistance at $81K 🚨 Bitcoin is struggling to break above $81,000, where the 50-week MA is creating major resistance. The rejection shows that bulls need stronger momentum to regain control. A clean breakout and weekly close above this level could open the door for a stronger recovery. Until then, traders may remain cautious as BTC battles this critical resistance. 👀₿$TWT $ONT $XRP
#BitcoinRejectedAt$81K50WeekMA BTC Hits Resistance at $81K 🚨
Bitcoin is struggling to break above $81,000, where the 50-week MA is creating major resistance.
The rejection shows that bulls need stronger momentum to regain control. A clean breakout and weekly close above this level could open the door for a stronger recovery.
Until then, traders may remain cautious as BTC battles this critical resistance. 👀₿$TWT $ONT $XRP
#BitcoinRejectedAt$81K50WeekMA 🟨 BITCOIN $81,000 WALL 50 WEEK MA • THE FINAL BOSS • JULY 2026 Bitcoin slammed into $81,000 and hit a LASER WALL. The 50 Week MA rejected it like nothing. BREAKDOWN: Price: $81,000 → REJECTED Indicator: 50W MA - 3rd touch in 4 years Volume: Institutional Distribution Result: Market-wide pullback MARKET REALITY: BTC Rejection = Altcoin Meltdown = Capital Rotation Money Flow: Risk Assets → Stablecoins → Gold Tokens COINS TRENDING NOW 🔥 1. $BTC - $81K WALL. Support $74K. Break = $90K-$100K 2. ETH - RWA Leader. $2400 support. Tokenizing $16T assets 3. $SOL - High beta. -12% today. $130 critical 4. $XRP - Legal win. Relative strength vs alts 5. PAXG/XAUT - +6%. On-chain gold demand exploding 6. GOLD - Physical breaking out. Nations hoarding THE PLAYBOOK: SCENARIO A: Flip $81K = Fast move to $90K → $100K SCENARIO B: Lose $74K = Final accumulation $68K-$70K GOD TIER TRUTH: 50W MA rejections = Generational buy zones 2020: Rejected → 300% 2023: Rejected → 200% 2026: Loading... KEY LEVEL: $81,000 QUESTION: Breakdown or Breakout to $100K? #bitcoin #BTC #crypto #50weekma #technicalanalysis #eth #sol #xrp #paxg #xaut #GOLD #macro #rwa #cryptonews #godtier#BTCReaches$80000

#BitcoinRejectedAt$81K50WeekMA
🟨 BITCOIN $81,000 WALL
50 WEEK MA • THE FINAL BOSS • JULY 2026

Bitcoin slammed into $81,000 and hit a LASER WALL.
The 50 Week MA rejected it like nothing.

BREAKDOWN:
Price: $81,000 → REJECTED
Indicator: 50W MA - 3rd touch in 4 years
Volume: Institutional Distribution
Result: Market-wide pullback

MARKET REALITY:
BTC Rejection = Altcoin Meltdown = Capital Rotation
Money Flow: Risk Assets → Stablecoins → Gold Tokens

COINS TRENDING NOW 🔥
1. $BTC - $81K WALL. Support $74K. Break = $90K-$100K
2. ETH - RWA Leader. $2400 support. Tokenizing $16T assets
3. $SOL - High beta. -12% today. $130 critical
4. $XRP - Legal win. Relative strength vs alts
5. PAXG/XAUT - +6%. On-chain gold demand exploding
6. GOLD - Physical breaking out. Nations hoarding

THE PLAYBOOK:
SCENARIO A: Flip $81K = Fast move to $90K → $100K
SCENARIO B: Lose $74K = Final accumulation $68K-$70K

GOD TIER TRUTH:
50W MA rejections = Generational buy zones
2020: Rejected → 300%
2023: Rejected → 200%
2026: Loading...

KEY LEVEL: $81,000
QUESTION: Breakdown or Breakout to $100K?

#bitcoin #BTC #crypto #50weekma #technicalanalysis #eth #sol #xrp #paxg #xaut #GOLD #macro #rwa #cryptonews #godtier#BTCReaches$80000

·
--
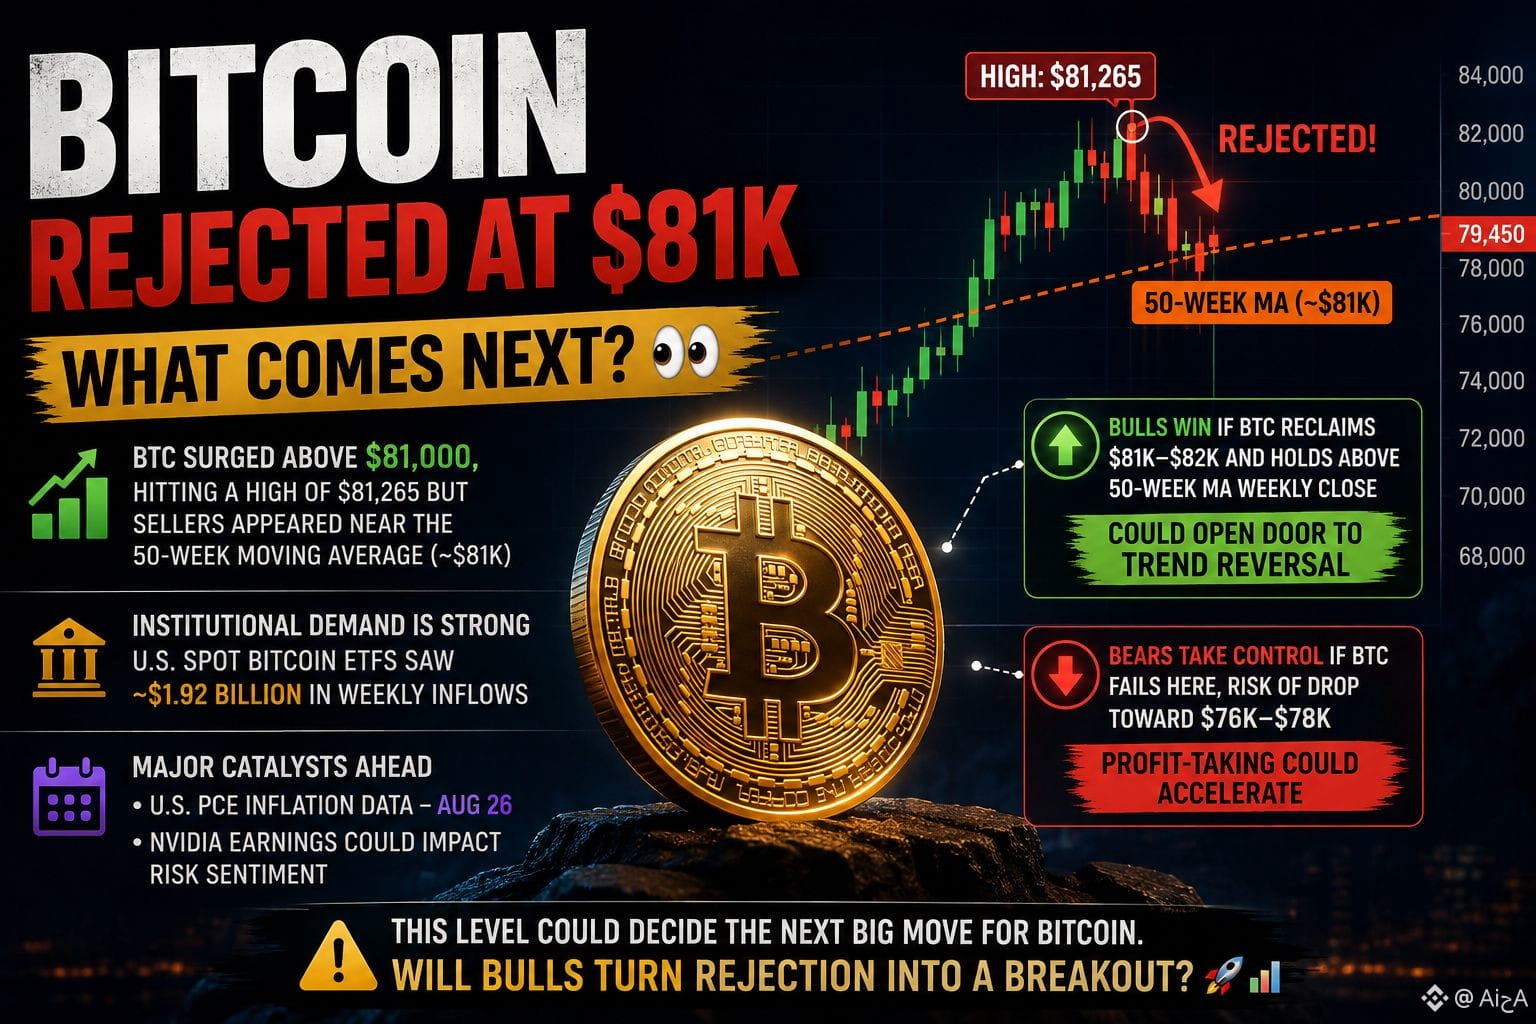
🚨 Bitcoin Rejected at $81K Breakout or Pullback? 👀 #BitcoinRejectedAt$81K50WeekMA Bitcoin just gave the market a serious warning. ⚠️ BTC pushed above $81,000, reaching around $81,265, but sellers stepped in hard near the 50-week moving average. The result? Bitcoin slipped back below $80K. 📉 And now, $81K–$82K is the level everyone is watching. 👀 🐂 If Bulls Win… If BTC breaks back above $81K–$82K and holds the 50-week moving average on the weekly chart, this recovery could become something much bigger. It could be the beginning of a real trend reversal. 🚀 🐻 But If Bulls Fail… If Bitcoin gets rejected again, traders could start taking profits. That could push BTC toward the $76K–$78K zone. And there’s more coming… 🇺🇸 U.S. PCE inflation data arrives August 26, while Nvidia earnings could also affect overall risk sentiment. Meanwhile, Bitcoin has already jumped around 25% in just one week, and U.S. spot Bitcoin ETFs saw roughly $1.92B in weekly inflows. That means this move isn't looking like just a retail pump. 🏦 Institutional money is watching too. So forget the question: “Did Bitcoin touch $81K?” The real question is: Can BTC turn the $81K rejection into an $81K breakout? 👀🔥 If bulls reclaim this level, the next chapter could get very interesting. Bitcoin is at a decision point. 📊🚀 #Bitcoin #BTC #crypto #BitcoinNews #CryptoNews #BTCUSD #Trading #CryptoTrading $BTC {spot}(BTCUSDT) $NVDAB {spot}(NVDABUSDT)
🚨 Bitcoin Rejected at $81K Breakout or Pullback? 👀

#BitcoinRejectedAt$81K50WeekMA

Bitcoin just gave the market a serious warning. ⚠️

BTC pushed above $81,000, reaching around $81,265, but sellers stepped in hard near the 50-week moving average.
The result?
Bitcoin slipped back below $80K. 📉
And now, $81K–$82K is the level everyone is watching. 👀

🐂 If Bulls Win…

If BTC breaks back above $81K–$82K and holds the 50-week moving average on the weekly chart, this recovery could become something much bigger.
It could be the beginning of a real trend reversal. 🚀

🐻 But If Bulls Fail…
If Bitcoin gets rejected again, traders could start taking profits.
That could push BTC toward the $76K–$78K zone.
And there’s more coming…
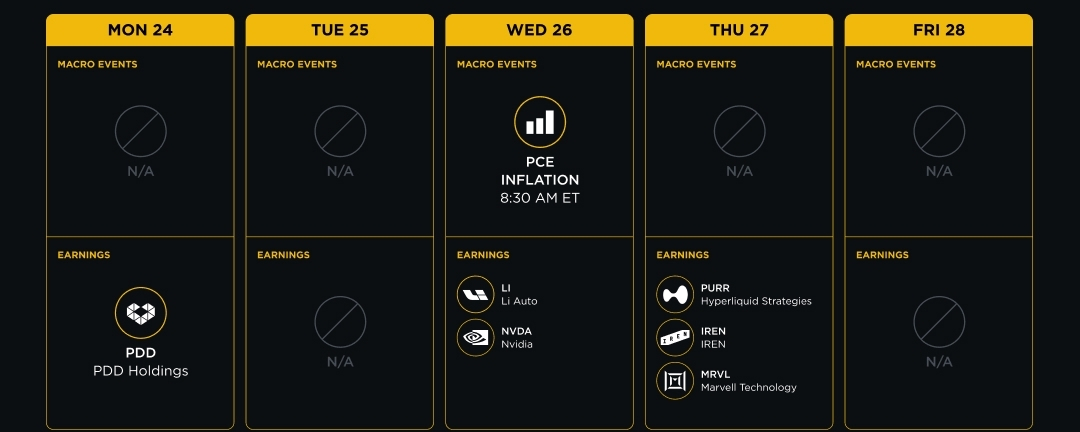
🇺🇸 U.S. PCE inflation data arrives August 26, while Nvidia earnings could also affect overall risk sentiment.
Meanwhile, Bitcoin has already jumped around 25% in just one week, and U.S. spot Bitcoin ETFs saw roughly $1.92B in weekly inflows.
That means this move isn't looking like just a retail pump.

🏦 Institutional money is watching too.
So forget the question:
“Did Bitcoin touch $81K?”
The real question is:
Can BTC turn the $81K rejection into an $81K breakout? 👀🔥
If bulls reclaim this level, the next chapter could get very interesting.
Bitcoin is at a decision point. 📊🚀

#Bitcoin #BTC #crypto #BitcoinNews #CryptoNews #BTCUSD #Trading #CryptoTrading
$BTC

$NVDAB
Article
BTCUSDT is at $78,326.00 on 2026-08-25,BTCUSDT is at $78,326.00 on 2026-08-25, down 0.09% over the latest 24 hours after  Spot Bitcoin ETF inflows provided real demand. U.S. spot BTC ETFs logged consecutive days of net inflows (including ~$337–$338 million on Aug 24), extending a multi-day streak after a strong prior week that brought in roughly $1.9B+. BlackRock’s IBIT led much of the activity. Assets under management rose meaningfully with both inflows and the price move.7f8645 Coindesk Broad risk appetite and macro factors (weaker dollar, debasement concerns tied to Treasury actions, and improving liquidity) supported the broader move. Short-covering / liquidations amplified the upside. Earlier in the week there were sizable short liquidations (billions in notional across sessions), which helped fuel the rapid advance from the mid-$60Ks / low-$70Ks. The rally pushed BTC above key daily moving averages and delivered one of its strongest weekly gains in years (~23–25%+ in places), recovering substantially from the earlier 2026 drawdown after the prior cycle high near $126K. Near-term technical picture The key level you flag is correct: whether BTC can reclaim and hold above $80K. Price was rejected near the 50-week moving average (reported around $81,085–$81,087, with some analysis citing the broader $81–82K zone). This longer-term average has historically been a meaningful cycle gauge—reclaiming it on a weekly close has often aligned with the end of prior bear phases (Galaxy Research and others have highlighted the pattern of bottoms forming before or around such reclaims in many past cycles). First approaches after a steep run often face resistance, so a clean hold or weekly close above it would be more constructive than a one-touch rejection.00d350 Cryptonews Supporting levels and context: Holding the $78–80K zone keeps the short-term structure intact after the surge. A sustained break back above $80–81K (and ideally the 50-week MA) would open room for further upside. Failure to reclaim and renewed selling could see a deeper retracement toward prior support in the mid-to-high $70Ks as the market digests the move and overbought short-term conditions (strong 7-day rate of change). Overall, the combination of ETF demand, short covering, and improving sentiment turned a technical squeeze into a more fundamental-looking advance, but the rejection at the 50-week MA leaves the immediate question open: consolidation/reclaim of $80K+ versus a pause or pullback. Watch volume on any retest of $80K, continued ETF flow data, and broader risk markets for confirmation.#BTCReaches$80000 #BitcoinRejectedAt$81K50WeekMA #Binance #bitcoin

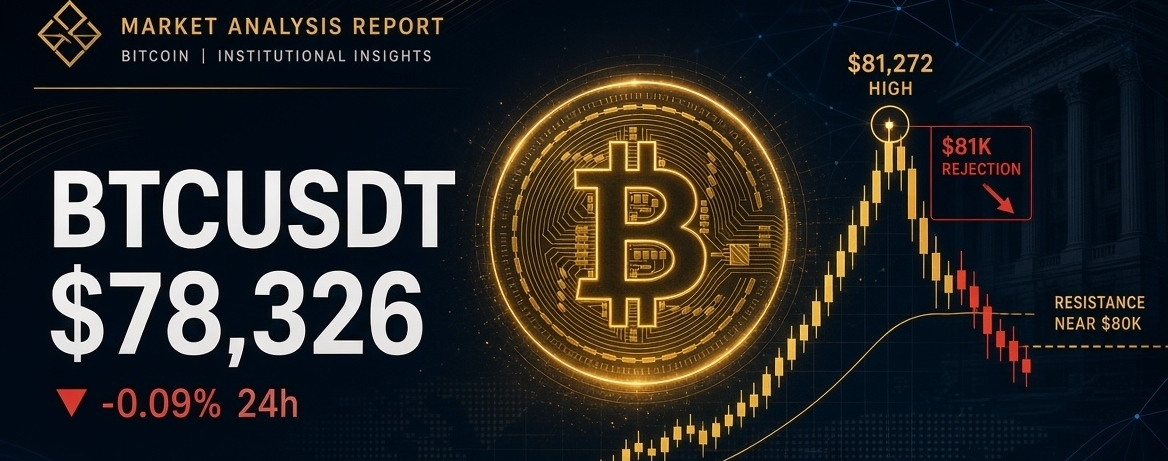
BTCUSDT is at $78,326.00 on 2026-08-25,

BTCUSDT is at $78,326.00 on 2026-08-25,
down 0.09% over the latest 24 hours after
Spot Bitcoin ETF inflows provided real demand. U.S. spot BTC ETFs logged consecutive days of net inflows (including ~$337–$338 million on Aug 24), extending a multi-day streak after a strong prior week that brought in roughly $1.9B+. BlackRock’s IBIT led much of the activity. Assets under management rose meaningfully with both inflows and the price move.7f8645
Coindesk
Broad risk appetite and macro factors (weaker dollar, debasement concerns tied to Treasury actions, and improving liquidity) supported the broader move.
Short-covering / liquidations amplified the upside. Earlier in the week there were sizable short liquidations (billions in notional across sessions), which helped fuel the rapid advance from the mid-$60Ks / low-$70Ks.
The rally pushed BTC above key daily moving averages and delivered one of its strongest weekly gains in years (~23–25%+ in places), recovering substantially from the earlier 2026 drawdown after the prior cycle high near $126K.
Near-term technical picture
The key level you flag is correct: whether BTC can reclaim and hold above $80K.
Price was rejected near the 50-week moving average (reported around $81,085–$81,087, with some analysis citing the broader $81–82K zone). This longer-term average has historically been a meaningful cycle gauge—reclaiming it on a weekly close has often aligned with the end of prior bear phases (Galaxy Research and others have highlighted the pattern of bottoms forming before or around such reclaims in many past cycles). First approaches after a steep run often face resistance, so a clean hold or weekly close above it would be more constructive than a one-touch rejection.00d350
Cryptonews
Supporting levels and context:
Holding the $78–80K zone keeps the short-term structure intact after the surge.
A sustained break back above $80–81K (and ideally the 50-week MA) would open room for further upside.
Failure to reclaim and renewed selling could see a deeper retracement toward prior support in the mid-to-high $70Ks as the market digests the move and overbought short-term conditions (strong 7-day rate of change).
Overall, the combination of ETF demand, short covering, and improving sentiment turned a technical squeeze into a more fundamental-looking advance, but the rejection at the 50-week MA leaves the immediate question open: consolidation/reclaim of $80K+ versus a pause or pullback. Watch volume on any retest of $80K, continued ETF flow data, and broader risk markets for confirmation.#BTCReaches$80000 #BitcoinRejectedAt$81K50WeekMA #Binance #bitcoin
#BitcoinRejectedAt$81K50WeekMA 🚨 MARKET UPDATE: Bitcoin Facing Major Resistance! 🚨 Bitcoin (BTC) recently made a decisive push toward upper key levels but faced a critical rejection at the $81,000 mark, right along the major 50-Week Moving Average (50 MA). This technical rejection points to significant selling pressure from institutional supply zones and long-term moving averages. The market is currently consolidating as traders evaluate whether this pullback will trigger a deeper retracement or form a base for the next breakout attempt. Stay cautious, manage your risk, and keep a close eye on support levels! Featured Crypto Asset Highlights: Bitcoin ($BTC ): Testing crucial support after being rejected at the $81,000 / 50-Week MA level. Key support zone to watch is $76,000–$76,500. Binance Coin ($BNB ): Showing strong market resilience amidst market-wide volatility, maintaining solid trading volume alongside top-cap assets. Ethereum ($ETH ): Moving in tandem with market trends, facing overhead resistance while consolidating near major support levels. {spot}(BTCUSDT) {spot}(BNBUSDT) {spot}(ETHUSDT) #BinanceSquare
#BitcoinRejectedAt$81K50WeekMA
🚨 MARKET UPDATE: Bitcoin Facing Major Resistance! 🚨
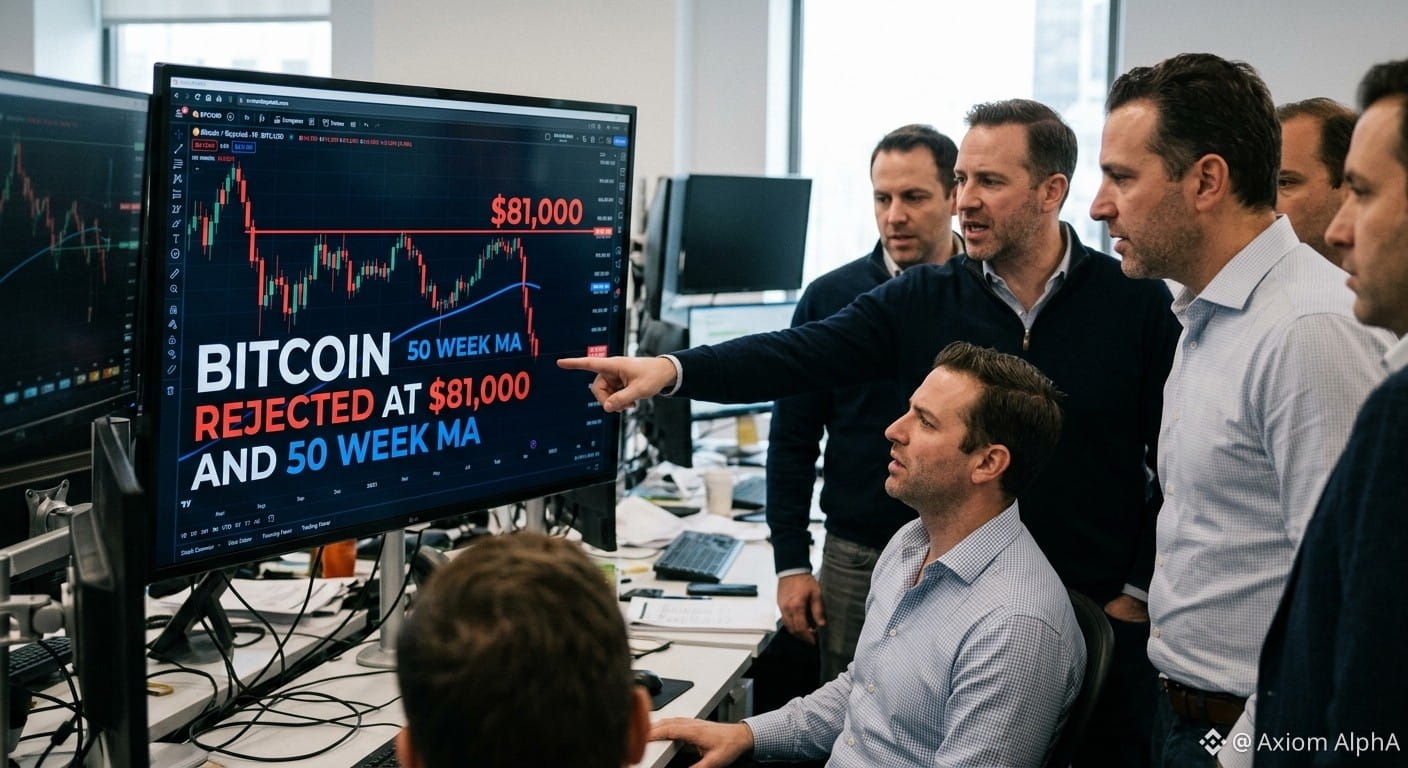
Bitcoin (BTC) recently made a decisive push toward upper key levels but faced a critical rejection at the $81,000 mark, right along the major 50-Week Moving Average (50 MA).
This technical rejection points to significant selling pressure from institutional supply zones and long-term moving averages. The market is currently consolidating as traders evaluate whether this pullback will trigger a deeper retracement or form a base for the next breakout attempt. Stay cautious, manage your risk, and keep a close eye on support levels!
Featured Crypto Asset Highlights:
Bitcoin ($BTC ): Testing crucial support after being rejected at the $81,000 / 50-Week MA level. Key support zone to watch is $76,000–$76,500.
Binance Coin ($BNB ): Showing strong market resilience amidst market-wide volatility, maintaining solid trading volume alongside top-cap assets.
Ethereum ($ETH ): Moving in tandem with market trends, facing overhead resistance while consolidating near major support levels.
#BinanceSquare
Article
Bitcoin Rejected At $81000 🔥$BTC Bitcoin rejection around the $81,000 level is an important technical development for traders, especially as the 50 week moving average , 50 WMA , continues to act as a major resistance zone. The 50 WMA is widely watched because it can help identify the broader market trend and separate periods of strength from prolonged weakness. Bitcoin’s failure to break and hold above this level suggests that sellers are still active near this important resistance. After reaching the $81K area, BTC faced selling pressure and pulled back, showing that buyers were not yet strong enough to establish a sustained breakout. For bulls, the key challenge now is to reclaim the 50-WMA with strong volume and maintain price above it. A successful weekly close above this moving average could improve market sentiment and potentially open the door toward higher resistance levels. On the other hand, another rejection could increase short-term downside pressure and encourage traders to watch nearby support zones carefully. It is also important to remember that a single rejection does not automatically confirm a major bearish trend. Bitcoin often experiences false breakouts, retests, and sharp volatility around major technical levels. Traders should therefore avoid making decisions based solely on one indicator. Combining the 50-WMA with market structure, trading volume, support and resistance, momentum indicators, and broader macroeconomic conditions can provide a more balanced view. Risk management is equally important during periods of high volatility. Using a reasonable position size and placing a stop-loss below a clearly defined invalidation level can help protect capital if the trade moves against expectations. For now, $81K and the 50 WMA remain critical levels to watch. A strong breakout and successful retest could signal renewed bullish momentum, while repeated rejection may indicate that Bitcoin needs more time to build strength before attempting another move higher. Patience and disciplined risk management remain essential while the market decides its next direction. 🚀⛽ #BitcoinRejectedAt$81K50WeekMA {future}(BTCUSDT) {future}(ETHUSDT) {future}(BNBUSDT)

Bitcoin Rejected At $81000 🔥

$BTC Bitcoin rejection around the $81,000 level is an important technical development for traders, especially as the 50 week moving average , 50 WMA , continues to act as a major resistance zone. The 50 WMA is widely watched because it can help identify the broader market trend and separate periods of strength from prolonged weakness. Bitcoin’s failure to break and hold above this level suggests that sellers are still active near this important resistance. After reaching the $81K area, BTC faced selling pressure and pulled back, showing that buyers were not yet strong enough to establish a sustained breakout. For bulls, the key challenge now is to reclaim the 50-WMA with strong volume and maintain price above it. A successful weekly close above this moving average could improve market sentiment and potentially open the door toward higher resistance levels. On the other hand, another rejection could increase short-term downside pressure and encourage traders to watch nearby support zones carefully. It is also important to remember that a single rejection does not automatically confirm a major bearish trend. Bitcoin often experiences false breakouts, retests, and sharp volatility around major technical levels. Traders should therefore avoid making decisions based solely on one indicator. Combining the 50-WMA with market structure, trading volume, support and resistance, momentum indicators, and broader macroeconomic conditions can provide a more balanced view. Risk management is equally important during periods of high volatility. Using a reasonable position size and placing a stop-loss below a clearly defined invalidation level can help protect capital if the trade moves against expectations. For now, $81K and the 50 WMA remain critical levels to watch. A strong breakout and successful retest could signal renewed bullish momentum, while repeated rejection may indicate that Bitcoin needs more time to build strength before attempting another move higher. Patience and disciplined risk management remain essential while the market decides its next direction. 🚀⛽
#BitcoinRejectedAt$81K50WeekMA

KriptoVIPTrader:
+
Log in to explore more content
Join global crypto users on Binance Square
⚡️ Get latest and useful information about crypto.
💬 Trusted by the world’s largest crypto exchange.
👍 Discover real insights from verified creators.
Email / Phone number