

CR Insights
11.5k Posts

CR Insights
Report
Block User
Crypto trader & Web3 researcher | Crypto explorer sharing market insights, airdrops, ecosystem updates & opportunities
477 Following
15.0K+ Followers
10.3K+ Liked
Posts
All
Quotes
Videos
Live
PINNED
·
--
Verified
Article
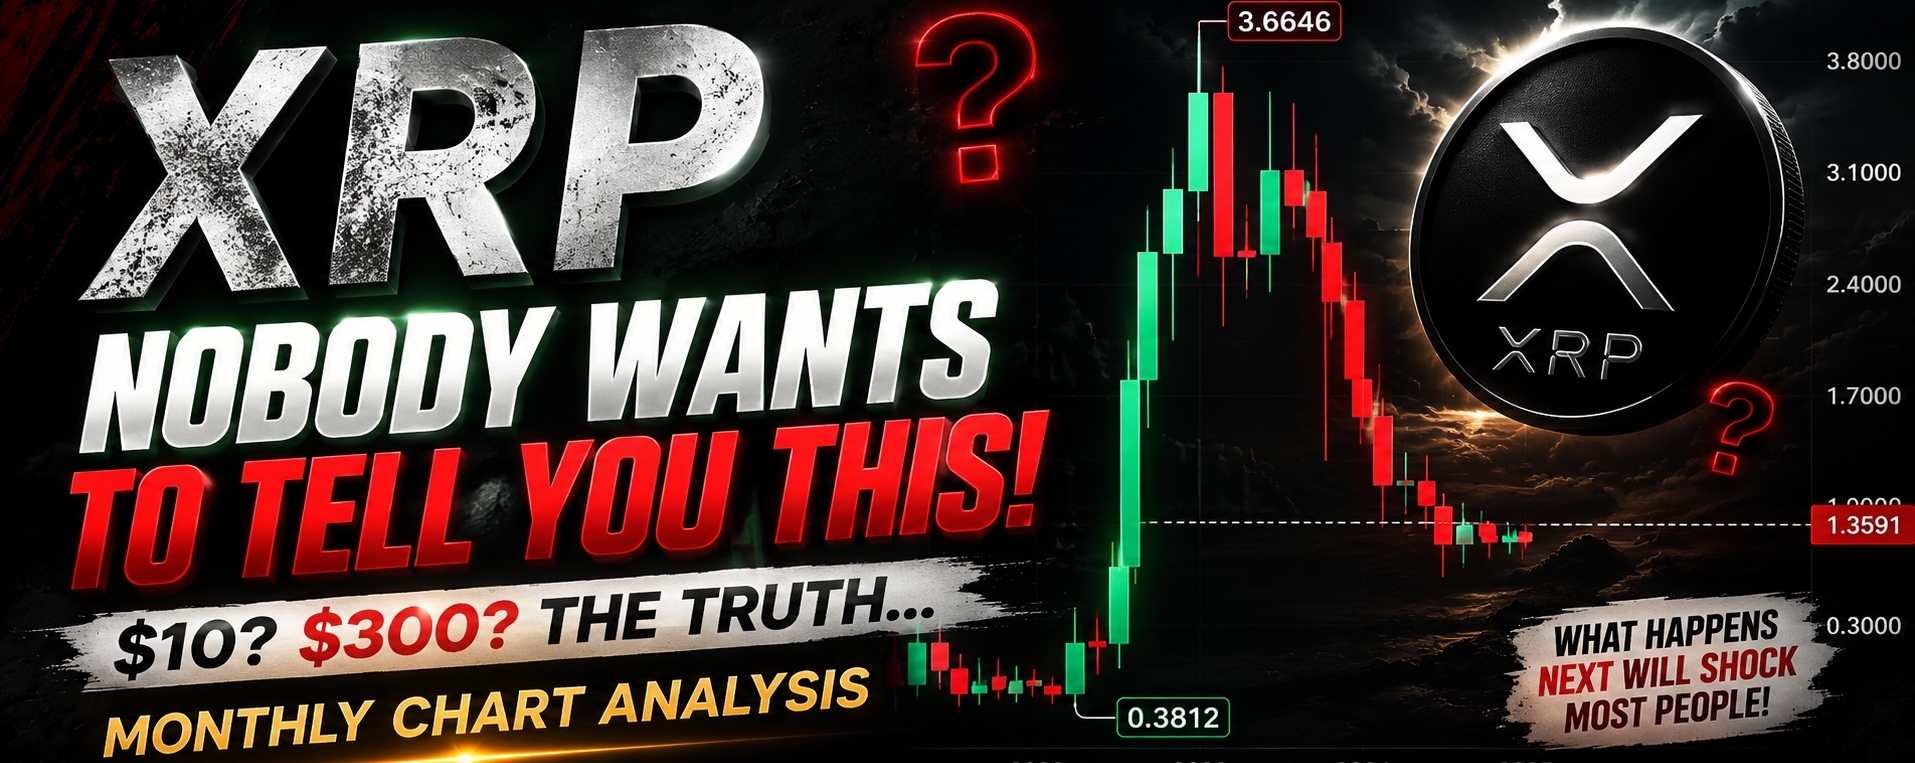
Nobody Wants To Tell You This About XRP Monthly StructurePeople are fighting over $10 $XRP and $300 XRP while the monthly chart is literally showing momentum exhaustion in real time.
Look carefully at the structure.
Huge expansion candle from the $0.38 areaViolent push toward $3.66Then multiple monthly rejection candlesLower closes after the peakMomentum fading instead of accelerating
That usually tells me one thing: the market is entering a cooling or distribution phase, not a clean price discovery phase.
If $XRP was truly preparing for an instant move toward extreme targets, monthly candles would normally show:
stronger follow-through
aggressive reclaim behavior
expanding volume continuation
less rejection near highs
Instead, what I see is sellers repeatedly stepping in after every attempt higher.
Realistically? A move toward previous highs again is possible if the broader alt market stays strong.
But people throwing out $100–$300 targets from this current monthly structure are mostly farming emotions and engagement.
Because the higher price goes, the more liquidity and market cap expansion is required.
That part usually disappears from social media posts.
Real-world example: Retail traders often buy after giant green monthly candles because it “feels safe.” Meanwhile experienced traders usually become more cautious exactly when the crowd becomes most confident.
From this monthly chart alone, I see slowing momentum after an explosive expansion, not evidence of an easy straight-line move toward fantasy targets.
#X #Xrp🔥🔥 #TrendingTopic #BitcoinBreaksBelow75KAsWarshTakesFedHelm
Nobody Wants To Tell You This About XRP Monthly Structure
People are fighting over $10 $XRP and $300 XRP while the monthly chart is literally showing momentum exhaustion in real time.
Look carefully at the structure.
Huge expansion candle from the $0.38 areaViolent push toward $3.66Then multiple monthly rejection candlesLower closes after the peakMomentum fading instead of accelerating
That usually tells me one thing: the market is entering a cooling or distribution phase, not a clean price discovery phase.
If $XRP was truly preparing for an instant move toward extreme targets, monthly candles would normally show:
stronger follow-through
aggressive reclaim behavior
expanding volume continuation
less rejection near highs
Instead, what I see is sellers repeatedly stepping in after every attempt higher.
Realistically? A move toward previous highs again is possible if the broader alt market stays strong.
But people throwing out $100–$300 targets from this current monthly structure are mostly farming emotions and engagement.
Because the higher price goes, the more liquidity and market cap expansion is required.
That part usually disappears from social media posts.
Real-world example: Retail traders often buy after giant green monthly candles because it “feels safe.” Meanwhile experienced traders usually become more cautious exactly when the crowd becomes most confident.
From this monthly chart alone, I see slowing momentum after an explosive expansion, not evidence of an easy straight-line move toward fantasy targets.
#X #Xrp🔥🔥 #TrendingTopic #BitcoinBreaksBelow75KAsWarshTakesFedHelm
Look carefully at the structure.
Huge expansion candle from the $0.38 areaViolent push toward $3.66Then multiple monthly rejection candlesLower closes after the peakMomentum fading instead of accelerating
That usually tells me one thing: the market is entering a cooling or distribution phase, not a clean price discovery phase.
If $XRP was truly preparing for an instant move toward extreme targets, monthly candles would normally show:
stronger follow-through
aggressive reclaim behavior
expanding volume continuation
less rejection near highs
Instead, what I see is sellers repeatedly stepping in after every attempt higher.
Realistically? A move toward previous highs again is possible if the broader alt market stays strong.
But people throwing out $100–$300 targets from this current monthly structure are mostly farming emotions and engagement.
Because the higher price goes, the more liquidity and market cap expansion is required.
That part usually disappears from social media posts.
Real-world example: Retail traders often buy after giant green monthly candles because it “feels safe.” Meanwhile experienced traders usually become more cautious exactly when the crowd becomes most confident.
From this monthly chart alone, I see slowing momentum after an explosive expansion, not evidence of an easy straight-line move toward fantasy targets.
#X #Xrp🔥🔥 #TrendingTopic #BitcoinBreaksBelow75KAsWarshTakesFedHelm
28
6
153
113.3k
PINNED
·
--
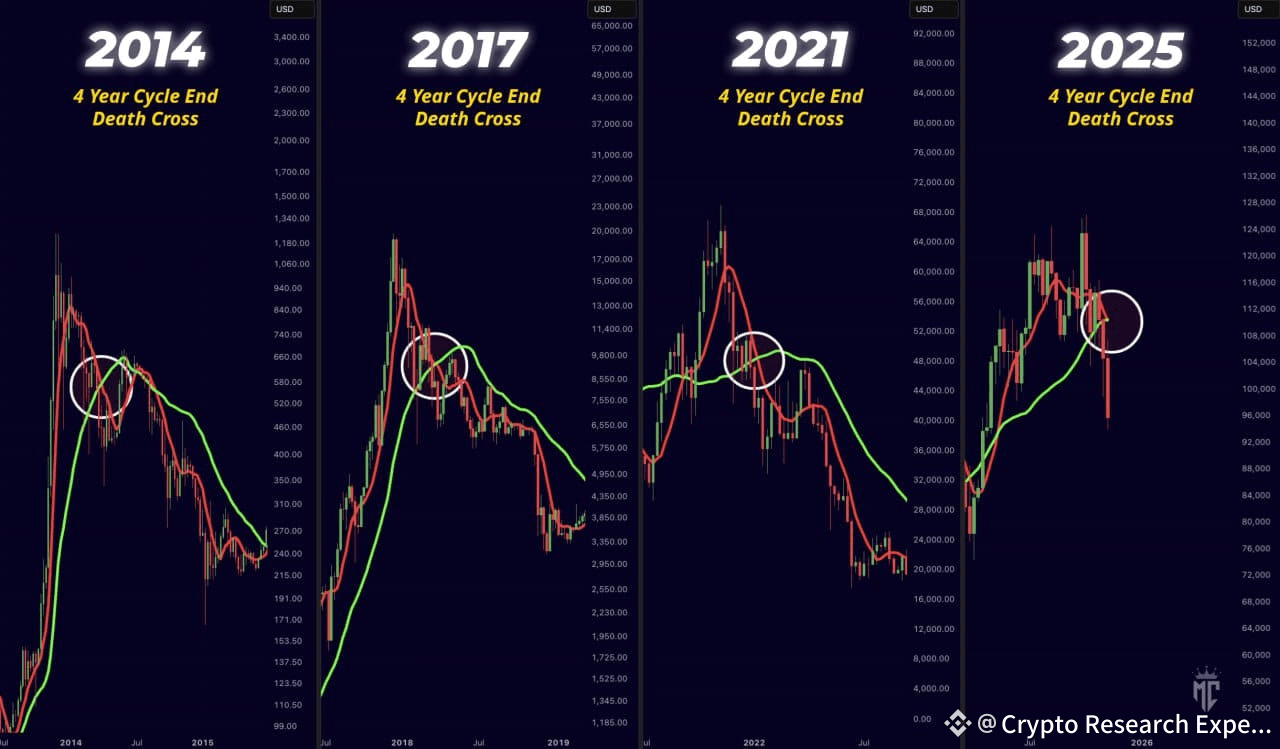
🔥 EVERY BITCOIN CYCLE ENDED WITH A DEATH CROSS… SO WHY WOULD THIS TIME BE DIFFERENT? ⚠️💀📉$BTC
📊 Every major BTC bull cycle we’ve seen — 2013, 2017, 2021 — eventually ended with the legendary Death Cross on higher timeframes.
🤯 Yet right now, Bitcoin is pushing into extreme fear faster than 2021, liquidity is thinning, and volatility is exploding.
🧩 History tells us the same signal returns every cycle… the question is WHEN, not IF.
⚡ Anyone ignoring this is dreaming — cycles don’t change, only emotions do.
🚨 Stay sharp. Stay risk-managed. The market doesn’t care about hope.
🔥 EVERY BITCOIN CYCLE ENDED WITH A DEATH CROSS… SO WHY WOULD THIS TIME BE DIFFERENT? ⚠️💀📉$BTC
📊 Every major BTC bull cycle we’ve seen — 2013, 2017, 2021 — eventually ended with the legendary Death Cross on higher timeframes.
🤯 Yet right now, Bitcoin is pushing into extreme fear faster than 2021, liquidity is thinning, and volatility is exploding.
🧩 History tells us the same signal returns every cycle… the question is WHEN, not IF.
⚡ Anyone ignoring this is dreaming — cycles don’t change, only emotions do.
🚨 Stay sharp. Stay risk-managed. The market doesn’t care about hope.
📊 Every major BTC bull cycle we’ve seen — 2013, 2017, 2021 — eventually ended with the legendary Death Cross on higher timeframes.
🤯 Yet right now, Bitcoin is pushing into extreme fear faster than 2021, liquidity is thinning, and volatility is exploding.
🧩 History tells us the same signal returns every cycle… the question is WHEN, not IF.
⚡ Anyone ignoring this is dreaming — cycles don’t change, only emotions do.
🚨 Stay sharp. Stay risk-managed. The market doesn’t care about hope.
100
60
174
399.1k
·
--
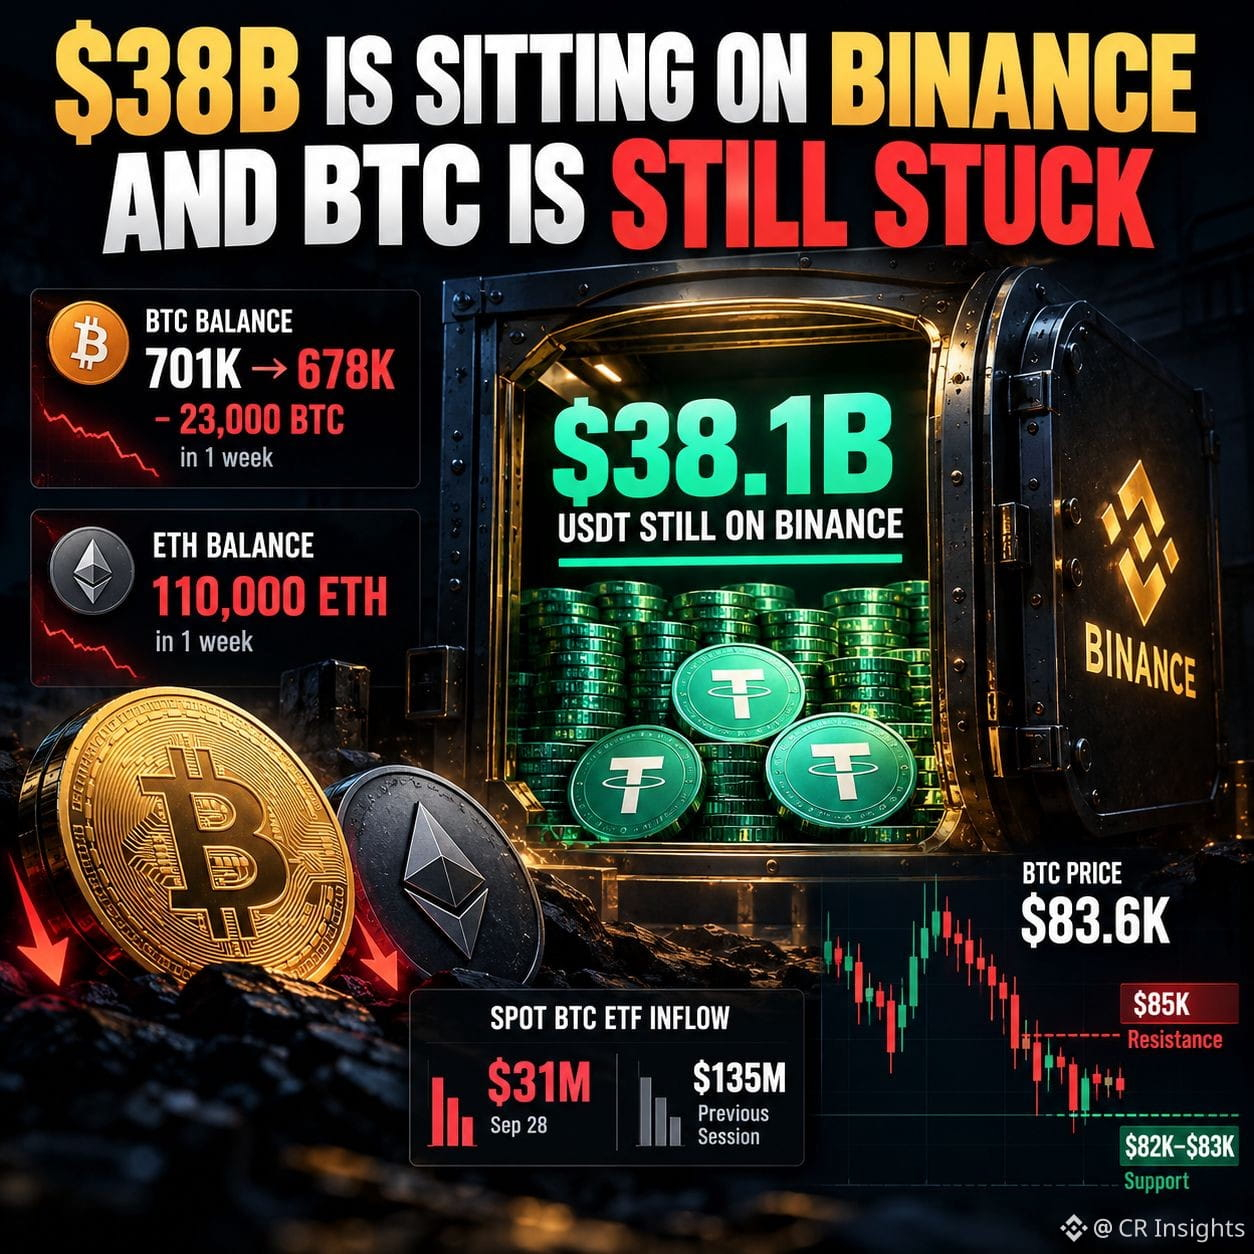
$38B IS SITTING ON BINANCE — AND BTC IS STILL STUCK
There is a liquidity signal hiding in Binance's latest balances.
BTC held on Binance fell by roughly 23,000 BTC in a week, from about 701K to 678K. ETH balances also dropped by around 110,000 ETH.
But USDT didn't leave.
Binance still held roughly $38.1B USDT on September 28.
That's the part I find more interesting than another “BTC is bullish/bearish” headline.
Crypto inventory is leaving the exchange while dollar liquidity is still sitting there.
So the market currently has two very different flows happening at the same place: less BTC/ETH inventory, but a huge pool of stablecoin buying power waiting on the sidelines.
BTC is around $83.6K today, with $82K–$83K acting as the near-term support zone and $85K as the first resistance. ETF inflows are still positive, but the pace has slowed: the September 28 spot BTC ETF inflow was only about $31M, versus roughly $135M the previous session.
That leaves a very simple market test.
If BTC reclaims $85K while that exchange USDT remains high, some of that idle liquidity may finally start chasing spot.
If BTC loses $82K, the same $38B tells a completely different story: traders had liquidity available, but weren't willing to deploy it.
The next move isn't just about how much money is in crypto.
It's about whether the money already sitting there finally moves.
$BTC $ETH
$38B IS SITTING ON BINANCE — AND BTC IS STILL STUCK
There is a liquidity signal hiding in Binance's latest balances.
BTC held on Binance fell by roughly 23,000 BTC in a week, from about 701K to 678K. ETH balances also dropped by around 110,000 ETH.
But USDT didn't leave.
Binance still held roughly $38.1B USDT on September 28.
That's the part I find more interesting than another “BTC is bullish/bearish” headline.
Crypto inventory is leaving the exchange while dollar liquidity is still sitting there.
So the market currently has two very different flows happening at the same place: less BTC/ETH inventory, but a huge pool of stablecoin buying power waiting on the sidelines.
BTC is around $83.6K today, with $82K–$83K acting as the near-term support zone and $85K as the first resistance. ETF inflows are still positive, but the pace has slowed: the September 28 spot BTC ETF inflow was only about $31M, versus roughly $135M the previous session.
That leaves a very simple market test.
If BTC reclaims $85K while that exchange USDT remains high, some of that idle liquidity may finally start chasing spot.
If BTC loses $82K, the same $38B tells a completely different story: traders had liquidity available, but weren't willing to deploy it.
The next move isn't just about how much money is in crypto.
It's about whether the money already sitting there finally moves.
$BTC $ETH
There is a liquidity signal hiding in Binance's latest balances.
BTC held on Binance fell by roughly 23,000 BTC in a week, from about 701K to 678K. ETH balances also dropped by around 110,000 ETH.
But USDT didn't leave.
Binance still held roughly $38.1B USDT on September 28.
That's the part I find more interesting than another “BTC is bullish/bearish” headline.
Crypto inventory is leaving the exchange while dollar liquidity is still sitting there.
So the market currently has two very different flows happening at the same place: less BTC/ETH inventory, but a huge pool of stablecoin buying power waiting on the sidelines.
BTC is around $83.6K today, with $82K–$83K acting as the near-term support zone and $85K as the first resistance. ETF inflows are still positive, but the pace has slowed: the September 28 spot BTC ETF inflow was only about $31M, versus roughly $135M the previous session.
That leaves a very simple market test.
If BTC reclaims $85K while that exchange USDT remains high, some of that idle liquidity may finally start chasing spot.
If BTC loses $82K, the same $38B tells a completely different story: traders had liquidity available, but weren't willing to deploy it.
The next move isn't just about how much money is in crypto.
It's about whether the money already sitting there finally moves.
$BTC $ETH
146
·
--
MICRON EARNINGS TOMORROW — I’M NOT JUST WATCHING REVENUE 👀
Micron reports tomorrow, and honestly, the $50B revenue number is not the part I’m most interested in.
The number I keep coming back to is 86%.
That’s Micron’s Q4 gross-margin guidance. In Q3, it already reached 84.9% non-GAAP gross margin, so the company is basically asking the market to believe margins can move even higher.
And there’s a catch.
Micron itself said its Q4 margin outlook assumes a meaningful moderation in the rate of price increases.
That’s what makes tomorrow interesting.
If memory prices aren't rising as fast, but Micron can still deliver around 86% margins, then this starts looking less like a temporary pricing spike and more like a much stronger memory cycle.
But if margins come in weaker and management starts talking about pricing pressure, supply or demand differently, then the market has something new to think about.
That’s why I’m not asking only:
“Will Micron beat earnings?”
I’m watching what management says about FY2027.
Because the real test of this memory supercycle isn't whether Micron can have one massive quarter.
It’s whether these margins and AI-driven memory demand can stay elevated after this quarter.
Tomorrow should give us a much clearer answer.
$MU
#EarningsSeason #Micron #MU #Semiconductors
MICRON EARNINGS TOMORROW — I’M NOT JUST WATCHING REVENUE 👀
Micron reports tomorrow, and honestly, the $50B revenue number is not the part I’m most interested in.
The number I keep coming back to is 86%.
That’s Micron’s Q4 gross-margin guidance. In Q3, it already reached 84.9% non-GAAP gross margin, so the company is basically asking the market to believe margins can move even higher.
And there’s a catch.
Micron itself said its Q4 margin outlook assumes a meaningful moderation in the rate of price increases.
That’s what makes tomorrow interesting.
If memory prices aren't rising as fast, but Micron can still deliver around 86% margins, then this starts looking less like a temporary pricing spike and more like a much stronger memory cycle.
But if margins come in weaker and management starts talking about pricing pressure, supply or demand differently, then the market has something new to think about.
That’s why I’m not asking only:
“Will Micron beat earnings?”
I’m watching what management says about FY2027.
Because the real test of this memory supercycle isn't whether Micron can have one massive quarter.
It’s whether these margins and AI-driven memory demand can stay elevated after this quarter.
Tomorrow should give us a much clearer answer.
$MU
#EarningsSeason #Micron #MU #Semiconductors
Micron reports tomorrow, and honestly, the $50B revenue number is not the part I’m most interested in.
The number I keep coming back to is 86%.
That’s Micron’s Q4 gross-margin guidance. In Q3, it already reached 84.9% non-GAAP gross margin, so the company is basically asking the market to believe margins can move even higher.
And there’s a catch.
Micron itself said its Q4 margin outlook assumes a meaningful moderation in the rate of price increases.
That’s what makes tomorrow interesting.
If memory prices aren't rising as fast, but Micron can still deliver around 86% margins, then this starts looking less like a temporary pricing spike and more like a much stronger memory cycle.
But if margins come in weaker and management starts talking about pricing pressure, supply or demand differently, then the market has something new to think about.
That’s why I’m not asking only:
“Will Micron beat earnings?”
I’m watching what management says about FY2027.
Because the real test of this memory supercycle isn't whether Micron can have one massive quarter.
It’s whether these margins and AI-driven memory demand can stay elevated after this quarter.
Tomorrow should give us a much clearer answer.
$MU
#EarningsSeason #Micron #MU #Semiconductors
242
·
--
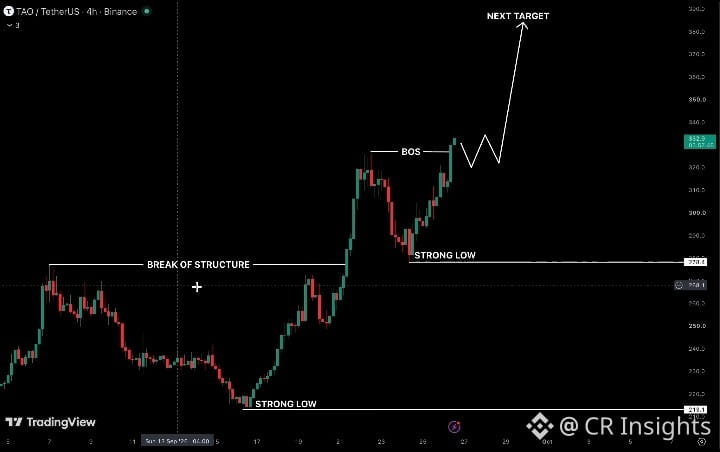
$TAO — $300 IS THE TRADE LEVEL
TAO ran from $222 to $341 in ten days. Now it’s pulled back into $300–$316.
That’s where I’d judge this move.
If buyers defend this area and price gets back above $341, the breakout still has room toward $428. But if $300 gives way, I’m not treating the dip as a buy-the-dip setup anymore. $280–$270 becomes the next area I’d expect price to test.
After a $120 move, buying just because it’s pulling back is not the trade. The reaction around $300–$316 is.
$TAO #TAO
$TAO — $300 IS THE TRADE LEVEL
TAO ran from $222 to $341 in ten days. Now it’s pulled back into $300–$316.
That’s where I’d judge this move.
If buyers defend this area and price gets back above $341, the breakout still has room toward $428. But if $300 gives way, I’m not treating the dip as a buy-the-dip setup anymore. $280–$270 becomes the next area I’d expect price to test.
After a $120 move, buying just because it’s pulling back is not the trade. The reaction around $300–$316 is.
$TAO #TAO
TAO ran from $222 to $341 in ten days. Now it’s pulled back into $300–$316.
That’s where I’d judge this move.
If buyers defend this area and price gets back above $341, the breakout still has room toward $428. But if $300 gives way, I’m not treating the dip as a buy-the-dip setup anymore. $280–$270 becomes the next area I’d expect price to test.
After a $120 move, buying just because it’s pulling back is not the trade. The reaction around $300–$316 is.
$TAO #TAO
428
·
--
XRP — WATCHING THE LOWER TRENDLINE
On the monthly chart, the rising trendline comes in around $0.80–$0.60. If XRP gets a proper pullback into that area, that’s where I’d be paying attention.
Not because $0.80 or $0.60 is guaranteed to be the bottom. The reaction there matters more.
If that trendline holds and XRP starts building back up, $3.20–$3.50 is the big area I’d want to see again
So I’m not chasing the move at $1.50. I’d rather see what XRP does at the long-term trendline first.
If it breaks, this whole idea changes.
That's just what I'm seeing on the monthly chart right now.$XRP
XRP — WATCHING THE LOWER TRENDLINE
On the monthly chart, the rising trendline comes in around $0.80–$0.60. If XRP gets a proper pullback into that area, that’s where I’d be paying attention.
Not because $0.80 or $0.60 is guaranteed to be the bottom. The reaction there matters more.
If that trendline holds and XRP starts building back up, $3.20–$3.50 is the big area I’d want to see again
So I’m not chasing the move at $1.50. I’d rather see what XRP does at the long-term trendline first.
If it breaks, this whole idea changes.
That's just what I'm seeing on the monthly chart right now.$XRP
On the monthly chart, the rising trendline comes in around $0.80–$0.60. If XRP gets a proper pullback into that area, that’s where I’d be paying attention.
Not because $0.80 or $0.60 is guaranteed to be the bottom. The reaction there matters more.
If that trendline holds and XRP starts building back up, $3.20–$3.50 is the big area I’d want to see again
So I’m not chasing the move at $1.50. I’d rather see what XRP does at the long-term trendline first.
If it breaks, this whole idea changes.
That's just what I'm seeing on the monthly chart right now.$XRP
6
1.6k
·
--
Partly True
HAEDAL JUST HIT $1M — BUT LOOK WHERE THE MONEY GOES
Haedal’s Lending Vault crossed $1M in liquidity within two days.
What caught my attention is that Haedal isn't building another isolated lending pool.
The vault takes deposits and automatically allocates them across existing Sui lending markets including $NAVI.US , Suilend, Scallop, AlphaFi and CurrentSUI.
So that $1M is telling us more than “Haedal attracted deposits.”
It shows there is demand for a simpler way to access lending opportunities across Sui without manually managing different markets.
Haedal has also kept increasing the vault caps as liquidity came in, with both SUI and USDC now reaching 700K capacity.
That makes the next thing worth watching pretty simple:
Where does the liquidity actually end up?
If one or two markets start taking a much larger share, that could reveal where lending demand or better opportunities are concentrating across Sui.
The $1M is the headline.
The allocation is the part I'd watch.
$HAEDAL $SUI #Haedal @HaedalProtocol
NFA
What matters more for Haedal from here?
HAEDAL JUST HIT $1M — BUT LOOK WHERE THE MONEY GOES
Haedal’s Lending Vault crossed $1M in liquidity within two days.
What caught my attention is that Haedal isn't building another isolated lending pool.
The vault takes deposits and automatically allocates them across existing Sui lending markets including $NAVI.US , Suilend, Scallop, AlphaFi and CurrentSUI.
So that $1M is telling us more than “Haedal attracted deposits.”
It shows there is demand for a simpler way to access lending opportunities across Sui without manually managing different markets.
Haedal has also kept increasing the vault caps as liquidity came in, with both SUI and USDC now reaching 700K capacity.
That makes the next thing worth watching pretty simple:
Where does the liquidity actually end up?
If one or two markets start taking a much larger share, that could reveal where lending demand or better opportunities are concentrating across Sui.
The $1M is the headline.
The allocation is the part I'd watch.
$HAEDAL $SUI #Haedal @Haedal Protocol
NFA
What matters more for Haedal from here?
Haedal’s Lending Vault crossed $1M in liquidity within two days.
What caught my attention is that Haedal isn't building another isolated lending pool.
The vault takes deposits and automatically allocates them across existing Sui lending markets including $NAVI.US , Suilend, Scallop, AlphaFi and CurrentSUI.
So that $1M is telling us more than “Haedal attracted deposits.”
It shows there is demand for a simpler way to access lending opportunities across Sui without manually managing different markets.
Haedal has also kept increasing the vault caps as liquidity came in, with both SUI and USDC now reaching 700K capacity.
That makes the next thing worth watching pretty simple:
Where does the liquidity actually end up?
If one or two markets start taking a much larger share, that could reveal where lending demand or better opportunities are concentrating across Sui.
The $1M is the headline.
The allocation is the part I'd watch.
$HAEDAL $SUI #Haedal @Haedal Protocol
NFA
What matters more for Haedal from here?
More TVL
86%
Where liquidity goes
14%
7 votes • Voting closed
2
3
2k
·
--
BLACKROCK’S $316M BTC BUY ISN’T THE ONDO SIGNAL
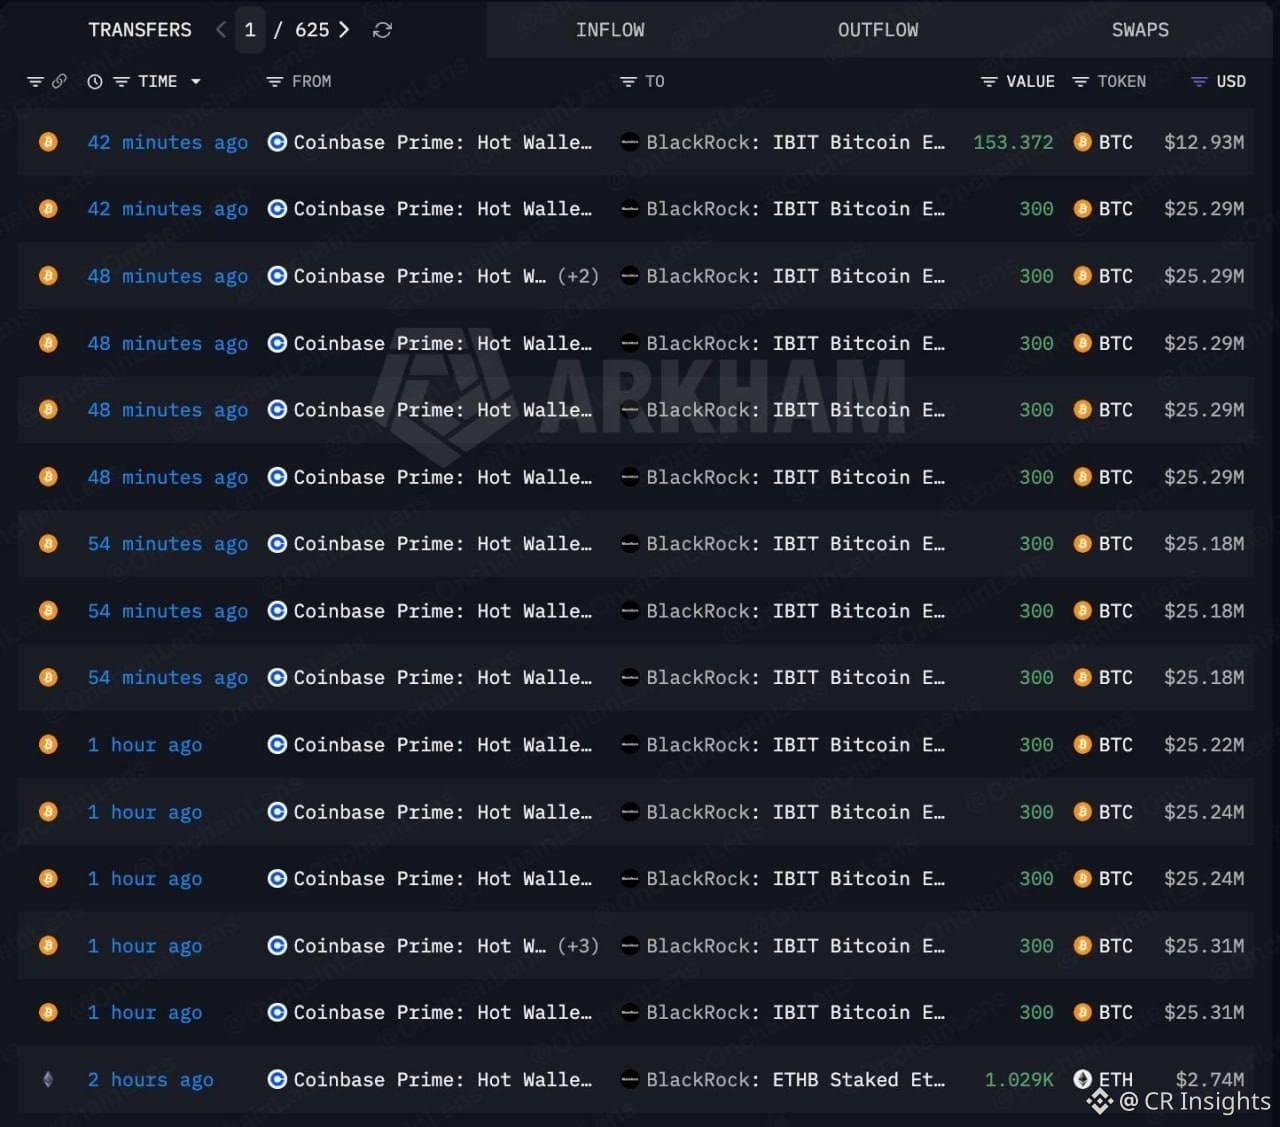
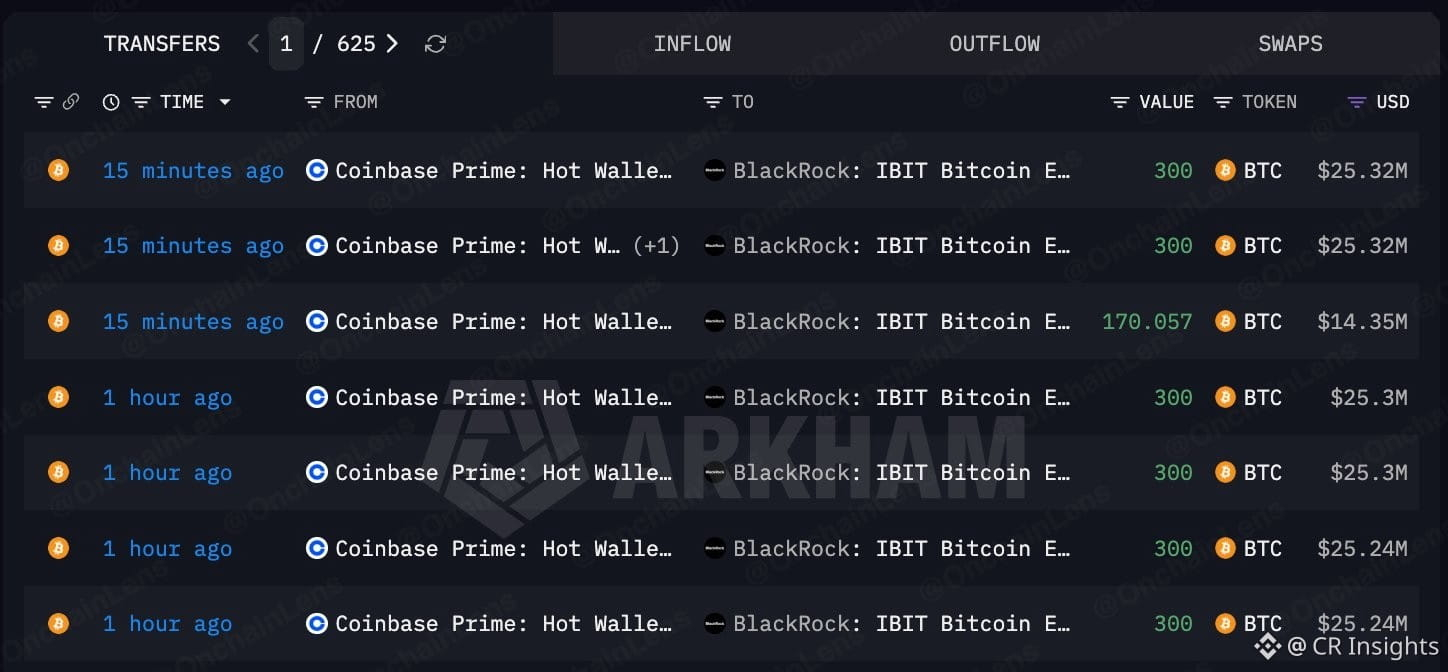
BlackRock just moved another 3,750 BTC — roughly $316M — into IBIT from Coinbase Prime.
At almost the same time, Ondo announced three new onchain portfolio products built around strategies developed by BlackRock.
Easy headline: BlackRock is bullish on crypto, so ONDO should benefit.
The more useful distinction is that the $316M BTC flow and the ONDO development are completely different mechanisms.
IBIT buying creates BTC exposure.
The Ondo launch creates tokenized portfolio exposure built around BlackRock-developed strategies.
For ONDO, the second one is the signal worth tracking.
Because the real test isn't whether BlackRock buys more BTC.
It's whether these institutional strategies actually attract onchain capital, secondary liquidity and DeFi usage.
If they do, ONDO is no longer just benefiting from the “tokenization” narrative — its infrastructure is being used to package institutional allocation decisions into tradable onchain products.
That gives the current ONDO move something much more useful to watch than the BlackRock headline:
Does the new product create measurable onchain demand, or does the market price the announcement before the usage arrives?
$ONDO $BTC
BLACKROCK’S $316M BTC BUY ISN’T THE ONDO SIGNAL
BlackRock just moved another 3,750 BTC — roughly $316M — into IBIT from Coinbase Prime.
At almost the same time, Ondo announced three new onchain portfolio products built around strategies developed by BlackRock.
Easy headline: BlackRock is bullish on crypto, so ONDO should benefit.
The more useful distinction is that the $316M BTC flow and the ONDO development are completely different mechanisms.
IBIT buying creates BTC exposure.
The Ondo launch creates tokenized portfolio exposure built around BlackRock-developed strategies.
For ONDO, the second one is the signal worth tracking.
Because the real test isn't whether BlackRock buys more BTC.
It's whether these institutional strategies actually attract onchain capital, secondary liquidity and DeFi usage.
If they do, ONDO is no longer just benefiting from the “tokenization” narrative — its infrastructure is being used to package institutional allocation decisions into tradable onchain products.
That gives the current ONDO move something much more useful to watch than the BlackRock headline:
Does the new product create measurable onchain demand, or does the market price the announcement before the usage arrives?
$ONDO $BTC
BlackRock just moved another 3,750 BTC — roughly $316M — into IBIT from Coinbase Prime.
At almost the same time, Ondo announced three new onchain portfolio products built around strategies developed by BlackRock.
Easy headline: BlackRock is bullish on crypto, so ONDO should benefit.
The more useful distinction is that the $316M BTC flow and the ONDO development are completely different mechanisms.
IBIT buying creates BTC exposure.
The Ondo launch creates tokenized portfolio exposure built around BlackRock-developed strategies.
For ONDO, the second one is the signal worth tracking.
Because the real test isn't whether BlackRock buys more BTC.
It's whether these institutional strategies actually attract onchain capital, secondary liquidity and DeFi usage.
If they do, ONDO is no longer just benefiting from the “tokenization” narrative — its infrastructure is being used to package institutional allocation decisions into tradable onchain products.
That gives the current ONDO move something much more useful to watch than the BlackRock headline:
Does the new product create measurable onchain demand, or does the market price the announcement before the usage arrives?
$ONDO $BTC

1
421
·
--
AAVE IS LENDING AGAINST COLLATERAL IT NEVER HOLDS
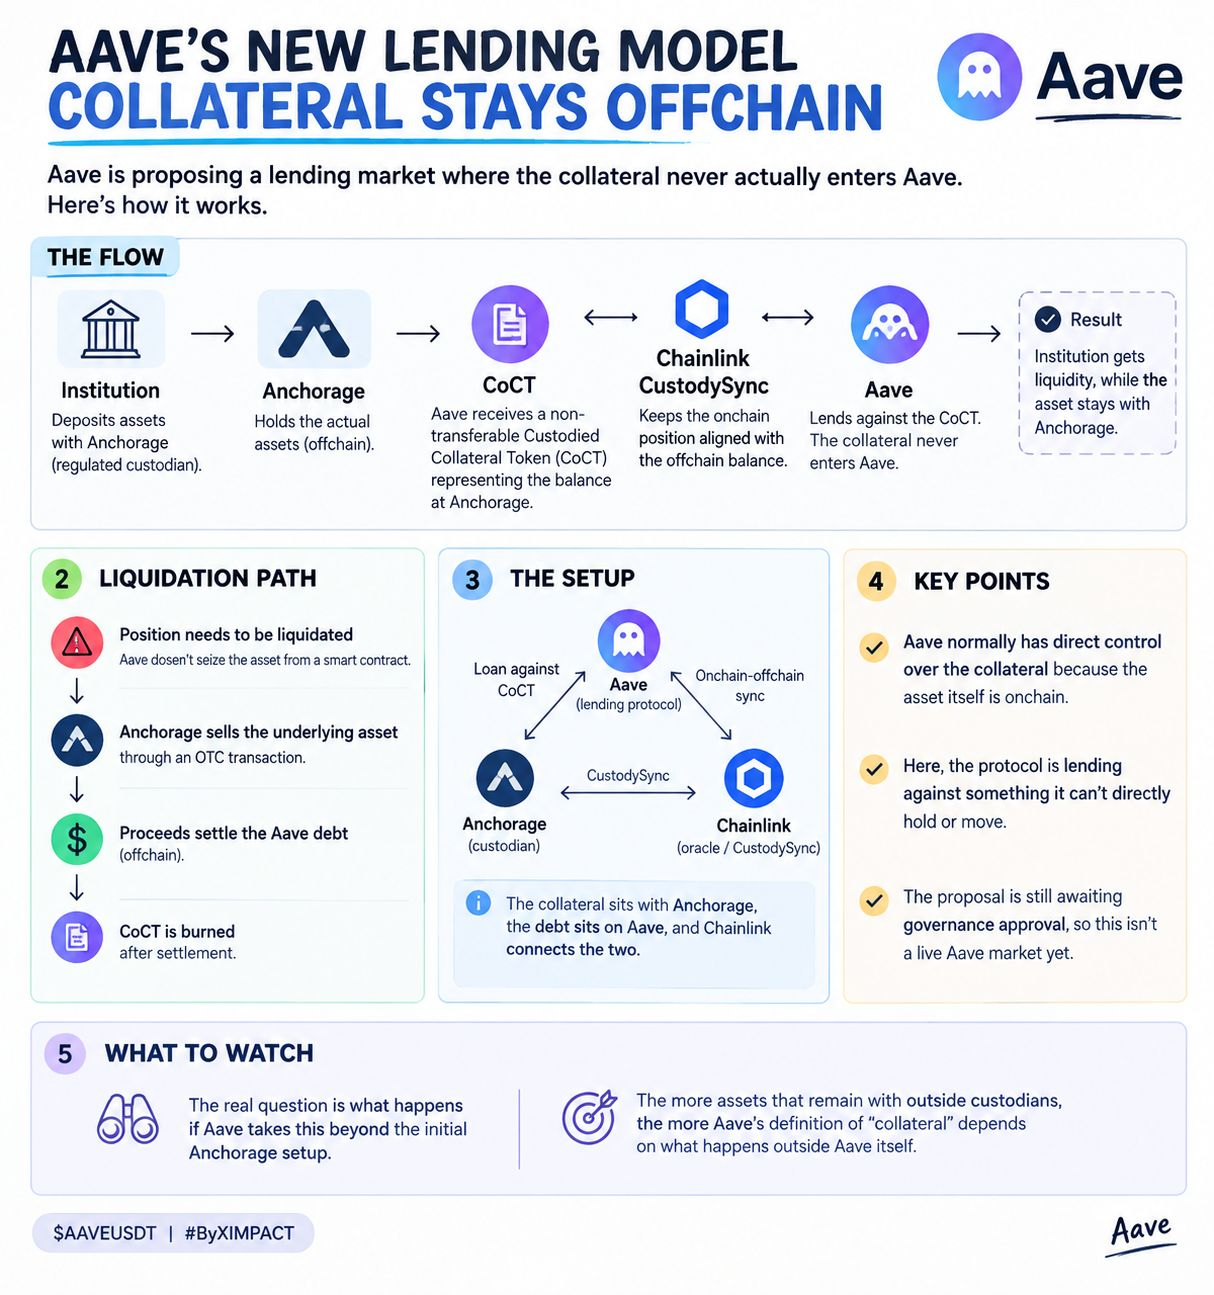
Aave is proposing a lending market where the collateral never actually enters Aave.
The first version would let institutions keep their assets with Anchorage while borrowing through Aave. Instead of the asset itself, Aave receives a non-transferable Custodied Collateral Token representing the balance held with the custodian, with Chainlink’s CustodySync keeping the onchain position aligned with the offchain balance.
The liquidation path is what caught my attention. If the position needs to be liquidated, Aave doesn't seize the asset from a smart contract. Anchorage sells the underlying asset through an OTC transaction, the proceeds settle the Aave debt, and the CoCT is burned after settlement.
That creates a setup where the collateral sits with Anchorage, the debt sits on Aave, and Chainlink connects the two.
Aave normally has direct control over the collateral because the asset itself is onchain. Here, the protocol is lending against something it can’t directly hold or move.
The proposal is still awaiting governance approval, so this isn't a live Aave market yet. But the architecture is notable: regulated custody no longer has to be separated from onchain credit.
The part worth watching is what happens if Aave takes this beyond the initial Anchorage setup. The more assets that remain with outside custodians, the more Aave's definition of “collateral” depends on what happens outside Aave itself.
$AAVE
{future}(AAVEUSDT)
$ETH
AAVE IS LENDING AGAINST COLLATERAL IT NEVER HOLDS
Aave is proposing a lending market where the collateral never actually enters Aave.
The first version would let institutions keep their assets with Anchorage while borrowing through Aave. Instead of the asset itself, Aave receives a non-transferable Custodied Collateral Token representing the balance held with the custodian, with Chainlink’s CustodySync keeping the onchain position aligned with the offchain balance.
The liquidation path is what caught my attention. If the position needs to be liquidated, Aave doesn't seize the asset from a smart contract. Anchorage sells the underlying asset through an OTC transaction, the proceeds settle the Aave debt, and the CoCT is burned after settlement.
That creates a setup where the collateral sits with Anchorage, the debt sits on Aave, and Chainlink connects the two.
Aave normally has direct control over the collateral because the asset itself is onchain. Here, the protocol is lending against something it can’t directly hold or move.
The proposal is still awaiting governance approval, so this isn't a live Aave market yet. But the architecture is notable: regulated custody no longer has to be separated from onchain credit.
The part worth watching is what happens if Aave takes this beyond the initial Anchorage setup. The more assets that remain with outside custodians, the more Aave's definition of “collateral” depends on what happens outside Aave itself.
$AAVE
$ETH
Aave is proposing a lending market where the collateral never actually enters Aave.
The first version would let institutions keep their assets with Anchorage while borrowing through Aave. Instead of the asset itself, Aave receives a non-transferable Custodied Collateral Token representing the balance held with the custodian, with Chainlink’s CustodySync keeping the onchain position aligned with the offchain balance.
The liquidation path is what caught my attention. If the position needs to be liquidated, Aave doesn't seize the asset from a smart contract. Anchorage sells the underlying asset through an OTC transaction, the proceeds settle the Aave debt, and the CoCT is burned after settlement.
That creates a setup where the collateral sits with Anchorage, the debt sits on Aave, and Chainlink connects the two.
Aave normally has direct control over the collateral because the asset itself is onchain. Here, the protocol is lending against something it can’t directly hold or move.
The proposal is still awaiting governance approval, so this isn't a live Aave market yet. But the architecture is notable: regulated custody no longer has to be separated from onchain credit.
The part worth watching is what happens if Aave takes this beyond the initial Anchorage setup. The more assets that remain with outside custodians, the more Aave's definition of “collateral” depends on what happens outside Aave itself.
$AAVE
$ETH
275
·
--
Article
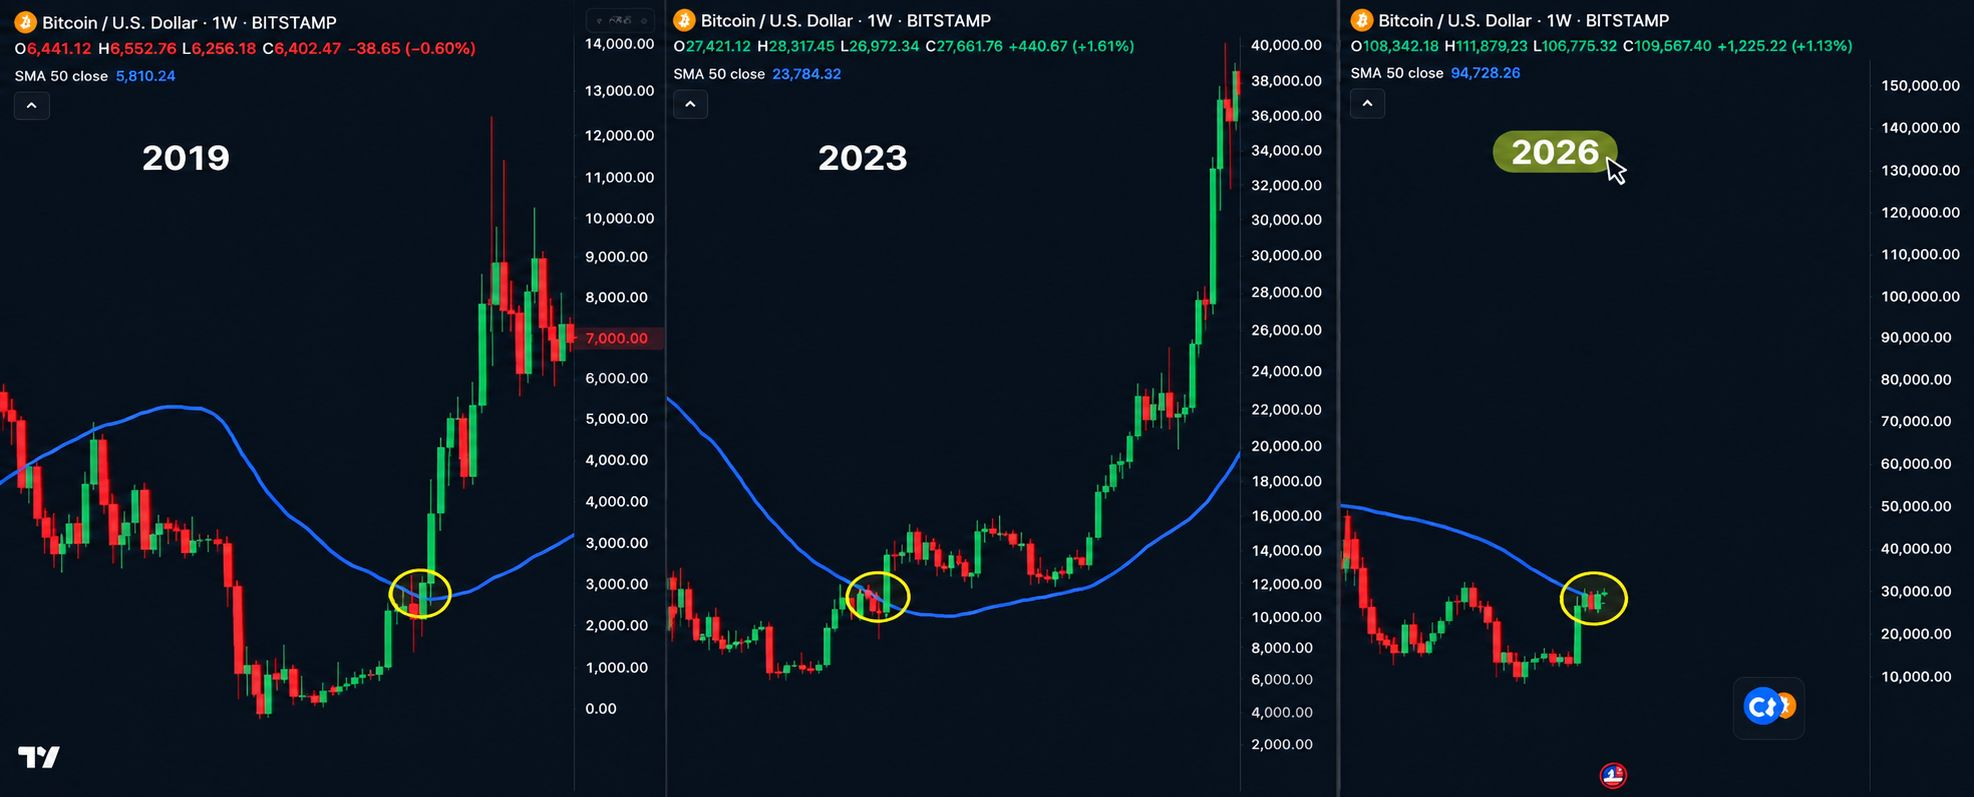
🔥 IS THIS WHERE BITCOIN’S NEXT BULL RUN BEGINS?Look closely at this chart.
The interesting part isn't simply that Bitcoin crossed the 50-week moving average. It's that we're now seeing a structure that looks remarkably similar to the areas highlighted in 2019 and 2023 — periods when BTC moved back above the 50W MA after a major drawdown and eventually entered a much stronger expansion phase.
And 2026 is now sitting at a very similar decision point.
$BTC has recovered from this year's deep correction, reclaimed the 50W MA, and is now trading around $85K. The 50W MA is around the high-$78Ks, meaning price isn't just touching the line anymore — it has created some distance above it.
But there is one detail on your chart that I think matters even more.
In 2019 and 2023, the moving average eventually turned upward as price established itself above it. In 2026, we're still early in that process.
That's why I wouldn't call this a confirmed bull market from one crossover.
For my swing view, this is what I want to see next:
BTC holds above the 50W MA → the MA starts flattening/turning higher → price continues making higher weekly structure.
If that sequence develops, the historical comparison becomes much more meaningful. And if BTC keeps building higher, the previous ~$126K ATH becomes the obvious major market test rather than some arbitrary target.
If BTC falls back below the 50W MA and the reclaim fails, I'll treat the 2019/2023 comparison as a pattern that didn't confirm, not as a reason to stay bullish.
That's the part of this chart I find most interesting:
2019 had the reclaim.
2023 had the reclaim.
2026 now has the reclaim.
The difference is that 2026 still has to prove the next part of the pattern.
And if it does?
We may not be looking at a random BTC recovery anymore. We may be looking at the early structure of the next major cycle.
🔥 IS THIS WHERE BITCOIN’S NEXT BULL RUN BEGINS?
Look closely at this chart.
The interesting part isn't simply that Bitcoin crossed the 50-week moving average. It's that we're now seeing a structure that looks remarkably similar to the areas highlighted in 2019 and 2023 — periods when BTC moved back above the 50W MA after a major drawdown and eventually entered a much stronger expansion phase.
And 2026 is now sitting at a very similar decision point.
$BTC has recovered from this year's deep correction, reclaimed the 50W MA, and is now trading around $85K. The 50W MA is around the high-$78Ks, meaning price isn't just touching the line anymore — it has created some distance above it.
But there is one detail on your chart that I think matters even more.
In 2019 and 2023, the moving average eventually turned upward as price established itself above it. In 2026, we're still early in that process.
That's why I wouldn't call this a confirmed bull market from one crossover.
For my swing view, this is what I want to see next:
BTC holds above the 50W MA → the MA starts flattening/turning higher → price continues making higher weekly structure.
If that sequence develops, the historical comparison becomes much more meaningful. And if BTC keeps building higher, the previous ~$126K ATH becomes the obvious major market test rather than some arbitrary target.
If BTC falls back below the 50W MA and the reclaim fails, I'll treat the 2019/2023 comparison as a pattern that didn't confirm, not as a reason to stay bullish.
That's the part of this chart I find most interesting:
2019 had the reclaim.
2023 had the reclaim.
2026 now has the reclaim.
The difference is that 2026 still has to prove the next part of the pattern.
And if it does?
We may not be looking at a random BTC recovery anymore. We may be looking at the early structure of the next major cycle.
The interesting part isn't simply that Bitcoin crossed the 50-week moving average. It's that we're now seeing a structure that looks remarkably similar to the areas highlighted in 2019 and 2023 — periods when BTC moved back above the 50W MA after a major drawdown and eventually entered a much stronger expansion phase.
And 2026 is now sitting at a very similar decision point.
$BTC has recovered from this year's deep correction, reclaimed the 50W MA, and is now trading around $85K. The 50W MA is around the high-$78Ks, meaning price isn't just touching the line anymore — it has created some distance above it.
But there is one detail on your chart that I think matters even more.
In 2019 and 2023, the moving average eventually turned upward as price established itself above it. In 2026, we're still early in that process.
That's why I wouldn't call this a confirmed bull market from one crossover.
For my swing view, this is what I want to see next:
BTC holds above the 50W MA → the MA starts flattening/turning higher → price continues making higher weekly structure.
If that sequence develops, the historical comparison becomes much more meaningful. And if BTC keeps building higher, the previous ~$126K ATH becomes the obvious major market test rather than some arbitrary target.
If BTC falls back below the 50W MA and the reclaim fails, I'll treat the 2019/2023 comparison as a pattern that didn't confirm, not as a reason to stay bullish.
That's the part of this chart I find most interesting:
2019 had the reclaim.
2023 had the reclaim.
2026 now has the reclaim.
The difference is that 2026 still has to prove the next part of the pattern.
And if it does?
We may not be looking at a random BTC recovery anymore. We may be looking at the early structure of the next major cycle.
1
1.1k
·
--

Article
🔥 3 COINS I’M RESEARCHING FOR 2027Not because they are cheap.
The reason these three caught my attention is that something is actually changing underneath the token.
$SUI
SUI is a Layer-1 built around fast transactions, DeFi, stablecoins and consumer apps.
What makes it interesting now is the stablecoin side. Sui is already reporting around $449M in stablecoin float, and stablecoin yield is being used for daily SUI buybacks. Gasless stablecoin transfers are another piece that could make the network more useful for payments.
SUI is around $1 right now.
If stablecoin activity and network usage keep scaling, $4–$6 is the 2027 bull-case zone I’d be watching. That's not a prediction — SUI would need a much bigger ecosystem to justify it.
$HYPE
HYPE is the token behind Hyperliquid, which started with on-chain perpetuals but has been expanding into spot, lending, RWAs and other DeFi products.
The part I don't want to ignore is revenue.
Hyperliquid has already generated hundreds of millions in protocol revenue this year. If trading activity and users continue growing, HYPE has something many altcoins don't have: an ecosystem generating real economic activity around the token.
At roughly $94 today, $200–$300 becomes an interesting 2027 bull-case range.
But that thesis only works if revenue and usage keep growing.
$AAVE
AAVE is one of the biggest DeFi lending protocols.
The interesting change is where Aave is trying to take that lending market next. V4 is expanding, while institutional collateral and RWA credit are becoming part of the bigger strategy.
If more real-world assets and institutional credit move onchain, Aave could have a much larger market to serve than traditional DeFi lending alone.
AAVE is around $140 now.
For 2027, $300–$450 is the bull-case zone I'd keep on the chart if institutional/RWA lending turns into real volume.
Three different reasons:
SUI → stablecoin economy
HYPE → real protocol revenue
AAVE → institutional onchain credit
That's why these three are on my 2027 research list.
The targets are only interesting if the numbers underneath them grow.
#altcoins #SUİ
🔥 3 COINS I’M RESEARCHING FOR 2027
Not because they are cheap.
The reason these three caught my attention is that something is actually changing underneath the token.
$SUI
SUI is a Layer-1 built around fast transactions, DeFi, stablecoins and consumer apps.
What makes it interesting now is the stablecoin side. Sui is already reporting around $449M in stablecoin float, and stablecoin yield is being used for daily SUI buybacks. Gasless stablecoin transfers are another piece that could make the network more useful for payments.
SUI is around $1 right now.
If stablecoin activity and network usage keep scaling, $4–$6 is the 2027 bull-case zone I’d be watching. That's not a prediction — SUI would need a much bigger ecosystem to justify it.
$HYPE
HYPE is the token behind Hyperliquid, which started with on-chain perpetuals but has been expanding into spot, lending, RWAs and other DeFi products.
The part I don't want to ignore is revenue.
Hyperliquid has already generated hundreds of millions in protocol revenue this year. If trading activity and users continue growing, HYPE has something many altcoins don't have: an ecosystem generating real economic activity around the token.
At roughly $94 today, $200–$300 becomes an interesting 2027 bull-case range.
But that thesis only works if revenue and usage keep growing.
$AAVE
AAVE is one of the biggest DeFi lending protocols.
The interesting change is where Aave is trying to take that lending market next. V4 is expanding, while institutional collateral and RWA credit are becoming part of the bigger strategy.
If more real-world assets and institutional credit move onchain, Aave could have a much larger market to serve than traditional DeFi lending alone.
AAVE is around $140 now.
For 2027, $300–$450 is the bull-case zone I'd keep on the chart if institutional/RWA lending turns into real volume.
Three different reasons:
SUI → stablecoin economy
HYPE → real protocol revenue
AAVE → institutional onchain credit
That's why these three are on my 2027 research list.
The targets are only interesting if the numbers underneath them grow.
#altcoins #SUİ
The reason these three caught my attention is that something is actually changing underneath the token.
$SUI
SUI is a Layer-1 built around fast transactions, DeFi, stablecoins and consumer apps.
What makes it interesting now is the stablecoin side. Sui is already reporting around $449M in stablecoin float, and stablecoin yield is being used for daily SUI buybacks. Gasless stablecoin transfers are another piece that could make the network more useful for payments.
SUI is around $1 right now.
If stablecoin activity and network usage keep scaling, $4–$6 is the 2027 bull-case zone I’d be watching. That's not a prediction — SUI would need a much bigger ecosystem to justify it.
$HYPE
HYPE is the token behind Hyperliquid, which started with on-chain perpetuals but has been expanding into spot, lending, RWAs and other DeFi products.
The part I don't want to ignore is revenue.
Hyperliquid has already generated hundreds of millions in protocol revenue this year. If trading activity and users continue growing, HYPE has something many altcoins don't have: an ecosystem generating real economic activity around the token.
At roughly $94 today, $200–$300 becomes an interesting 2027 bull-case range.
But that thesis only works if revenue and usage keep growing.
$AAVE
AAVE is one of the biggest DeFi lending protocols.
The interesting change is where Aave is trying to take that lending market next. V4 is expanding, while institutional collateral and RWA credit are becoming part of the bigger strategy.
If more real-world assets and institutional credit move onchain, Aave could have a much larger market to serve than traditional DeFi lending alone.
AAVE is around $140 now.
For 2027, $300–$450 is the bull-case zone I'd keep on the chart if institutional/RWA lending turns into real volume.
Three different reasons:
SUI → stablecoin economy
HYPE → real protocol revenue
AAVE → institutional onchain credit
That's why these three are on my 2027 research list.
The targets are only interesting if the numbers underneath them grow.
#altcoins #SUİ
1.2k
·
--
🚨 STOP CALLING EVERY WICK A BREAKOUT
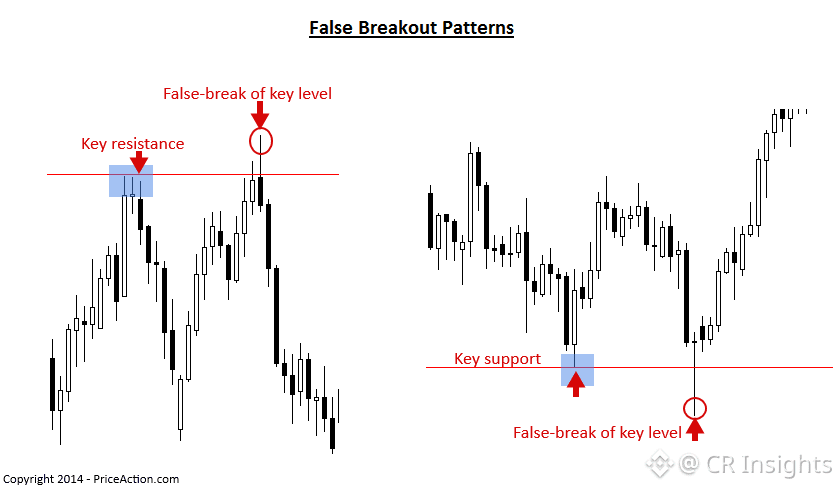
A resistance break by itself isn’t enough to enter a trade. One of the first things I check is what happens after price takes the level. If BTC pushes above a previous high but the candle closes back inside the range, that breakout has already lost some credibility.
The next candle matters even more. If sellers follow through and price starts moving back through the range, that move can be a liquidity sweep rather than genuine upside continuation. The same logic works below support: a wick through the low followed by a reclaim can trap shorts.
The simple rule I use is sweep → close → confirmation. Don’t buy just because the wick crossed resistance. First see whether price can actually stay above it.
That small change in how you read candles can keep you out of a lot of fake breakouts.
$BTC $PONS $NVDAB
🚨 STOP CALLING EVERY WICK A BREAKOUT
A resistance break by itself isn’t enough to enter a trade. One of the first things I check is what happens after price takes the level. If BTC pushes above a previous high but the candle closes back inside the range, that breakout has already lost some credibility.
The next candle matters even more. If sellers follow through and price starts moving back through the range, that move can be a liquidity sweep rather than genuine upside continuation. The same logic works below support: a wick through the low followed by a reclaim can trap shorts.
The simple rule I use is sweep → close → confirmation. Don’t buy just because the wick crossed resistance. First see whether price can actually stay above it.
That small change in how you read candles can keep you out of a lot of fake breakouts.
$BTC $PONS $NVDAB
A resistance break by itself isn’t enough to enter a trade. One of the first things I check is what happens after price takes the level. If BTC pushes above a previous high but the candle closes back inside the range, that breakout has already lost some credibility.
The next candle matters even more. If sellers follow through and price starts moving back through the range, that move can be a liquidity sweep rather than genuine upside continuation. The same logic works below support: a wick through the low followed by a reclaim can trap shorts.
The simple rule I use is sweep → close → confirmation. Don’t buy just because the wick crossed resistance. First see whether price can actually stay above it.
That small change in how you read candles can keep you out of a lot of fake breakouts.
$BTC $PONS $NVDAB
601
·
--
$HYPE IS BACK IN CRYPTO’S TOP 10
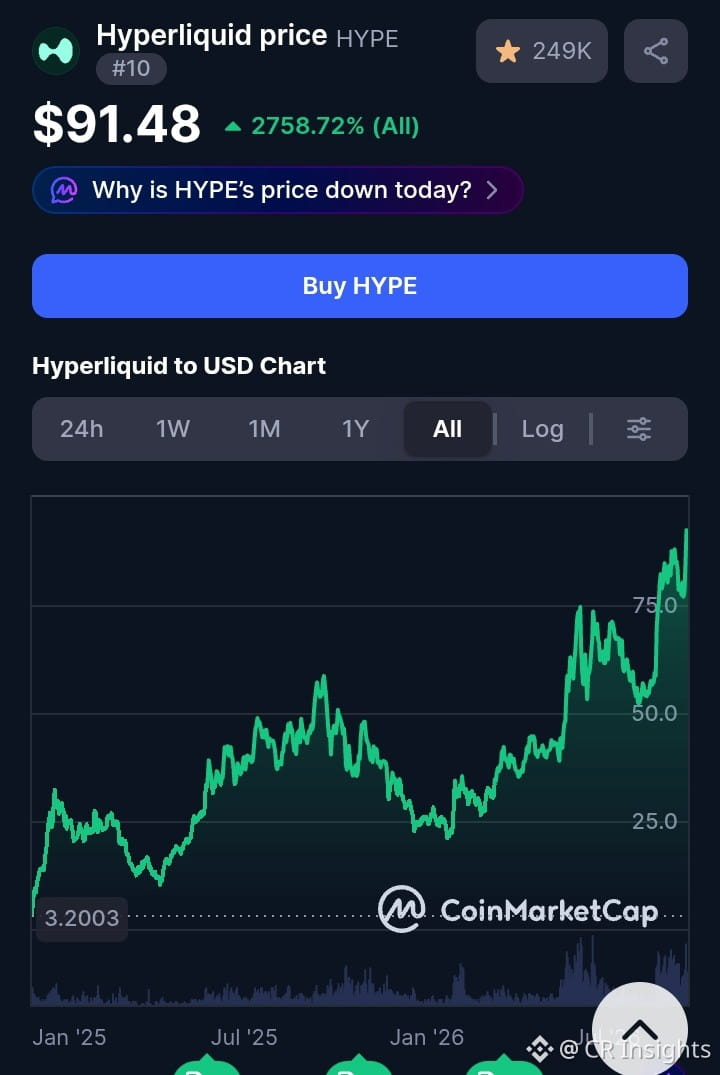
$HYPE just hit a new all-time high of $94.44, pushing its market cap above $22B.
That puts Hyperliquid at #10 in crypto by market cap, with more than $900M in 24H trading volume.
The interesting part is that HYPE is no longer a mid-cap token story. At this size, the growth of Hyperliquid’s trading activity and demand matters much more for the valuation
HYPE has officially entered the big league.
#HYPE #Hyperliquid #crypto
$HYPE IS BACK IN CRYPTO’S TOP 10
$HYPE just hit a new all-time high of $94.44, pushing its market cap above $22B.
That puts Hyperliquid at #10 in crypto by market cap, with more than $900M in 24H trading volume.
The interesting part is that HYPE is no longer a mid-cap token story. At this size, the growth of Hyperliquid’s trading activity and demand matters much more for the valuation
HYPE has officially entered the big league.
#HYPE #Hyperliquid #crypto
$HYPE just hit a new all-time high of $94.44, pushing its market cap above $22B.
That puts Hyperliquid at #10 in crypto by market cap, with more than $900M in 24H trading volume.
The interesting part is that HYPE is no longer a mid-cap token story. At this size, the growth of Hyperliquid’s trading activity and demand matters much more for the valuation
HYPE has officially entered the big league.
#HYPE #Hyperliquid #crypto
353
·
--
Verified
ROBINHOOD CHAIN’S FEES JUST COLLAPSED
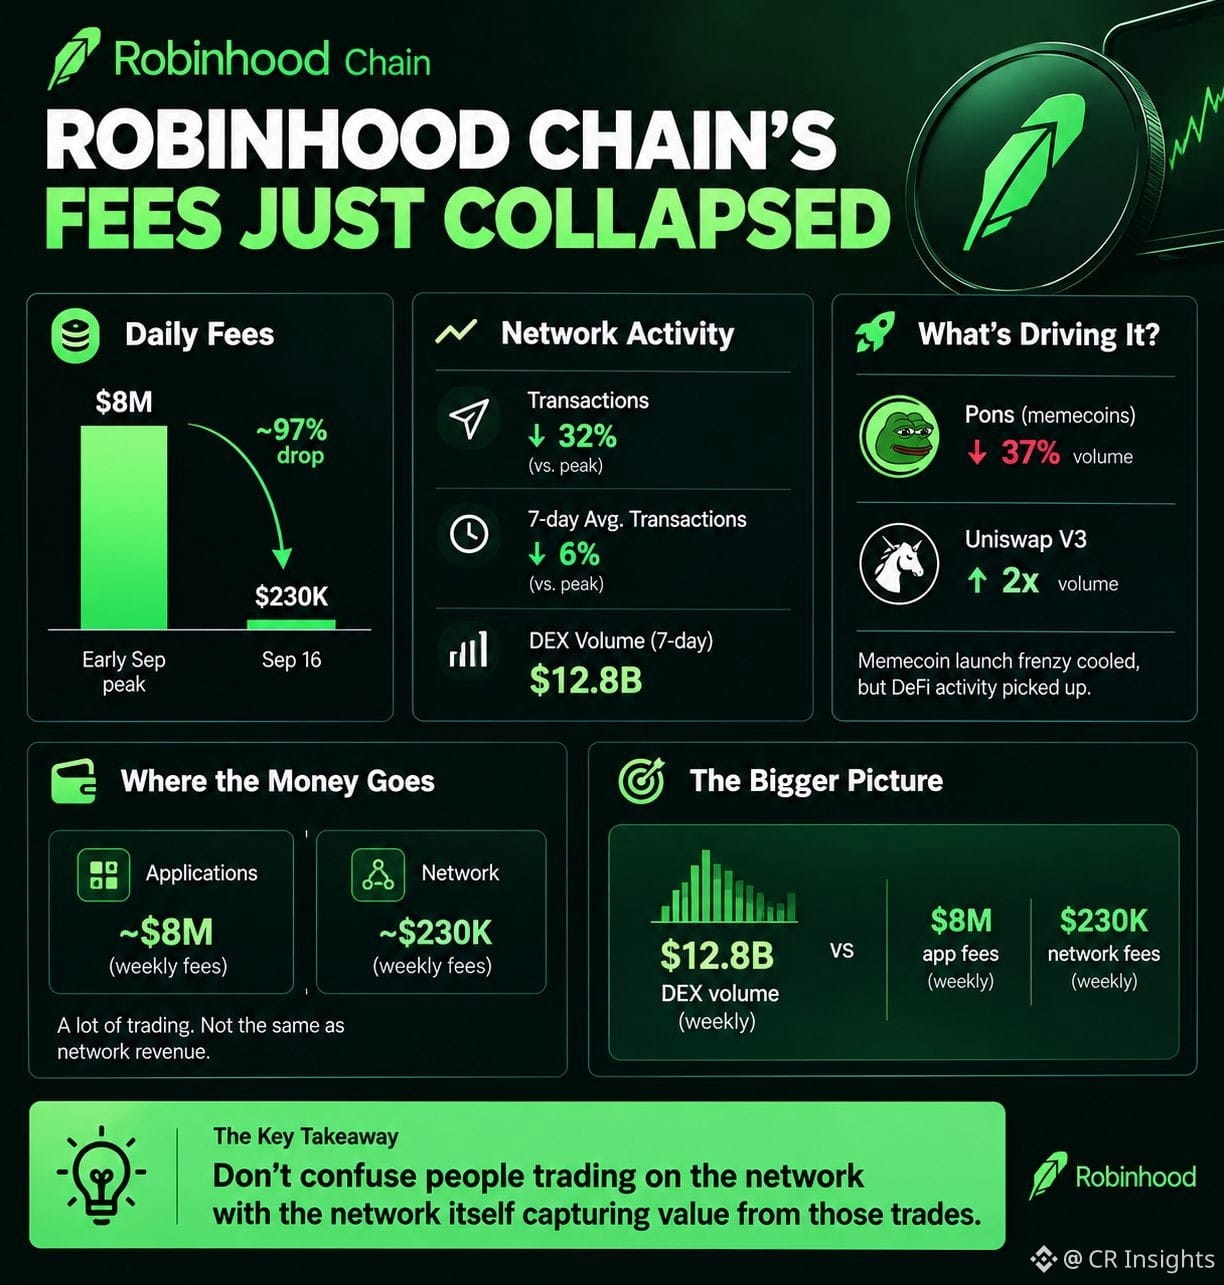
Robinhood Chain went from roughly $8M in daily fees during its early-September peak to about $230K on September 16. What caught my attention is that the activity didn't fall anywhere close to that. Transactions were down 32%, but the 7-day average was only 6% lower, while DEX volume actually reached around $12.8B for the week.
The reason seems to be the kind of activity happening on the chain. The memecoin launch frenzy cooled off, with $PONS volume falling 37%, while Uniswap V3 volume more than doubled. So the chain became dramatically cheaper without becoming dramatically quieter.
And this is the part I think is actually useful: $12.8B of weekly DEX volume sounds massive, but it doesn't automatically mean the chain is making massive money. The latest data had applications collecting around $8M in fees while the network itself collected only about $230K.
That’s a good reminder when looking at any new chain: **don’t confuse people trading on the network with the network itself capturing value from those trades.**
ROBINHOOD CHAIN’S FEES JUST COLLAPSED
Robinhood Chain went from roughly $8M in daily fees during its early-September peak to about $230K on September 16. What caught my attention is that the activity didn't fall anywhere close to that. Transactions were down 32%, but the 7-day average was only 6% lower, while DEX volume actually reached around $12.8B for the week.
The reason seems to be the kind of activity happening on the chain. The memecoin launch frenzy cooled off, with $PONS volume falling 37%, while Uniswap V3 volume more than doubled. So the chain became dramatically cheaper without becoming dramatically quieter.
And this is the part I think is actually useful: $12.8B of weekly DEX volume sounds massive, but it doesn't automatically mean the chain is making massive money. The latest data had applications collecting around $8M in fees while the network itself collected only about $230K.
That’s a good reminder when looking at any new chain: **don’t confuse people trading on the network with the network itself capturing value from those trades.**
Robinhood Chain went from roughly $8M in daily fees during its early-September peak to about $230K on September 16. What caught my attention is that the activity didn't fall anywhere close to that. Transactions were down 32%, but the 7-day average was only 6% lower, while DEX volume actually reached around $12.8B for the week.
The reason seems to be the kind of activity happening on the chain. The memecoin launch frenzy cooled off, with $PONS volume falling 37%, while Uniswap V3 volume more than doubled. So the chain became dramatically cheaper without becoming dramatically quieter.
And this is the part I think is actually useful: $12.8B of weekly DEX volume sounds massive, but it doesn't automatically mean the chain is making massive money. The latest data had applications collecting around $8M in fees while the network itself collected only about $230K.
That’s a good reminder when looking at any new chain: **don’t confuse people trading on the network with the network itself capturing value from those trades.**

567
·
--
ENA’S BUYBACK HAS A CATCH
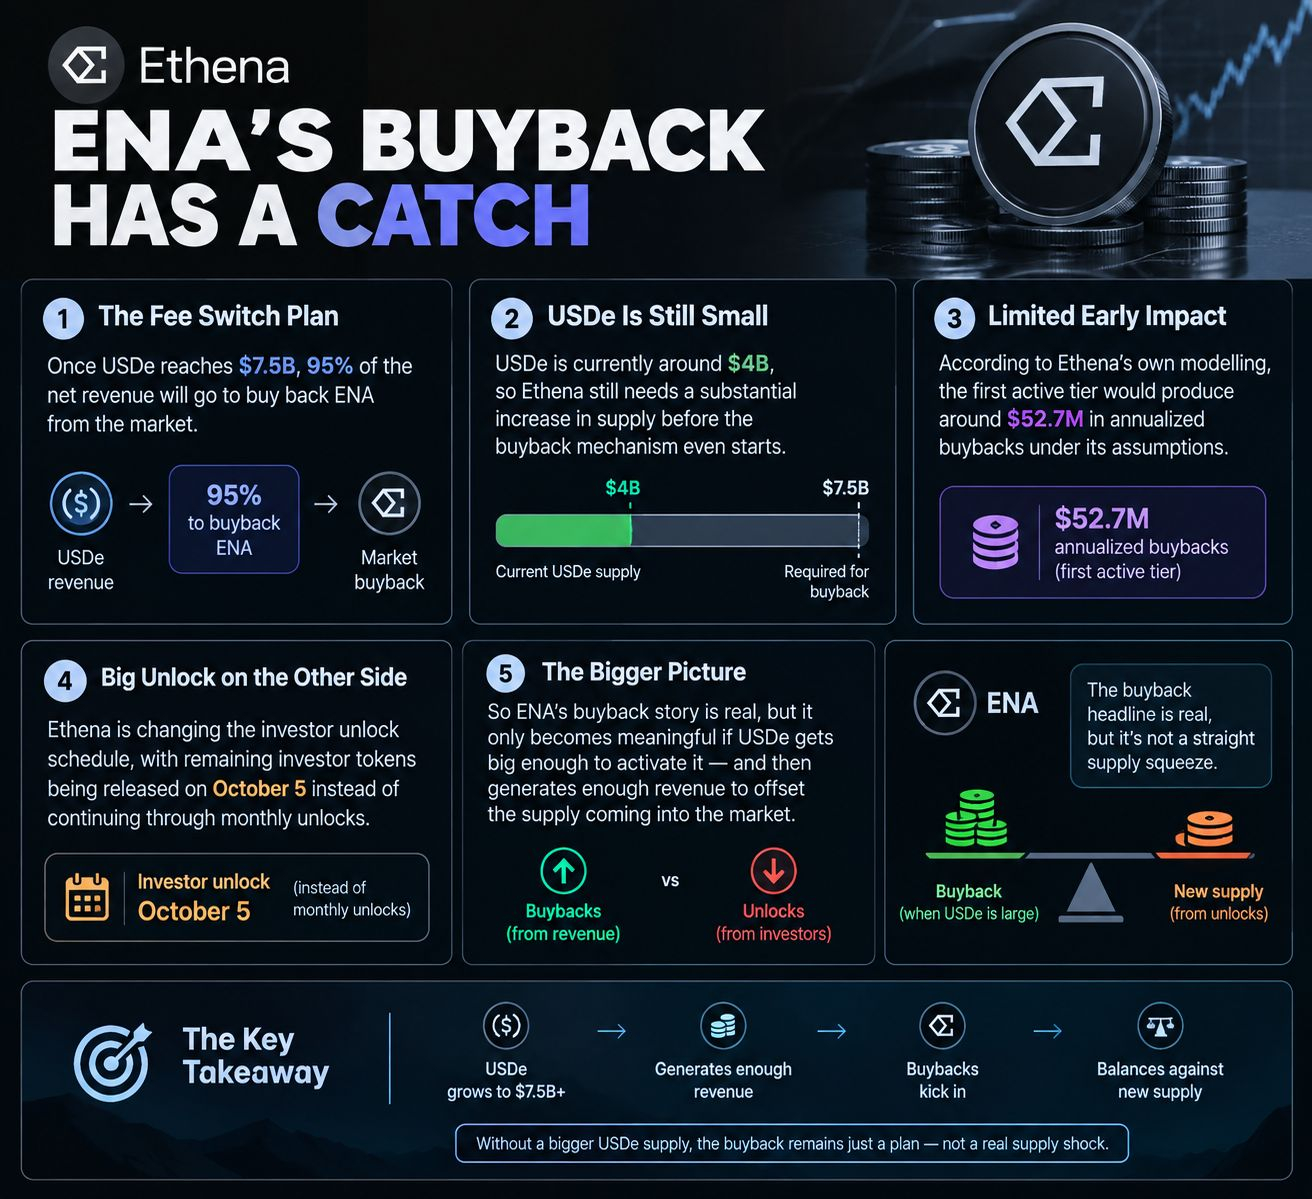
Ethena’s new fee switch sounds impressive: once USDe reaches $7.5B, 95% of the net revenue paid to the Foundation would go toward buying $ENA from the market. But there’s a detail that makes this less straightforward than the headline suggests.
USDe is currently around $4B, meaning Ethena still needs a substantial increase in supply before the buyback mechanism even starts. And according to Ethena’s own modelling, the first active tier would produce around $52.7M in annualized buybacks under its assumptions.
That sounds meaningful until you compare it with ENA’s supply situation. Ethena is also changing its investor unlock schedule, with remaining investor tokens being released on October 5 instead of continuing through monthly unlocks. So the market is getting a buyback story on one side and a large unlock event on the other.
That’s what makes ENA interesting to me right now. The buyback headline is real, but it only becomes meaningful if USDe gets big enough to activate it — and then generates enough revenue to offset the supply coming into the market.
ENA’S BUYBACK HAS A CATCH
Ethena’s new fee switch sounds impressive: once USDe reaches $7.5B, 95% of the net revenue paid to the Foundation would go toward buying $ENA from the market. But there’s a detail that makes this less straightforward than the headline suggests.
USDe is currently around $4B, meaning Ethena still needs a substantial increase in supply before the buyback mechanism even starts. And according to Ethena’s own modelling, the first active tier would produce around $52.7M in annualized buybacks under its assumptions.
That sounds meaningful until you compare it with ENA’s supply situation. Ethena is also changing its investor unlock schedule, with remaining investor tokens being released on October 5 instead of continuing through monthly unlocks. So the market is getting a buyback story on one side and a large unlock event on the other.
That’s what makes ENA interesting to me right now. The buyback headline is real, but it only becomes meaningful if USDe gets big enough to activate it — and then generates enough revenue to offset the supply coming into the market.
Ethena’s new fee switch sounds impressive: once USDe reaches $7.5B, 95% of the net revenue paid to the Foundation would go toward buying $ENA from the market. But there’s a detail that makes this less straightforward than the headline suggests.
USDe is currently around $4B, meaning Ethena still needs a substantial increase in supply before the buyback mechanism even starts. And according to Ethena’s own modelling, the first active tier would produce around $52.7M in annualized buybacks under its assumptions.
That sounds meaningful until you compare it with ENA’s supply situation. Ethena is also changing its investor unlock schedule, with remaining investor tokens being released on October 5 instead of continuing through monthly unlocks. So the market is getting a buyback story on one side and a large unlock event on the other.
That’s what makes ENA interesting to me right now. The buyback headline is real, but it only becomes meaningful if USDe gets big enough to activate it — and then generates enough revenue to offset the supply coming into the market.
391
·
--
INJ: IS THE $50 MOVE BACK ON?
I’m not looking at $INJ the same way anymore.
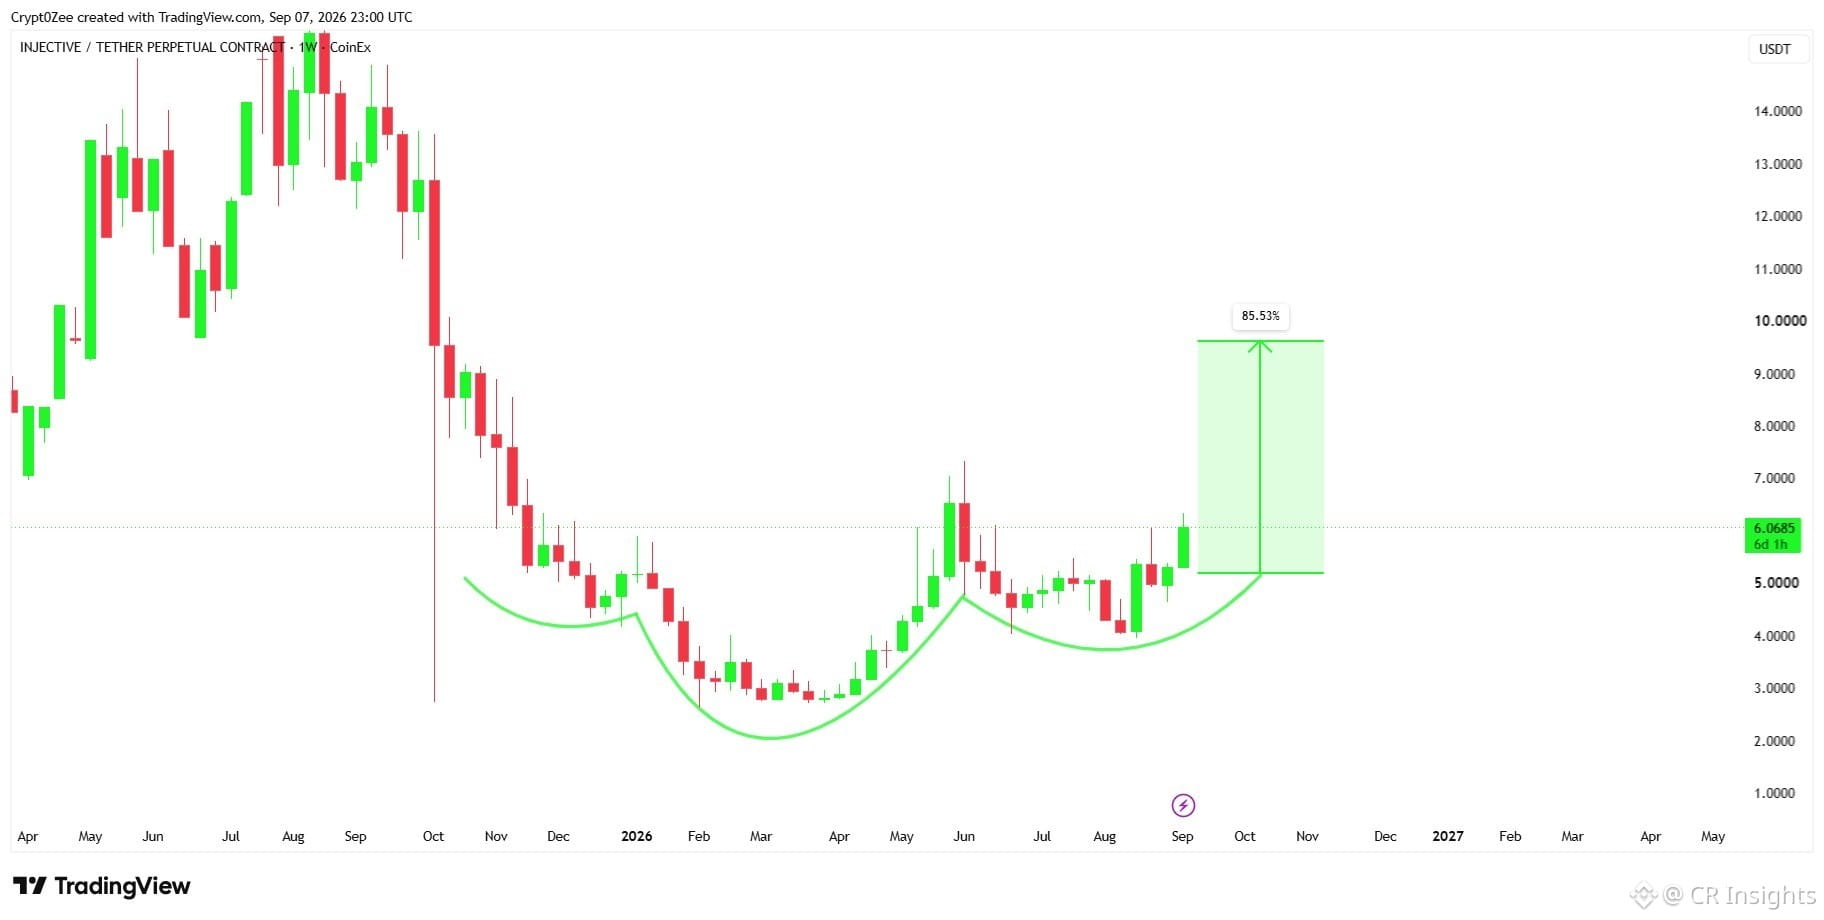
This weekly chart is showing something that’s hard to ignore.
Left shoulder → deep head around $3 → right shoulder → neckline around $5.
That’s an inverse head & shoulders — a bullish reversal structure that forms when sellers lose control at the lows and buyers gradually take over.
And now? INJ has broken above the neckline.
The interesting part is the measured move.
In a textbook inverse H&S, traders often measure the distance from the head to the neckline and project it upward from the breakout. That’s roughly where this chart gets the $9.5 area.
But I’m looking beyond $9.5. We’ve already seen INJ show serious momentum once:
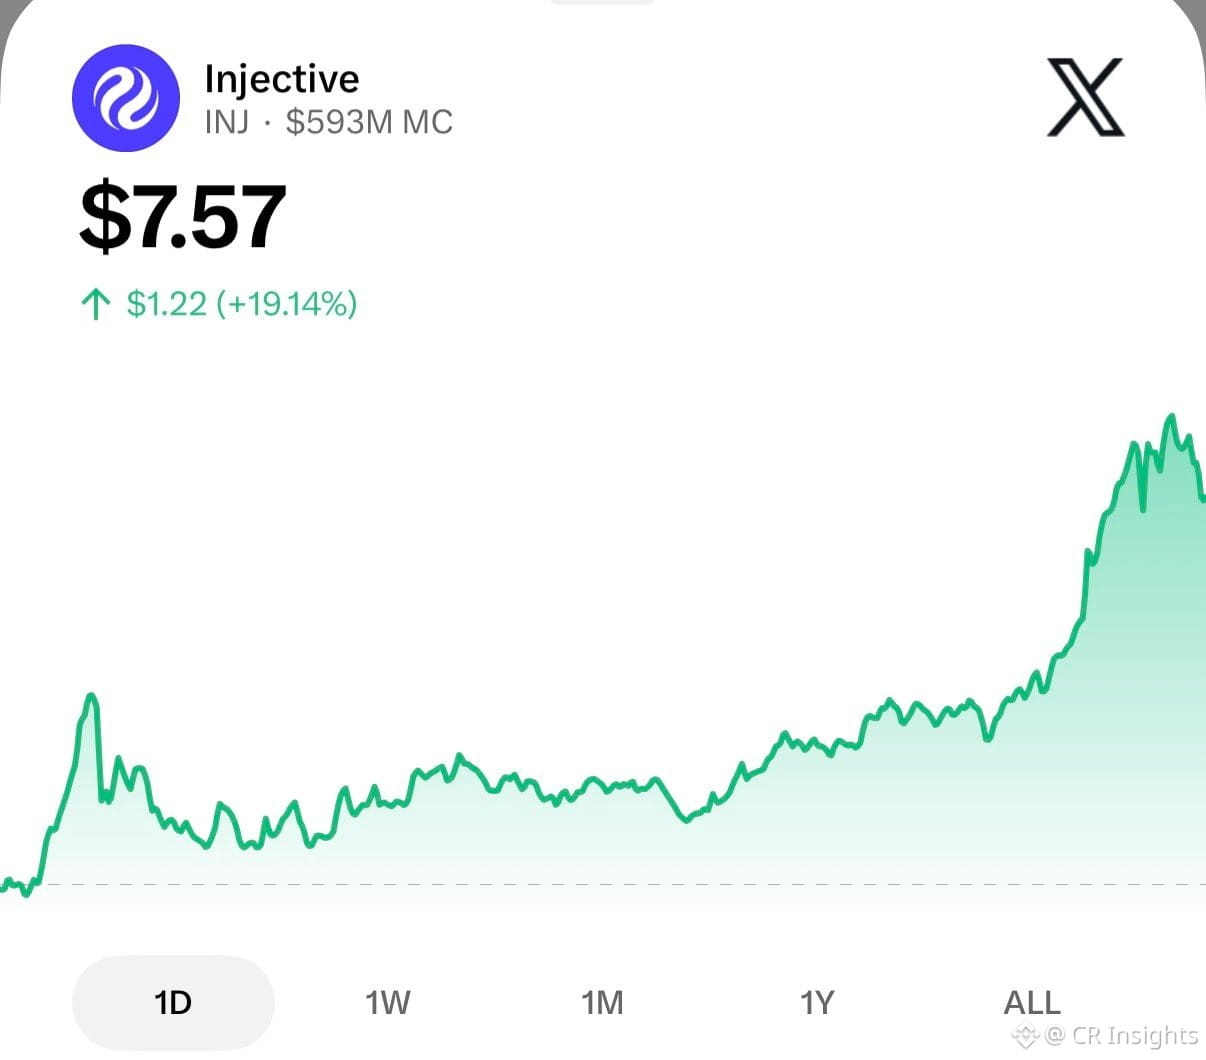
$3 → $7.
If this breakout develops into another sustained expansion, the conversation can quickly change from: “Can INJ reach $10?”
to “Can INJ make another run toward $20, $30… even $50?”
I’m not calling $50 guaranteed. From ~$6, that would require a huge expansion in price, liquidity and market value.
But look at what has changed:
Months of accumulation. Inverse H&S structure. Neckline breakout. Momentum returning.
The setup is there.
Now the important part is confirmation. If INJ can hold above the old neckline instead of immediately falling back into the pattern, the breakout becomes much more convincing.
$9.5 is the first major test.
$50 is the bigger question.
And honestly, this is where the $INJ chart gets interesting.
INJ: IS THE $50 MOVE BACK ON?
I’m not looking at $INJ the same way anymore.
This weekly chart is showing something that’s hard to ignore.
Left shoulder → deep head around $3 → right shoulder → neckline around $5.
That’s an inverse head & shoulders — a bullish reversal structure that forms when sellers lose control at the lows and buyers gradually take over.
And now? INJ has broken above the neckline.
The interesting part is the measured move.
In a textbook inverse H&S, traders often measure the distance from the head to the neckline and project it upward from the breakout. That’s roughly where this chart gets the $9.5 area.
But I’m looking beyond $9.5. We’ve already seen INJ show serious momentum once:
$3 → $7.
If this breakout develops into another sustained expansion, the conversation can quickly change from: “Can INJ reach $10?”
to “Can INJ make another run toward $20, $30… even $50?”
I’m not calling $50 guaranteed. From ~$6, that would require a huge expansion in price, liquidity and market value.
But look at what has changed:
Months of accumulation. Inverse H&S structure. Neckline breakout. Momentum returning.
The setup is there.
Now the important part is confirmation. If INJ can hold above the old neckline instead of immediately falling back into the pattern, the breakout becomes much more convincing.
$9.5 is the first major test.
$50 is the bigger question.
And honestly, this is where the $INJ chart gets interesting.
I’m not looking at $INJ the same way anymore.
This weekly chart is showing something that’s hard to ignore.
Left shoulder → deep head around $3 → right shoulder → neckline around $5.
That’s an inverse head & shoulders — a bullish reversal structure that forms when sellers lose control at the lows and buyers gradually take over.
And now? INJ has broken above the neckline.
The interesting part is the measured move.
In a textbook inverse H&S, traders often measure the distance from the head to the neckline and project it upward from the breakout. That’s roughly where this chart gets the $9.5 area.
But I’m looking beyond $9.5. We’ve already seen INJ show serious momentum once:
$3 → $7.
If this breakout develops into another sustained expansion, the conversation can quickly change from: “Can INJ reach $10?”
to “Can INJ make another run toward $20, $30… even $50?”
I’m not calling $50 guaranteed. From ~$6, that would require a huge expansion in price, liquidity and market value.
But look at what has changed:
Months of accumulation. Inverse H&S structure. Neckline breakout. Momentum returning.
The setup is there.
Now the important part is confirmation. If INJ can hold above the old neckline instead of immediately falling back into the pattern, the breakout becomes much more convincing.
$9.5 is the first major test.
$50 is the bigger question.
And honestly, this is where the $INJ chart gets interesting.
314
·
--
$SOL Is Building for Bigger Trades
{future}(SOLUSDT)
$SOL is getting an interesting upgrade stack.
Solana just increased the maximum transaction size from 1,232 to 4,096 bytes, giving developers much more room for complex operations in a single transaction. At the same time, slot times are being pushed toward 250ms.
That combination is more interesting to me than simply saying “Solana is faster.”
More transaction space + faster network updates could matter for complex DeFi trades, privacy transactions and trading infrastructure.
But there’s a catch: better infrastructure doesn't automatically mean more demand.
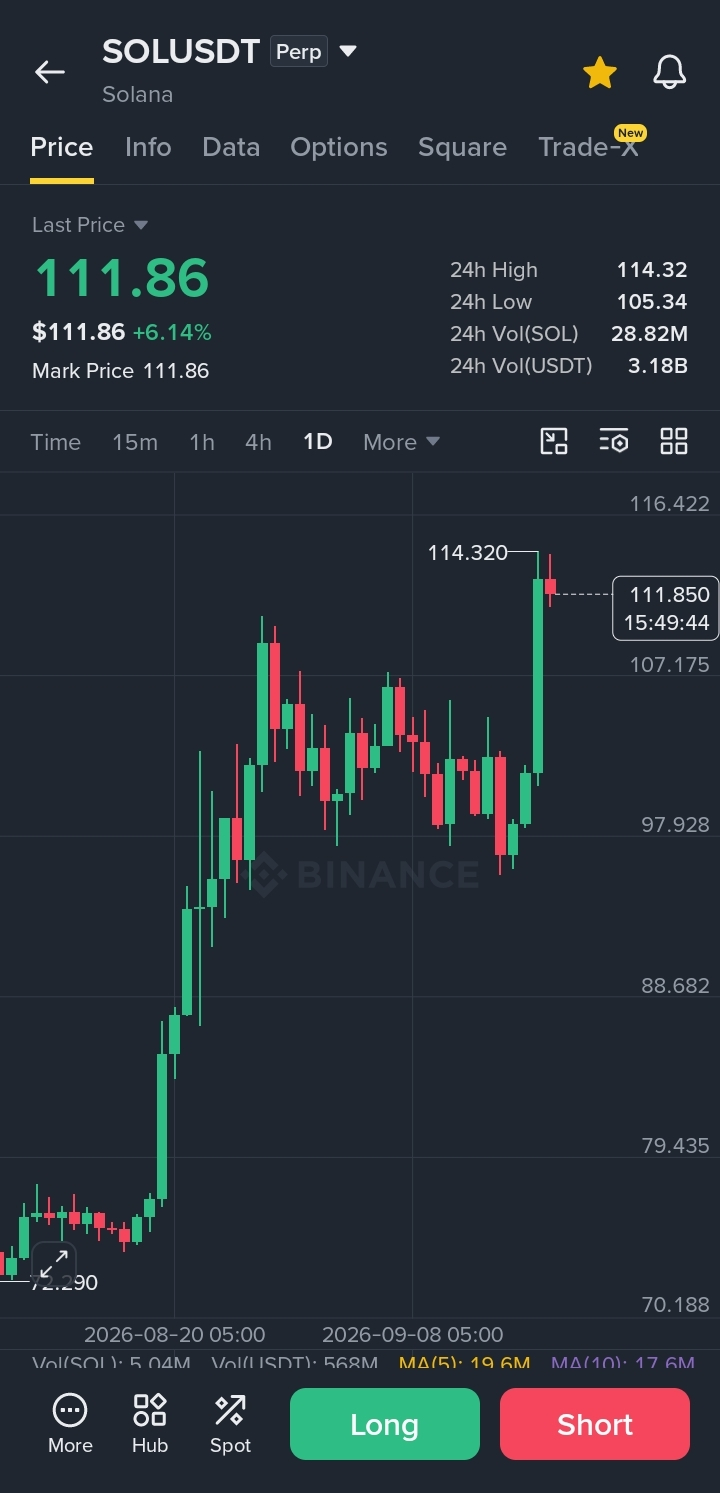
And price is giving us a level to watch. SOL recently pushed to $114.30 before pulling back. If buyers reclaim and hold that level, the upgrade story gets more interesting. If $110.60 breaks, I’d want to see how price reacts around $106.95 before assuming the momentum is still intact.
So I’m watching two things: does the ecosystem actually use the new capacity, and can SOL hold its breakout structure?
Solana just built more room. Now the ecosystem has to use it.
$SOL Is Building for Bigger Trades
$SOL is getting an interesting upgrade stack.
Solana just increased the maximum transaction size from 1,232 to 4,096 bytes, giving developers much more room for complex operations in a single transaction. At the same time, slot times are being pushed toward 250ms.
That combination is more interesting to me than simply saying “Solana is faster.”
More transaction space + faster network updates could matter for complex DeFi trades, privacy transactions and trading infrastructure.
But there’s a catch: better infrastructure doesn't automatically mean more demand.
And price is giving us a level to watch. SOL recently pushed to $114.30 before pulling back. If buyers reclaim and hold that level, the upgrade story gets more interesting. If $110.60 breaks, I’d want to see how price reacts around $106.95 before assuming the momentum is still intact.
So I’m watching two things: does the ecosystem actually use the new capacity, and can SOL hold its breakout structure?
Solana just built more room. Now the ecosystem has to use it.
$SOL is getting an interesting upgrade stack.
Solana just increased the maximum transaction size from 1,232 to 4,096 bytes, giving developers much more room for complex operations in a single transaction. At the same time, slot times are being pushed toward 250ms.
That combination is more interesting to me than simply saying “Solana is faster.”
More transaction space + faster network updates could matter for complex DeFi trades, privacy transactions and trading infrastructure.
But there’s a catch: better infrastructure doesn't automatically mean more demand.
And price is giving us a level to watch. SOL recently pushed to $114.30 before pulling back. If buyers reclaim and hold that level, the upgrade story gets more interesting. If $110.60 breaks, I’d want to see how price reacts around $106.95 before assuming the momentum is still intact.
So I’m watching two things: does the ecosystem actually use the new capacity, and can SOL hold its breakout structure?
Solana just built more room. Now the ecosystem has to use it.

236
·
--
BINANCE RED PACKET
Already following me?
Comment yes and get your Red Packet.
Not following yet?
Follow me → Comment yes → Get your Red Packet.
Simple. Everyone who comments yes gets one.
$BTC $AAVE
BINANCE RED PACKET
Already following me?
Comment yes and get your Red Packet.
Not following yet?
Follow me → Comment yes → Get your Red Packet.
Simple. Everyone who comments yes gets one.
$BTC $AAVE
Already following me?
Comment yes and get your Red Packet.
Not following yet?
Follow me → Comment yes → Get your Red Packet.
Simple. Everyone who comments yes gets one.
$BTC $AAVE

85
9
175
·
--
$NVDAB Just Raised the AI Demand Question
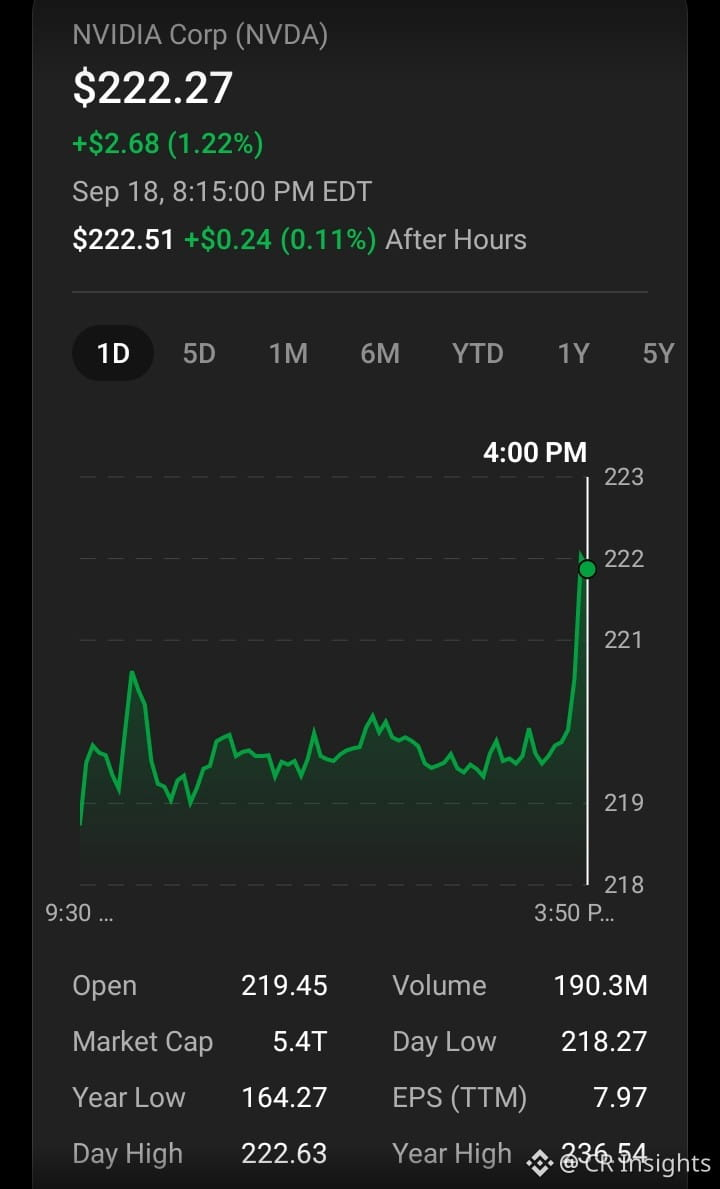
$NVDA | Jensen Huang just said NVIDIA expects to sell roughly twice as many chips next year as it does this year. He attributed the increase to AI investment spreading across industries and countries.
That matters because NVIDIA isn't simply saying demand is strong — it's saying demand could support 2x the chip volume.
And NVIDIA's latest numbers already show how large this demand has become: Q2 FY2027 revenue reached $96.2B, up 106% YoY, with gross margin at 75%.
But there's another side I'm watching.
If NVIDIA really ships twice as many chips, the question isn't whether AI demand exists. It's whether customers can keep spending fast enough to absorb that supply. NVIDIA itself said its frontier AI customers have demand for compute that is currently growing faster than their balance sheets and financing capacity.
If demand keeps expanding and NVIDIA can convert that demand into shipments and revenue, the current AI cycle still has room to run. If spending starts slowing while supply ramps aggressively, the market could react very differently.
I’m watching the gap between AI demand and actual chip shipments — that's where the next NVDA move gets interesting.
$NVDAB Just Raised the AI Demand Question
$NVDA | Jensen Huang just said NVIDIA expects to sell roughly twice as many chips next year as it does this year. He attributed the increase to AI investment spreading across industries and countries.
That matters because NVIDIA isn't simply saying demand is strong — it's saying demand could support 2x the chip volume.
And NVIDIA's latest numbers already show how large this demand has become: Q2 FY2027 revenue reached $96.2B, up 106% YoY, with gross margin at 75%.
But there's another side I'm watching.
If NVIDIA really ships twice as many chips, the question isn't whether AI demand exists. It's whether customers can keep spending fast enough to absorb that supply. NVIDIA itself said its frontier AI customers have demand for compute that is currently growing faster than their balance sheets and financing capacity.
If demand keeps expanding and NVIDIA can convert that demand into shipments and revenue, the current AI cycle still has room to run. If spending starts slowing while supply ramps aggressively, the market could react very differently.
I’m watching the gap between AI demand and actual chip shipments — that's where the next NVDA move gets interesting.
$NVDA | Jensen Huang just said NVIDIA expects to sell roughly twice as many chips next year as it does this year. He attributed the increase to AI investment spreading across industries and countries.
That matters because NVIDIA isn't simply saying demand is strong — it's saying demand could support 2x the chip volume.
And NVIDIA's latest numbers already show how large this demand has become: Q2 FY2027 revenue reached $96.2B, up 106% YoY, with gross margin at 75%.
But there's another side I'm watching.
If NVIDIA really ships twice as many chips, the question isn't whether AI demand exists. It's whether customers can keep spending fast enough to absorb that supply. NVIDIA itself said its frontier AI customers have demand for compute that is currently growing faster than their balance sheets and financing capacity.
If demand keeps expanding and NVIDIA can convert that demand into shipments and revenue, the current AI cycle still has room to run. If spending starts slowing while supply ramps aggressively, the market could react very differently.
I’m watching the gap between AI demand and actual chip shipments — that's where the next NVDA move gets interesting.
1
361
Log in to explore more content
Join global crypto users on Binance Square
⚡️ Get latest and useful information about crypto.
💬 Trusted by the world’s largest crypto exchange.
👍 Discover real insights from verified creators.
Email / Phone number
Trending Topics
KoreaProposesTokenizingStocksAndBonds
8,683 views
193 Discussing
#koreaproposestokenizingstocksandbonds 🇰🇷 South Korea Proposes Roadmap to Tokenize Stocks and Bonds by 2027
Traditional finance is meeting blockchain at a national level. South Korea has unveiled a comprehensive regulatory framework to bring traditional securities on-chain.
📌 Core News:
• The FSC announced a 3-phase plan to expand tokenized securities to include stocks, bonds, and investment funds.
• The legal framework is officially set to take effect on February 4, 2027.
• Phase 1 focuses on private funds, corporate bonds, and unlisted equities before expanding to public markets.
• For investor protection, retail participants face an annual net purchase limit of 100 million KRW (~$74K) per OTC platform.
📊 Market Impact:
• RWA Validation: This provides regulatory clarity for the Real-World Asset (RWA) narrative, proving institutional appetite for efficient on-chain settlement.
• Infrastructure Growth: Expect accelerated development in compliant blockchain infrastructure, digital custody, and identity verification solutions.
• Stablecoin Utility: Phase 3 explicitly mentions integrating on-chain payment systems, which could significantly boost the real-world utility of regulated stablecoins.
💬 Join the Discussion:
Do you think tokenized traditional securities will be the main catalyst for the next wave of institutional crypto adoption? Let’s discuss below! 👇
#RWA #Tokenization #SouthKorea #CryptoRegulation #Blockchain This is for educational purposes only. Not Financial Advice (NFA). Always Do Your Own Research (DYOR).
$NOM $MOVR $NIGHT
珍妮丝 kgf
·1 Likes
·13 views
MetaMaskExitsLidoValidatorsAfterSecurityIncident
73,483 views
936 Discussing
MicronBeatsEarningsLiftsGuidance
43,671 views
718 Discussing