
Falcon Crypto Global
5.8k Posts

Falcon Crypto Global
Report
Block User
Content Creator | Binance Square | BNB Holder | Writer | 5 Years Trading Experience 📈
Open Trade
High-Frequency Trader
5.7 Years
85 Following
6.4K+ Followers
10.6K+ Liked
Posts
Portfolio
All
Quotes
Videos
Live
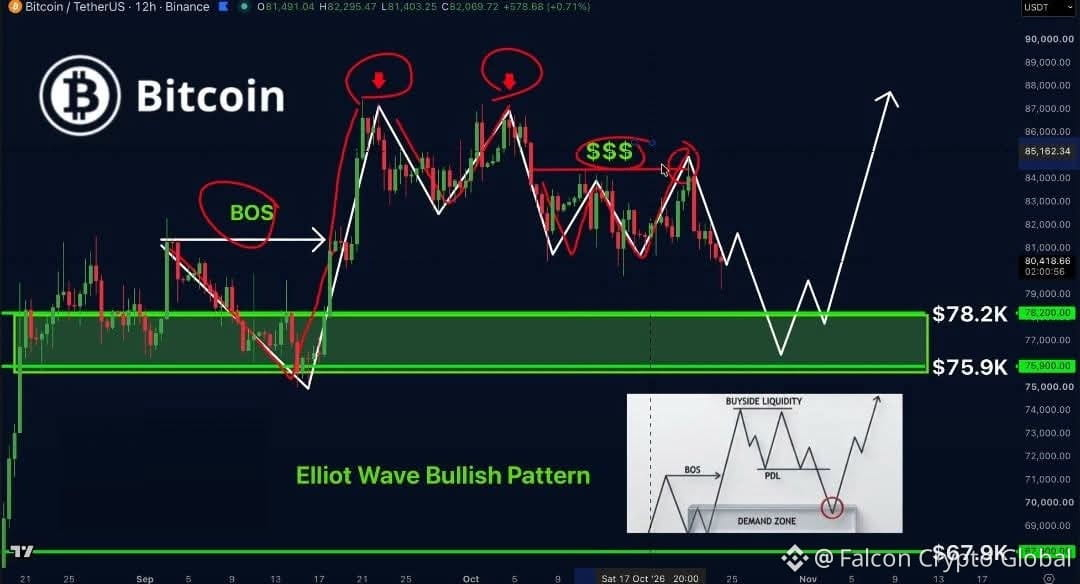
I know it hurts watching $BTC bleed.
{spot}(BTCUSDT)
But here’s my plan:
Buy zone: $78.2K to $75.9K
Deep order: $67.9K
First target: $88K+
That zone is where the September rally started. I’m not chasing. I’m waiting.
Patience pays more than panic.
#BinancePick
I know it hurts watching $BTC bleed.
But here’s my plan:
Buy zone: $78.2K to $75.9K
Deep order: $67.9K
First target: $88K+
That zone is where the September rally started. I’m not chasing. I’m waiting.
Patience pays more than panic.
#BinancePick
But here’s my plan:
Buy zone: $78.2K to $75.9K
Deep order: $67.9K
First target: $88K+
That zone is where the September rally started. I’m not chasing. I’m waiting.
Patience pays more than panic.
#BinancePick
78
My $ETH
{spot}(ETHUSDT)
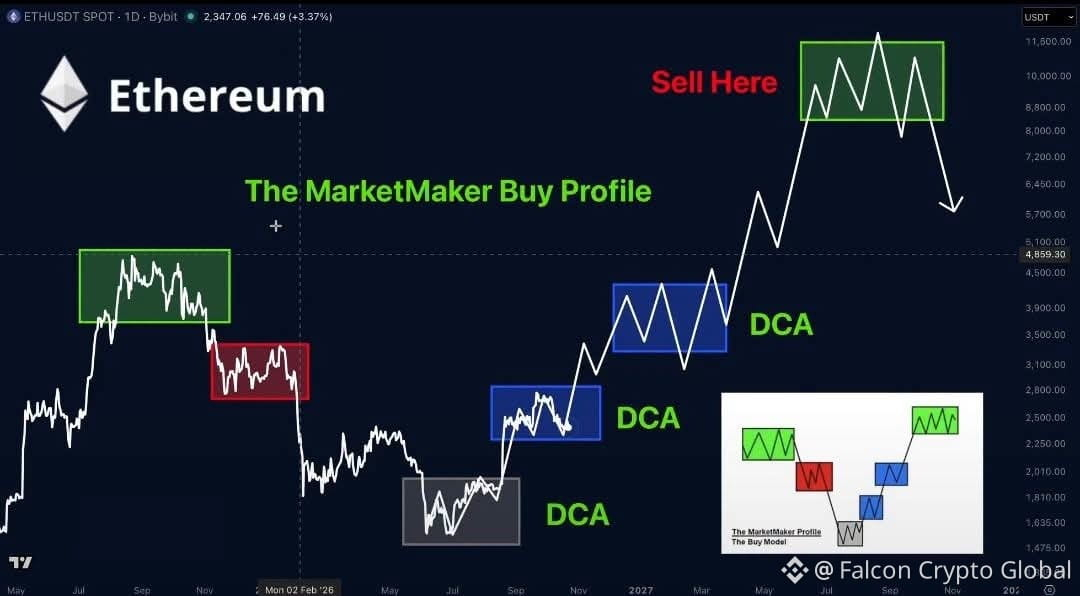
plan for the next 12 months fits in three lines.
Buy $2,270–$2,500.
Add $3,000–$3,300.
Sell $8,800–$11,500.
Scary and boring now. Life-changing later.
#BinancePick
My $ETH
plan for the next 12 months fits in three lines.
Buy $2,270–$2,500.
Add $3,000–$3,300.
Sell $8,800–$11,500.
Scary and boring now. Life-changing later.
#BinancePick
plan for the next 12 months fits in three lines.
Buy $2,270–$2,500.
Add $3,000–$3,300.
Sell $8,800–$11,500.
Scary and boring now. Life-changing later.
#BinancePick
1
1
242
📊 THE TREND IS STRONG, BUT WILL $BTC CONTINUE HIGHER? 👀
{spot}(BTCUSDT)
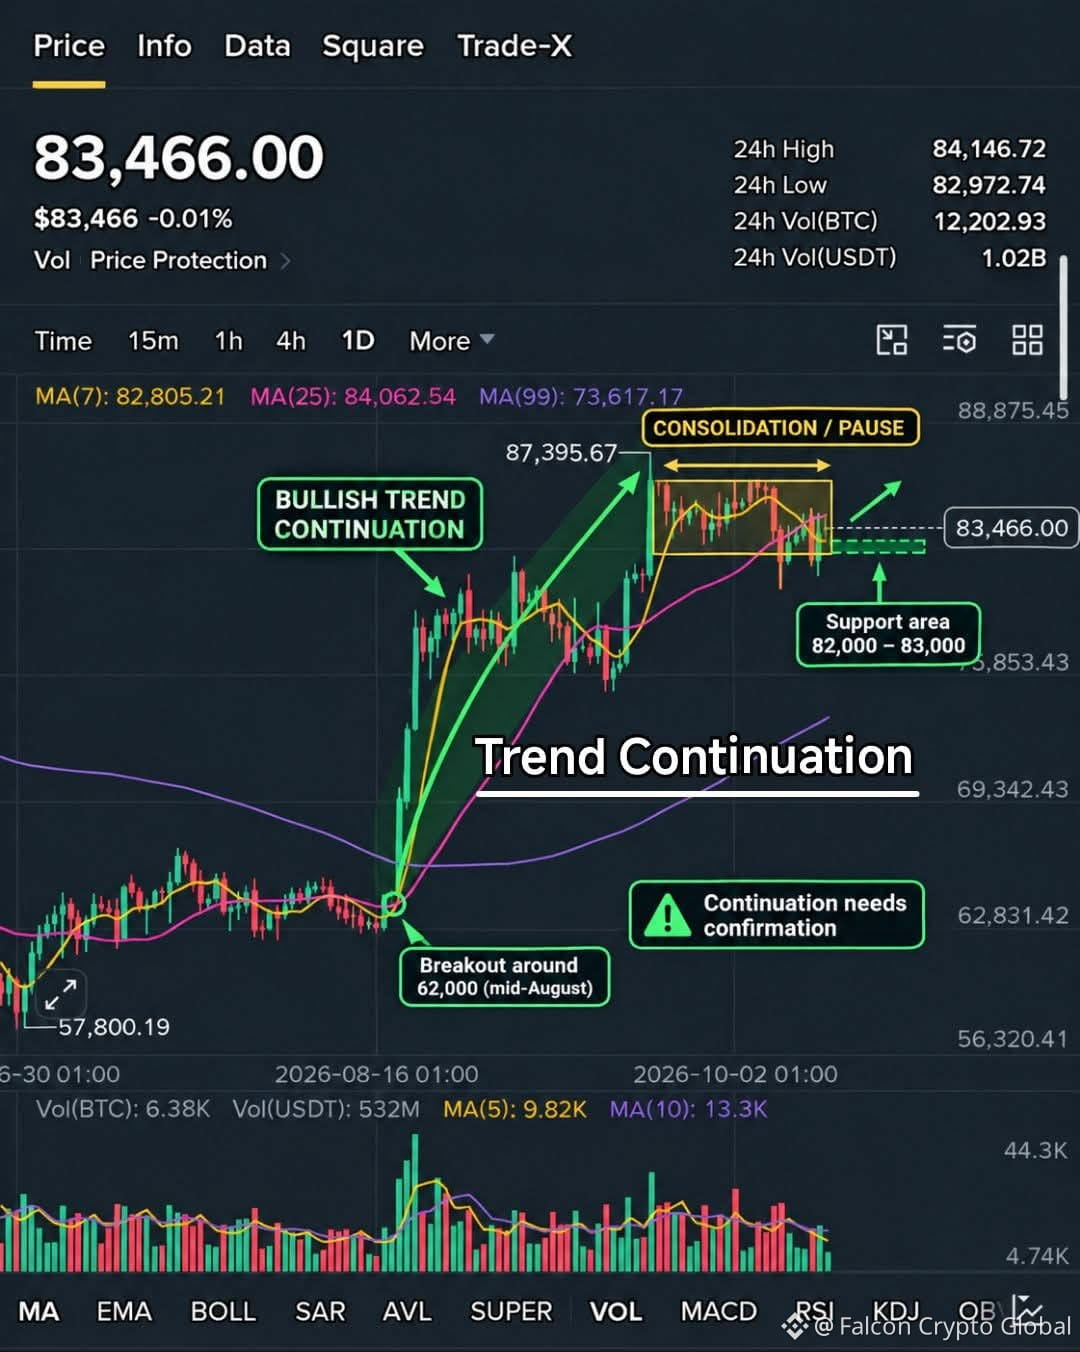
Have you ever watched Bitcoin make a powerful upward move, only to see the price pause and move sideways? This could be a Trend Continuation setup!
Trend continuation occurs when the price pauses, consolidates, or pulls back before potentially resuming its existing trend.
In this chart, BTC breaks upward from the region around $62,000, makes a strong bullish move, and reaches a high near $87,395. After that rally, price begins consolidating around the $82,000–$85,000 area.
This represents a possible pause in the bullish trend. Traders watch whether buyers can regain momentum and push the price above resistance.
How Can Traders Interpret This Price Action?
✅ 1. Identify the trend: The strong upward move suggests bullish momentum in the period shown.
✅ 2. Watch consolidation: The sideways movement near the highs may indicate that the market is gathering momentum, but it can also signal weakening buying pressure.
✅ 3. Monitor support and resistance: The $82,000–$83,000 area is a potential support zone to watch, while the recent highs may act as resistance.
✅ 4. Wait for confirmation: A strong breakout above resistance, supported by increased volume, could strengthen the continuation scenario. However, a breakdown below support could signal a deeper pullback or a possible change in market structure.
Remember, a pause in an uptrend does not guarantee another rally. Always manage risk and avoid entering trades based on assumptions alone.
💬 Do you think BTC will break above the consolidation range and continue its bullish trend, or will sellers push the price lower? Share your analysis below! 👇
#BTC #bitcoin #BTCAnalysis #TrendContinuation #priceaction
📊 THE TREND IS STRONG, BUT WILL $BTC CONTINUE HIGHER? 👀
Have you ever watched Bitcoin make a powerful upward move, only to see the price pause and move sideways? This could be a Trend Continuation setup!
Trend continuation occurs when the price pauses, consolidates, or pulls back before potentially resuming its existing trend.
In this chart, BTC breaks upward from the region around $62,000, makes a strong bullish move, and reaches a high near $87,395. After that rally, price begins consolidating around the $82,000–$85,000 area.
This represents a possible pause in the bullish trend. Traders watch whether buyers can regain momentum and push the price above resistance.
How Can Traders Interpret This Price Action?
✅ 1. Identify the trend: The strong upward move suggests bullish momentum in the period shown.
✅ 2. Watch consolidation: The sideways movement near the highs may indicate that the market is gathering momentum, but it can also signal weakening buying pressure.
✅ 3. Monitor support and resistance: The $82,000–$83,000 area is a potential support zone to watch, while the recent highs may act as resistance.
✅ 4. Wait for confirmation: A strong breakout above resistance, supported by increased volume, could strengthen the continuation scenario. However, a breakdown below support could signal a deeper pullback or a possible change in market structure.
Remember, a pause in an uptrend does not guarantee another rally. Always manage risk and avoid entering trades based on assumptions alone.
💬 Do you think BTC will break above the consolidation range and continue its bullish trend, or will sellers push the price lower? Share your analysis below! 👇
#BTC #bitcoin #BTCAnalysis #TrendContinuation #priceaction
Have you ever watched Bitcoin make a powerful upward move, only to see the price pause and move sideways? This could be a Trend Continuation setup!
Trend continuation occurs when the price pauses, consolidates, or pulls back before potentially resuming its existing trend.
In this chart, BTC breaks upward from the region around $62,000, makes a strong bullish move, and reaches a high near $87,395. After that rally, price begins consolidating around the $82,000–$85,000 area.
This represents a possible pause in the bullish trend. Traders watch whether buyers can regain momentum and push the price above resistance.
How Can Traders Interpret This Price Action?
✅ 1. Identify the trend: The strong upward move suggests bullish momentum in the period shown.
✅ 2. Watch consolidation: The sideways movement near the highs may indicate that the market is gathering momentum, but it can also signal weakening buying pressure.
✅ 3. Monitor support and resistance: The $82,000–$83,000 area is a potential support zone to watch, while the recent highs may act as resistance.
✅ 4. Wait for confirmation: A strong breakout above resistance, supported by increased volume, could strengthen the continuation scenario. However, a breakdown below support could signal a deeper pullback or a possible change in market structure.
Remember, a pause in an uptrend does not guarantee another rally. Always manage risk and avoid entering trades based on assumptions alone.
💬 Do you think BTC will break above the consolidation range and continue its bullish trend, or will sellers push the price lower? Share your analysis below! 👇
#BTC #bitcoin #BTCAnalysis #TrendContinuation #priceaction
138
·
--
Bullish
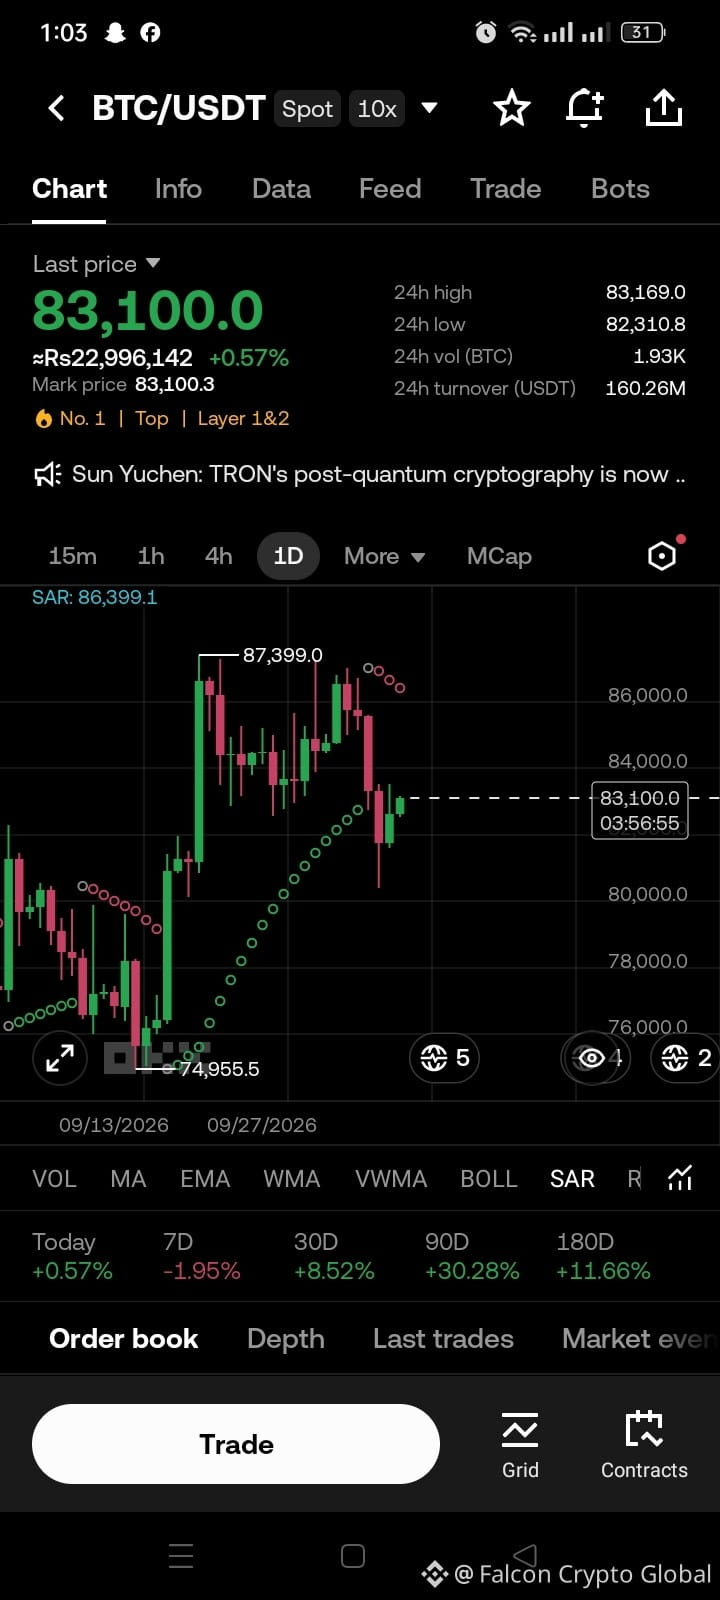
In my opinion, $BTC is showing strong recovery after this big dump. 📈
{future}(BTCUSDT)
Current Price: $83,100
SAR resistance is showing at $86,399 on the 1D chart, which is the key level to watch.
My First Target: $86k
If BTC successfully breaks and holds $86k, then the next target of $90k is confirmed.
This looks like a healthy recovery, not a dead cat bounce. Patience will pay off here.
What do you guys think? Will BTC hit $90k this week? Share your opinion in the comments 👇
#BTC #Bitcoin❗ #crypto
In my opinion, $BTC is showing strong recovery after this big dump. 📈
Current Price: $83,100
SAR resistance is showing at $86,399 on the 1D chart, which is the key level to watch.
My First Target: $86k
If BTC successfully breaks and holds $86k, then the next target of $90k is confirmed.
This looks like a healthy recovery, not a dead cat bounce. Patience will pay off here.
What do you guys think? Will BTC hit $90k this week? Share your opinion in the comments 👇
#BTC #Bitcoin❗ #crypto
Current Price: $83,100
SAR resistance is showing at $86,399 on the 1D chart, which is the key level to watch.
My First Target: $86k
If BTC successfully breaks and holds $86k, then the next target of $90k is confirmed.
This looks like a healthy recovery, not a dead cat bounce. Patience will pay off here.
What do you guys think? Will BTC hit $90k this week? Share your opinion in the comments 👇
#BTC #Bitcoin❗ #crypto
158
·
--
Bullish
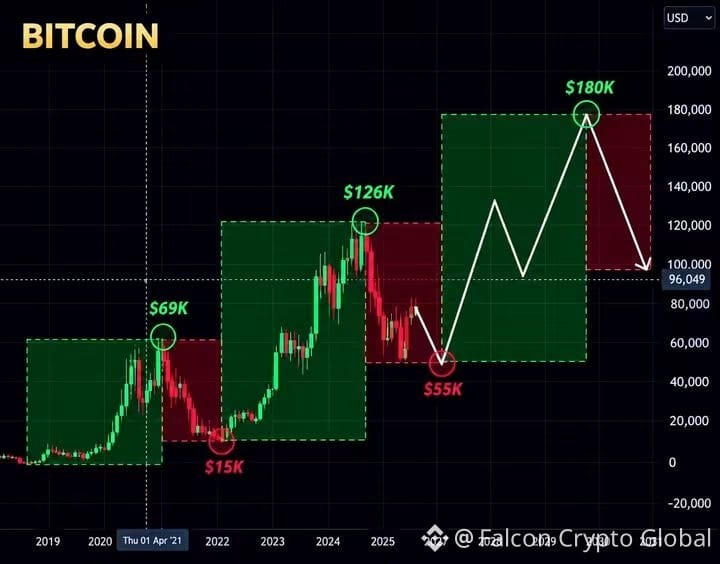
📊 Bitcoin ($BTC ): Is $180K the Next Big Target? 🚀
{spot}(BTCUSDT)
Bitcoin’s previous cycles show a pattern of strong rallies followed by deep corrections. The chart suggests BTC could potentially reach $180K by 2030, but the journey may include major pullbacks.
💭 My Personal View: I believe Bitcoin still has strong long-term potential, but $180K is a possibility, not a guarantee. I would focus on long-term accumulation, patience, and risk management rather than chasing hype.
🔥 The real question is not just how high BTC can go, but who can stay disciplined through the volatility!
What’s your BTC target for 2030 — $150K, $180K, or $200K+? 👇
#bitcoin #BTC #crypto #BitcoinPrediction #BitcoinPrediction
📊 Bitcoin ($BTC ): Is $180K the Next Big Target? 🚀
Bitcoin’s previous cycles show a pattern of strong rallies followed by deep corrections. The chart suggests BTC could potentially reach $180K by 2030, but the journey may include major pullbacks.
💭 My Personal View: I believe Bitcoin still has strong long-term potential, but $180K is a possibility, not a guarantee. I would focus on long-term accumulation, patience, and risk management rather than chasing hype.
🔥 The real question is not just how high BTC can go, but who can stay disciplined through the volatility!
What’s your BTC target for 2030 — $150K, $180K, or $200K+? 👇
#bitcoin #BTC #crypto #BitcoinPrediction #BitcoinPrediction
Bitcoin’s previous cycles show a pattern of strong rallies followed by deep corrections. The chart suggests BTC could potentially reach $180K by 2030, but the journey may include major pullbacks.
💭 My Personal View: I believe Bitcoin still has strong long-term potential, but $180K is a possibility, not a guarantee. I would focus on long-term accumulation, patience, and risk management rather than chasing hype.
🔥 The real question is not just how high BTC can go, but who can stay disciplined through the volatility!
What’s your BTC target for 2030 — $150K, $180K, or $200K+? 👇
#bitcoin #BTC #crypto #BitcoinPrediction #BitcoinPrediction
143
·
--
Bullish
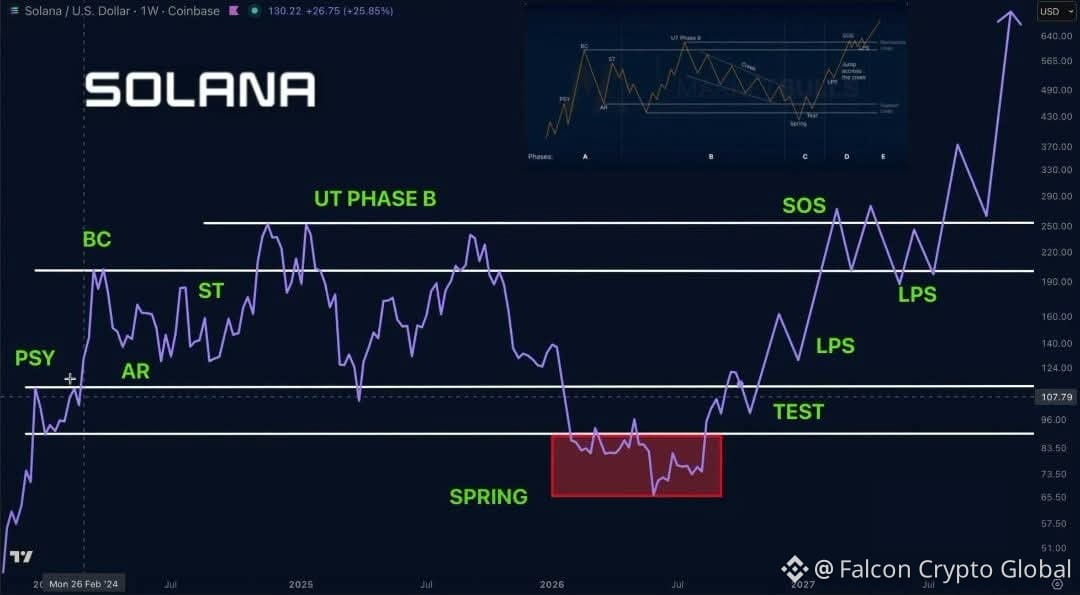
#SolanaPlansToCutBlockTimesTo200ms $SOL just finished its Wyckoff spring.
Shakeout to $65. Everyone gave up.
Then +75% straight out of the range.
Now comes the test.
Every dip from here gets bought.
#SenBlumenthalProbesCantorFitzgeraldTetherTies #SolanaPlansToCutBlockTimesTo200ms
{future}(SOLUSDT)
#SolanaPlansToCutBlockTimesTo200ms $SOL just finished its Wyckoff spring.
Shakeout to $65. Everyone gave up.
Then +75% straight out of the range.
Now comes the test.
Every dip from here gets bought.
#SenBlumenthalProbesCantorFitzgeraldTetherTies #SolanaPlansToCutBlockTimesTo200ms
Shakeout to $65. Everyone gave up.
Then +75% straight out of the range.
Now comes the test.
Every dip from here gets bought.
#SenBlumenthalProbesCantorFitzgeraldTetherTies #SolanaPlansToCutBlockTimesTo200ms
83
📊 BTC • ETH • SOL — Market Update
₿ $BTC : Holding near $82K, but selling pressure remains. $83.3K is a key resistance to watch.
{future}(BTCUSDT)
♦️ $ETH : Around $2.48K, facing downside pressure. Reclaiming $2.5K could improve momentum.
{future}(ETHUSDT)
☀️ $SOL : Near $110, with buyers watching the $109–$110 support zone.
{future}(SOLUSDT)
⚠️ Outlook: Crypto remains under pressure. Watch key levels, manage risk, and avoid FOMO.
#BTC #ETH #SOL #CryptoMarket
📊 BTC • ETH • SOL — Market Update
₿ $BTC : Holding near $82K, but selling pressure remains. $83.3K is a key resistance to watch.
♦️ $ETH : Around $2.48K, facing downside pressure. Reclaiming $2.5K could improve momentum.
☀️ $SOL : Near $110, with buyers watching the $109–$110 support zone.
⚠️ Outlook: Crypto remains under pressure. Watch key levels, manage risk, and avoid FOMO.
#BTC #ETH #SOL #CryptoMarket
₿ $BTC : Holding near $82K, but selling pressure remains. $83.3K is a key resistance to watch.
♦️ $ETH : Around $2.48K, facing downside pressure. Reclaiming $2.5K could improve momentum.
☀️ $SOL : Near $110, with buyers watching the $109–$110 support zone.
⚠️ Outlook: Crypto remains under pressure. Watch key levels, manage risk, and avoid FOMO.
#BTC #ETH #SOL #CryptoMarket
97
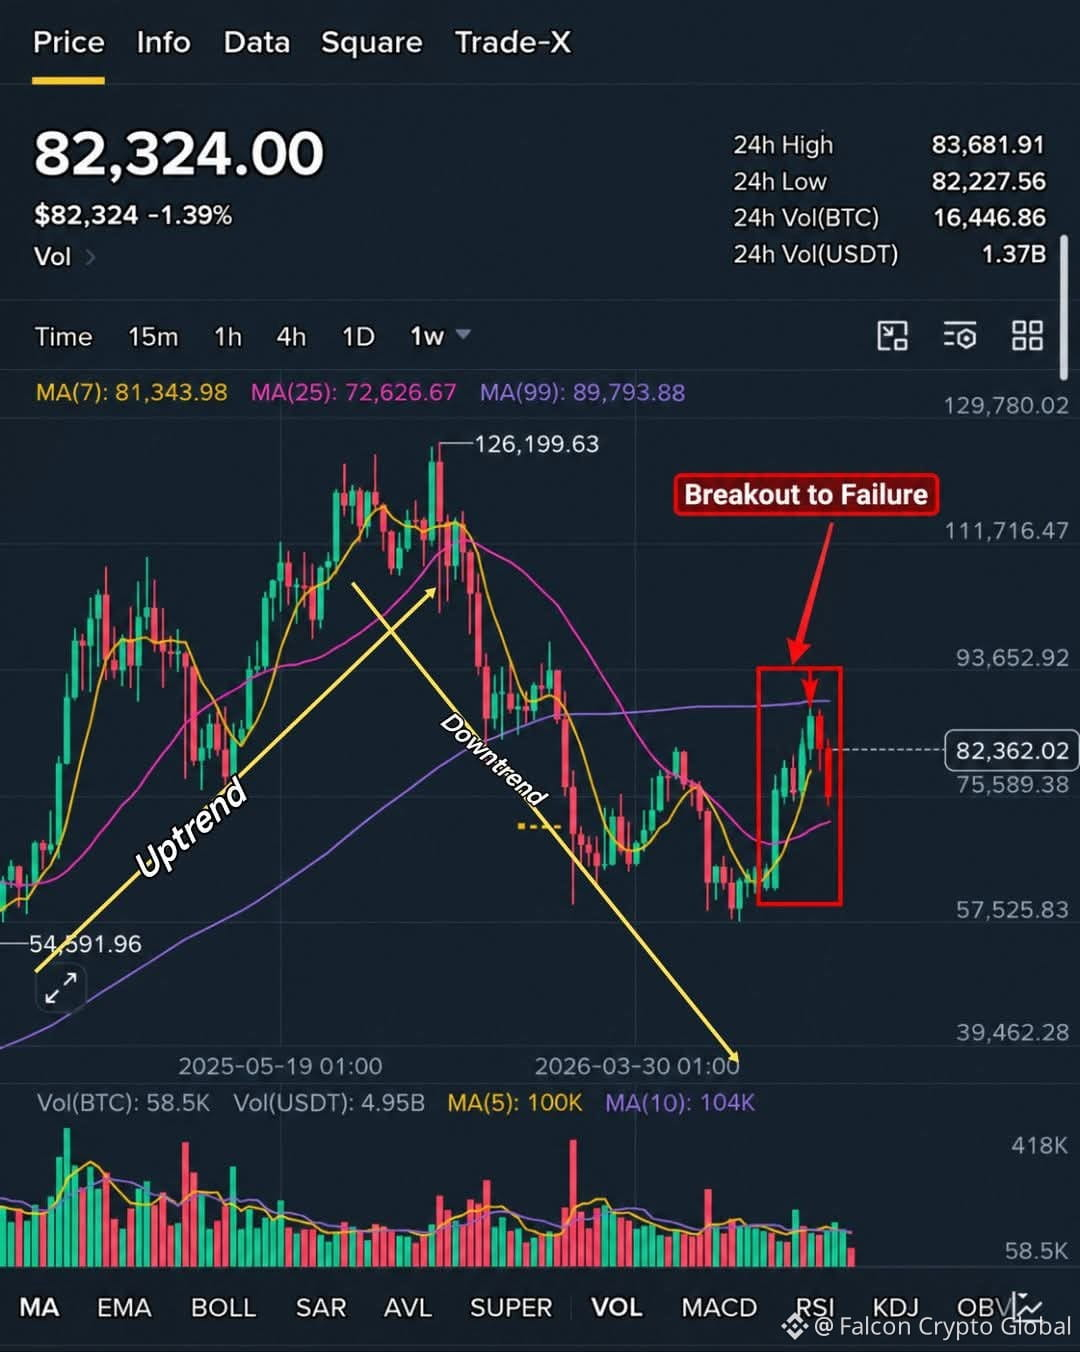
📊 A breakout does NOT always mean the market is ready to continue.
Sometimes price pushes above a key resistance level, attracts buyers, and then quickly reverses. This is known as a Breakout to Failure.
In the chart, price rallies from the lower consolidation area and pushes toward the previous resistance/structure zone.
The breakout initially looks bullish—but price fails to sustain the move above resistance and gets rejected.
That failure tells traders that the breakout may have been a false breakout rather than genuine continuation.
From a market structure perspective, watch for:
- Price breaking a previous high or resistance.
- Failure to hold above that level.
- Strong rejection back below the breakout area.
- A shift in momentum after the rejection.
- Confirmation before entering a trade.
The key is not simply seeing price break a level. The reaction after the breakout is what matters.
Don't chase the breakout—study the confirmation.
A failed breakout can warn that buyers are losing control and that the market may be preparing for a deeper retracement or structure shift.
Instead of entering immediately when resistance breaks, ask:
“Did price actually accept above the level, or was the breakout rejected?”
Patience helps you avoid entering at the exact point where the market is trapping late buyers.
My question is when you see a breakout like this, do you wait for confirmation—or enter immediately after the level breaks?
$BTC
{future}(BTCUSDT)
#BTC #Bitcoin #Marketstructure #TradingPsychology #cryptotrading
📊 A breakout does NOT always mean the market is ready to continue.
Sometimes price pushes above a key resistance level, attracts buyers, and then quickly reverses. This is known as a Breakout to Failure.
In the chart, price rallies from the lower consolidation area and pushes toward the previous resistance/structure zone.
The breakout initially looks bullish—but price fails to sustain the move above resistance and gets rejected.
That failure tells traders that the breakout may have been a false breakout rather than genuine continuation.
From a market structure perspective, watch for:
- Price breaking a previous high or resistance.
- Failure to hold above that level.
- Strong rejection back below the breakout area.
- A shift in momentum after the rejection.
- Confirmation before entering a trade.
The key is not simply seeing price break a level. The reaction after the breakout is what matters.
Don't chase the breakout—study the confirmation.
A failed breakout can warn that buyers are losing control and that the market may be preparing for a deeper retracement or structure shift.
Instead of entering immediately when resistance breaks, ask:
“Did price actually accept above the level, or was the breakout rejected?”
Patience helps you avoid entering at the exact point where the market is trapping late buyers.
My question is when you see a breakout like this, do you wait for confirmation—or enter immediately after the level breaks?
$BTC
#BTC #Bitcoin #Marketstructure #TradingPsychology #cryptotrading
Sometimes price pushes above a key resistance level, attracts buyers, and then quickly reverses. This is known as a Breakout to Failure.
In the chart, price rallies from the lower consolidation area and pushes toward the previous resistance/structure zone.
The breakout initially looks bullish—but price fails to sustain the move above resistance and gets rejected.
That failure tells traders that the breakout may have been a false breakout rather than genuine continuation.
From a market structure perspective, watch for:
- Price breaking a previous high or resistance.
- Failure to hold above that level.
- Strong rejection back below the breakout area.
- A shift in momentum after the rejection.
- Confirmation before entering a trade.
The key is not simply seeing price break a level. The reaction after the breakout is what matters.
Don't chase the breakout—study the confirmation.
A failed breakout can warn that buyers are losing control and that the market may be preparing for a deeper retracement or structure shift.
Instead of entering immediately when resistance breaks, ask:
“Did price actually accept above the level, or was the breakout rejected?”
Patience helps you avoid entering at the exact point where the market is trapping late buyers.
My question is when you see a breakout like this, do you wait for confirmation—or enter immediately after the level breaks?
$BTC
#BTC #Bitcoin #Marketstructure #TradingPsychology #cryptotrading
92
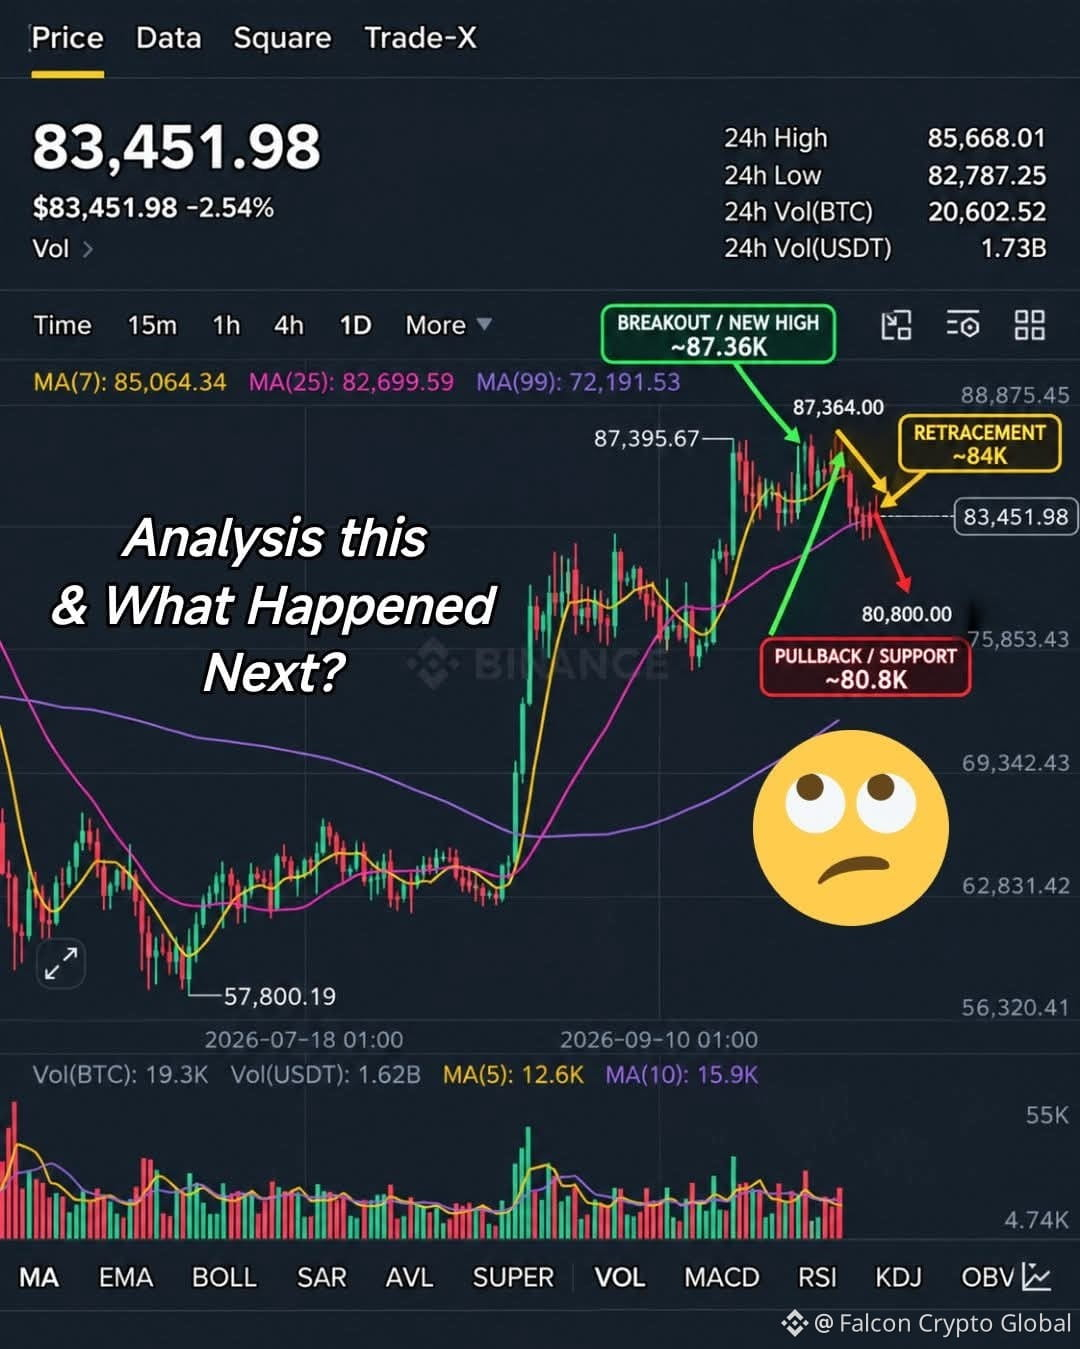
🎯 The chart didn’t just go up — it showed traders exactly why chasing a breakout can be dangerous.$BTC
{spot}(BTCUSDT)
After the strong bullish move, price pushed toward the 87.3K–87.4K area, creating a new local high. But instead of continuing straight upward, sellers stepped in and price began to pull back toward the 84K area.
That pullback is important. It shows that a breakout does not automatically mean immediate continuation. Traders need to watch how price reacts after reaching a major high.
The key areas shown on the chart are:
- 🟢 ~87.36K: breakout/new-high zone
- 🟡 ~84K: retracement area
- 🔴 ~80.8K: potential deeper support/pullback zone
Don't predict the next candle — read the reaction.
When price makes a new high, ask:
1. Is buying pressure still strong?
2. Is price holding above the breakout area?
3. Are sellers rejecting the highs?
4. Does the pullback create a higher low or break important support?
The smartest trade isn't always the first move. Patience after a breakout can help you distinguish genuine continuation from a temporary retracement or failed breakout.
If you were watching this chart at the 87K area, would you chase the breakout, wait for confirmation, or wait for the pullback? Why?
#TradingAnalysis #PriceAction #CryptoTrading #TradingPsychology #Bitcoin❗
🎯 The chart didn’t just go up — it showed traders exactly why chasing a breakout can be dangerous.$BTC
After the strong bullish move, price pushed toward the 87.3K–87.4K area, creating a new local high. But instead of continuing straight upward, sellers stepped in and price began to pull back toward the 84K area.
That pullback is important. It shows that a breakout does not automatically mean immediate continuation. Traders need to watch how price reacts after reaching a major high.
The key areas shown on the chart are:
- 🟢 ~87.36K: breakout/new-high zone
- 🟡 ~84K: retracement area
- 🔴 ~80.8K: potential deeper support/pullback zone
Don't predict the next candle — read the reaction.
When price makes a new high, ask:
1. Is buying pressure still strong?
2. Is price holding above the breakout area?
3. Are sellers rejecting the highs?
4. Does the pullback create a higher low or break important support?
The smartest trade isn't always the first move. Patience after a breakout can help you distinguish genuine continuation from a temporary retracement or failed breakout.
If you were watching this chart at the 87K area, would you chase the breakout, wait for confirmation, or wait for the pullback? Why?
#TradingAnalysis #PriceAction #CryptoTrading #TradingPsychology #Bitcoin❗
After the strong bullish move, price pushed toward the 87.3K–87.4K area, creating a new local high. But instead of continuing straight upward, sellers stepped in and price began to pull back toward the 84K area.
That pullback is important. It shows that a breakout does not automatically mean immediate continuation. Traders need to watch how price reacts after reaching a major high.
The key areas shown on the chart are:
- 🟢 ~87.36K: breakout/new-high zone
- 🟡 ~84K: retracement area
- 🔴 ~80.8K: potential deeper support/pullback zone
Don't predict the next candle — read the reaction.
When price makes a new high, ask:
1. Is buying pressure still strong?
2. Is price holding above the breakout area?
3. Are sellers rejecting the highs?
4. Does the pullback create a higher low or break important support?
The smartest trade isn't always the first move. Patience after a breakout can help you distinguish genuine continuation from a temporary retracement or failed breakout.
If you were watching this chart at the 87K area, would you chase the breakout, wait for confirmation, or wait for the pullback? Why?
#TradingAnalysis #PriceAction #CryptoTrading #TradingPsychology #Bitcoin❗
89
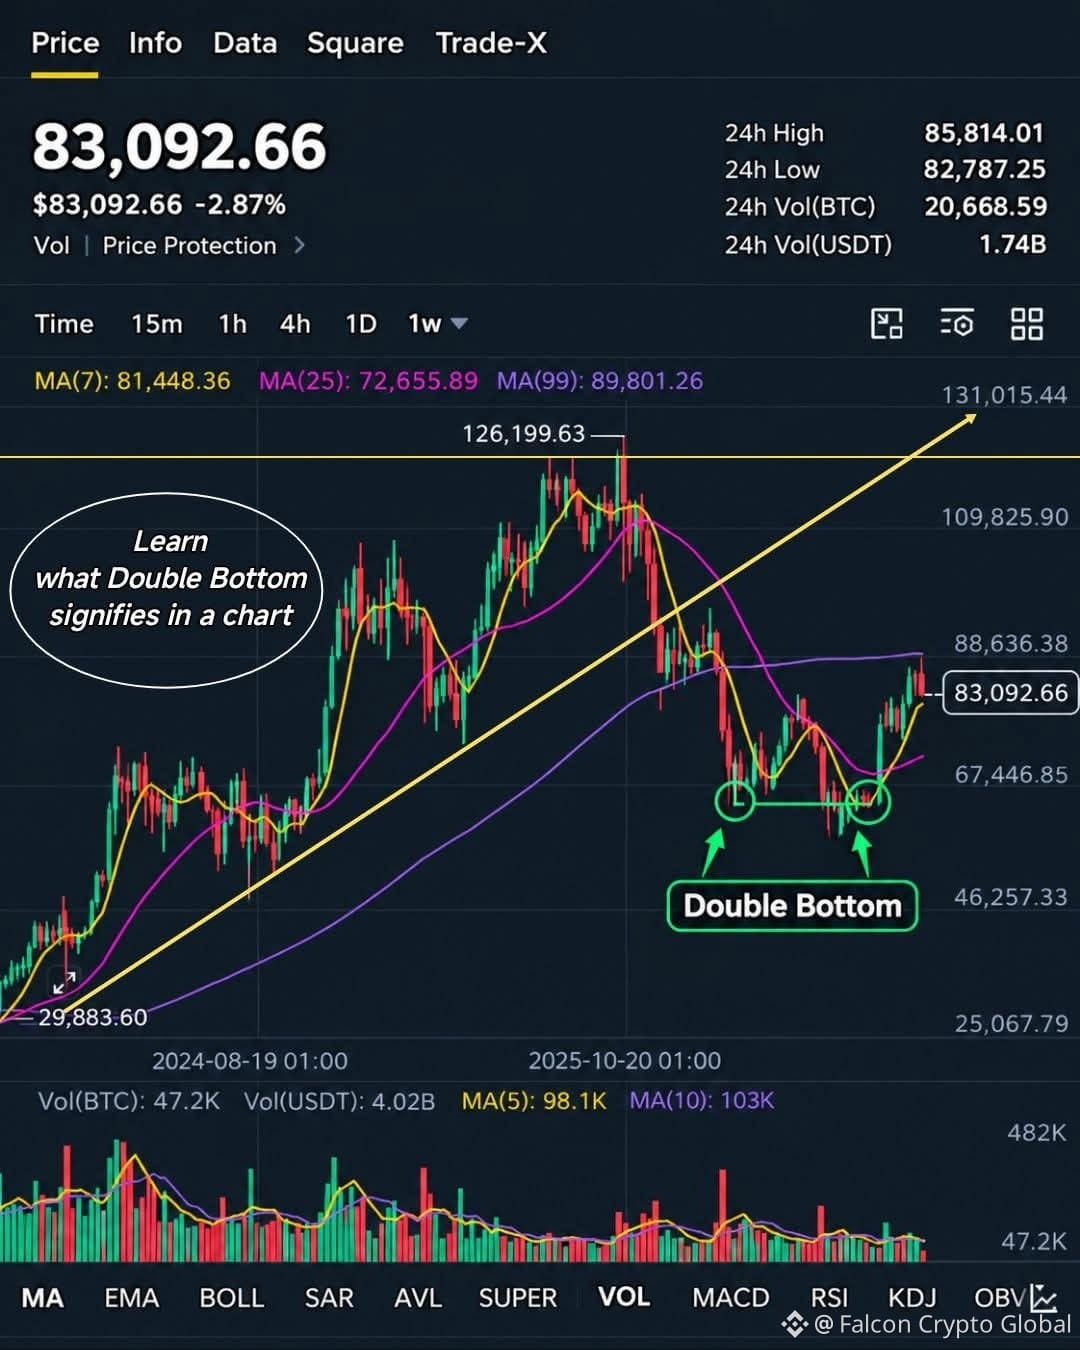
🎯A Double Bottom can test your patience before it rewards your discipline. 😅😅
The first bounce can look like a reversal. The second test can look like the market is about to collapse again. But sometimes, that second test is where the market shows that sellers are losing control.
That's to say that a Double Bottom is a bullish reversal pattern that forms when price falls to a similar support area twice, with a recovery or bounce occurring between the two lows.
In the chart, price reacted around the same lower support zone on two separate occasions. The two lows form the “W” shape highlighted on the chart.
What does this represent?
- First bottom: Sellers push price lower, but buyers step in.
- Bounce: Price recovers from the first low.
- Second bottom: Sellers test the same area again.
- Support holds: Buyers defend the zone once more.
- Potential reversal: Price begins moving higher after the second test.
The key confirmation is usually a break above the neckline/resistance between the two lows. Without that confirmation, a Double Bottom is only a potential pattern—not a guaranteed reversal.
Trading psychology matters as much as pattern recognition.
When the second bottom forms, fear can make traders think, “Here comes another crash.” But disciplined traders don't have to predict—they can wait for price to confirm the idea.
The lesson is simple:
Don't buy simply because you see two lows. Watch how price reacts at support and whether buyers can reclaim important resistance.
A pattern gives you a framework. Price confirmation gives you greater confidence.
When you see a Double Bottom forming, would you rather enter early near the second bottom or wait for a confirmed breakout above the neckline?
$BTC
{spot}(BTCUSDT)
$ETH
{spot}(ETHUSDT)
$SOL
{spot}(SOLUSDT)
#BinanceLaunchesBinanceIntelligence #DoubleBottom #PriceAction #TradingEducation #cryptotrading
🎯A Double Bottom can test your patience before it rewards your discipline. 😅😅
The first bounce can look like a reversal. The second test can look like the market is about to collapse again. But sometimes, that second test is where the market shows that sellers are losing control.
That's to say that a Double Bottom is a bullish reversal pattern that forms when price falls to a similar support area twice, with a recovery or bounce occurring between the two lows.
In the chart, price reacted around the same lower support zone on two separate occasions. The two lows form the “W” shape highlighted on the chart.
What does this represent?
- First bottom: Sellers push price lower, but buyers step in.
- Bounce: Price recovers from the first low.
- Second bottom: Sellers test the same area again.
- Support holds: Buyers defend the zone once more.
- Potential reversal: Price begins moving higher after the second test.
The key confirmation is usually a break above the neckline/resistance between the two lows. Without that confirmation, a Double Bottom is only a potential pattern—not a guaranteed reversal.
Trading psychology matters as much as pattern recognition.
When the second bottom forms, fear can make traders think, “Here comes another crash.” But disciplined traders don't have to predict—they can wait for price to confirm the idea.
The lesson is simple:
Don't buy simply because you see two lows. Watch how price reacts at support and whether buyers can reclaim important resistance.
A pattern gives you a framework. Price confirmation gives you greater confidence.
When you see a Double Bottom forming, would you rather enter early near the second bottom or wait for a confirmed breakout above the neckline?
$BTC
$ETH
$SOL
#BinanceLaunchesBinanceIntelligence #DoubleBottom #PriceAction #TradingEducation #cryptotrading
The first bounce can look like a reversal. The second test can look like the market is about to collapse again. But sometimes, that second test is where the market shows that sellers are losing control.
That's to say that a Double Bottom is a bullish reversal pattern that forms when price falls to a similar support area twice, with a recovery or bounce occurring between the two lows.
In the chart, price reacted around the same lower support zone on two separate occasions. The two lows form the “W” shape highlighted on the chart.
What does this represent?
- First bottom: Sellers push price lower, but buyers step in.
- Bounce: Price recovers from the first low.
- Second bottom: Sellers test the same area again.
- Support holds: Buyers defend the zone once more.
- Potential reversal: Price begins moving higher after the second test.
The key confirmation is usually a break above the neckline/resistance between the two lows. Without that confirmation, a Double Bottom is only a potential pattern—not a guaranteed reversal.
Trading psychology matters as much as pattern recognition.
When the second bottom forms, fear can make traders think, “Here comes another crash.” But disciplined traders don't have to predict—they can wait for price to confirm the idea.
The lesson is simple:
Don't buy simply because you see two lows. Watch how price reacts at support and whether buyers can reclaim important resistance.
A pattern gives you a framework. Price confirmation gives you greater confidence.
When you see a Double Bottom forming, would you rather enter early near the second bottom or wait for a confirmed breakout above the neckline?
$BTC
$ETH
$SOL
#BinanceLaunchesBinanceIntelligence #DoubleBottom #PriceAction #TradingEducation #cryptotrading
127
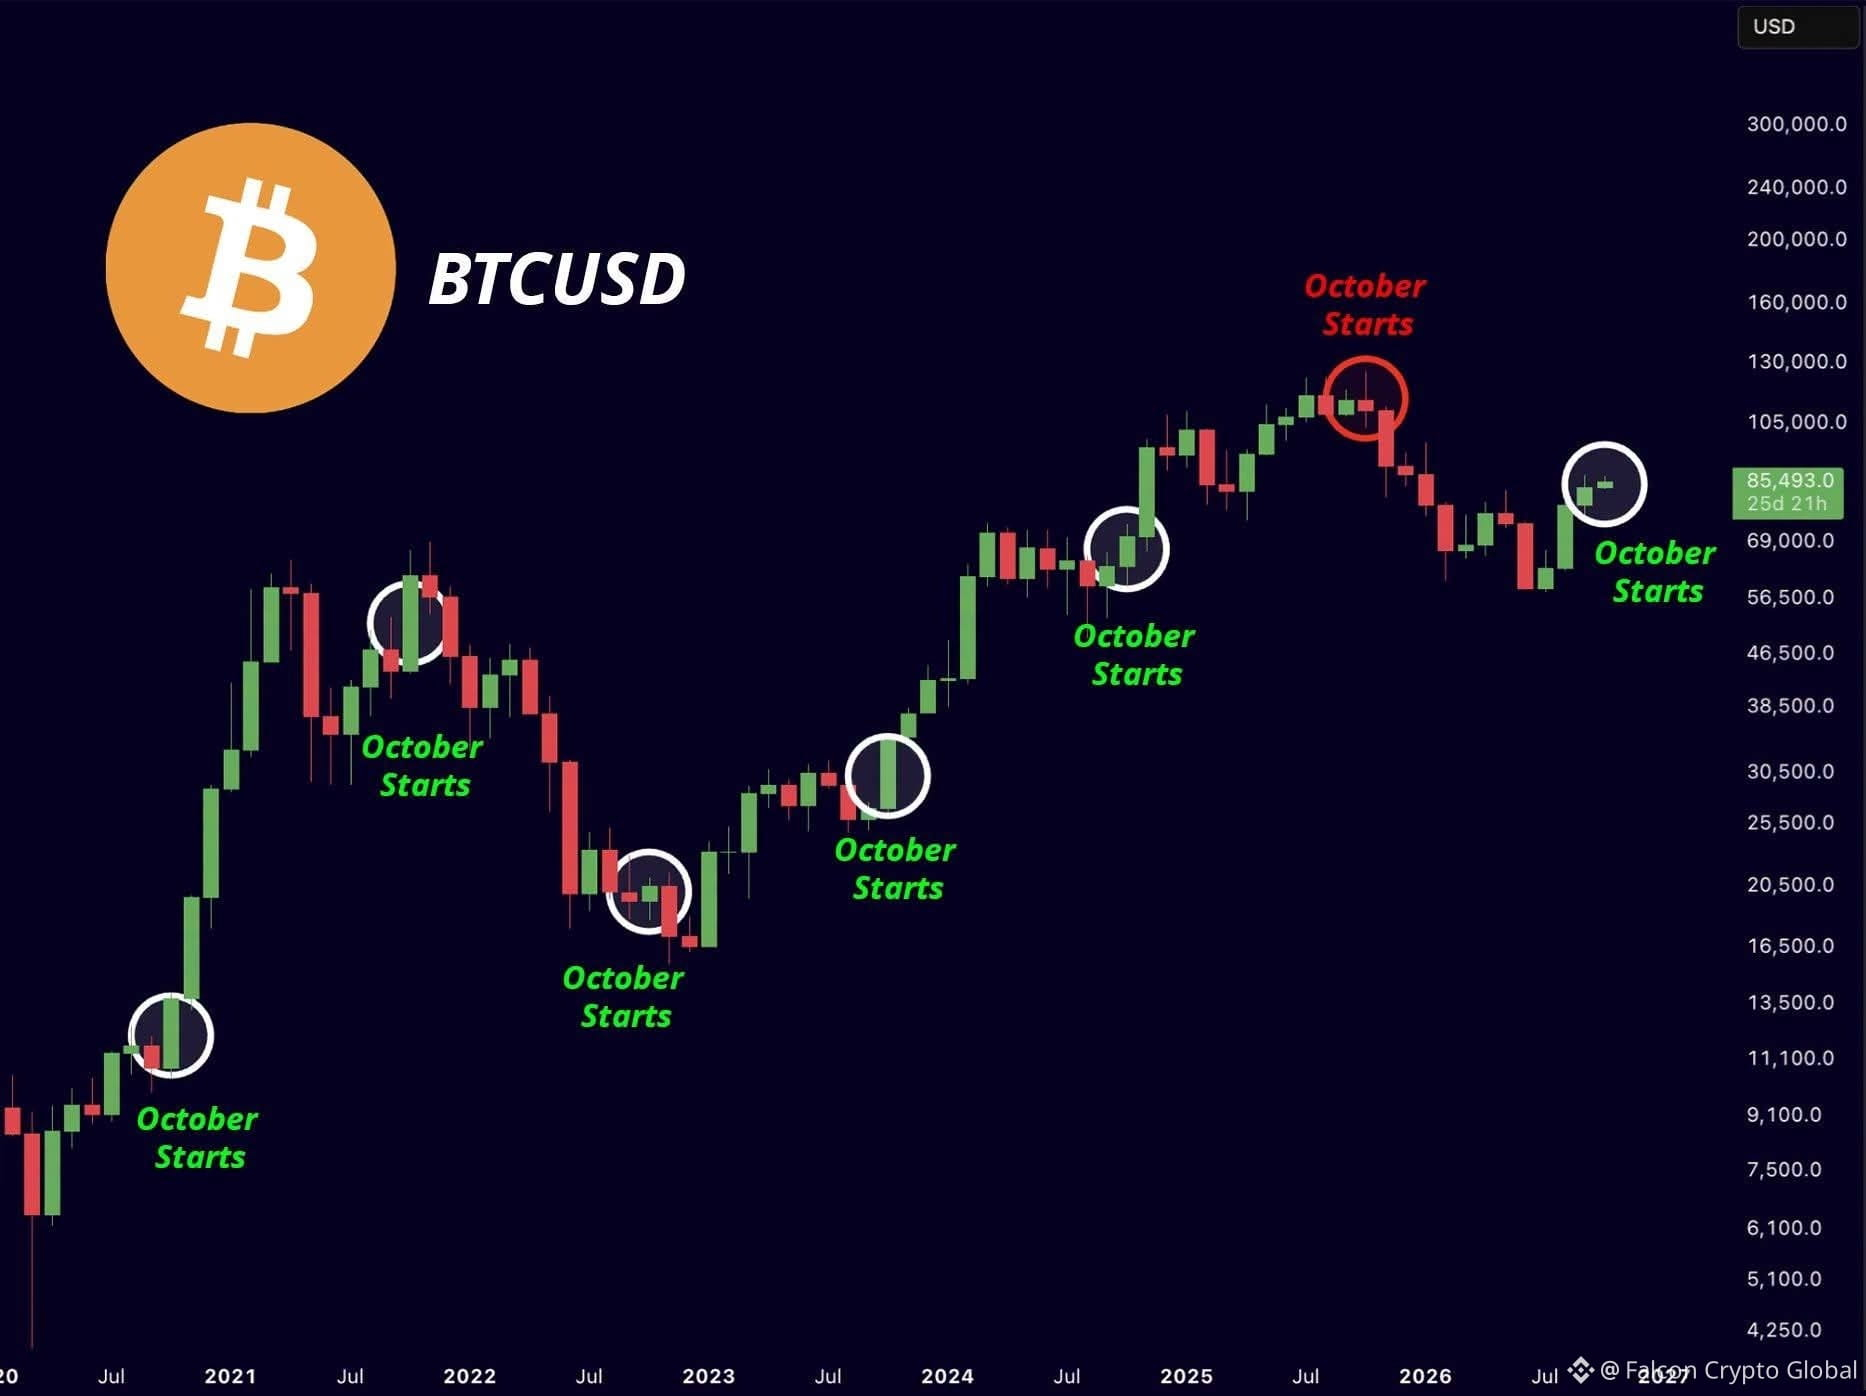
Since 2013, #Bitcoin has closed October green 10 out of 13 completed years.
That’s a 77% historical hit rate.
Average October return: +18.72%
October 2026 so far: +3.17%
Uptober is living up to its name so far.
$BTC
{spot}(BTCUSDT)
#ETHUp70%InQ3ButLiquidityFalls #BinanceLaunchesBinanceIntelligence
Since 2013, #Bitcoin has closed October green 10 out of 13 completed years.
That’s a 77% historical hit rate.
Average October return: +18.72%
October 2026 so far: +3.17%
Uptober is living up to its name so far.
$BTC
#ETHUp70%InQ3ButLiquidityFalls #BinanceLaunchesBinanceIntelligence
That’s a 77% historical hit rate.
Average October return: +18.72%
October 2026 so far: +3.17%
Uptober is living up to its name so far.
$BTC
#ETHUp70%InQ3ButLiquidityFalls #BinanceLaunchesBinanceIntelligence
108
·
--
Bullish
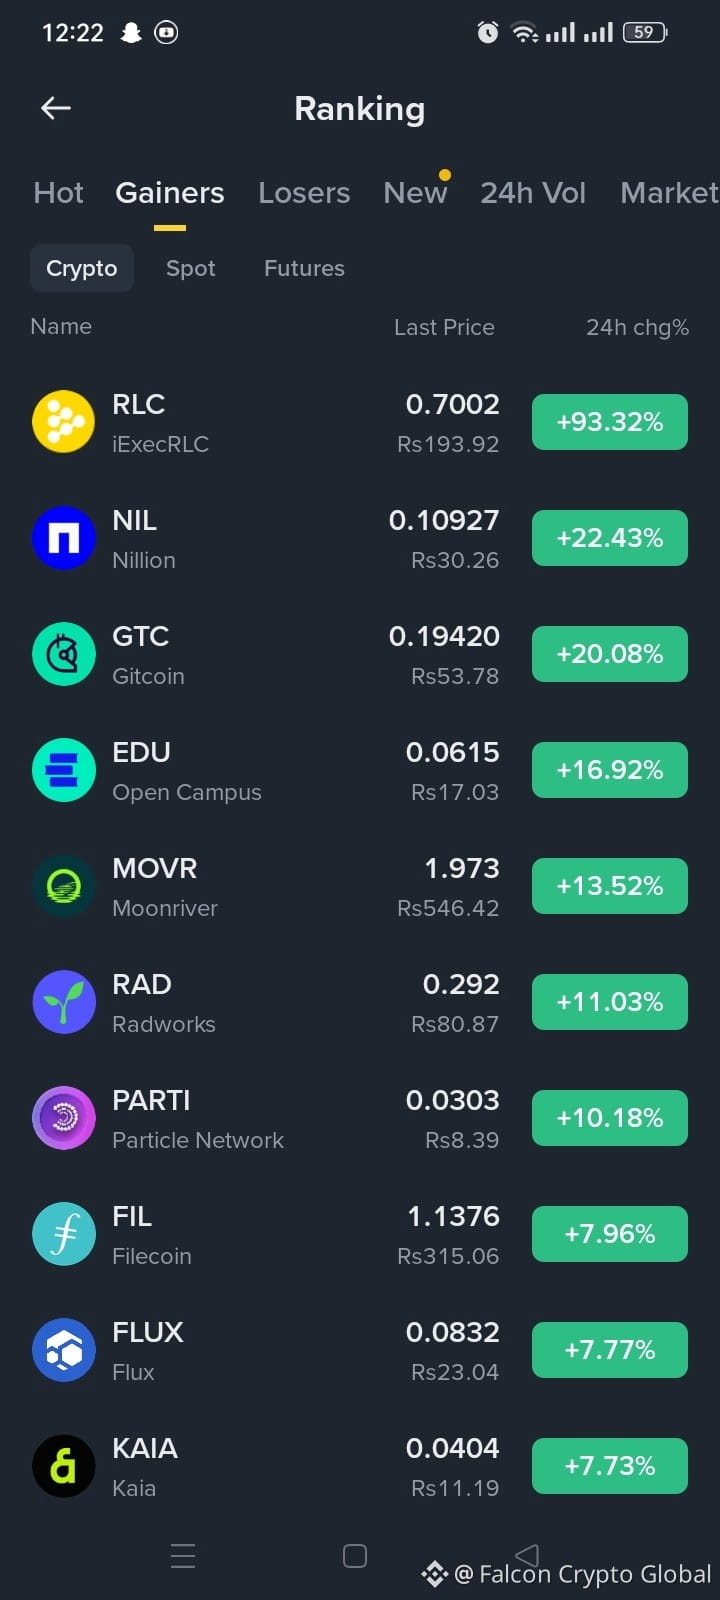
🚀 Top Gainers Today! 📈
$RLC: +93.32% 🔥
$NIL: +22.43%
$GTC: +20.08%
$EDU: +16.92%
$MOVR: +13.52%
$RAD: +11.03%
Watchlist:
· FIL: +7.96%
· FLUX: +7.77%
RLC leading the rally! 🚀
💬 Which one are you watching? 👇
$RLC
{future}(RLCUSDT)
$FIL
{future}(FILUSDT)
$NIL
{future}(NILUSDT)
#ETHUp70%InQ3ButLiquidityFalls #EthereumValidatorExitQueueJumps392% #Nikkei225Jumps2.5%ToThreeMonthHigh
🚀 Top Gainers Today! 📈
$RLC : +93.32% 🔥
$NIL : +22.43%
$GTC: +20.08%
$EDU: +16.92%
$MOVR: +13.52%
$RAD: +11.03%
Watchlist:
· FIL: +7.96%
· FLUX: +7.77%
RLC leading the rally! 🚀
💬 Which one are you watching? 👇
$RLC
$FIL
$NIL
#ETHUp70%InQ3ButLiquidityFalls #EthereumValidatorExitQueueJumps392% #Nikkei225Jumps2.5%ToThreeMonthHigh
$RLC : +93.32% 🔥
$NIL : +22.43%
$GTC: +20.08%
$EDU: +16.92%
$MOVR: +13.52%
$RAD: +11.03%
Watchlist:
· FIL: +7.96%
· FLUX: +7.77%
RLC leading the rally! 🚀
💬 Which one are you watching? 👇
$RLC
$FIL
$NIL
#ETHUp70%InQ3ButLiquidityFalls #EthereumValidatorExitQueueJumps392% #Nikkei225Jumps2.5%ToThreeMonthHigh
812
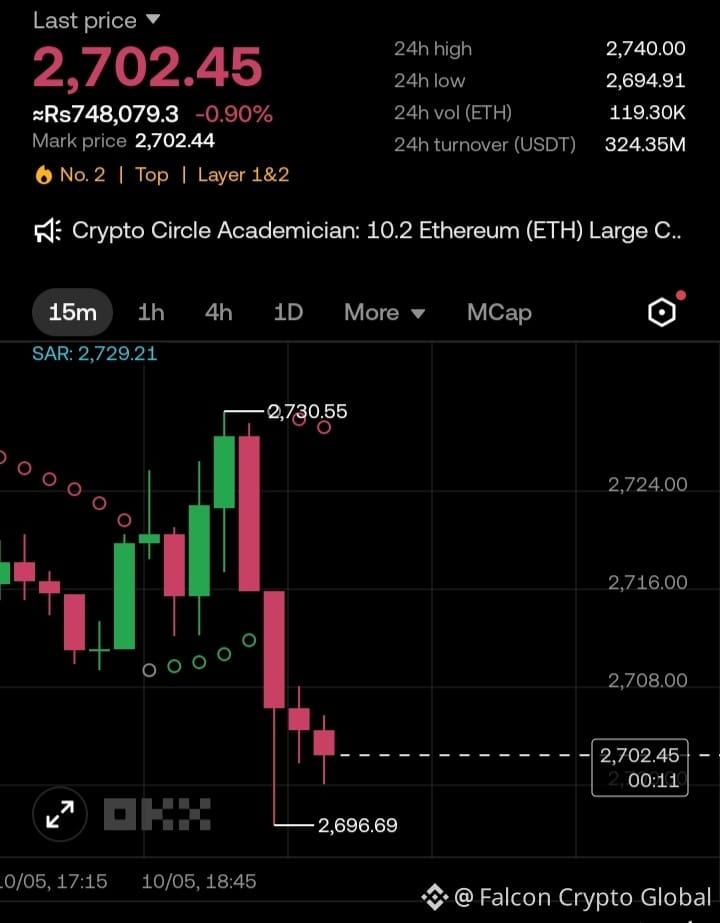
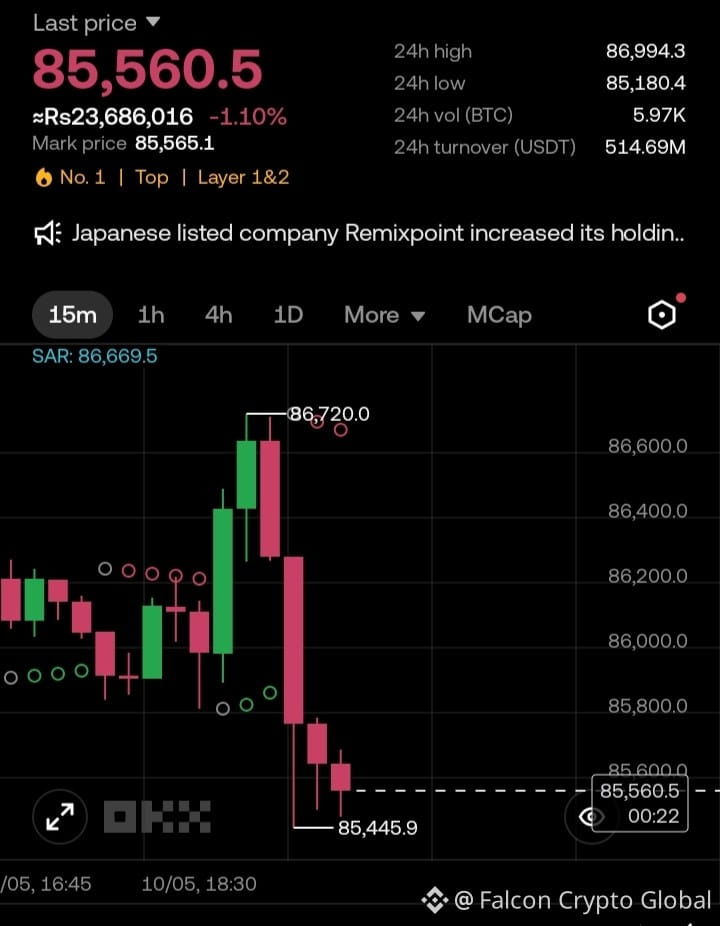
📊 $BTC & $ETH– Market Update
BTC: 85,560 (-1.10%) 📉
ETH: 2,702 (-0.90%) 📉
Key Levels:
· BTC Support: 85,180 | Resistance: 86,994
· ETH Support: 2,694 | Resistance: 2,740
SAR:
· BTC: 86,669 (bearish) ⚠️
· ETH: 2,729 (bearish) ⚠️
Long-term:
· BTC 90D: +35.02% 🟢
· ETH 90D: +52.55% 🟢
Short-term pullback, long-term bullish.
💬 Buy the dip or wait? 👇
$BTC $ETH
{spot}(ETHUSDT)
{spot}(BTCUSDT)
#ETHUp70%InQ3ButLiquidityFalls #EthereumValidatorExitQueueJumps392%
📊 $BTC & $ETH – Market Update
BTC: 85,560 (-1.10%) 📉
ETH: 2,702 (-0.90%) 📉
Key Levels:
· BTC Support: 85,180 | Resistance: 86,994
· ETH Support: 2,694 | Resistance: 2,740
SAR:
· BTC: 86,669 (bearish) ⚠️
· ETH: 2,729 (bearish) ⚠️
Long-term:
· BTC 90D: +35.02% 🟢
· ETH 90D: +52.55% 🟢
Short-term pullback, long-term bullish.
💬 Buy the dip or wait? 👇
$BTC $ETH
#ETHUp70%InQ3ButLiquidityFalls #EthereumValidatorExitQueueJumps392%
BTC: 85,560 (-1.10%) 📉
ETH: 2,702 (-0.90%) 📉
Key Levels:
· BTC Support: 85,180 | Resistance: 86,994
· ETH Support: 2,694 | Resistance: 2,740
SAR:
· BTC: 86,669 (bearish) ⚠️
· ETH: 2,729 (bearish) ⚠️
Long-term:
· BTC 90D: +35.02% 🟢
· ETH 90D: +52.55% 🟢
Short-term pullback, long-term bullish.
💬 Buy the dip or wait? 👇
$BTC $ETH
#ETHUp70%InQ3ButLiquidityFalls #EthereumValidatorExitQueueJumps392%
59
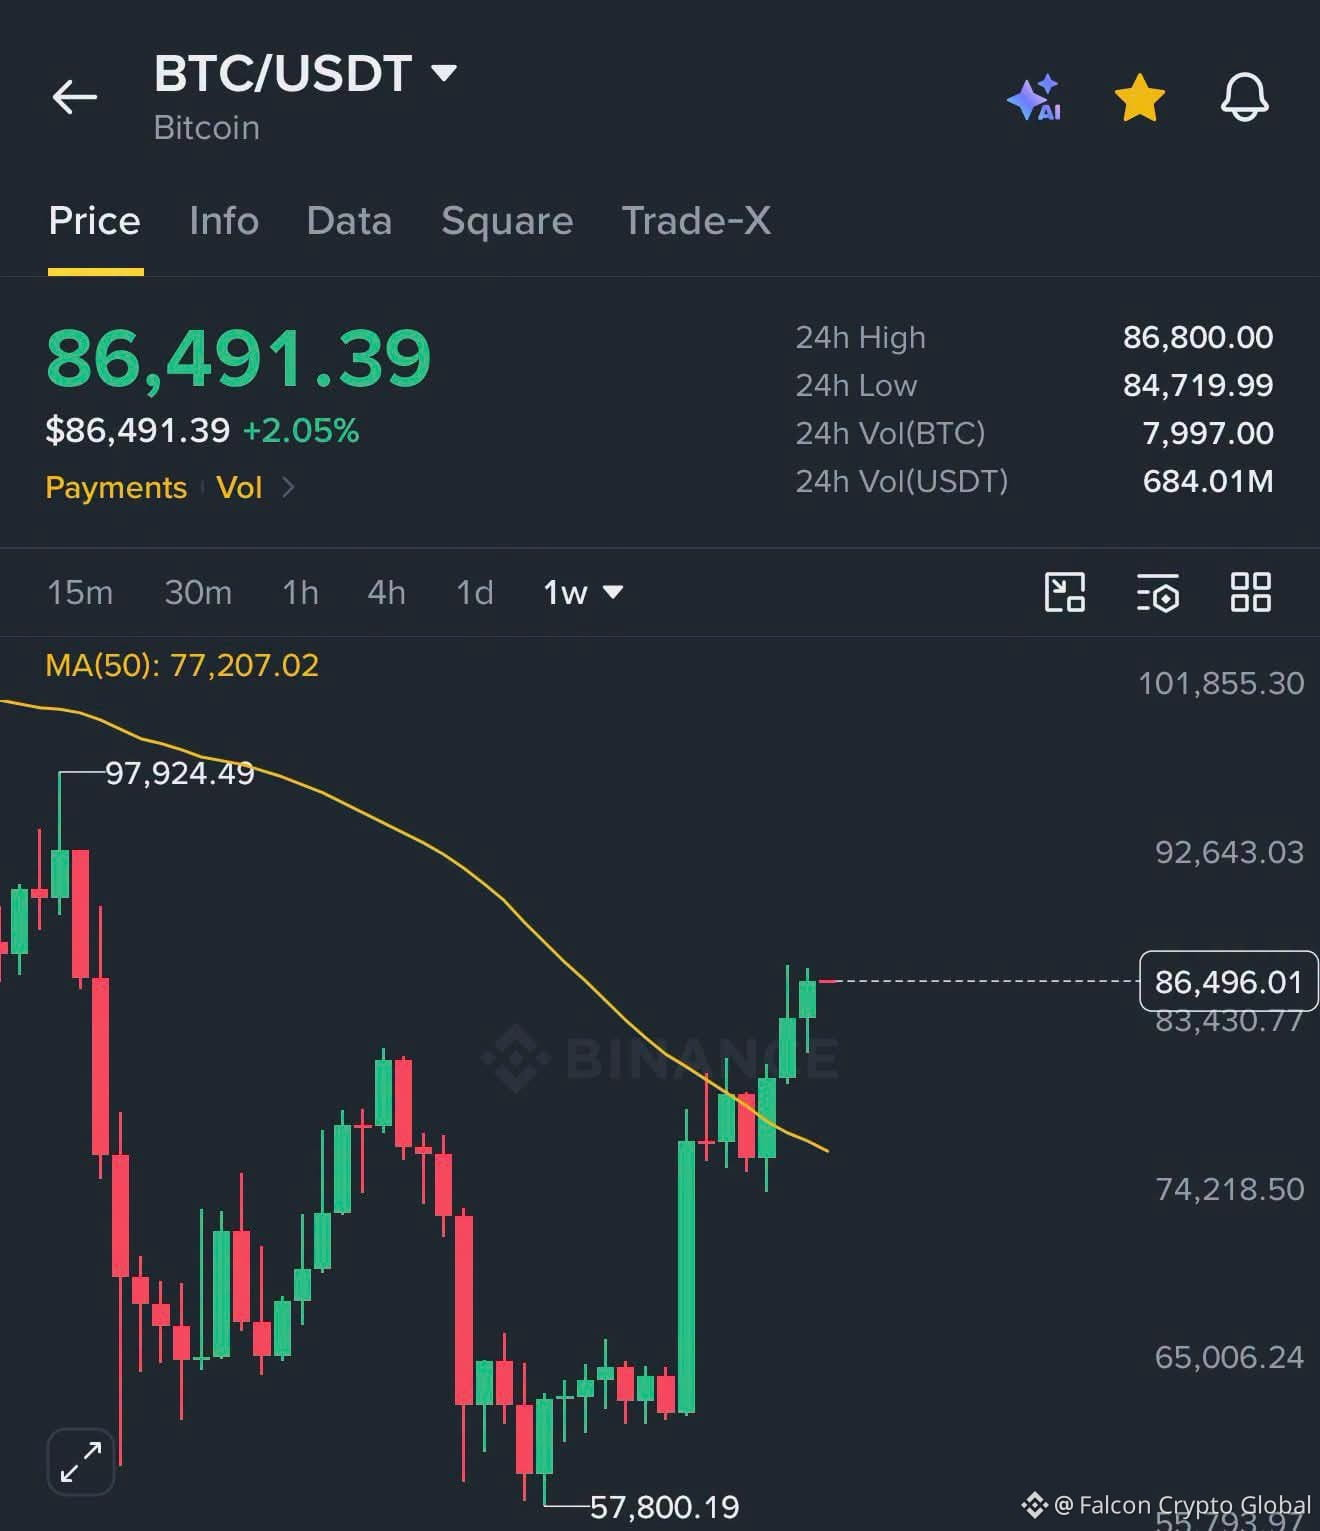
BITCOIN JUST GAVE ITS HIGHEST WEEKLY CLOSE SINCE JANUARY 2026.
$BTC
{future}(BTCUSDT)
BITCOIN JUST GAVE ITS HIGHEST WEEKLY CLOSE SINCE JANUARY 2026.
$BTC
$BTC
83
🏹 $BTC
{spot}(BTCUSDT)
$QNT
{spot}(QNTUSDT)
$NEAR
{spot}(NEARUSDT)
🏹 $BTC
$QNT
$NEAR
$QNT
$NEAR


Eros crypto
·
--
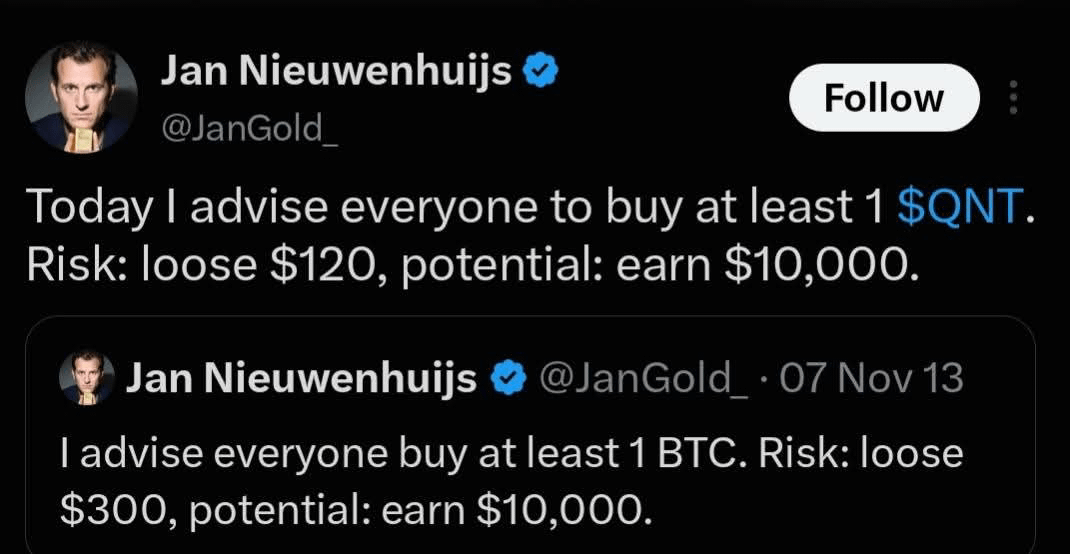
🔥 12 years later, the question remains…
Back in 2013, Jan Nieuwenhuijs said:
“I advise everyone to buy at least 1 $BTC . Risk: lose $300, potential: earn $10,000.”
Today, he’s making a similar bet on $QNT:
Risk: lose ~$120 | Potential: earn $10,000.
Will he be right again this time?
The market will give us the answer. Not the tweets.
$QNT or ?
#trading
Back in 2013, Jan Nieuwenhuijs said:
“I advise everyone to buy at least 1 $BTC . Risk: lose $300, potential: earn $10,000.”
Today, he’s making a similar bet on $QNT:
Risk: lose ~$120 | Potential: earn $10,000.
Will he be right again this time?
The market will give us the answer. Not the tweets.
$QNT or ?
#trading
50
·
--
Bullish
Falcon Crypto Global
·
--
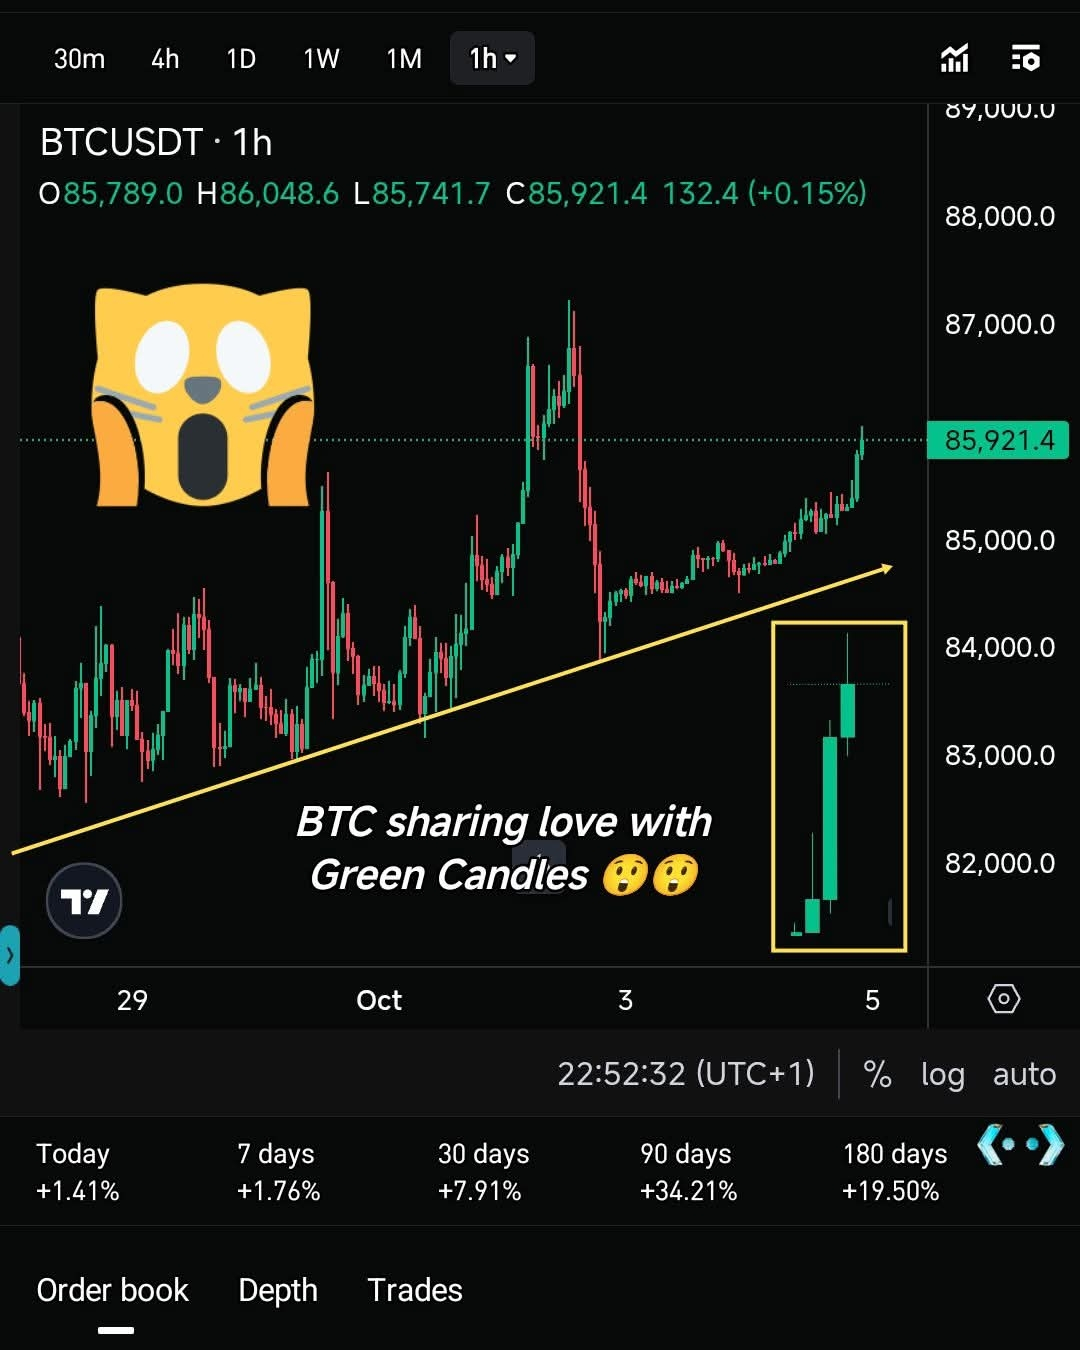
Bullish📈 $BTC USDT – Long Signal! 🚀
Current: 85,445.80 (+0.83%)
Why Long?
· Bounce from 83,680 support
· Order Book: 68.76% Buy 🟢
· 30D +7.31% | 90D +34.15%
Trade Setup:
· Entry: 85,400 – 85,500
· SL: 84,500
· T1: 86,495
· T2: 87,220
⚠️ Strict SL! Risk 2-3% only.
Click for trade 👇$BTC
#SECHaltsCryptoETFReviewsAmidFundingLapse #EthereumValidatorExitQueueJumps392% #GreekPoliceBustCryptoScamRingArrest17 #FedOctoberRateHikeOddsFallTo17%
Current: 85,445.80 (+0.83%)
Why Long?
· Bounce from 83,680 support
· Order Book: 68.76% Buy 🟢
· 30D +7.31% | 90D +34.15%
Trade Setup:
· Entry: 85,400 – 85,500
· SL: 84,500
· T1: 86,495
· T2: 87,220
⚠️ Strict SL! Risk 2-3% only.
Click for trade 👇$BTC
#SECHaltsCryptoETFReviewsAmidFundingLapse #EthereumValidatorExitQueueJumps392% #GreekPoliceBustCryptoScamRingArrest17 #FedOctoberRateHikeOddsFallTo17%
79
·
--
Bullish
XRP • BCH • 1INCH — Market Update
🟢 $XRP
{spot}(XRPUSDT)
: ~$1.50 — buyers are showing renewed strength.
🚀 $BCH
{spot}(BCHUSDT)
: ~$319 — holding strong after recent volatility.
⚡ $1INCH
{spot}(1INCHUSDT)
: ~$0.106 — slowly building momentum.
📊 My view: All three are worth watching, but confirmation through volume is important. If the overall market stays strong, these altcoins could see further upside.
#XRP #BCH #1INCH #Crypto #Altcoins #Trading
XRP • BCH • 1INCH — Market Update
🟢 $XRP
: ~$1.50 — buyers are showing renewed strength.
🚀 $BCH
: ~$319 — holding strong after recent volatility.
⚡ $1INCH
: ~$0.106 — slowly building momentum.
📊 My view: All three are worth watching, but confirmation through volume is important. If the overall market stays strong, these altcoins could see further upside.
#XRP #BCH #1INCH #Crypto #Altcoins #Trading
🟢 $XRP
: ~$1.50 — buyers are showing renewed strength.
🚀 $BCH
: ~$319 — holding strong after recent volatility.
⚡ $1INCH
: ~$0.106 — slowly building momentum.
📊 My view: All three are worth watching, but confirmation through volume is important. If the overall market stays strong, these altcoins could see further upside.
#XRP #BCH #1INCH #Crypto #Altcoins #Trading
312
·
--
Bullish
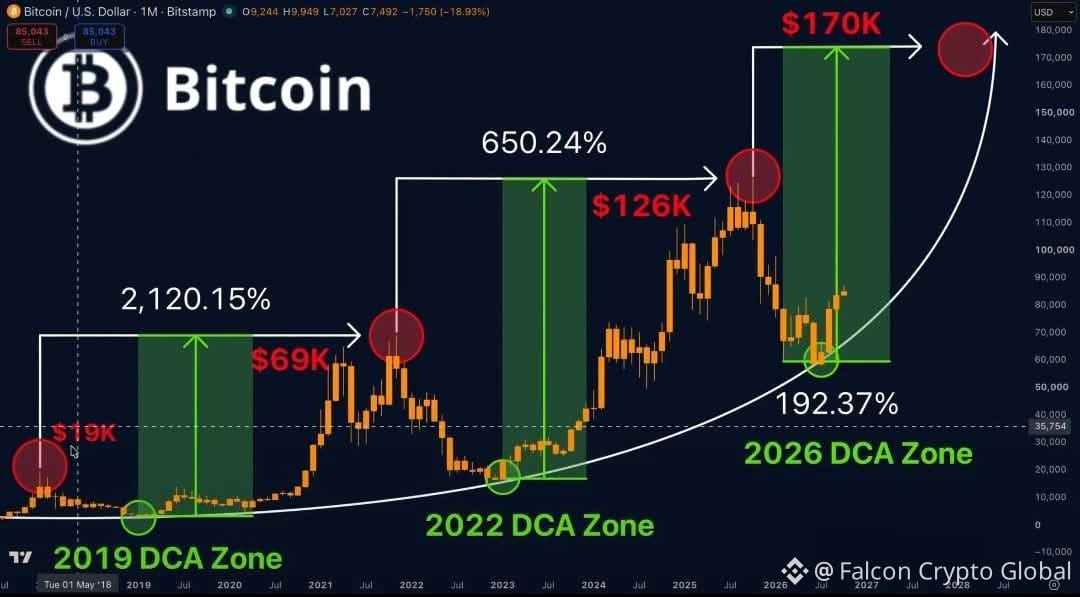
PLEASE DON'T MISS THE NEXT $BTC RALLY WAITING FOR $50K.
{spot}(BTCUSDT)
#Bitcoin already bounced from $58K to $85K. +47%.
Every DCA zone on this chart ended in a new all-time high.
$170K HERE WE COME!
#GreekPoliceBustCryptoScamRingArrest17 #FedOctoberRateHikeOddsFallTo17% #AlSyedTrader
PLEASE DON'T MISS THE NEXT $BTC RALLY WAITING FOR $50K.
#Bitcoin already bounced from $58K to $85K. +47%.
Every DCA zone on this chart ended in a new all-time high.
$170K HERE WE COME!
#GreekPoliceBustCryptoScamRingArrest17 #FedOctoberRateHikeOddsFallTo17% #AlSyedTrader
#Bitcoin already bounced from $58K to $85K. +47%.
Every DCA zone on this chart ended in a new all-time high.
$170K HERE WE COME!
#GreekPoliceBustCryptoScamRingArrest17 #FedOctoberRateHikeOddsFallTo17% #AlSyedTrader
114
Log in to explore more content
Join global crypto users on Binance Square
⚡️ Get latest and useful information about crypto.
💬 Trusted by the world’s largest crypto exchange.
👍 Discover real insights from verified creators.
Email / Phone number
Trending Topics
BinanceReopensWithdrawalsForMoreAssets
824,726 views
4,527 Discussing
Security Incident | Recovery Update #8: Withdrawals for More Assets to Reopen (2026-11-05)
Binance Announcement
·382 Likes
·1.7M views
Binance98PercentReplenished
174,363 views
1,812 Discussing
USStocksSlipandCryptoMarketUnderBroadPressure
8,824 views
215 Discussing