
#smc
smc
1.5M views
15,253 Discussing
Hot
Latest

·
--
BTC JUST SWEPT SELL-SIDE LIQUIDITY—NOW BULLS HAVE ONE JOB.
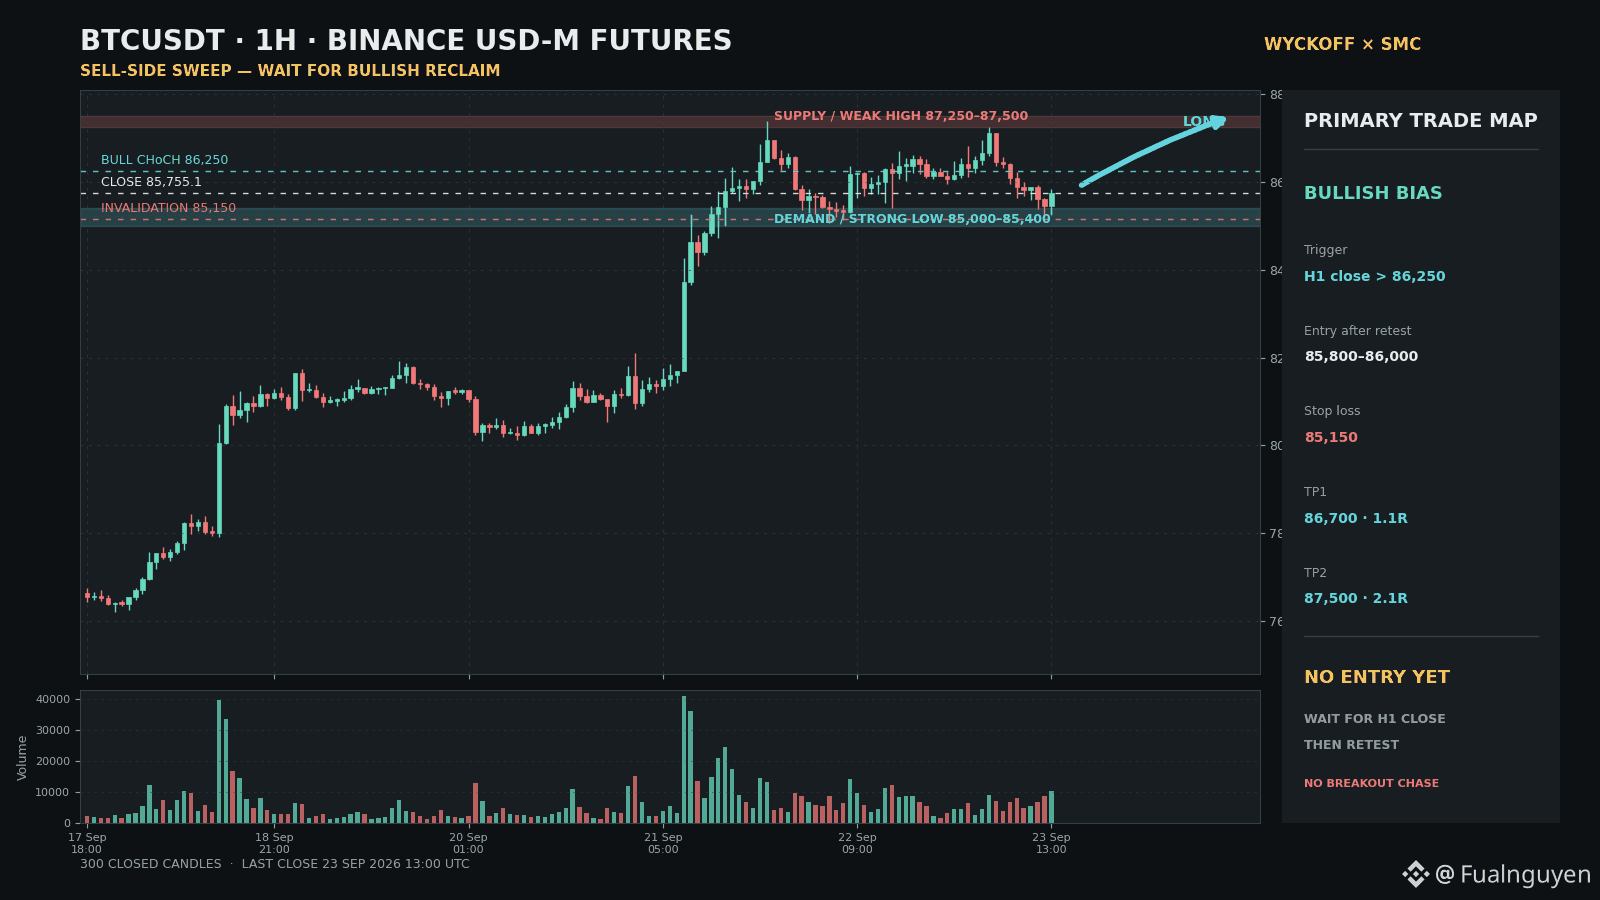
The latest confirmed BTCUSDT H1 Futures candle closed at $85,755.1.
The primary bias remains bullish for three reasons:
1️⃣ The broader H1 structure still holds higher highs and higher lows after the expansion from $74,909.
2️⃣ Price swept internal liquidity near $85,200, then closed back above $85,700.
3️⃣ The recovery candle printed 10.57K volume versus a 20-hour average of 5.78K—about 1.8× normal participation.
Wyckoff: BTC may be developing re-accumulation inside the $85,080–$87,385 range. SMC: the $85,080 Strong Low remains protected, while liquidity above the $87,385 Weak High is still unfinished business.
🟢 BULLISH SETUP
Trigger: H1 close above $86,250, then retest.
Entry: $85,800–$86,000
SL: $85,150
TP1: $86,700 (1.1R)
TP2: $87,500 (2.1R)
Invalidation: H1 close below $85,150.
STATUS: BULLISH BIAS — NO ENTRY YET.
The edge favors another attempt higher, but a liquidity sweep is not permission to chase. I want BTC to reclaim $86,250 and prove that the retest can hold.
Does this sweep become the next LPS—or will buyers fail at the reclaim? 👀
Paper analysis only. Not financial advice.
$BTC #Wyckoff #SMC
BTC JUST SWEPT SELL-SIDE LIQUIDITY—NOW BULLS HAVE ONE JOB.
The latest confirmed BTCUSDT H1 Futures candle closed at $85,755.1.
The primary bias remains bullish for three reasons:
1️⃣ The broader H1 structure still holds higher highs and higher lows after the expansion from $74,909.
2️⃣ Price swept internal liquidity near $85,200, then closed back above $85,700.
3️⃣ The recovery candle printed 10.57K volume versus a 20-hour average of 5.78K—about 1.8× normal participation.
Wyckoff: BTC may be developing re-accumulation inside the $85,080–$87,385 range. SMC: the $85,080 Strong Low remains protected, while liquidity above the $87,385 Weak High is still unfinished business.
🟢 BULLISH SETUP
Trigger: H1 close above $86,250, then retest.
Entry: $85,800–$86,000
SL: $85,150
TP1: $86,700 (1.1R)
TP2: $87,500 (2.1R)
Invalidation: H1 close below $85,150.
STATUS: BULLISH BIAS — NO ENTRY YET.
The edge favors another attempt higher, but a liquidity sweep is not permission to chase. I want BTC to reclaim $86,250 and prove that the retest can hold.
Does this sweep become the next LPS—or will buyers fail at the reclaim? 👀
Paper analysis only. Not financial advice.
$BTC #Wyckoff #SMC
The latest confirmed BTCUSDT H1 Futures candle closed at $85,755.1.
The primary bias remains bullish for three reasons:
1️⃣ The broader H1 structure still holds higher highs and higher lows after the expansion from $74,909.
2️⃣ Price swept internal liquidity near $85,200, then closed back above $85,700.
3️⃣ The recovery candle printed 10.57K volume versus a 20-hour average of 5.78K—about 1.8× normal participation.
Wyckoff: BTC may be developing re-accumulation inside the $85,080–$87,385 range. SMC: the $85,080 Strong Low remains protected, while liquidity above the $87,385 Weak High is still unfinished business.
🟢 BULLISH SETUP
Trigger: H1 close above $86,250, then retest.
Entry: $85,800–$86,000
SL: $85,150
TP1: $86,700 (1.1R)
TP2: $87,500 (2.1R)
Invalidation: H1 close below $85,150.
STATUS: BULLISH BIAS — NO ENTRY YET.
The edge favors another attempt higher, but a liquidity sweep is not permission to chase. I want BTC to reclaim $86,250 and prove that the retest can hold.
Does this sweep become the next LPS—or will buyers fail at the reclaim? 👀
Paper analysis only. Not financial advice.
$BTC #Wyckoff #SMC
1
2
1.4k

·
--
Tonight 21:00–23:00, a 120-minute livestream. First, let me state my stance—then we’ll talk about what we’ll cover tonight.
BTC has been consolidating around 86,000 all day. Retail traders see calm; I see buildup. The low around 85,400 was hit and pushed, but it didn’t break—meaning there’s likely buying support below. Meanwhile, the prior high at 87,300 is still being held down.
This kind of converging structure won’t take too long to pick a direction. Most likely, we’ll get the answer between tonight and early tomorrow morning. Which way it goes—during the livestream I’ll give a clear call. I won’t waste time with empty lines like “it depends.”
How will we structure the 120 minutes? First, I’ll lead with the BTC/ETH direction call—conclusion and reasoning will be laid out directly. Then the main event: SMC line-drawing teaching—how to mark FVG, how to verify the validity of order blocks, and how far liquidity must sweep before we can say the hunt is complete. Learn those three steps and you can draw any candlestick chart yourself. Next, we’ll do a war-room recap: the most recent few live trades—what’s correct is correct, what’s wrong is wrong, explained openly. Finally, we’ll leave plenty of time for interactive Q&A.
One more thing about ETH: it has been weaker today. The low at 2716 is a make-or-break line. If that’s lost, 2700 becomes the next chapter.
Tonight, in the livestream, what asset do you want to see? Comment it in the section below—the one with the highest demand will be prioritized.
Follow me: livestream every night at 21:00 + SMC teaching
🌿 Zhao (surname) not disclosed | Not investment advice
#BTC #ETH #SMC
Tonight 21:00–23:00, a 120-minute livestream. First, let me state my stance—then we’ll talk about what we’ll cover tonight.
BTC has been consolidating around 86,000 all day. Retail traders see calm; I see buildup. The low around 85,400 was hit and pushed, but it didn’t break—meaning there’s likely buying support below. Meanwhile, the prior high at 87,300 is still being held down.
This kind of converging structure won’t take too long to pick a direction. Most likely, we’ll get the answer between tonight and early tomorrow morning. Which way it goes—during the livestream I’ll give a clear call. I won’t waste time with empty lines like “it depends.”
How will we structure the 120 minutes? First, I’ll lead with the BTC/ETH direction call—conclusion and reasoning will be laid out directly. Then the main event: SMC line-drawing teaching—how to mark FVG, how to verify the validity of order blocks, and how far liquidity must sweep before we can say the hunt is complete. Learn those three steps and you can draw any candlestick chart yourself. Next, we’ll do a war-room recap: the most recent few live trades—what’s correct is correct, what’s wrong is wrong, explained openly. Finally, we’ll leave plenty of time for interactive Q&A.
One more thing about ETH: it has been weaker today. The low at 2716 is a make-or-break line. If that’s lost, 2700 becomes the next chapter.
Tonight, in the livestream, what asset do you want to see? Comment it in the section below—the one with the highest demand will be prioritized.
Follow me: livestream every night at 21:00 + SMC teaching
🌿 Zhao (surname) not disclosed | Not investment advice
#BTC #ETH #SMC
BTC has been consolidating around 86,000 all day. Retail traders see calm; I see buildup. The low around 85,400 was hit and pushed, but it didn’t break—meaning there’s likely buying support below. Meanwhile, the prior high at 87,300 is still being held down.
This kind of converging structure won’t take too long to pick a direction. Most likely, we’ll get the answer between tonight and early tomorrow morning. Which way it goes—during the livestream I’ll give a clear call. I won’t waste time with empty lines like “it depends.”
How will we structure the 120 minutes? First, I’ll lead with the BTC/ETH direction call—conclusion and reasoning will be laid out directly. Then the main event: SMC line-drawing teaching—how to mark FVG, how to verify the validity of order blocks, and how far liquidity must sweep before we can say the hunt is complete. Learn those three steps and you can draw any candlestick chart yourself. Next, we’ll do a war-room recap: the most recent few live trades—what’s correct is correct, what’s wrong is wrong, explained openly. Finally, we’ll leave plenty of time for interactive Q&A.
One more thing about ETH: it has been weaker today. The low at 2716 is a make-or-break line. If that’s lost, 2700 becomes the next chapter.
Tonight, in the livestream, what asset do you want to see? Comment it in the section below—the one with the highest demand will be prioritized.
Follow me: livestream every night at 21:00 + SMC teaching
🌿 Zhao (surname) not disclosed | Not investment advice
#BTC #ETH #SMC
1
1.4k
·
--
BNB JUST BROKE THE RANGE—THIS BOUNCE IS NOT A BUY SIGNAL.
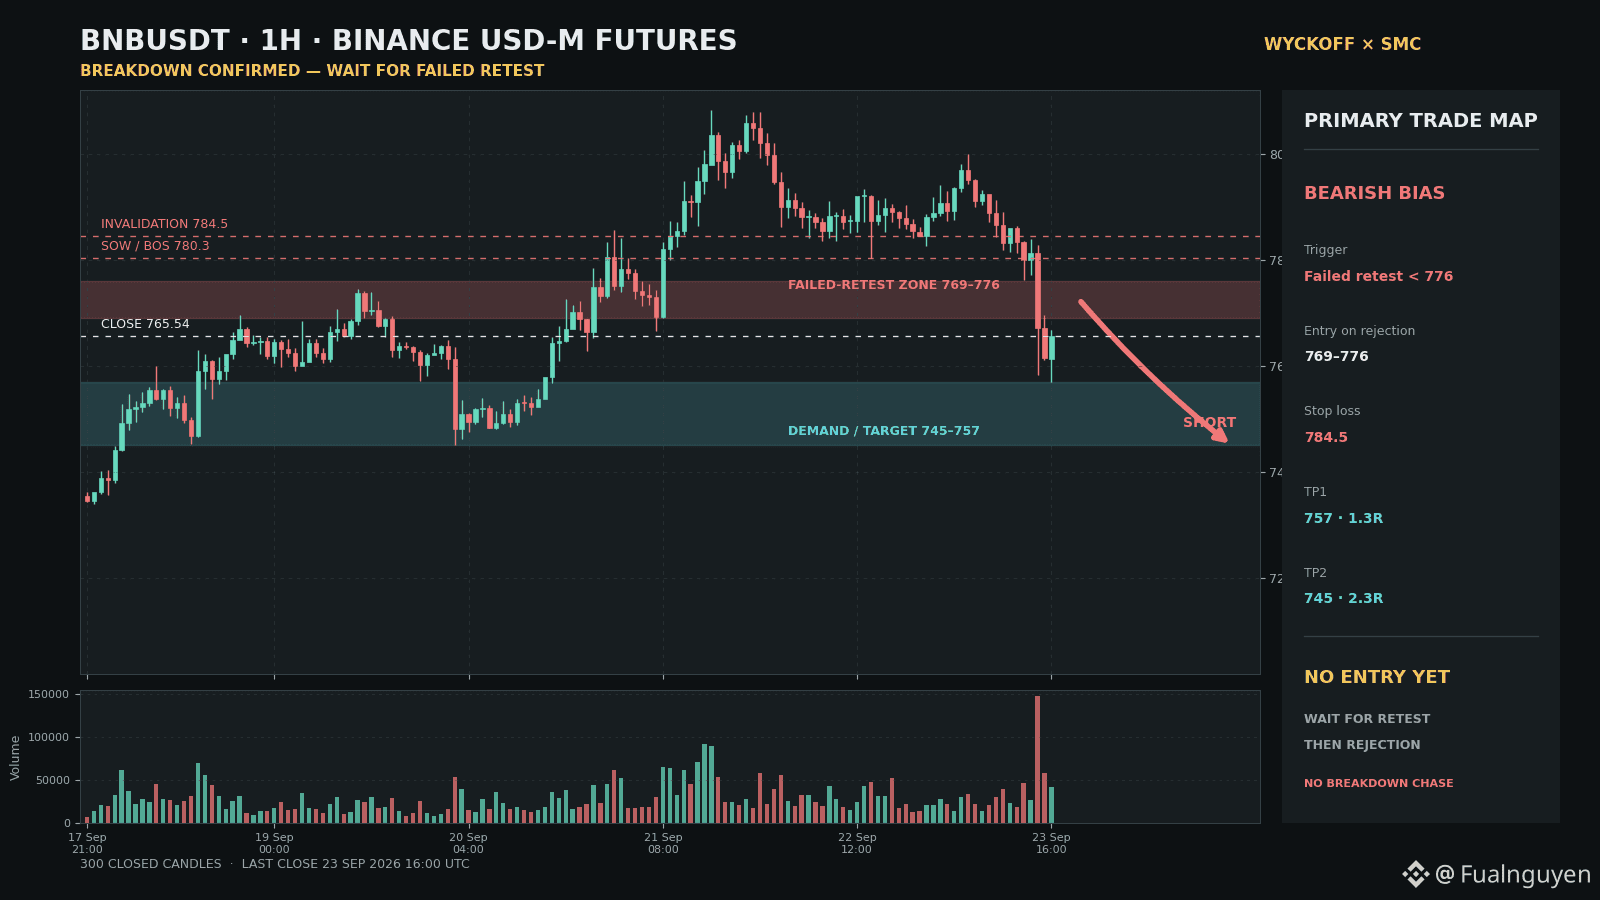
The latest confirmed BNBUSDT H1 Futures candle closed at $765.54.
The primary bias is bearish for three reasons:
1️⃣ Price formed lower highs after the $808.23 peak, including rejection near $799.98.
2️⃣ BNB closed below the $780.34 structural floor with clear bearish displacement.
3️⃣ Breakdown volume reached 147.11K versus a 20-hour average of 33.89K—more than 4.3× normal activity.
Wyckoff: the $780–$808 range may have completed a potential distribution and entered early markdown. SMC: the close below $780.34 confirmed SOW/BOS, turning former support into the next failed-retest zone.
🔴 BEARISH SETUP
Trigger: rejection from $769–$776.
Entry: $769–$776
SL: $784.50
TP1: $757 (1.3R)
TP2: $745 (2.3R)
Invalidation: H1 close above $784.50.
STATUS: BEARISH BIAS — NO ENTRY YET.
The direction favors lower prices, but BNB is already below the entry zone. Shorting the displacement now means chasing directly into demand. I want a retrace, rejection, and proof that buyers cannot reclaim broken structure.
Does BNB give traders the $769–$776 retest—or continue markdown without them? 👀
Paper analysis only. Not financial advice.
$BNB #Wyckoff #SMC
BNB JUST BROKE THE RANGE—THIS BOUNCE IS NOT A BUY SIGNAL.
The latest confirmed BNBUSDT H1 Futures candle closed at $765.54.
The primary bias is bearish for three reasons:
1️⃣ Price formed lower highs after the $808.23 peak, including rejection near $799.98.
2️⃣ BNB closed below the $780.34 structural floor with clear bearish displacement.
3️⃣ Breakdown volume reached 147.11K versus a 20-hour average of 33.89K—more than 4.3× normal activity.
Wyckoff: the $780–$808 range may have completed a potential distribution and entered early markdown. SMC: the close below $780.34 confirmed SOW/BOS, turning former support into the next failed-retest zone.
🔴 BEARISH SETUP
Trigger: rejection from $769–$776.
Entry: $769–$776
SL: $784.50
TP1: $757 (1.3R)
TP2: $745 (2.3R)
Invalidation: H1 close above $784.50.
STATUS: BEARISH BIAS — NO ENTRY YET.
The direction favors lower prices, but BNB is already below the entry zone. Shorting the displacement now means chasing directly into demand. I want a retrace, rejection, and proof that buyers cannot reclaim broken structure.
Does BNB give traders the $769–$776 retest—or continue markdown without them? 👀
Paper analysis only. Not financial advice.
$BNB #Wyckoff #SMC
The latest confirmed BNBUSDT H1 Futures candle closed at $765.54.
The primary bias is bearish for three reasons:
1️⃣ Price formed lower highs after the $808.23 peak, including rejection near $799.98.
2️⃣ BNB closed below the $780.34 structural floor with clear bearish displacement.
3️⃣ Breakdown volume reached 147.11K versus a 20-hour average of 33.89K—more than 4.3× normal activity.
Wyckoff: the $780–$808 range may have completed a potential distribution and entered early markdown. SMC: the close below $780.34 confirmed SOW/BOS, turning former support into the next failed-retest zone.
🔴 BEARISH SETUP
Trigger: rejection from $769–$776.
Entry: $769–$776
SL: $784.50
TP1: $757 (1.3R)
TP2: $745 (2.3R)
Invalidation: H1 close above $784.50.
STATUS: BEARISH BIAS — NO ENTRY YET.
The direction favors lower prices, but BNB is already below the entry zone. Shorting the displacement now means chasing directly into demand. I want a retrace, rejection, and proof that buyers cannot reclaim broken structure.
Does BNB give traders the $769–$776 retest—or continue markdown without them? 👀
Paper analysis only. Not financial advice.
$BNB #Wyckoff #SMC
1
3
271
·
--
ZEC IS BOUNCING—BUT SMART MONEY HAS NOT CONFIRMED CONTROL.
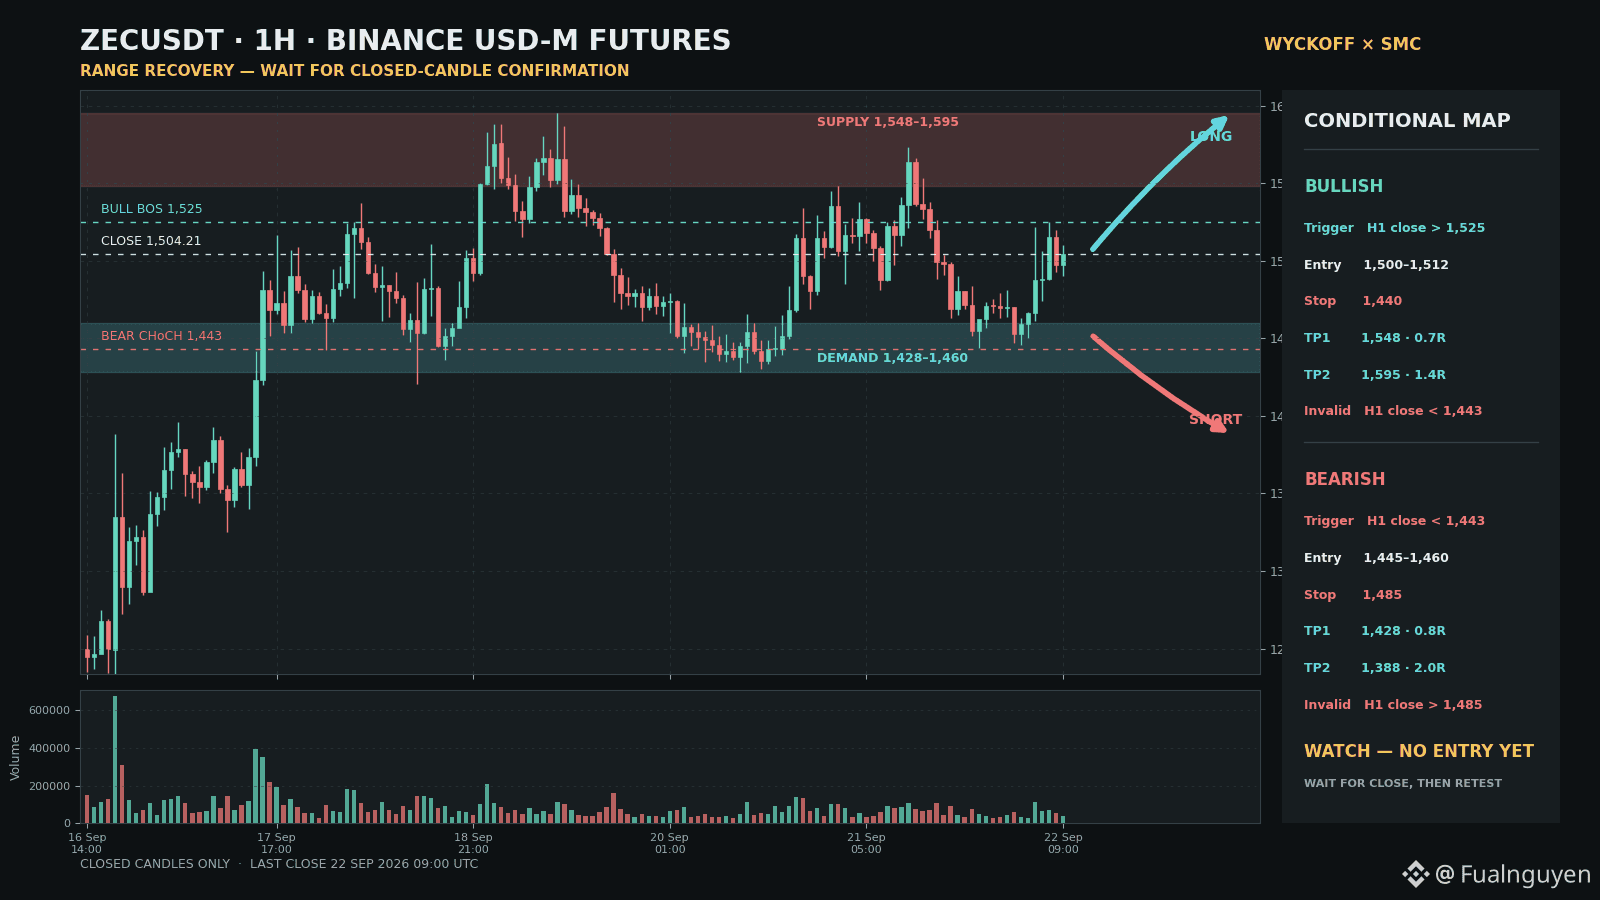
The latest confirmed ZECUSDT H1 Futures candle closed at $1,504.21.
After the markup from $1,041 to $1,595, price is now rotating inside a $1,428–$1,573 range. In Wyckoff terms, this could develop into re-accumulation or early distribution; neither phase is confirmed. In SMC terms, the recovery from $1,443.73 broke minor structure near $1,481, but price still has not closed above the $1,525 confirmation gate. The last candle’s volume was 37.3K versus a 20-hour average of 56.8K, so the bounce lacks expansion.
🟢 Bullish setup
Trigger: H1 close above $1,525, then retest.
Entry: $1,500–$1,512
SL: $1,440
TP1: $1,548 (0.7R)
TP2: $1,595 (1.4R)
Invalidation: H1 close below $1,443.
🔴 Bearish setup
Trigger: H1 close below $1,443, then failed retest.
Entry: $1,445–$1,460
SL: $1,485
TP1: $1,428 (0.8R)
TP2: $1,388 (2.0R)
Invalidation: H1 close above $1,485.
STATUS: WATCH — NO ENTRY YET.
The bullish map does not offer 2R to TP2, while the bearish trigger has not fired. The trap is chasing this recovery directly into supply—or shorting before demand actually breaks.
Which side confirms first: an H1 close above $1,525 or below $1,443? 👀
Paper analysis only. Not financial advice.
$ZEC #Wyckoff #SMC
ZEC IS BOUNCING—BUT SMART MONEY HAS NOT CONFIRMED CONTROL.
The latest confirmed ZECUSDT H1 Futures candle closed at $1,504.21.
After the markup from $1,041 to $1,595, price is now rotating inside a $1,428–$1,573 range. In Wyckoff terms, this could develop into re-accumulation or early distribution; neither phase is confirmed. In SMC terms, the recovery from $1,443.73 broke minor structure near $1,481, but price still has not closed above the $1,525 confirmation gate. The last candle’s volume was 37.3K versus a 20-hour average of 56.8K, so the bounce lacks expansion.
🟢 Bullish setup
Trigger: H1 close above $1,525, then retest.
Entry: $1,500–$1,512
SL: $1,440
TP1: $1,548 (0.7R)
TP2: $1,595 (1.4R)
Invalidation: H1 close below $1,443.
🔴 Bearish setup
Trigger: H1 close below $1,443, then failed retest.
Entry: $1,445–$1,460
SL: $1,485
TP1: $1,428 (0.8R)
TP2: $1,388 (2.0R)
Invalidation: H1 close above $1,485.
STATUS: WATCH — NO ENTRY YET.
The bullish map does not offer 2R to TP2, while the bearish trigger has not fired. The trap is chasing this recovery directly into supply—or shorting before demand actually breaks.
Which side confirms first: an H1 close above $1,525 or below $1,443? 👀
Paper analysis only. Not financial advice.
$ZEC #Wyckoff #SMC
The latest confirmed ZECUSDT H1 Futures candle closed at $1,504.21.
After the markup from $1,041 to $1,595, price is now rotating inside a $1,428–$1,573 range. In Wyckoff terms, this could develop into re-accumulation or early distribution; neither phase is confirmed. In SMC terms, the recovery from $1,443.73 broke minor structure near $1,481, but price still has not closed above the $1,525 confirmation gate. The last candle’s volume was 37.3K versus a 20-hour average of 56.8K, so the bounce lacks expansion.
🟢 Bullish setup
Trigger: H1 close above $1,525, then retest.
Entry: $1,500–$1,512
SL: $1,440
TP1: $1,548 (0.7R)
TP2: $1,595 (1.4R)
Invalidation: H1 close below $1,443.
🔴 Bearish setup
Trigger: H1 close below $1,443, then failed retest.
Entry: $1,445–$1,460
SL: $1,485
TP1: $1,428 (0.8R)
TP2: $1,388 (2.0R)
Invalidation: H1 close above $1,485.
STATUS: WATCH — NO ENTRY YET.
The bullish map does not offer 2R to TP2, while the bearish trigger has not fired. The trap is chasing this recovery directly into supply—or shorting before demand actually breaks.
Which side confirms first: an H1 close above $1,525 or below $1,443? 👀
Paper analysis only. Not financial advice.
$ZEC #Wyckoff #SMC
1
4
1.3k
·
--
UNI JUST SWEPT THE RANGE HIGH—THEN GAVE THE MOVE BACK.
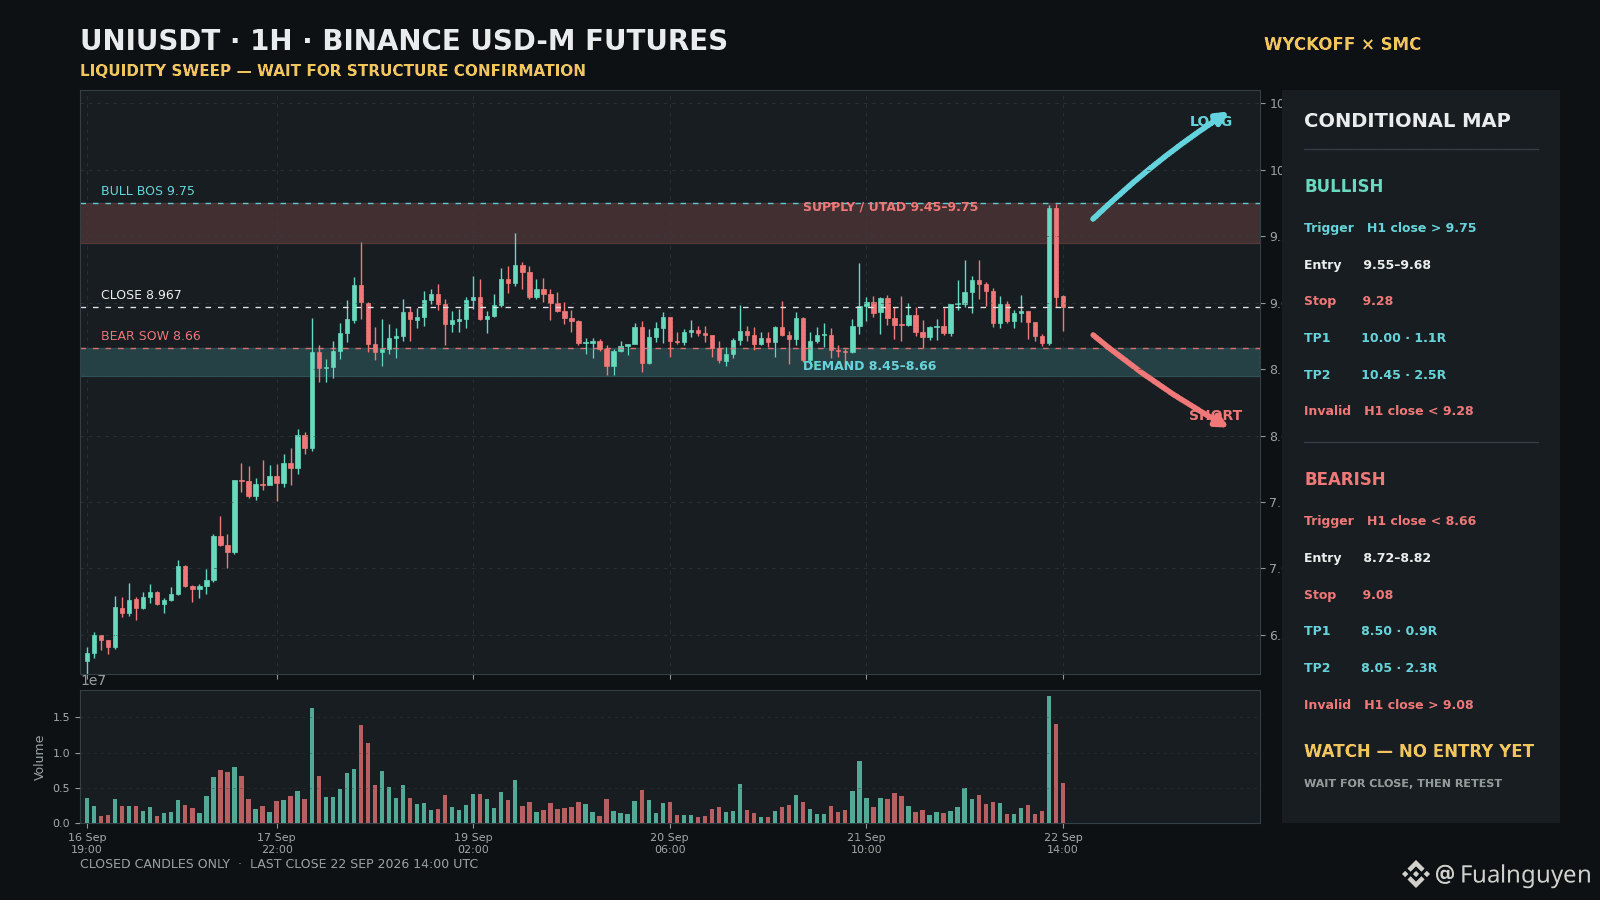
The latest confirmed UNIUSDT H1 Futures candle closed at $8.967.
After the markup from $5.994 to $9.522, price formed a broad $8.45–$9.52 trading range. UNI then spiked to $9.742 on 17.99M volume—over 4.6× the 20-hour average—before the next candle rejected to $9.046 on another 14.09M.
Wyckoff: this is a potential UTAD, not confirmed distribution. SMC: buy-side liquidity above $9.52 was swept, but bearish control still requires a closed-candle SOW below $8.66.
🟢 Bullish setup
Trigger: H1 close above $9.75, then retest.
Entry: $9.55–$9.68
SL: $9.28
TP1: $10.00 (1.1R)
TP2: $10.45 (2.5R)
Invalidation: H1 close below $9.28.
🔴 Bearish setup
Trigger: H1 close below $8.66, then failed retest.
Entry: $8.72–$8.82
SL: $9.08
TP1: $8.50 (0.9R)
TP2: $8.05 (2.3R)
Invalidation: H1 close above $9.08.
STATUS: WATCH — NO ENTRY YET.
Both maps can reach 2R at TP2, but neither has a confirmed trigger-and-retest sequence. The trap is shorting directly into demand—or buying a liquidity sweep before $9.75 is reclaimed.
Does UNI reclaim $9.75—or print SOW below $8.66 first? 👀
Paper analysis only. Not financial advice.
$UNI #Wyckoff #SMC
UNI JUST SWEPT THE RANGE HIGH—THEN GAVE THE MOVE BACK.
The latest confirmed UNIUSDT H1 Futures candle closed at $8.967.
After the markup from $5.994 to $9.522, price formed a broad $8.45–$9.52 trading range. UNI then spiked to $9.742 on 17.99M volume—over 4.6× the 20-hour average—before the next candle rejected to $9.046 on another 14.09M.
Wyckoff: this is a potential UTAD, not confirmed distribution. SMC: buy-side liquidity above $9.52 was swept, but bearish control still requires a closed-candle SOW below $8.66.
🟢 Bullish setup
Trigger: H1 close above $9.75, then retest.
Entry: $9.55–$9.68
SL: $9.28
TP1: $10.00 (1.1R)
TP2: $10.45 (2.5R)
Invalidation: H1 close below $9.28.
🔴 Bearish setup
Trigger: H1 close below $8.66, then failed retest.
Entry: $8.72–$8.82
SL: $9.08
TP1: $8.50 (0.9R)
TP2: $8.05 (2.3R)
Invalidation: H1 close above $9.08.
STATUS: WATCH — NO ENTRY YET.
Both maps can reach 2R at TP2, but neither has a confirmed trigger-and-retest sequence. The trap is shorting directly into demand—or buying a liquidity sweep before $9.75 is reclaimed.
Does UNI reclaim $9.75—or print SOW below $8.66 first? 👀
Paper analysis only. Not financial advice.
$UNI #Wyckoff #SMC
The latest confirmed UNIUSDT H1 Futures candle closed at $8.967.
After the markup from $5.994 to $9.522, price formed a broad $8.45–$9.52 trading range. UNI then spiked to $9.742 on 17.99M volume—over 4.6× the 20-hour average—before the next candle rejected to $9.046 on another 14.09M.
Wyckoff: this is a potential UTAD, not confirmed distribution. SMC: buy-side liquidity above $9.52 was swept, but bearish control still requires a closed-candle SOW below $8.66.
🟢 Bullish setup
Trigger: H1 close above $9.75, then retest.
Entry: $9.55–$9.68
SL: $9.28
TP1: $10.00 (1.1R)
TP2: $10.45 (2.5R)
Invalidation: H1 close below $9.28.
🔴 Bearish setup
Trigger: H1 close below $8.66, then failed retest.
Entry: $8.72–$8.82
SL: $9.08
TP1: $8.50 (0.9R)
TP2: $8.05 (2.3R)
Invalidation: H1 close above $9.08.
STATUS: WATCH — NO ENTRY YET.
Both maps can reach 2R at TP2, but neither has a confirmed trigger-and-retest sequence. The trap is shorting directly into demand—or buying a liquidity sweep before $9.75 is reclaimed.
Does UNI reclaim $9.75—or print SOW below $8.66 first? 👀
Paper analysis only. Not financial advice.
$UNI #Wyckoff #SMC
1
3
959
·
--
FVG fair value gap—most people misuse this indicator
I’ve seen too many people use FVG as support/resistance. Open the chart, spot a gap, draw a line—when price reaches it, go long. What happens then? You get swept with an intraday spike and stop-out, the gap never gets filled, and the trade is gone.
The problem isn’t FVG. The problem is that you only saw its shape—you didn’t understand its behavior.
━━━ The three most common misconceptions ━━━
Mistake 1: All gaps get filled
This is a beginner-level misunderstanding. The essence of an FVG is a liquidity vacuum—within a certain price range, there aren’t enough buy/sell matching orders, leaving a void. But the market is under no obligation to come back and fill that void. Some FVGs get filled in the next liquidity cycle, while others stay pinned there until the structure fully reverses.
If you trade with “the gap must be filled,” you’ve probably already lost most of your money.
Mistake 2: The midpoint of the FVG is the support level
This is a more common error. An FVG has three lines: the upper bound, the midpoint, and the lower bound. Most people only look at the midpoint and treat it as the support or resistance.
But in reality, the midpoint is the weakest position within that range—it’s the thinnest place for liquidity. When price reaches the midpoint, it’s not “getting supported.” It pauses temporarily due to a lack of opposing orders. Once new liquidity is injected, price will punch straight through.
Mistake 3: Using the FVG by itself
FVG is a dimension, not a complete system. It needs to be read together with Order Blocks, the liquidation map, and GEX. Trading by only looking at FVG is like playing only one card in poker.
━━━ Data reveals the truth ━━━
We ran systematic backtests on 6.5 years of historical data. The conclusion is straightforward:
The probability of an FVG being filled is negatively correlated with its age. Of the FVGs that were filled within the first 20 candles after forming, 68% were filled. For FVGs that went more than 50 candles without being filled, the fill probability drops to 23%. In other words, “fresh” FVGs are the real magnets; older FVGs are likely already invalid.
Each of the three FVG lines has its own job:
• Upper bound: the invalidation boundary. A break above the upper bound = the FVG structure is void
• Midpoint: the strongest magnet zone. Market makers tend to pull price to the midpoint to complete hedging
• Lower bound: the support/resistance flip zone. After the gap is filled, the lower bound becomes the anchor of the new structure
━━━ The correct approach ━━━
Step 1: Determine the direction of the FVG. Bull FVG (upward gap) has its magnet pointing upward; Bear FVG (downward gap) has its magnet pointing downward. This isn’t the concept of “support and resistance”—it’s the magnet’s direction.
Step 2: Validate effectiveness. Only FVGs that have not been traversed within 50 candles after formation are valid. If price already pierced through the FVG, that FVG is invalid and shouldn’t be used as a trade basis.
Step 3: Find confluence. One FVG alone isn’t enough. You need overlap of: the FVG midpoint + an effective Order Block + a liquidation-dense area. That’s what we call the “confluence point.” Only when 7 dimensions point to the same direction is the signal worth acting on.
Step 4: Place your stop loss outside the structure. For shorts, put the stop loss above the FVG upper bound; for longs, put it below the lower bound. Not because of some “technical level,” but because when those positions are broken, it means the FVG structure has already been invalidated—your trading rationale no longer exists.
━━━ Real-world example ━━━
Let’s use the most recent BTC move as an example. Around 85,500, price formed a Bull FVG. The lower bound of the range was 83,800; the midpoint was 84,600; and the upper bound was 85,400. Most people saw the “gap” at 84,600 and placed longs there. The result? Price first stabbed down to 83,800 to sweep the stop losses from the support pool, then rebounded.
That’s the market maker’s standard operation: pull price to the FVG magnet zone to complete hedging—but before that, hunt for liquidity below.
The correct approach would be: place longs near the support pool at 83,800, with a stop loss at 81,400 (below the FVG lower bound), and wait for price to get pulled back by the magnet. The short “stop-loss wall” at 87,200 follows the same logic—right-side GEX wall provides the safety net, and market makers will help hold it.
Remember this: an FVG doesn’t tell you where price will go—it tells you where market makers want to pull price. You should stand on the same side as the market maker, not fight against them.
#FVG #SMC #交易思维
FVG fair value gap—most people misuse this indicator
I’ve seen too many people use FVG as support/resistance. Open the chart, spot a gap, draw a line—when price reaches it, go long. What happens then? You get swept with an intraday spike and stop-out, the gap never gets filled, and the trade is gone.
The problem isn’t FVG. The problem is that you only saw its shape—you didn’t understand its behavior.
━━━ The three most common misconceptions ━━━
Mistake 1: All gaps get filled
This is a beginner-level misunderstanding. The essence of an FVG is a liquidity vacuum—within a certain price range, there aren’t enough buy/sell matching orders, leaving a void. But the market is under no obligation to come back and fill that void. Some FVGs get filled in the next liquidity cycle, while others stay pinned there until the structure fully reverses.
If you trade with “the gap must be filled,” you’ve probably already lost most of your money.
Mistake 2: The midpoint of the FVG is the support level
This is a more common error. An FVG has three lines: the upper bound, the midpoint, and the lower bound. Most people only look at the midpoint and treat it as the support or resistance.
But in reality, the midpoint is the weakest position within that range—it’s the thinnest place for liquidity. When price reaches the midpoint, it’s not “getting supported.” It pauses temporarily due to a lack of opposing orders. Once new liquidity is injected, price will punch straight through.
Mistake 3: Using the FVG by itself
FVG is a dimension, not a complete system. It needs to be read together with Order Blocks, the liquidation map, and GEX. Trading by only looking at FVG is like playing only one card in poker.
━━━ Data reveals the truth ━━━
We ran systematic backtests on 6.5 years of historical data. The conclusion is straightforward:
The probability of an FVG being filled is negatively correlated with its age. Of the FVGs that were filled within the first 20 candles after forming, 68% were filled. For FVGs that went more than 50 candles without being filled, the fill probability drops to 23%. In other words, “fresh” FVGs are the real magnets; older FVGs are likely already invalid.
Each of the three FVG lines has its own job:
• Upper bound: the invalidation boundary. A break above the upper bound = the FVG structure is void
• Midpoint: the strongest magnet zone. Market makers tend to pull price to the midpoint to complete hedging
• Lower bound: the support/resistance flip zone. After the gap is filled, the lower bound becomes the anchor of the new structure
━━━ The correct approach ━━━
Step 1: Determine the direction of the FVG. Bull FVG (upward gap) has its magnet pointing upward; Bear FVG (downward gap) has its magnet pointing downward. This isn’t the concept of “support and resistance”—it’s the magnet’s direction.
Step 2: Validate effectiveness. Only FVGs that have not been traversed within 50 candles after formation are valid. If price already pierced through the FVG, that FVG is invalid and shouldn’t be used as a trade basis.
Step 3: Find confluence. One FVG alone isn’t enough. You need overlap of: the FVG midpoint + an effective Order Block + a liquidation-dense area. That’s what we call the “confluence point.” Only when 7 dimensions point to the same direction is the signal worth acting on.
Step 4: Place your stop loss outside the structure. For shorts, put the stop loss above the FVG upper bound; for longs, put it below the lower bound. Not because of some “technical level,” but because when those positions are broken, it means the FVG structure has already been invalidated—your trading rationale no longer exists.
━━━ Real-world example ━━━
Let’s use the most recent BTC move as an example. Around 85,500, price formed a Bull FVG. The lower bound of the range was 83,800; the midpoint was 84,600; and the upper bound was 85,400. Most people saw the “gap” at 84,600 and placed longs there. The result? Price first stabbed down to 83,800 to sweep the stop losses from the support pool, then rebounded.
That’s the market maker’s standard operation: pull price to the FVG magnet zone to complete hedging—but before that, hunt for liquidity below.
The correct approach would be: place longs near the support pool at 83,800, with a stop loss at 81,400 (below the FVG lower bound), and wait for price to get pulled back by the magnet. The short “stop-loss wall” at 87,200 follows the same logic—right-side GEX wall provides the safety net, and market makers will help hold it.
Remember this: an FVG doesn’t tell you where price will go—it tells you where market makers want to pull price. You should stand on the same side as the market maker, not fight against them.
#FVG #SMC #交易思维
I’ve seen too many people use FVG as support/resistance. Open the chart, spot a gap, draw a line—when price reaches it, go long. What happens then? You get swept with an intraday spike and stop-out, the gap never gets filled, and the trade is gone.
The problem isn’t FVG. The problem is that you only saw its shape—you didn’t understand its behavior.
━━━ The three most common misconceptions ━━━
Mistake 1: All gaps get filled
This is a beginner-level misunderstanding. The essence of an FVG is a liquidity vacuum—within a certain price range, there aren’t enough buy/sell matching orders, leaving a void. But the market is under no obligation to come back and fill that void. Some FVGs get filled in the next liquidity cycle, while others stay pinned there until the structure fully reverses.
If you trade with “the gap must be filled,” you’ve probably already lost most of your money.
Mistake 2: The midpoint of the FVG is the support level
This is a more common error. An FVG has three lines: the upper bound, the midpoint, and the lower bound. Most people only look at the midpoint and treat it as the support or resistance.
But in reality, the midpoint is the weakest position within that range—it’s the thinnest place for liquidity. When price reaches the midpoint, it’s not “getting supported.” It pauses temporarily due to a lack of opposing orders. Once new liquidity is injected, price will punch straight through.
Mistake 3: Using the FVG by itself
FVG is a dimension, not a complete system. It needs to be read together with Order Blocks, the liquidation map, and GEX. Trading by only looking at FVG is like playing only one card in poker.
━━━ Data reveals the truth ━━━
We ran systematic backtests on 6.5 years of historical data. The conclusion is straightforward:
The probability of an FVG being filled is negatively correlated with its age. Of the FVGs that were filled within the first 20 candles after forming, 68% were filled. For FVGs that went more than 50 candles without being filled, the fill probability drops to 23%. In other words, “fresh” FVGs are the real magnets; older FVGs are likely already invalid.
Each of the three FVG lines has its own job:
• Upper bound: the invalidation boundary. A break above the upper bound = the FVG structure is void
• Midpoint: the strongest magnet zone. Market makers tend to pull price to the midpoint to complete hedging
• Lower bound: the support/resistance flip zone. After the gap is filled, the lower bound becomes the anchor of the new structure
━━━ The correct approach ━━━
Step 1: Determine the direction of the FVG. Bull FVG (upward gap) has its magnet pointing upward; Bear FVG (downward gap) has its magnet pointing downward. This isn’t the concept of “support and resistance”—it’s the magnet’s direction.
Step 2: Validate effectiveness. Only FVGs that have not been traversed within 50 candles after formation are valid. If price already pierced through the FVG, that FVG is invalid and shouldn’t be used as a trade basis.
Step 3: Find confluence. One FVG alone isn’t enough. You need overlap of: the FVG midpoint + an effective Order Block + a liquidation-dense area. That’s what we call the “confluence point.” Only when 7 dimensions point to the same direction is the signal worth acting on.
Step 4: Place your stop loss outside the structure. For shorts, put the stop loss above the FVG upper bound; for longs, put it below the lower bound. Not because of some “technical level,” but because when those positions are broken, it means the FVG structure has already been invalidated—your trading rationale no longer exists.
━━━ Real-world example ━━━
Let’s use the most recent BTC move as an example. Around 85,500, price formed a Bull FVG. The lower bound of the range was 83,800; the midpoint was 84,600; and the upper bound was 85,400. Most people saw the “gap” at 84,600 and placed longs there. The result? Price first stabbed down to 83,800 to sweep the stop losses from the support pool, then rebounded.
That’s the market maker’s standard operation: pull price to the FVG magnet zone to complete hedging—but before that, hunt for liquidity below.
The correct approach would be: place longs near the support pool at 83,800, with a stop loss at 81,400 (below the FVG lower bound), and wait for price to get pulled back by the magnet. The short “stop-loss wall” at 87,200 follows the same logic—right-side GEX wall provides the safety net, and market makers will help hold it.
Remember this: an FVG doesn’t tell you where price will go—it tells you where market makers want to pull price. You should stand on the same side as the market maker, not fight against them.
#FVG #SMC #交易思维
2
583
·
--
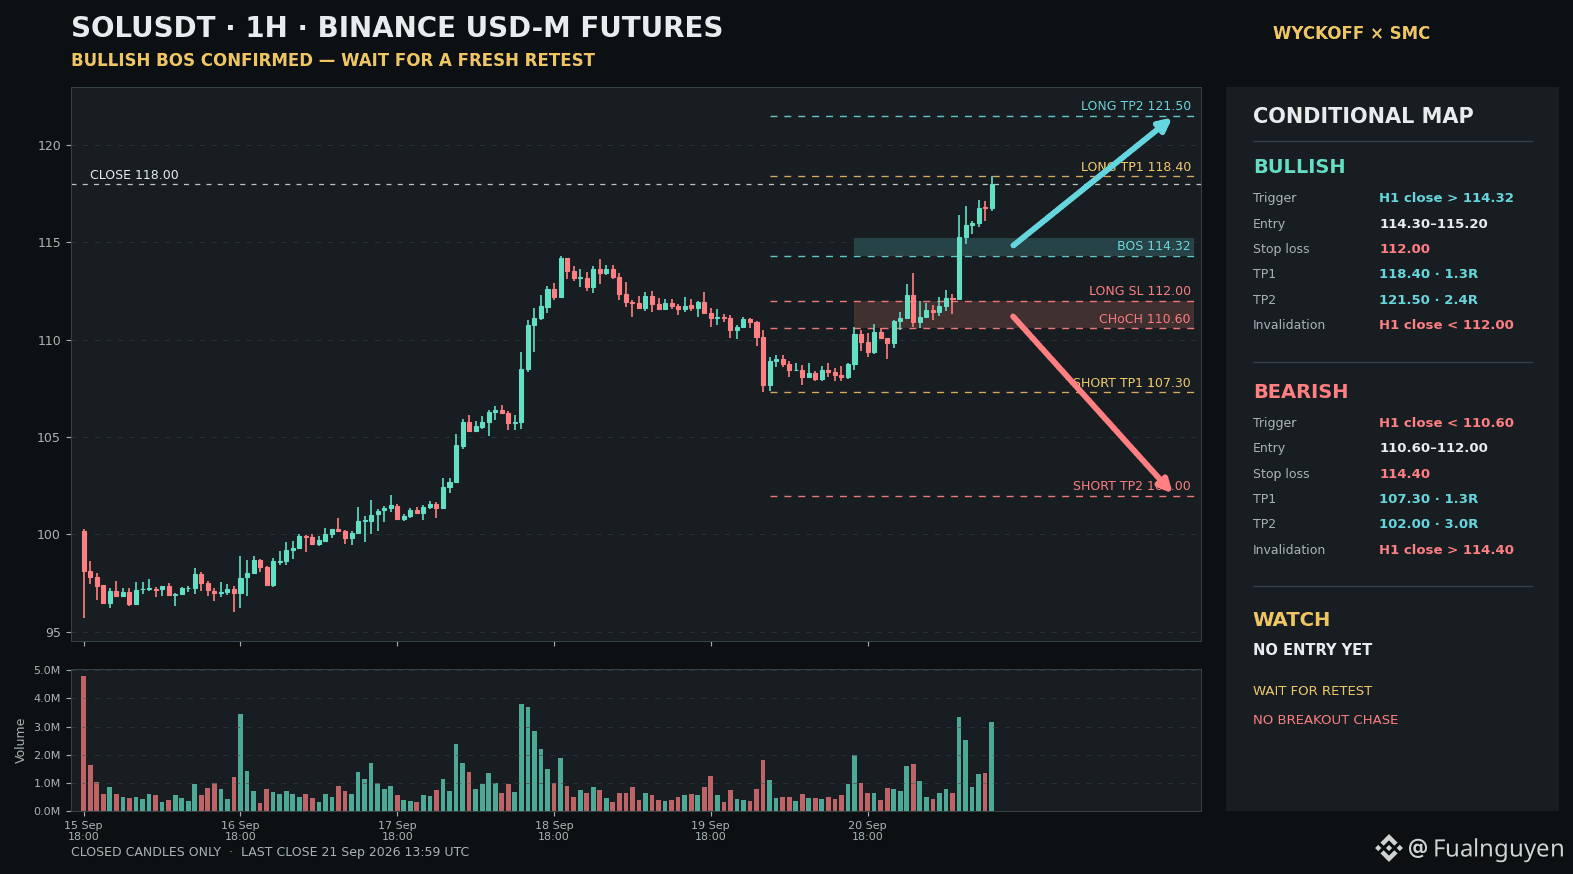
SOL BROKE THE RANGE—BUT THE CLEAN ENTRY IS ALREADY BEHIND CURRENT PRICE.
$SOL’s latest confirmed H1 candle closed at $118.00. The displacement through $114.32 printed on 4.01× its prior 20-candle average volume. Price retested $114.91 and held; the latest candle then expanded on 2.92× volume.
Wyckoff: $95.72 may mark SC, $97.70 AR and $96.02–$96.33 ST before a potential SOS through $102 and $114.32. The $107.34 reaction may be an LPS. These labels remain provisional.
SMC: bullish BOS is confirmed above $114.32. $110.59 is the broader Strong Low; $118.38 is the immediate Weak High.
🟢 Bullish: wait for a fresh retest—do not chase. Entry $114.30–$115.20; SL $112.00; TP1 $118.40 (1.3R); TP2 $121.50 (2.4R). Invalid on an H1 close below $112.00.
🔴 Bearish: only after an H1 close below $110.60 and a failed reclaim of $110.60–$112.00. SL $114.40; TP1 $107.30 (1.3R); TP2 $102.00 (3.0R). Invalid above $114.40.
Status: WATCH — NO ENTRY YET.
The trap is treating confirmed direction as permission to buy any price. Structure is bullish; location is not.
Does SOL revisit $115 before continuation—or force late buyers to defend $118 first? 👀
Paper analysis only. Not financial advice.
$SOL #Wyckoff #SMC
SOL BROKE THE RANGE—BUT THE CLEAN ENTRY IS ALREADY BEHIND CURRENT PRICE.
$SOL ’s latest confirmed H1 candle closed at $118.00. The displacement through $114.32 printed on 4.01× its prior 20-candle average volume. Price retested $114.91 and held; the latest candle then expanded on 2.92× volume.
Wyckoff: $95.72 may mark SC, $97.70 AR and $96.02–$96.33 ST before a potential SOS through $102 and $114.32. The $107.34 reaction may be an LPS. These labels remain provisional.
SMC: bullish BOS is confirmed above $114.32. $110.59 is the broader Strong Low; $118.38 is the immediate Weak High.
🟢 Bullish: wait for a fresh retest—do not chase. Entry $114.30–$115.20; SL $112.00; TP1 $118.40 (1.3R); TP2 $121.50 (2.4R). Invalid on an H1 close below $112.00.
🔴 Bearish: only after an H1 close below $110.60 and a failed reclaim of $110.60–$112.00. SL $114.40; TP1 $107.30 (1.3R); TP2 $102.00 (3.0R). Invalid above $114.40.
Status: WATCH — NO ENTRY YET.
The trap is treating confirmed direction as permission to buy any price. Structure is bullish; location is not.
Does SOL revisit $115 before continuation—or force late buyers to defend $118 first? 👀
Paper analysis only. Not financial advice.
$SOL #Wyckoff #SMC
$SOL ’s latest confirmed H1 candle closed at $118.00. The displacement through $114.32 printed on 4.01× its prior 20-candle average volume. Price retested $114.91 and held; the latest candle then expanded on 2.92× volume.
Wyckoff: $95.72 may mark SC, $97.70 AR and $96.02–$96.33 ST before a potential SOS through $102 and $114.32. The $107.34 reaction may be an LPS. These labels remain provisional.
SMC: bullish BOS is confirmed above $114.32. $110.59 is the broader Strong Low; $118.38 is the immediate Weak High.
🟢 Bullish: wait for a fresh retest—do not chase. Entry $114.30–$115.20; SL $112.00; TP1 $118.40 (1.3R); TP2 $121.50 (2.4R). Invalid on an H1 close below $112.00.
🔴 Bearish: only after an H1 close below $110.60 and a failed reclaim of $110.60–$112.00. SL $114.40; TP1 $107.30 (1.3R); TP2 $102.00 (3.0R). Invalid above $114.40.
Status: WATCH — NO ENTRY YET.
The trap is treating confirmed direction as permission to buy any price. Structure is bullish; location is not.
Does SOL revisit $115 before continuation—or force late buyers to defend $118 first? 👀
Paper analysis only. Not financial advice.
$SOL #Wyckoff #SMC
1
2
1.3k
·
--
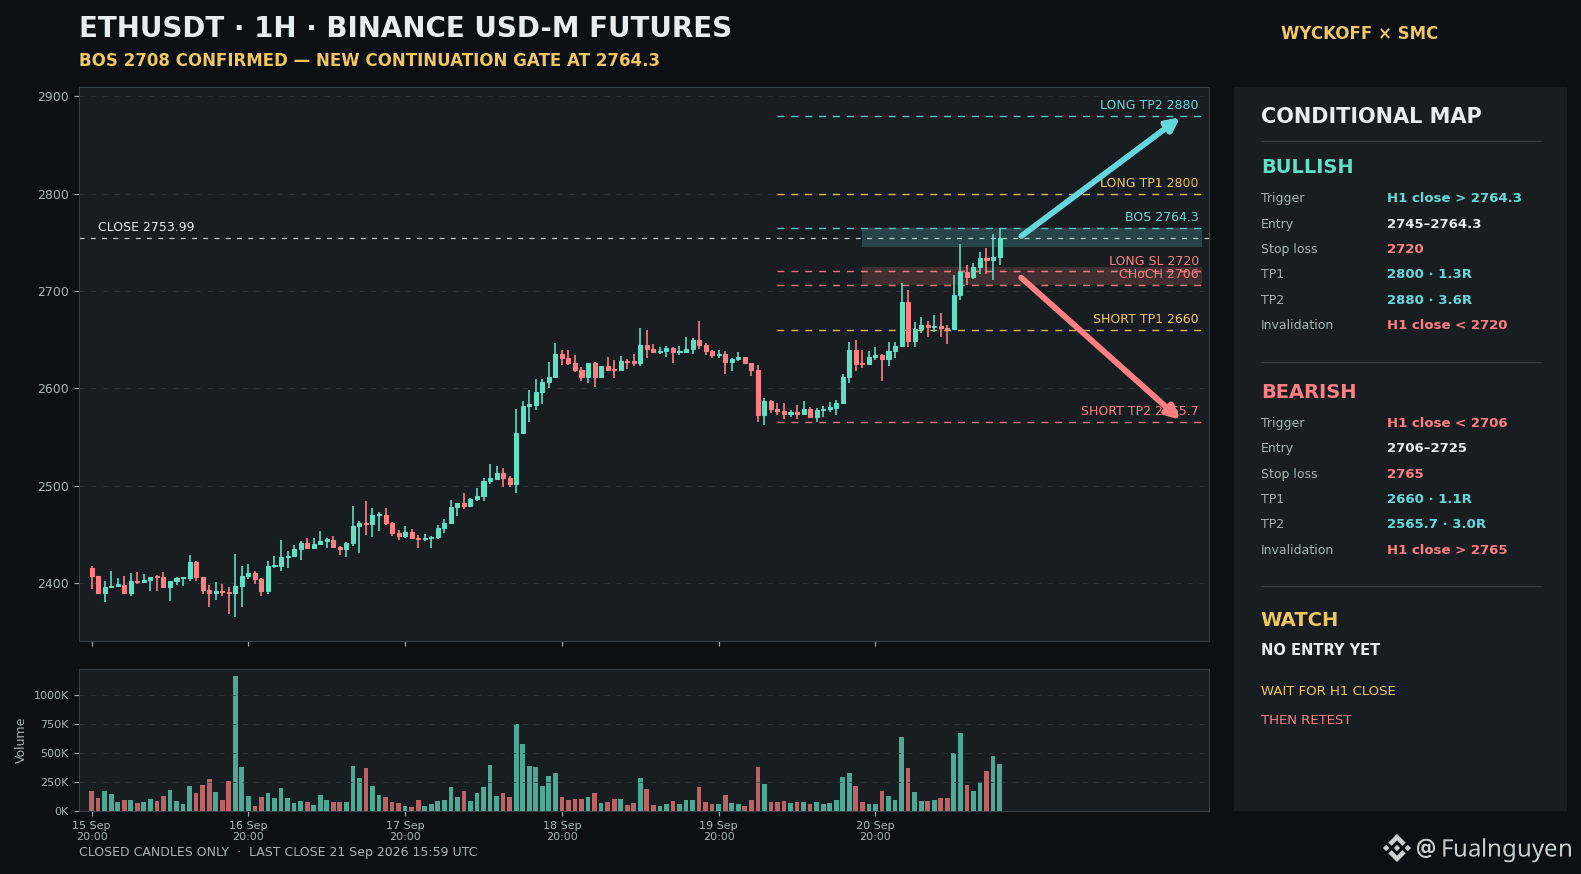
ETH CLEARED THE LAST MAP—NOW THE OLD ENTRY IS GONE.
$ETH’s latest confirmed H1 candle closed at $2,753.99. The prior $2,708 Weak High has become a confirmed BOS: the breakout sequence closed at $2,719.63 on 3.59× its prior 20-candle average volume, retested $2,706 and held. Price then printed a new Weak High at $2,764.27.
Wyckoff: $2,357 may mark SC, $2,429.9 AR and $2,365 ST before the SOS through $2,521.8 and $2,708. The $2,642–$2,645 reaction may be the latest LPS. Labels remain provisional.
SMC: bullish structure remains intact, but $2,764.3 is now the continuation gate. Demand sits at $2,706–$2,725; the immediate liquidity target is above $2,764.3.
🟢 Bullish: require an H1 close above $2,764.3, then a retest—not a breakout chase. Entry $2,745–$2,764.3; SL $2,720; TP1 $2,800 (1.3R); TP2 $2,880 (3.6R). Invalid below $2,720.
🔴 Bearish: only after an H1 close below $2,706 and a failed reclaim of $2,706–$2,725. SL $2,765; TP1 $2,660 (1.1R); TP2 $2,565.7 (3.0R). Invalid above $2,765.
Status: WATCH — NO ENTRY YET.
The trap is buying because the previous target was reached. A completed move is not automatically a fresh setup.
Does ETH convert $2,764 into support—or sweep that high before returning to demand? 👀
Paper analysis only. Not financial advice.
$ETH #Wyckoff #SMC
ETH CLEARED THE LAST MAP—NOW THE OLD ENTRY IS GONE.
$ETH ’s latest confirmed H1 candle closed at $2,753.99. The prior $2,708 Weak High has become a confirmed BOS: the breakout sequence closed at $2,719.63 on 3.59× its prior 20-candle average volume, retested $2,706 and held. Price then printed a new Weak High at $2,764.27.
Wyckoff: $2,357 may mark SC, $2,429.9 AR and $2,365 ST before the SOS through $2,521.8 and $2,708. The $2,642–$2,645 reaction may be the latest LPS. Labels remain provisional.
SMC: bullish structure remains intact, but $2,764.3 is now the continuation gate. Demand sits at $2,706–$2,725; the immediate liquidity target is above $2,764.3.
🟢 Bullish: require an H1 close above $2,764.3, then a retest—not a breakout chase. Entry $2,745–$2,764.3; SL $2,720; TP1 $2,800 (1.3R); TP2 $2,880 (3.6R). Invalid below $2,720.
🔴 Bearish: only after an H1 close below $2,706 and a failed reclaim of $2,706–$2,725. SL $2,765; TP1 $2,660 (1.1R); TP2 $2,565.7 (3.0R). Invalid above $2,765.
Status: WATCH — NO ENTRY YET.
The trap is buying because the previous target was reached. A completed move is not automatically a fresh setup.
Does ETH convert $2,764 into support—or sweep that high before returning to demand? 👀
Paper analysis only. Not financial advice.
$ETH #Wyckoff #SMC
$ETH ’s latest confirmed H1 candle closed at $2,753.99. The prior $2,708 Weak High has become a confirmed BOS: the breakout sequence closed at $2,719.63 on 3.59× its prior 20-candle average volume, retested $2,706 and held. Price then printed a new Weak High at $2,764.27.
Wyckoff: $2,357 may mark SC, $2,429.9 AR and $2,365 ST before the SOS through $2,521.8 and $2,708. The $2,642–$2,645 reaction may be the latest LPS. Labels remain provisional.
SMC: bullish structure remains intact, but $2,764.3 is now the continuation gate. Demand sits at $2,706–$2,725; the immediate liquidity target is above $2,764.3.
🟢 Bullish: require an H1 close above $2,764.3, then a retest—not a breakout chase. Entry $2,745–$2,764.3; SL $2,720; TP1 $2,800 (1.3R); TP2 $2,880 (3.6R). Invalid below $2,720.
🔴 Bearish: only after an H1 close below $2,706 and a failed reclaim of $2,706–$2,725. SL $2,765; TP1 $2,660 (1.1R); TP2 $2,565.7 (3.0R). Invalid above $2,765.
Status: WATCH — NO ENTRY YET.
The trap is buying because the previous target was reached. A completed move is not automatically a fresh setup.
Does ETH convert $2,764 into support—or sweep that high before returning to demand? 👀
Paper analysis only. Not financial advice.
$ETH #Wyckoff #SMC
1
363

·
--
Bullish
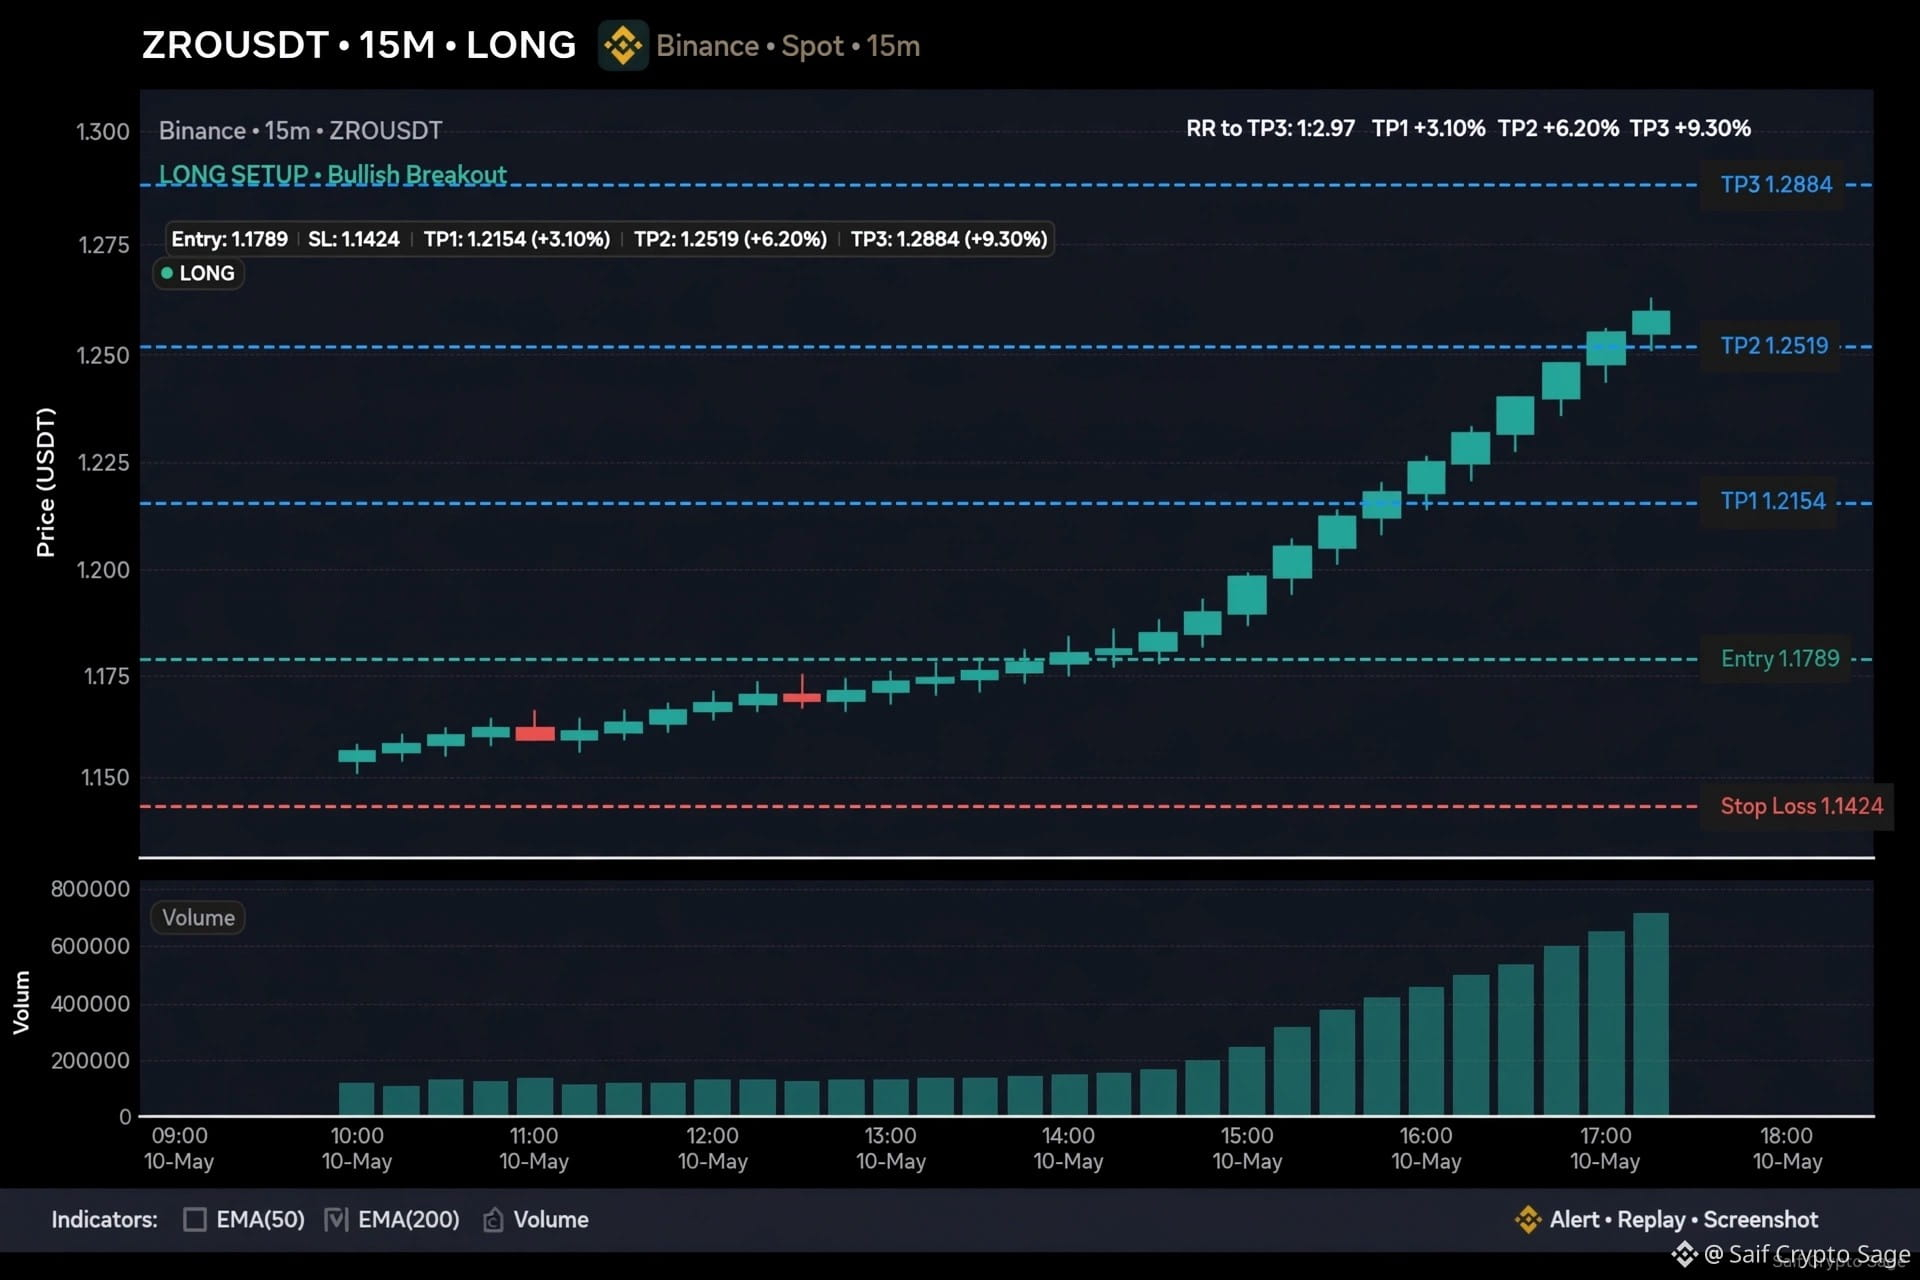
🟢 LONG SETUP | $ZRO USDT
Coin: ZROUSDT
Timeframe: 15M
Direction: LONG
Entry: 1.1789
Stop Loss: 1.1424
Targets:
TP1: 1.2154
TP2: 1.2519
TP3: 1.2884
Analysis:
Price sweeping sell-side liquidity and showing bullish displacement on 15M. Expecting continuation towards buy-side after FVG fill. Clean invalidation below SL.
Risk Management: Use proper position sizing. Close 50% at TP1 and move SL to breakeven.
This is not financial advice. Trade at your own risk.
#ZRO #CryptoSignals #SMC #BinanceSquare
Trade here👇👇👇
$ZRO
{future}(ZROUSDT)
🟢 LONG SETUP | $ZRO USDT
Coin: ZROUSDT
Timeframe: 15M
Direction: LONG
Entry: 1.1789
Stop Loss: 1.1424
Targets:
TP1: 1.2154
TP2: 1.2519
TP3: 1.2884
Analysis:
Price sweeping sell-side liquidity and showing bullish displacement on 15M. Expecting continuation towards buy-side after FVG fill. Clean invalidation below SL.
Risk Management: Use proper position sizing. Close 50% at TP1 and move SL to breakeven.
This is not financial advice. Trade at your own risk.
#ZRO #CryptoSignals #SMC #BinanceSquare
Trade here👇👇👇
$ZRO
Coin: ZROUSDT
Timeframe: 15M
Direction: LONG
Entry: 1.1789
Stop Loss: 1.1424
Targets:
TP1: 1.2154
TP2: 1.2519
TP3: 1.2884
Analysis:
Price sweeping sell-side liquidity and showing bullish displacement on 15M. Expecting continuation towards buy-side after FVG fill. Clean invalidation below SL.
Risk Management: Use proper position sizing. Close 50% at TP1 and move SL to breakeven.
This is not financial advice. Trade at your own risk.
#ZRO #CryptoSignals #SMC #BinanceSquare
Trade here👇👇👇
$ZRO
1
109
·
--
Bullish
WE ARE BACK. STRONGER. SMARTER. READY TO DOMINATE. 🚀
After weeks of silent building, backtesting, and refining our SMC + Liquidity strategy, Saif Crypto Sage is officially BACK on Binance Square.
No hype. No fake screenshots. Just pure price action, real setups, and consistent execution.
What you will get from now on:
✅ Daily Market Analysis (BTC, ETH & Top Altcoins)
✅ High-Probability Setups (FVG + Order Block + Liquidity Sweep)
✅ Smart Money Concepts Explained in Simple Language
✅ 100% Transparency - No Gambling, Only Calculated Trades
The market is heating up and massive opportunities are coming. The question is - are you ready to take them with us?
Hit Follow + Turn on Notifications. We start RIGHT NOW. Let's make this bull run count.
#BTC #ETH #CryptoTrading #SMC #ICT #BinanceSquare #CryptoEducation
$NEAR
{future}(NEARUSDT)
$FIL
{future}(FILUSDT)
$ETH
{future}(ETHUSDT)
WE ARE BACK. STRONGER. SMARTER. READY TO DOMINATE. 🚀
After weeks of silent building, backtesting, and refining our SMC + Liquidity strategy, Saif Crypto Sage is officially BACK on Binance Square.
No hype. No fake screenshots. Just pure price action, real setups, and consistent execution.
What you will get from now on:
✅ Daily Market Analysis (BTC, ETH & Top Altcoins)
✅ High-Probability Setups (FVG + Order Block + Liquidity Sweep)
✅ Smart Money Concepts Explained in Simple Language
✅ 100% Transparency - No Gambling, Only Calculated Trades
The market is heating up and massive opportunities are coming. The question is - are you ready to take them with us?
Hit Follow + Turn on Notifications. We start RIGHT NOW. Let's make this bull run count.
#BTC #ETH #CryptoTrading #SMC #ICT #BinanceSquare #CryptoEducation
$NEAR
$FIL
$ETH
After weeks of silent building, backtesting, and refining our SMC + Liquidity strategy, Saif Crypto Sage is officially BACK on Binance Square.
No hype. No fake screenshots. Just pure price action, real setups, and consistent execution.
What you will get from now on:
✅ Daily Market Analysis (BTC, ETH & Top Altcoins)
✅ High-Probability Setups (FVG + Order Block + Liquidity Sweep)
✅ Smart Money Concepts Explained in Simple Language
✅ 100% Transparency - No Gambling, Only Calculated Trades
The market is heating up and massive opportunities are coming. The question is - are you ready to take them with us?
Hit Follow + Turn on Notifications. We start RIGHT NOW. Let's make this bull run count.
#BTC #ETH #CryptoTrading #SMC #ICT #BinanceSquare #CryptoEducation
$NEAR
$FIL
$ETH
1
246

EPIC is battling a tight range as sellers eye the 1.7% risk‑reward target. A break below the 0.9850 level would lock in the short bias.
🔴 $EPIC SHORT 📉
Entry → $0.450949-$0.451851
Stop → $0.464942 (-3.0%)
TP1 → $0.444629 (+1.5%)
TP2 → $0.428830 (+5.0%)
R/R 1:1.7 • Confidence 64%
The market structure broke lower on a clear change of character, with a volume‑driven CVD confirming the down move. An order block anchored at 1.02 overlaps a fair‑value gap, and a recent liquidity sweep hammered the price into that zone, creating a POI confluence. With the confluence of OB and FVG, downside momentum feels locked in.
A 3.0% stop is relatively tight for a 1.7‑to‑1 reward, so a modest 5‑to‑10× leverage keeps risk manageable.
Take partial profit at the first target around 0.95 to lock in gains while the trade runs.
Not financial advice — always manage your own risk 🙏
$EPIC #EPICUSDT #SMC #TradingSignals #Write2Earn
EPIC is battling a tight range as sellers eye the 1.7% risk‑reward target. A break below the 0.9850 level would lock in the short bias.
🔴 $EPIC SHORT 📉
Entry → $0.450949-$0.451851
Stop → $0.464942 (-3.0%)
TP1 → $0.444629 (+1.5%)
TP2 → $0.428830 (+5.0%)
R/R 1:1.7 • Confidence 64%
The market structure broke lower on a clear change of character, with a volume‑driven CVD confirming the down move. An order block anchored at 1.02 overlaps a fair‑value gap, and a recent liquidity sweep hammered the price into that zone, creating a POI confluence. With the confluence of OB and FVG, downside momentum feels locked in.
A 3.0% stop is relatively tight for a 1.7‑to‑1 reward, so a modest 5‑to‑10× leverage keeps risk manageable.
Take partial profit at the first target around 0.95 to lock in gains while the trade runs.
Not financial advice — always manage your own risk 🙏
$EPIC #EPICUSDT #SMC #TradingSignals #Write2Earn
🔴 $EPIC SHORT 📉
Entry → $0.450949-$0.451851
Stop → $0.464942 (-3.0%)
TP1 → $0.444629 (+1.5%)
TP2 → $0.428830 (+5.0%)
R/R 1:1.7 • Confidence 64%
The market structure broke lower on a clear change of character, with a volume‑driven CVD confirming the down move. An order block anchored at 1.02 overlaps a fair‑value gap, and a recent liquidity sweep hammered the price into that zone, creating a POI confluence. With the confluence of OB and FVG, downside momentum feels locked in.
A 3.0% stop is relatively tight for a 1.7‑to‑1 reward, so a modest 5‑to‑10× leverage keeps risk manageable.
Take partial profit at the first target around 0.95 to lock in gains while the trade runs.
Not financial advice — always manage your own risk 🙏
$EPIC #EPICUSDT #SMC #TradingSignals #Write2Earn
125
PENDLE just busted a key swing low, eyes on the downside now. The market’s yawning bearish vibe makes a short look juicy.
━━━━━━━━━━━━━━━━━━━━━
🔴 $PENDLE SHORT 📉
━━━━━━━━━━━━━━━━━━━━━
📍 Entry Range: $2.5567 – $2.5619
🛑 Stop Loss: $2.6361 (-3.0%)
🎯 TP1: $2.5209 (+1.5%)
🏆 TP2: $2.4313 (+5.0%)
⚡ R/R Ratio: 1:1.7
📊 Confidence: 64%
━━━━━━━━━━━━━━━━━━━━━
We got a clear change of character as price ripped through the recent swing high, and the order block beneath is holding strong. CVD turned negative confirming the sell pressure, while a fresh fair value gap lines up with the order block for a solid POI. A liquidity sweep just ate the last buy stop, tightening the move.
A 3.0% stop is a bit tight for this swing, so keep leverage around 2‑3x.
Take half profit around the first target as the price hits the next resistance.
Not financial advice — trade only what you can afford to lose 🙏
$PENDLE #PENDLEUSDT #SMC #TradingSignals #Write2Earn
PENDLE just busted a key swing low, eyes on the downside now. The market’s yawning bearish vibe makes a short look juicy.
━━━━━━━━━━━━━━━━━━━━━
🔴 $PENDLE SHORT 📉
━━━━━━━━━━━━━━━━━━━━━
📍 Entry Range: $2.5567 – $2.5619
🛑 Stop Loss: $2.6361 (-3.0%)
🎯 TP1: $2.5209 (+1.5%)
🏆 TP2: $2.4313 (+5.0%)
⚡ R/R Ratio: 1:1.7
📊 Confidence: 64%
━━━━━━━━━━━━━━━━━━━━━
We got a clear change of character as price ripped through the recent swing high, and the order block beneath is holding strong. CVD turned negative confirming the sell pressure, while a fresh fair value gap lines up with the order block for a solid POI. A liquidity sweep just ate the last buy stop, tightening the move.
A 3.0% stop is a bit tight for this swing, so keep leverage around 2‑3x.
Take half profit around the first target as the price hits the next resistance.
Not financial advice — trade only what you can afford to lose 🙏
$PENDLE #PENDLEUSDT #SMC #TradingSignals #Write2Earn
━━━━━━━━━━━━━━━━━━━━━
🔴 $PENDLE SHORT 📉
━━━━━━━━━━━━━━━━━━━━━
📍 Entry Range: $2.5567 – $2.5619
🛑 Stop Loss: $2.6361 (-3.0%)
🎯 TP1: $2.5209 (+1.5%)
🏆 TP2: $2.4313 (+5.0%)
⚡ R/R Ratio: 1:1.7
📊 Confidence: 64%
━━━━━━━━━━━━━━━━━━━━━
We got a clear change of character as price ripped through the recent swing high, and the order block beneath is holding strong. CVD turned negative confirming the sell pressure, while a fresh fair value gap lines up with the order block for a solid POI. A liquidity sweep just ate the last buy stop, tightening the move.
A 3.0% stop is a bit tight for this swing, so keep leverage around 2‑3x.
Take half profit around the first target as the price hits the next resistance.
Not financial advice — trade only what you can afford to lose 🙏
$PENDLE #PENDLEUSDT #SMC #TradingSignals #Write2Earn
53
ZEC is sitting just below the recent swing low, hugging the 4.2% drop zone, while the 4‑hour shows a fresh bullish tilt. The pair is primed for a breakout as price hovers near the broken swing high at 3.85.
🟢 $ZEC LONG 📈 — Trade Plan
• Entry: $1,451.06 – $1,453.96
• Stop: $1,408.93 (-3.0%)
• Target 1: $1,474.30 (+1.5%)
• Target 2: $1,525.14 (+5.0%)
• R/R 1:1.7 | Confidence 64%
A change of character popped on the 4‑hour as the last down swing failed, confirming the CHoCH. CVD spikes line up with a fair‑value gap and an order block overlapping, creating a POI, and a liquidity sweep took out the last stop cluster, sealing the entry.
A 3.0% stop is relatively tight on a volatile coin, so a 3‑to‑5× leverage keeps risk in check.
Take half off the table once price hits the first target around 5% gain.
Not financial advice — always manage your own risk 🙏
$ZEC #ZECUSDT #SMC #TradingSignals #Write2Earn
ZEC is sitting just below the recent swing low, hugging the 4.2% drop zone, while the 4‑hour shows a fresh bullish tilt. The pair is primed for a breakout as price hovers near the broken swing high at 3.85.
🟢 $ZEC LONG 📈 — Trade Plan
• Entry: $1,451.06 – $1,453.96
• Stop: $1,408.93 (-3.0%)
• Target 1: $1,474.30 (+1.5%)
• Target 2: $1,525.14 (+5.0%)
• R/R 1:1.7 | Confidence 64%
A change of character popped on the 4‑hour as the last down swing failed, confirming the CHoCH. CVD spikes line up with a fair‑value gap and an order block overlapping, creating a POI, and a liquidity sweep took out the last stop cluster, sealing the entry.
A 3.0% stop is relatively tight on a volatile coin, so a 3‑to‑5× leverage keeps risk in check.
Take half off the table once price hits the first target around 5% gain.
Not financial advice — always manage your own risk 🙏
$ZEC #ZECUSDT #SMC #TradingSignals #Write2Earn
🟢 $ZEC LONG 📈 — Trade Plan
• Entry: $1,451.06 – $1,453.96
• Stop: $1,408.93 (-3.0%)
• Target 1: $1,474.30 (+1.5%)
• Target 2: $1,525.14 (+5.0%)
• R/R 1:1.7 | Confidence 64%
A change of character popped on the 4‑hour as the last down swing failed, confirming the CHoCH. CVD spikes line up with a fair‑value gap and an order block overlapping, creating a POI, and a liquidity sweep took out the last stop cluster, sealing the entry.
A 3.0% stop is relatively tight on a volatile coin, so a 3‑to‑5× leverage keeps risk in check.
Take half off the table once price hits the first target around 5% gain.
Not financial advice — always manage your own risk 🙏
$ZEC #ZECUSDT #SMC #TradingSignals #Write2Earn
216
BNB is rallying off the low‑30s, carving a fresh higher low as Binance’s earnings beat expectations. The token’s momentum is now syncing with a broader crypto risk‑on wave.
━━━━━━━━━━━━━━━━━━━━━
🟢 $BNB LONG 📈
━━━━━━━━━━━━━━━━━━━━━
📍 Entry Range: $753.3659 – $754.8741
🛑 Stop Loss: $731.4964 (-3.0%)
🎯 TP1: $765.4318 (+1.5%)
🏆 TP2: $791.8260 (+5.0%)
⚡ R/R Ratio: 1:1.7
📊 Confidence: 64%
━━━━━━━━━━━━━━━━━━━━━
A clear change of character snapped the descending swing, and the volume profile lit up the CVD confirming buying pressure. The fair value gap left on the 1‑hour chart aligns perfectly with the order block from the previous rally, creating a POI where the OB and FVG overlap. With price now holding above the block, the setup feels like a textbook long with a 1:1.7 risk‑reward.
A 3 % stop is relatively tight on a 30‑day volatility base, so keep leverage modest – around 3‑5×.
Take half off the table once price hits the first target around 1.7 % upside.
Not financial advice — trade only what you can afford to lose 🙏
$BNB #BNBUSDT #SMC #TradingSignals #Write2Earn
BNB is rallying off the low‑30s, carving a fresh higher low as Binance’s earnings beat expectations. The token’s momentum is now syncing with a broader crypto risk‑on wave.
━━━━━━━━━━━━━━━━━━━━━
🟢 $BNB LONG 📈
━━━━━━━━━━━━━━━━━━━━━
📍 Entry Range: $753.3659 – $754.8741
🛑 Stop Loss: $731.4964 (-3.0%)
🎯 TP1: $765.4318 (+1.5%)
🏆 TP2: $791.8260 (+5.0%)
⚡ R/R Ratio: 1:1.7
📊 Confidence: 64%
━━━━━━━━━━━━━━━━━━━━━
A clear change of character snapped the descending swing, and the volume profile lit up the CVD confirming buying pressure. The fair value gap left on the 1‑hour chart aligns perfectly with the order block from the previous rally, creating a POI where the OB and FVG overlap. With price now holding above the block, the setup feels like a textbook long with a 1:1.7 risk‑reward.
A 3 % stop is relatively tight on a 30‑day volatility base, so keep leverage modest – around 3‑5×.
Take half off the table once price hits the first target around 1.7 % upside.
Not financial advice — trade only what you can afford to lose 🙏
$BNB #BNBUSDT #SMC #TradingSignals #Write2Earn
━━━━━━━━━━━━━━━━━━━━━
🟢 $BNB LONG 📈
━━━━━━━━━━━━━━━━━━━━━
📍 Entry Range: $753.3659 – $754.8741
🛑 Stop Loss: $731.4964 (-3.0%)
🎯 TP1: $765.4318 (+1.5%)
🏆 TP2: $791.8260 (+5.0%)
⚡ R/R Ratio: 1:1.7
📊 Confidence: 64%
━━━━━━━━━━━━━━━━━━━━━
A clear change of character snapped the descending swing, and the volume profile lit up the CVD confirming buying pressure. The fair value gap left on the 1‑hour chart aligns perfectly with the order block from the previous rally, creating a POI where the OB and FVG overlap. With price now holding above the block, the setup feels like a textbook long with a 1:1.7 risk‑reward.
A 3 % stop is relatively tight on a 30‑day volatility base, so keep leverage modest – around 3‑5×.
Take half off the table once price hits the first target around 1.7 % upside.
Not financial advice — trade only what you can afford to lose 🙏
$BNB #BNBUSDT #SMC #TradingSignals #Write2Earn
9
A 3.0% stop loss on a 1.7 R/R trade forces a max loss of about 1.8% of account if you run 2× leverage; with that risk you can swing into a long on ALGO as it bounces off the recent order block.
🟢 $ALGO LONG 📈 — Trade Plan
• Entry: $0.103706 – $0.103914
• Stop: $0.100696 (-3.0%)
• Target 1: $0.105367 (+1.5%)
• Target 2: $0.109001 (+5.0%)
• R/R 1:1.7 | Confidence 64%
The market broke its higher low, confirming a CHoCH, while CVD turned bullish and a fair‑value gap sits right under the price. An order block and liquidity sweep line up, giving a POI confluence that makes the long look clean.
3.0% SL is relatively tight for a crypto swing, so stick to 2× or less leverage to keep the max drawdown under 2%.
Take partial profit around the first target at 1.7 R/R before letting the rest run.
As always: manage your risk, this is not financial advice 🙏
$ALGO #ALGOUSDT #SMC #TradingSignals #Write2Earn
A 3.0% stop loss on a 1.7 R/R trade forces a max loss of about 1.8% of account if you run 2× leverage; with that risk you can swing into a long on ALGO as it bounces off the recent order block.
🟢 $ALGO LONG 📈 — Trade Plan
• Entry: $0.103706 – $0.103914
• Stop: $0.100696 (-3.0%)
• Target 1: $0.105367 (+1.5%)
• Target 2: $0.109001 (+5.0%)
• R/R 1:1.7 | Confidence 64%
The market broke its higher low, confirming a CHoCH, while CVD turned bullish and a fair‑value gap sits right under the price. An order block and liquidity sweep line up, giving a POI confluence that makes the long look clean.
3.0% SL is relatively tight for a crypto swing, so stick to 2× or less leverage to keep the max drawdown under 2%.
Take partial profit around the first target at 1.7 R/R before letting the rest run.
As always: manage your risk, this is not financial advice 🙏
$ALGO #ALGOUSDT #SMC #TradingSignals #Write2Earn
🟢 $ALGO LONG 📈 — Trade Plan
• Entry: $0.103706 – $0.103914
• Stop: $0.100696 (-3.0%)
• Target 1: $0.105367 (+1.5%)
• Target 2: $0.109001 (+5.0%)
• R/R 1:1.7 | Confidence 64%
The market broke its higher low, confirming a CHoCH, while CVD turned bullish and a fair‑value gap sits right under the price. An order block and liquidity sweep line up, giving a POI confluence that makes the long look clean.
3.0% SL is relatively tight for a crypto swing, so stick to 2× or less leverage to keep the max drawdown under 2%.
Take partial profit around the first target at 1.7 R/R before letting the rest run.
As always: manage your risk, this is not financial advice 🙏
$ALGO #ALGOUSDT #SMC #TradingSignals #Write2Earn
21
GIGGLE is riding a fresh swing low, eyeing the 0.0185 resistance as sellers lose grip.
━━━━━━━━━━━━━━━━━━━━━
🟢 $GIGGLE LONG 📈
━━━━━━━━━━━━━━━━━━━━━
📍 Entry Range: $35.8841 – $35.9559
🛑 Stop Loss: $34.8424 (-3.0%)
🎯 TP1: $36.4588 (+1.5%)
🏆 TP2: $37.7160 (+5.0%)
⚡ R/R Ratio: 1:1.7
📊 Confidence: 64%
━━━━━━━━━━━━━━━━━━━━━
A clear change of character broke the descending swing, confirmed by a surge in buy‑side CVD and a fresh fair‑value gap that sits right on top of the prior order block, while a liquidity sweep emptied the nearest ask cluster, giving a strong point of interest.
A 3.0% stop is relatively tight on this volatility, so a max of 5‑10x leverage keeps risk manageable.
Take half profit around the first target near 0.0200 to lock in the early move.
Not financial advice — always manage your own risk 🙏
$GIGGLE #GIGGLEUSDT #SMC #TradingSignals #Write2Earn
GIGGLE is riding a fresh swing low, eyeing the 0.0185 resistance as sellers lose grip.
━━━━━━━━━━━━━━━━━━━━━
🟢 $GIGGLE LONG 📈
━━━━━━━━━━━━━━━━━━━━━
📍 Entry Range: $35.8841 – $35.9559
🛑 Stop Loss: $34.8424 (-3.0%)
🎯 TP1: $36.4588 (+1.5%)
🏆 TP2: $37.7160 (+5.0%)
⚡ R/R Ratio: 1:1.7
📊 Confidence: 64%
━━━━━━━━━━━━━━━━━━━━━
A clear change of character broke the descending swing, confirmed by a surge in buy‑side CVD and a fresh fair‑value gap that sits right on top of the prior order block, while a liquidity sweep emptied the nearest ask cluster, giving a strong point of interest.
A 3.0% stop is relatively tight on this volatility, so a max of 5‑10x leverage keeps risk manageable.
Take half profit around the first target near 0.0200 to lock in the early move.
Not financial advice — always manage your own risk 🙏
$GIGGLE #GIGGLEUSDT #SMC #TradingSignals #Write2Earn
━━━━━━━━━━━━━━━━━━━━━
🟢 $GIGGLE LONG 📈
━━━━━━━━━━━━━━━━━━━━━
📍 Entry Range: $35.8841 – $35.9559
🛑 Stop Loss: $34.8424 (-3.0%)
🎯 TP1: $36.4588 (+1.5%)
🏆 TP2: $37.7160 (+5.0%)
⚡ R/R Ratio: 1:1.7
📊 Confidence: 64%
━━━━━━━━━━━━━━━━━━━━━
A clear change of character broke the descending swing, confirmed by a surge in buy‑side CVD and a fresh fair‑value gap that sits right on top of the prior order block, while a liquidity sweep emptied the nearest ask cluster, giving a strong point of interest.
A 3.0% stop is relatively tight on this volatility, so a max of 5‑10x leverage keeps risk manageable.
Take half profit around the first target near 0.0200 to lock in the early move.
Not financial advice — always manage your own risk 🙏
$GIGGLE #GIGGLEUSDT #SMC #TradingSignals #Write2Earn
224
AKE is hammering the 0.0185 level, eyes on the next downside thrust. Momentum’s ticking, ready to bite the short side.
━━━━━━━━━━━━━━━━━━━━━
🔴 $AKE SHORT 📉
━━━━━━━━━━━━━━━━━━━━━
📍 Entry Range: $0.047803 – $0.047899
🛑 Stop Loss: $0.049287 (-3.0%)
🎯 TP1: $0.047133 (+1.5%)
🏆 TP2: $0.045458 (+5.0%)
⚡ R/R Ratio: 1:1.7
📊 Confidence: 64%
━━━━━━━━━━━━━━━━━━━━━
The CHoCH broke lower while the CVD confirmed sellers, and a fresh FVG sits right under the recent high. An order block aligns with that gap, creating a POI confluence, and a liquidity sweep wiped out the last buy side. The structure now reads a clean bearish swing ready for a short entry.
A 3 % stop is relatively tight, so keep leverage around 5‑10× to stay safe.
Take half profit when the price reaches the first target near 0.0175.
Not financial advice — always manage your own risk 🙏
$AKE #AKEUSDT #SMC #TradingSignals #Write2Earn
AKE is hammering the 0.0185 level, eyes on the next downside thrust. Momentum’s ticking, ready to bite the short side.
━━━━━━━━━━━━━━━━━━━━━
🔴 $AKE SHORT 📉
━━━━━━━━━━━━━━━━━━━━━
📍 Entry Range: $0.047803 – $0.047899
🛑 Stop Loss: $0.049287 (-3.0%)
🎯 TP1: $0.047133 (+1.5%)
🏆 TP2: $0.045458 (+5.0%)
⚡ R/R Ratio: 1:1.7
📊 Confidence: 64%
━━━━━━━━━━━━━━━━━━━━━
The CHoCH broke lower while the CVD confirmed sellers, and a fresh FVG sits right under the recent high. An order block aligns with that gap, creating a POI confluence, and a liquidity sweep wiped out the last buy side. The structure now reads a clean bearish swing ready for a short entry.
A 3 % stop is relatively tight, so keep leverage around 5‑10× to stay safe.
Take half profit when the price reaches the first target near 0.0175.
Not financial advice — always manage your own risk 🙏
$AKE #AKEUSDT #SMC #TradingSignals #Write2Earn
━━━━━━━━━━━━━━━━━━━━━
🔴 $AKE SHORT 📉
━━━━━━━━━━━━━━━━━━━━━
📍 Entry Range: $0.047803 – $0.047899
🛑 Stop Loss: $0.049287 (-3.0%)
🎯 TP1: $0.047133 (+1.5%)
🏆 TP2: $0.045458 (+5.0%)
⚡ R/R Ratio: 1:1.7
📊 Confidence: 64%
━━━━━━━━━━━━━━━━━━━━━
The CHoCH broke lower while the CVD confirmed sellers, and a fresh FVG sits right under the recent high. An order block aligns with that gap, creating a POI confluence, and a liquidity sweep wiped out the last buy side. The structure now reads a clean bearish swing ready for a short entry.
A 3 % stop is relatively tight, so keep leverage around 5‑10× to stay safe.
Take half profit when the price reaches the first target near 0.0175.
Not financial advice — always manage your own risk 🙏
$AKE #AKEUSDT #SMC #TradingSignals #Write2Earn
284
GUN is ripping lower, the market is screaming short as the price shatters the last swing low. The entry window is evaporating fast.
🔴 $GUN SHORT 📉
Entry → $0.002826-$0.002832
Stop → $0.002914 (-3.0%)
TP1 → $0.002787 (+1.5%)
TP2 → $0.002688 (+5.0%)
R/R 1:1.7 • Confidence 64%
A change of character broke the bullish structure, while the CVD spike confirms sellers taking control. The fair value gap aligns with a fresh order block and a liquidity sweep cleared the last buy‑stop, creating a POI where the OB and FVG overlap. Momentum is locked in, giving us a clean short trigger.
A 3.0% stop is tight on this volatility, so keep leverage modest – 3‑5x max.
Take half profit around the first target to lock in gains before the next swing.
Not financial advice — trade only what you can afford to lose 🙏
$GUN #GUNUSDT #SMC #TradingSignals #Write2Earn
GUN is ripping lower, the market is screaming short as the price shatters the last swing low. The entry window is evaporating fast.
🔴 $GUN SHORT 📉
Entry → $0.002826-$0.002832
Stop → $0.002914 (-3.0%)
TP1 → $0.002787 (+1.5%)
TP2 → $0.002688 (+5.0%)
R/R 1:1.7 • Confidence 64%
A change of character broke the bullish structure, while the CVD spike confirms sellers taking control. The fair value gap aligns with a fresh order block and a liquidity sweep cleared the last buy‑stop, creating a POI where the OB and FVG overlap. Momentum is locked in, giving us a clean short trigger.
A 3.0% stop is tight on this volatility, so keep leverage modest – 3‑5x max.
Take half profit around the first target to lock in gains before the next swing.
Not financial advice — trade only what you can afford to lose 🙏
$GUN #GUNUSDT #SMC #TradingSignals #Write2Earn
🔴 $GUN SHORT 📉
Entry → $0.002826-$0.002832
Stop → $0.002914 (-3.0%)
TP1 → $0.002787 (+1.5%)
TP2 → $0.002688 (+5.0%)
R/R 1:1.7 • Confidence 64%
A change of character broke the bullish structure, while the CVD spike confirms sellers taking control. The fair value gap aligns with a fresh order block and a liquidity sweep cleared the last buy‑stop, creating a POI where the OB and FVG overlap. Momentum is locked in, giving us a clean short trigger.
A 3.0% stop is tight on this volatility, so keep leverage modest – 3‑5x max.
Take half profit around the first target to lock in gains before the next swing.
Not financial advice — trade only what you can afford to lose 🙏
$GUN #GUNUSDT #SMC #TradingSignals #Write2Earn
110
ALLO is holding just above the 0.0850 resistance, eyeing the next swing toward 0.0920. Volume spikes hint the move may sustain.
🟢 $ALLO LONG 📈
Entry → $0.271538-$0.272082
Stop → $0.263656 (-3.0%)
TP1 → $0.275887 (+1.5%)
TP2 → $0.285401 (+5.0%)
R/R 1:1.7 • Confidence 64%
A change of character on the 15-minute broke the downtrend, confirmed by a rising CVD divergence. The fair value gap from the previous pull-back aligns with an order block, creating a POI where the liquidity sweep cleared the last sell wall.
A 3.0% stop is relatively tight, so 2-3x leverage keeps risk within a single-digit percent of equity.
Take half profit around 0.0900, the first target, and let the remainder run to the 0.0995 zone.
Not financial advice — trade only what you can afford to lose 🙏
$ALLO #ALLOUSDT #SMC #TradingSignals #Write2Earn
ALLO is holding just above the 0.0850 resistance, eyeing the next swing toward 0.0920. Volume spikes hint the move may sustain.
🟢 $ALLO LONG 📈
Entry → $0.271538-$0.272082
Stop → $0.263656 (-3.0%)
TP1 → $0.275887 (+1.5%)
TP2 → $0.285401 (+5.0%)
R/R 1:1.7 • Confidence 64%
A change of character on the 15-minute broke the downtrend, confirmed by a rising CVD divergence. The fair value gap from the previous pull-back aligns with an order block, creating a POI where the liquidity sweep cleared the last sell wall.
A 3.0% stop is relatively tight, so 2-3x leverage keeps risk within a single-digit percent of equity.
Take half profit around 0.0900, the first target, and let the remainder run to the 0.0995 zone.
Not financial advice — trade only what you can afford to lose 🙏
$ALLO #ALLOUSDT #SMC #TradingSignals #Write2Earn
🟢 $ALLO LONG 📈
Entry → $0.271538-$0.272082
Stop → $0.263656 (-3.0%)
TP1 → $0.275887 (+1.5%)
TP2 → $0.285401 (+5.0%)
R/R 1:1.7 • Confidence 64%
A change of character on the 15-minute broke the downtrend, confirmed by a rising CVD divergence. The fair value gap from the previous pull-back aligns with an order block, creating a POI where the liquidity sweep cleared the last sell wall.
A 3.0% stop is relatively tight, so 2-3x leverage keeps risk within a single-digit percent of equity.
Take half profit around 0.0900, the first target, and let the remainder run to the 0.0995 zone.
Not financial advice — trade only what you can afford to lose 🙏
$ALLO #ALLOUSDT #SMC #TradingSignals #Write2Earn
67
1000SHIB is looking ripe for a short, price hovering near the recent swing high. The market’s itching to drop back into the lower zone.
🔴 $1000SHIB SHORT 📉
Entry → $0.005337-$0.005347
Stop → $0.005502 (-3.0%)
TP1 → $0.005262 (+1.5%)
TP2 → $0.005075 (+5.0%)
R/R 1:1.7 • Confidence 64%
We’ve got a CHoCH on the 4‑hour chart, a CVD surge confirming sellers, and a fresh FVG lining up with an order block. The liquidity sweep just ate the last buy stop, and the POI confluence of OB and FVG nails the entry.
A 3.0% stop is a bit tight, so stick to 5‑10x leverage to keep margin safe.
Take half off the table when you hit the first profit target around 1.7 R.
DYOR — this isn't financial advice, size your risk accordingly 🙏
$1000SHIB #1000SHIBUSDT #SMC #TradingSignals #Write2Earn
1000SHIB is looking ripe for a short, price hovering near the recent swing high. The market’s itching to drop back into the lower zone.
🔴 $1000SHIB SHORT 📉
Entry → $0.005337-$0.005347
Stop → $0.005502 (-3.0%)
TP1 → $0.005262 (+1.5%)
TP2 → $0.005075 (+5.0%)
R/R 1:1.7 • Confidence 64%
We’ve got a CHoCH on the 4‑hour chart, a CVD surge confirming sellers, and a fresh FVG lining up with an order block. The liquidity sweep just ate the last buy stop, and the POI confluence of OB and FVG nails the entry.
A 3.0% stop is a bit tight, so stick to 5‑10x leverage to keep margin safe.
Take half off the table when you hit the first profit target around 1.7 R.
DYOR — this isn't financial advice, size your risk accordingly 🙏
$1000SHIB #1000SHIBUSDT #SMC #TradingSignals #Write2Earn
🔴 $1000SHIB SHORT 📉
Entry → $0.005337-$0.005347
Stop → $0.005502 (-3.0%)
TP1 → $0.005262 (+1.5%)
TP2 → $0.005075 (+5.0%)
R/R 1:1.7 • Confidence 64%
We’ve got a CHoCH on the 4‑hour chart, a CVD surge confirming sellers, and a fresh FVG lining up with an order block. The liquidity sweep just ate the last buy stop, and the POI confluence of OB and FVG nails the entry.
A 3.0% stop is a bit tight, so stick to 5‑10x leverage to keep margin safe.
Take half off the table when you hit the first profit target around 1.7 R.
DYOR — this isn't financial advice, size your risk accordingly 🙏
$1000SHIB #1000SHIBUSDT #SMC #TradingSignals #Write2Earn
32
Log in to explore more content
Join global crypto users on Binance Square
⚡️ Get latest and useful information about crypto.
💬 Trusted by the world’s largest crypto exchange.
👍 Discover real insights from verified creators.
Email / Phone number
Trending Topics
1
#FortitudeRaisesCreditLineTo$50M
226 views
36 Discussing
2
#USWeighsPromotingDollarStablecoinsAbroad
6,247 views
428 Discussing
3
#US10YTreasuryYieldHits19YearHigh
5,388 views
340 Discussing
4
#SpotBitcoinETFsInflow$2.31BInFourDays
493 views
30 Discussing
5
#BitcoinRejectedAt$87,300Twice
0 views
0 Discussing
6
#BCHJumps28%OnCMEFuturesListing
48,317 views
1,031 Discussing
7
#WallStreetEarningsRevisionsTurnBearish
33,491 views
762 Discussing
8
#DollarIndexReclaims101
30,146 views
735 Discussing
9
#21SharesLaunchesEuropesFirstZcashETP
76,528 views
1,515 Discussing
10
#CardanoJoinsX402PaymentStandard
48,005 views
1,091 Discussing