

HALIFI
8.9k Posts

HALIFI
Report
Block User
إخلاء مسؤولية لا يتحمل صاحب الحساب أي مسؤولية ولا يعد أي محتوى منشور نصيحة استثمارية جميع .المنشورات لأغراض تعليمية وإعلامية فقط
2.8K+ Following
1.4K+ Followers
1.2K+ Liked
Posts
All
Quotes
Videos
Live
·
--
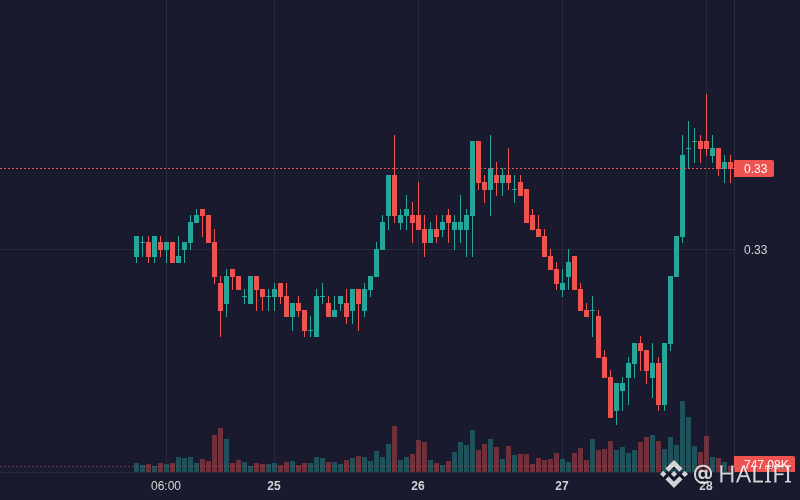
$TRX TRX is showing bullish movement: 0.64% (Crypto).
Volume: 30.46M | Last: $0.331100
Key signals: high trader activity.
Bias Daily: BULLISH 🟢 | Weekly: BULLISH 🟢
TRX rose 0.64% over 24h to $0.3312 following institutional ETF catalysts and strong concentrated capital inflows.
**Institutional ETF integration (High)**: Canary Capital filed/introduced TRXS physical staking ETF → boosts long-term spot demand expectations
- **Large inflow surge (High)**: Spot net inflows topped +$4.7M in a single hour with >60% large-order share → propelled price from $0.3277 to $0.3315
- **Ecosystem expansion (Medium)**: Protocol upgrade and upcoming tokenized RWA assets rollout strengthen network fundamentals
#TRX #BinanceSquare #EarningsSeason #CanGoogleDefindItsCore #Crypto
27
·
--
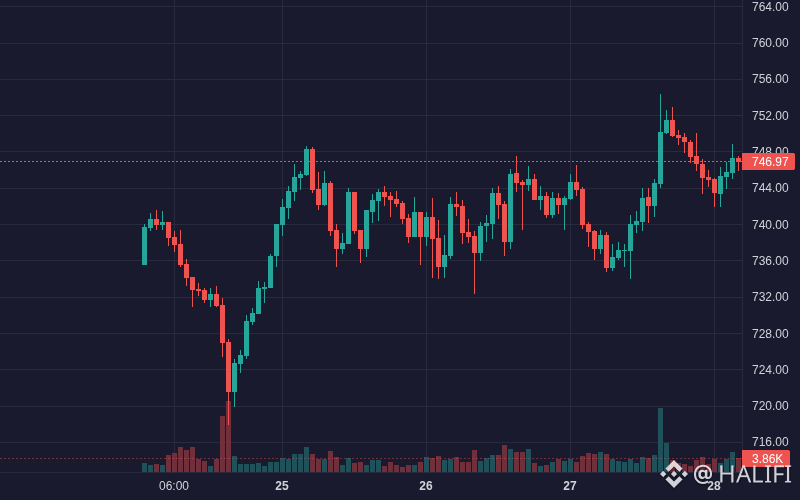
$BNB BNB is showing bullish movement: 1.00% (Crypto).
Volume: 81.94M | Last: $746.31
Key signals: high trader activity.
Bias Daily: BULLISH 🟢 | Weekly: BULLISH 🟢
BNB gained 1.33% in 24h, reaching $747.19 following institutional Nasdaq exposure and strong large-order capital inflows.
**Institutional visibility & momentum (High)**: Corporate rebranding ceremony on Nasdaq alongside plans for a high-speed L1 network and the Jenner hard fork catalyzed heavy spot demand.
- **Whale & large order inflow (High)**: Over $14M in net inflows across two consecutive hours, dominated by large orders, drove BNB from $744 to a high of $751.50.
- **Bullish trend structure (Medium)**: Price remains positioned above EMA 7, 25, and 99, confirming sustained mid-term trend strength.
#BNB #BinanceSquare #EarningsSeason #CanGoogleDefindItsCore #Crypto
24
·
--
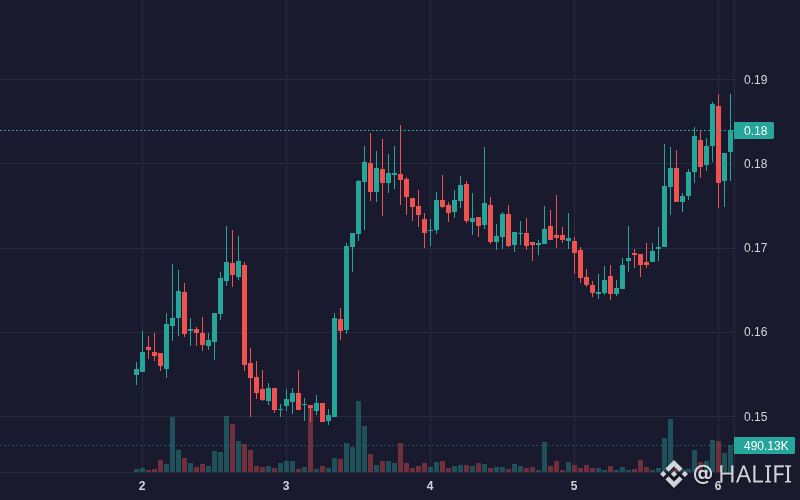
$STG STG is showing bullish movement: 11.04% (Crypto).
Volume: 935.43K | Last: $0.184000
Key signals: strong momentum, high volatility.
Bias Daily: BULLISH 🟢 | Weekly: BULLISH 🟢
#STG #BinanceSquare #EarningsSeason #CanGoogleDefindItsCore #Crypto
$STG STG is showing bullish movement: 11.04% (Crypto).
Volume: 935.43K | Last: $0.184000
Key signals: strong momentum, high volatility.
Bias Daily: BULLISH 🟢 | Weekly: BULLISH 🟢
#STG #BinanceSquare #EarningsSeason #CanGoogleDefindItsCore #Crypto
Volume: 935.43K | Last: $0.184000
Key signals: strong momentum, high volatility.
Bias Daily: BULLISH 🟢 | Weekly: BULLISH 🟢
#STG #BinanceSquare #EarningsSeason #CanGoogleDefindItsCore #Crypto
14
·
--
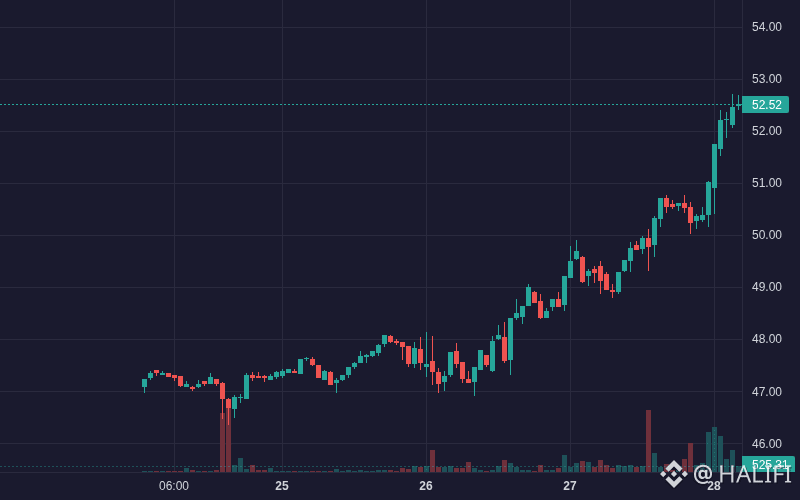
$DRAMB DRAMB is showing bullish movement: 6.45% (Crypto).
Volume: 2.00M | Last: $52.50
Key signals: strong momentum, high volatility.
Bias Daily: BULLISH 🟢 | Weekly: BULLISH 🟢
DRAMB climbed 6.41% over the past 24 hours to $52.45, powered by AI memory demand and robust inflows.
**Industry demand surge (High)**: Major tech agreements for AI data-center memory chip demand through 2027 sparked positive sentiment across the DRAM sector
- **Aggressive capital inflows (High)**: Over +$720K net inflow recorded in late trading hours → fueled breakout toward $52.45
- **Technical breakout (Medium)**: Bullish alignment across EMA 7/25/99 and MACD histogram expansion (+0.165) accelerated price momentum above Bollinger upper band
#DRAMB #BinanceSquare #EarningsSeason #CanGoogleDefindItsCore #Crypto
10
·
--
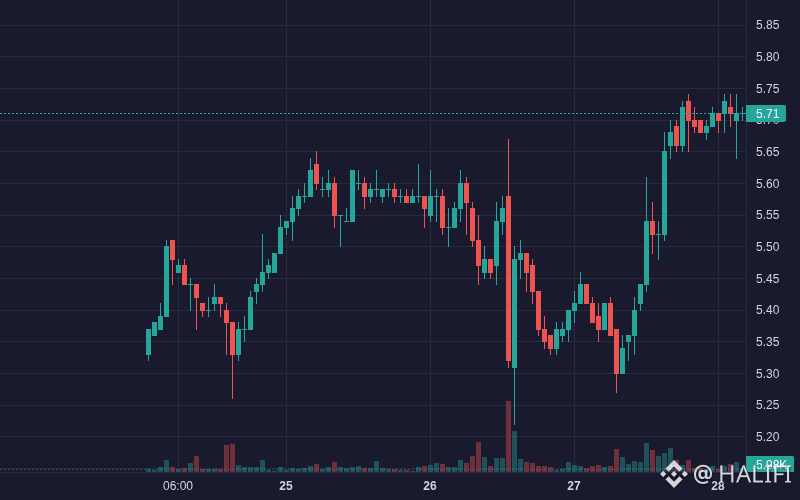
$BNCB BNCB is showing bullish movement: 5.54% (Crypto).
Volume: 3.93M | Last: $5.71
Key signals: strong momentum, high volatility.
Bias Daily: BULLISH 🟢 | Weekly: BULLISH 🟢
BNCB rose 6.3% over 24 hours driven by corporate rebranding milestones and expanding decentralized exchange liquidity integrations.
**Corporate rebrand & treasury visibility (High)**: Nasdaq opening bell rebrand ceremony and disclosure of 515,000 BNB treasury reserves → catalyzed institutional buyer interest
- **DeFi liquidity adoption (Medium)**: BNB Chain launchpads integrated BNCB into primary liquidity pools → broadened on-chain utility and ecosystem absorption
- **Spot inflows & breakout (Medium)**: Successive large buy inflows topping $280K sparked bullish momentum above the 25-EMA and 99-EMA
#BNCB #BinanceSquare #EarningsSeason #CanGoogleDefindItsCore #Crypto
8
·
--
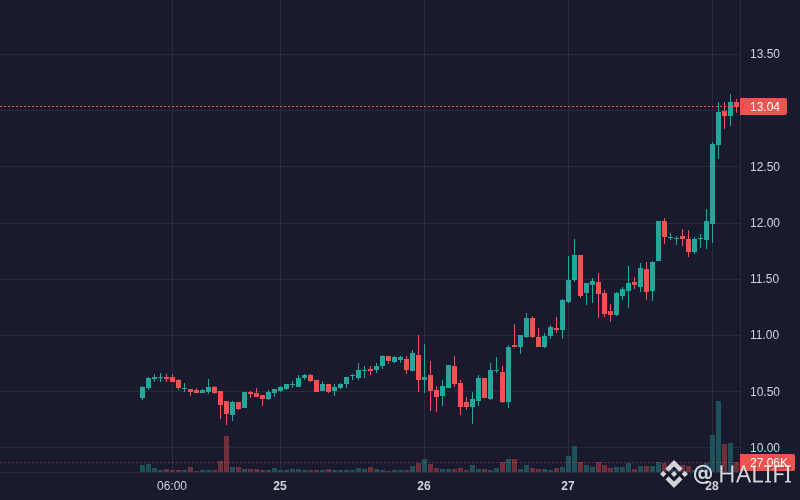
$KORUB KORUB is showing bullish movement: 14.01% (Crypto).
Volume: 9.89M | Last: $13.02
Key signals: strong momentum, high volatility.
Bias Daily: BULLISH 🟢 | Weekly: BULLISH 🟢
KORUB rallied 13.09% over 24h on semiconductor sector momentum, but extreme overbought RSI signals potential near-term correction.
**Korean semiconductor momentum (High)**: AI optimism fueled sharp gains in underlying equities Samsung and SK Hynix → amplified 3x leveraged ETF demand.
- **Breakout volume expansion (High)**: Hourly turnover surged over $5.38M as price breached upper Bollinger Bands ($12.83) → triggered trend acceleration.
- **Bullish trend alignment (Medium)**: Price crossed above EMA 7 ($12.46) and EMA 25 ($11.86), while MACD histogram expanded positively (+0.107).
#KORUB #BinanceSquare #EarningsSeason #CanGoogleDefindItsCore #Crypto
8
·
--
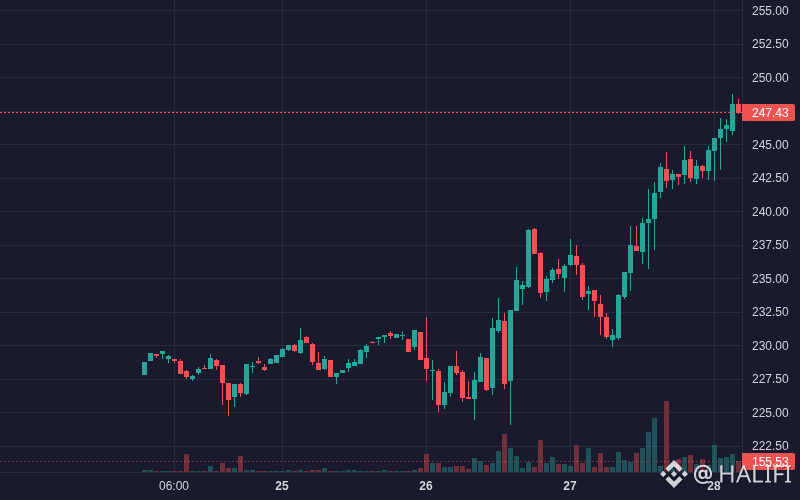
$MRVLB MRVLB is showing bullish movement: 6.30% (Crypto).
Volume: 1.53M | Last: $247.51
Key signals: strong momentum, high volatility.
Bias Daily: BULLISH 🟢 | Weekly: BULLISH 🟢
MRVLB climbed 5.3% over 24h supported by tokenized asset adoption and bullish technicals despite overbought RSI signals.
**Tokenized asset narrative (High)**: Expanding adoption as tokenized equities reach $3.09B market cap → boosts structural demand for Marvell tokenized shares
- **AI semiconductor fundamentals (Medium)**: Favorable PEG ratio (~0.5) reinforces bullish sentiment around underlying growth projections
- **Bullish momentum breakout (Medium)**: Price crossed above EMA-7/25/99 with MACD histogram expanding positive → triggered technical trend-following buying
#MRVLB #BinanceSquare #EarningsSeason #CanGoogleDefindItsCore #Crypto
7
·
--
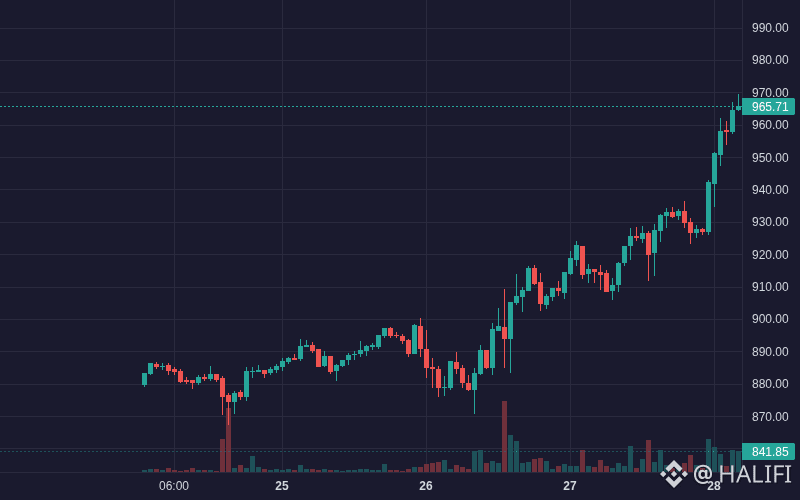
$MUB MUB is showing bullish movement: 5.59% (Crypto).
Volume: 11.88M | Last: $965.60
Key signals: strong momentum, high volatility.
Bias Daily: BULLISH 🟢 | Weekly: BULLISH 🟢
MUB advanced 4.67% over 24h to $958.14 on tokenized asset adoption, though overbought RSI warns of pullback.
**Tokenized equity adoption (High)**: Expansion of bStocks products across trading venues and bot features reinforces spot volume and underlying exposure demand.
- **Robotics DRAM demand (Medium)**: Industry forecasts projecting surging low-power DRAM usage in robotics bolster long-term sentiment for Micron.
- **Technical breakout (Medium)**: Price crossed above upper Bollinger Bands ($955.71) with MACD histogram widening to +2.39 → accelerated upward momentum.
#MUB #BinanceSquare #EarningsSeason #CanGoogleDefindItsCore #Crypto
5
·
--
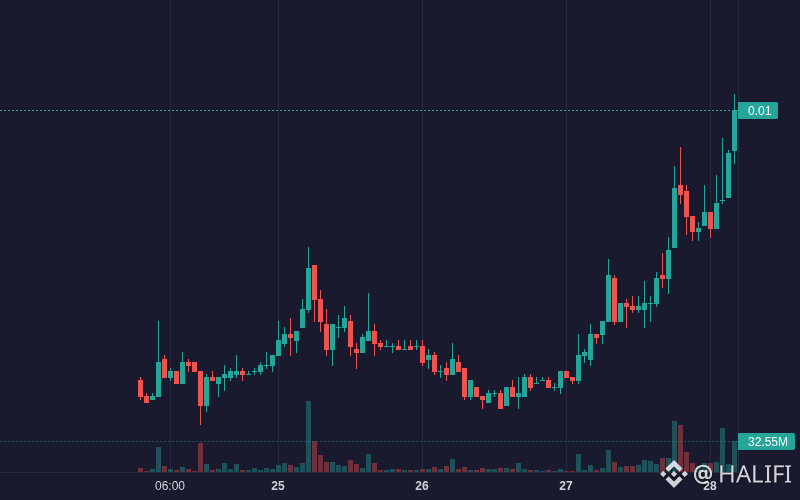
$SOLV SOLV is showing bullish movement: 17.79% (Crypto).
Volume: 1.82M | Last: $0.005230
Key signals: strong momentum, high volatility.
Bias Daily: BULLISH 🟢 | Weekly: BULLISH 🟢
SOLV advanced 11.1% over the past 24h, reaching $0.00492 amid strong volume, despite looming late-October unlock risks.
**Volume breakout (High)**: Trading volume surged past $1.18M USDT alongside a push above the upper Bollinger Band → price rallied from $0.00443 to a high of $0.00496
- **Bullish trend alignment (Medium)**: Moving averages shifted into positive alignment (EMA 7 > EMA 25 > EMA 99) with MACD histogram expanding positive → supported steady upward momentum
- **Net spot demand (Medium)**: Persistent retail buying with positive net inflows totaling over $73K in recent hours helped absorb pullbacks
#SOLV #BinanceSquare #EarningsSeason #CanGoogleDefindItsCore #Crypto
6
·
--
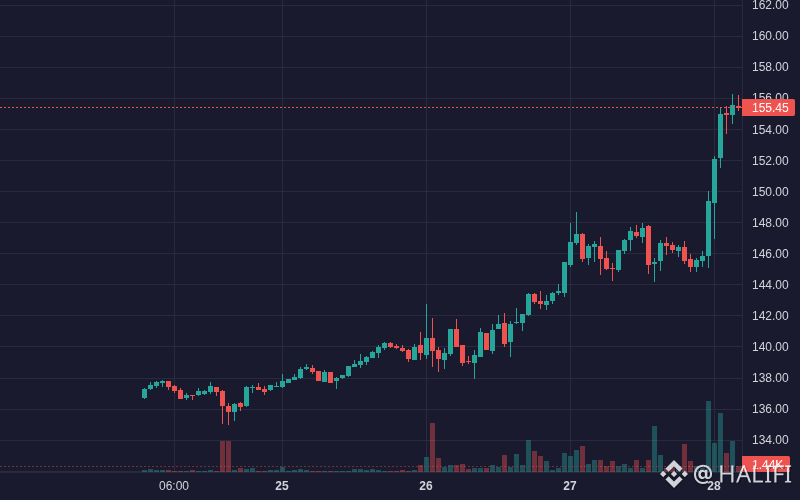
$SKHYB SKHYB is showing bullish movement: 6.23% (Crypto).
Volume: 17.23M | Last: $155.44
Key signals: strong momentum, high volatility, high trader activity.
Bias Daily: BULLISH 🟢 | Weekly: BULLISH 🟢
SKHYB gained 5.8% over the past 24 hours, reaching $155.00 on strong earnings despite overbought technicals.
**Earnings surge & AI expansion (High)**: Q3 earnings beat expectations with triple-digit profit growth → accelerated HBM4 factory capacity plans spurred strong buying
- **Technical breakout (High)**: Sharp move from $145.84 to $155.00 (+6.3%) → price surged above the upper Bollinger Band ($153.42) alongside a bullish MACD histogram expansion (+0.82)
- **Volume expansion (Medium)**: Turnover spiked above $5.9M on the initial breakout candle, validating upward momentum
#SKHYB #BinanceSquare #EarningsSeason #CanGoogleDefindItsCore #Crypto
14
·
--
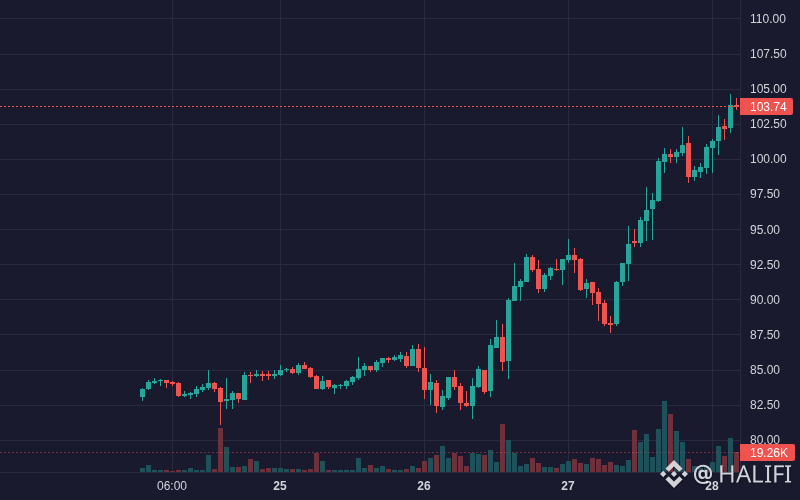
$SOXLB SOXLB is showing bullish movement: 14.73% (Crypto).
Volume: 53.67M | Last: $103.76
Key signals: strong momentum, high volatility, high trader activity.
Bias Daily: BULLISH 🟢 | Weekly: BULLISH 🟢
SOXLB surged 12.1% over 24h to $102.21, though overbought RSI and persistent net capital outflows present pullback risks.
**Tokenized equity demand (High)**: Expanding adoption of US equity tokens on centralized platforms spurred strong appetite for high-beta semiconductor exposure.
- **Bullish momentum breakout (Medium)**: Price crossed above upper Bollinger Bands ($96.89) to $102.21, as EMA-7 pulled above EMA-25 alongside sustained positive MACD histogram expansion.
- **High trading volume (Medium)**: Volume expanded sharply to 14M USDT per hour, absorbing profit-taking and sustaining upward trajectory.
#SOXLB #BinanceSquare #EarningsSeason #CanGoogleDefindItsCore #Crypto
7
·
--
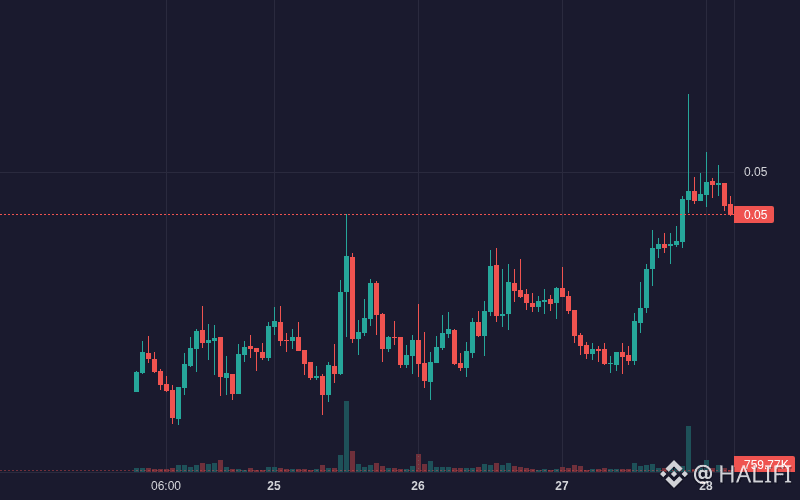
$MEGA MEGA is showing bullish movement: 7.51% (Crypto).
Volume: 3.79M | Last: $0.048960
Key signals: strong momentum, high volatility, high trader activity.
Bias Daily: BULLISH 🟢 | Weekly: BULLISH 🟢
MEGA rose 9.2% over 24 hours to $0.0497 amid campaign incentives, though upcoming unlocks pose near-term headwinds.
**Campaign incentive extension (High)**: Mega Boost campaign extended through October 31 → sustained user engagement and retail speculative interest
- **Spot volume breakout (High)**: Hourly volume spiked past $2.91M as price broke above the $0.0465 resistance → accelerated bullish momentum
- **Large buyer accumulation (Medium)**: Peak net inflows reached +$107.6K with high large-inflow ratio (0.50), supporting the upward price push
#MEGA #BinanceSquare #EarningsSeason #CanGoogleDefindItsCore #Crypto
9
·
--
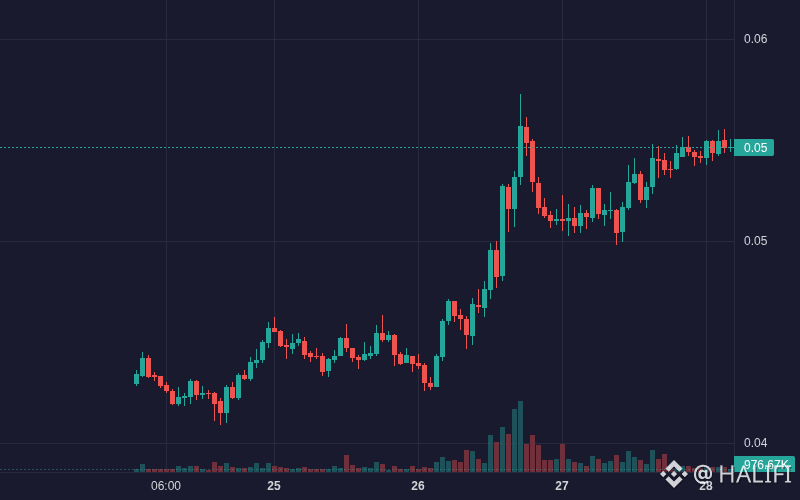
$CHIP CHIP is showing bullish movement: 6.74% (Crypto).
Volume: 5.70M | Last: $0.054780
Key signals: strong momentum, high volatility, high trader activity.
Bias Daily: BULLISH 🟢 | Weekly: BULLISH 🟢
CHIP gained 6.95% over the past 24 hours to $0.05496, driven by buyback reports despite substantial locked supply overhang.
**Token buyback catalyst (High)**: A reported $1M CHIP buyback fueled buying interest amidst expanding hype around AI infrastructure narrative plays.
- **Trend continuation & moving averages (High)**: Price crossed above the EMA 7 ($0.0545) and maintained separation over EMA 25 ($0.0531) and EMA 99 ($0.0491) → sustained 24h bullish momentum.
- **Spike in large inflows (Medium)**: Peak volume surge drove +$505.5K total net inflows with $395.6K in large orders, pushing price from $0.0526 to $0.0541.
#CHIP #BinanceSquare #EarningsSeason #CanGoogleDefindItsCore #Crypto
8
·
--
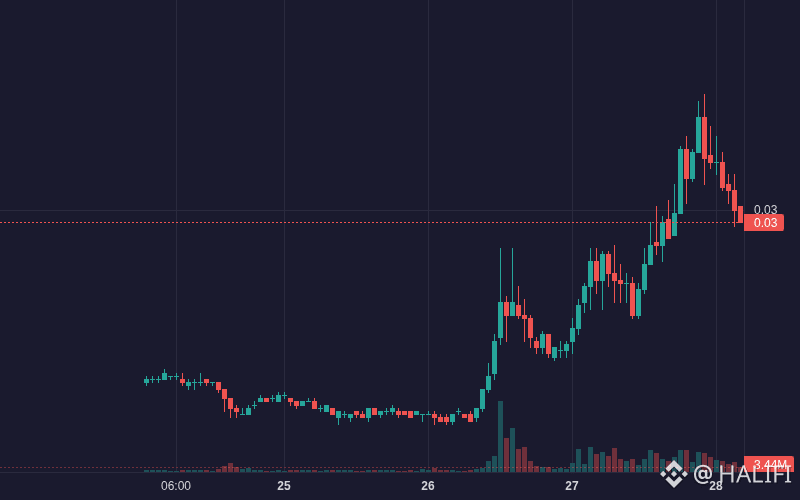
$BANK BANK is showing bullish movement: 6.09% (Crypto).
Volume: 8.83M | Last: $0.029600
Key signals: strong momentum, high volatility, high trader activity.
Bias Daily: BULLISH 🟢 | Weekly: BULLISH 🟢
BANK gained 7.37% over 24 hours after hitting $0.0329, but consecutive net outflows indicate momentum exhaustion.
**Speculative momentum buying (High)**: Spot price pushed from $0.0285 to a peak of $0.0329 → accompanied by surge in large buyer inflows exceeding $110K per hour
- **Technical breakout expansion (Medium)**: Price pierced the upper Bollinger Band with MACD histogram widening → attracted technical trend-followers
- **Momentum-driven volume spikes (Low)**: Hourly volume spiked above $3.3M during early impulsive legs despite a total lack of protocol fundamental announcements
#BANK #BinanceSquare #EarningsSeason #CanGoogleDefindItsCore #Crypto
15
·
--
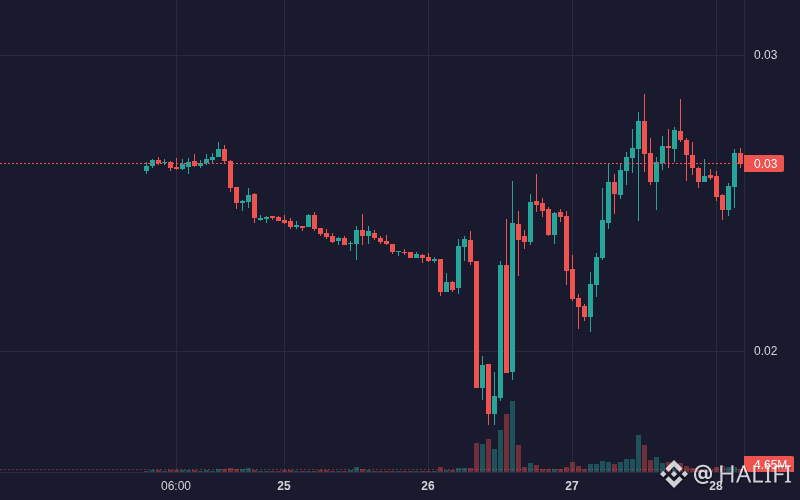
$HUMA HUMA is showing bullish movement: 17.30% (Crypto).
Volume: 11.83M | Last: $0.026440
Key signals: strong momentum, high volatility, high trader activity.
Bias Daily: BULLISH 🟢 | Weekly: BULLISH 🟢
HUMA advanced 14.8% over the past 24 hours behind strong network traction, though upcoming unlocks pose near-term risk.
**PayFi volume & partner traction (High)**: Processed >$4.5B in transactions across Circle, Solana, and Stellar → boosted network fundamental valuation
- **Surging spot trading activity (Medium)**: Volume peaked at $6.45M during the test of $0.0277 resistance → ignited a multi-hour rally
- **Short-term momentum breakout (Medium)**: MACD flipped positive alongside RSI peaking at 81.4 → accelerated 24h upside from $0.0222 to $0.0277
#HUMA #BinanceSquare #EarningsSeason #CanGoogleDefindItsCore #Crypto
16
·
--
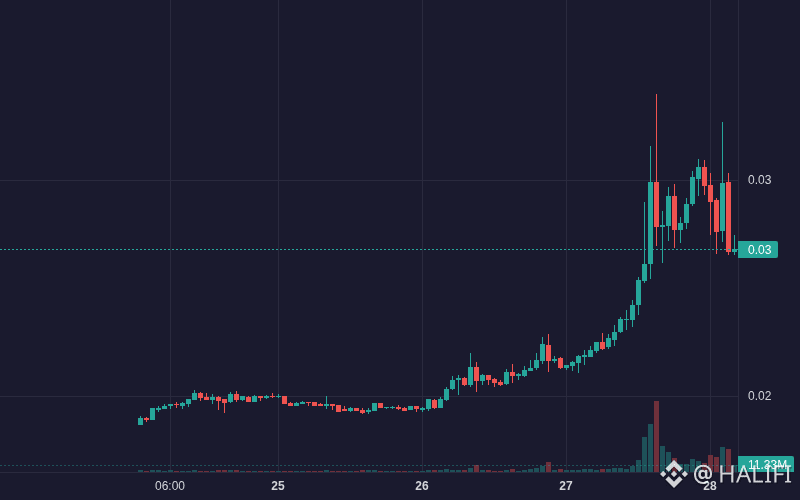
$HAEDAL HAEDAL is showing bullish movement: 21.60% (Crypto).
Volume: 19.98M | Last: $0.026910
Key signals: strong momentum, high volatility, high trader activity.
Bias Daily: BULLISH 🟢 | Weekly: BULLISH 🟢
HAEDAL surged 36.3% over 24 hours driven by speculative capital inflows, though upcoming token unlocks introduce downside risk.
**Speculative rotation (High)**: Traders targeting micro-cap DeFi assets prompted sharp upside momentum → price climbed from $0.0218 to peak at $0.0306.
- **Surging spot inflows (High)**: Large net inflows peaked at +$1.22M alongside massive volume surges exceeding $13.4M per hour.
- **Trend momentum breakout (Medium)**: Price crossed above EMA 7/25/99 bands → sustained strong bullish structure across short timeframes.
#HAEDAL #BinanceSquare #EarningsSeason #CanGoogleDefindItsCore #Crypto
13
·
--
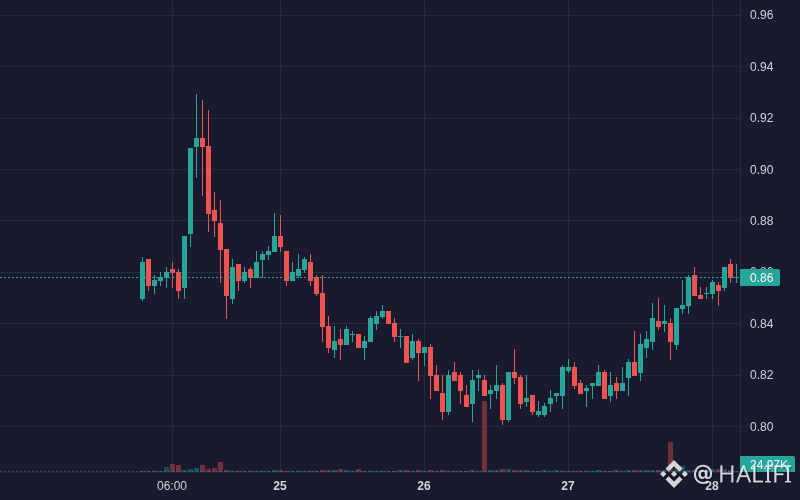
$VANA VANA is showing bullish movement: 5.41% (Crypto).
Volume: 3.32M | Last: $0.857000
Key signals: strong momentum, high volatility, high trader activity.
Bias Daily: BULLISH 🟢 | Weekly: BULLISH 🟢
VANA rebounded 5.8% over the past 24 hours to $0.862, driven by technical momentum off all-time lows.
**Bullish technical breakout (High)**: Price pushed decisively above the EMA_7, EMA_25, and EMA_99 alongside positive MACD histogram expansion → sparked strong upward momentum.
- **Spot net accumulation (Medium)**: Successive positive hourly inflows exceeding +$310K USDT absorbed previous selling pressure near the $0.80 historical floor.
- **AI DataDAO narrative (Low)**: Persistent interest in decentralized data monetization mechanisms provides underlying baseline support during technical rebounds.
#VANA #BinanceSquare #EarningsSeason #CanGoogleDefindItsCore #Crypto
36
·
--
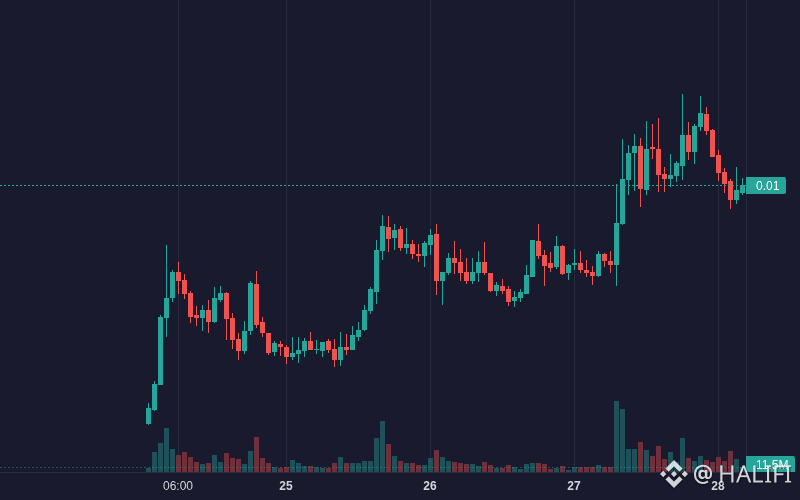
$REZ REZ is showing bullish movement: 8.32% (Crypto).
Volume: 7.70M | Last: $0.005040
Key signals: strong momentum, high volatility, high trader activity.
Bias Daily: BULLISH 🟢 | Weekly: BULLISH 🟢
REZ gained 8.3% over the past 24 hours to $0.00497, retreating from $0.00540 highs amid profit-taking.
**Volume breakout (High)**: Trading volume surged above $3.2M across consecutive hours → price rallied from $0.00465 to a peak of $0.00540
- **Broad net inflows (Medium)**: Sustained positive hourly inflows totaling over $1M absorbed overhead resistance
- **Bullish trend alignment (Medium)**: Short-term EMA 7 crossed above EMA 25 and EMA 99 → confirmed strong upward momentum
#REZ #BinanceSquare #EarningsSeason #CanGoogleDefindItsCore #Crypto
43
·
--
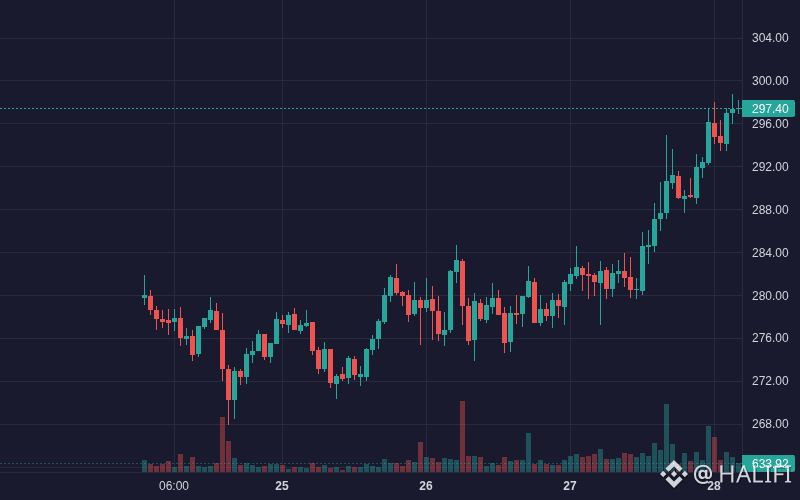
$BCH BCH is showing bullish movement: 5.80% (Crypto).
Volume: 10.84M | Last: $297.50
Key signals: strong momentum, high volatility, high trader activity.
Bias Daily: BULLISH 🟢 | Weekly: BULLISH 🟢
BCH climbed 5.36% over the last 24 hours behind strong large-inflow volume and trend-following momentum.
**Large-order spot inflows (High)**: Repeated surges in large net inflows, peaking at +$273K within an hour, fueled buying pressure → pushed price from $281.90 to $297.00
- **Bullish momentum breakout (Medium)**: MACD histogram expanded positively (+0.68) alongside EMA alignment (EMA7 > EMA25 > EMA99) → accelerated upward price continuation
#BCH #BinanceSquare #EarningsSeason #CanGoogleDefindItsCore #Crypto
66
·
--
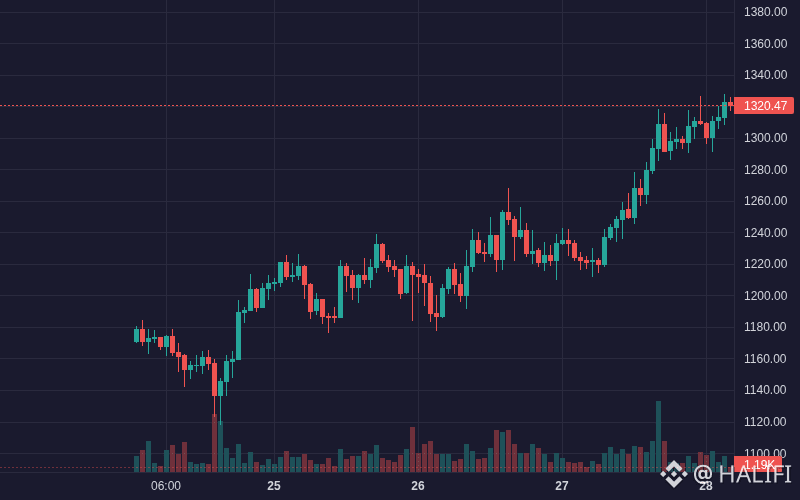
$ZEC ZEC is showing bullish movement: 7.88% (Crypto).
Volume: 164.60M | Last: $1320.69
Key signals: strong momentum, high volatility, high trader activity, massive volume inflow.
Bias Daily: BULLISH 🟢 | Weekly: BULLISH 🟢
ZEC gained 7.4% over 24 hours to $1,312.92, propelled by block subsidy redirection proposals and institutional trust inflows.
**Supply tightening proposal (High)**: Co-founder proposal to redirect the 8% block subsidy to reserve mechanisms → reduced circulating inflation expectations
- **Institutional accumulation (High)**: Steady Trust inflows reaching $41M recently paired with +$13.3M spot net inflow peak → rapid push past $1,300 resistance
- **Scalability & ecosystem expansion (Medium)**: Upcoming NU7 upgrade and cross-chain integrations expanded utility demand
#ZEC #BinanceSquare #EarningsSeason #CanGoogleDefindItsCore #Crypto
70
Log in to explore more content
Join global crypto users on Binance Square
⚡️ Get latest and useful information about crypto.
💬 Trusted by the world’s largest crypto exchange.
👍 Discover real insights from verified creators.
Email / Phone number