李聖庭win
@BTC6666888
擅长波段趋势,中长线,顺势而为,微信公众号:交易员李聖庭
Following
Followers
Liked
Shared
See original
5.14 Ethereum early morning market analysis and operation ideas
Ethereum bulls began to pull up at noon today, and after the highest point reached 2996, it began to fluctuate in a narrow range. From the perspective of daily technical indicators, the current Ethereum and Bitcoin prices are both above the MA5 daily average. At the same time, the BOLL technical indicator is on the right track and is in a strong stage, but it should be noted that it has not been linked to the longs to continue to increase the volume. The decline of the MA5 daily average in the daily technical indicators is also continuing to weaken. At the same time, the daily technical indicators and the MA5 daily average have also produced a certain technical gap. Therefore, on the whole, the currency price will most likely continue to test above the 3000 line this week. From the perspective of TD technical indicators, Ethereum is currently in the red TD8. From the perspective of volume, the appearance of TD8 indicates that the current short volume is insufficient. On the whole, the operation ideas in the early morning and early morning are still recommended to focus on retracement and long positions
From the 4-hour technical indicators, Ethereum has rebounded above the MA5-day moving average. At the same time, the KDJ technical indicators and MACD technical indicators are both in a state of short-selling, but the high MA10-day moving average and MA30-day moving average are still in a state of short-selling suppression. From the overall trend, it is recommended to continue to focus on retracement and long positions in the early morning and morning operations.
Ethereum: Long positions in the first-line area near 2960-2925 Stop loss: 2867 Target: 3020-3060
Bitcoin: Long positions in the first-line area near 63000-62500 Stop loss: 61800 Target: 63600-64500#ETH #BTC $ETH


See original
The Ethereum/Bitcoin current price long ideas given at noon today have all reached the first target point. The Ethereum given at noon today is long near 2920. Today's high point at noon hit 2970, which perfectly reached the entry point and successfully won 50 points of space. Bitcoin is long near 61500. Today's highest point hit: 62500, successfully winning 1000 points of space #BTC #ETH
$ETH
$ETH


李聖庭win
--
Bullish
5.13 Ethereum midday market analysis and operation ideas
After Ethereum rebounded to the 2954 level in the early morning today, it began to rebound. The daily technical indicators showed a good trend, but a new round of short-term declines in the morning touched the 2863 level below. From the current point of view, the short-term short-term decline in the morning successfully touched the support below but failed to break through effectively, indicating that there is strong support and chips at the bottom. From the perspective of daily technical indicators, the KDJ technical indicator and the MACD technical indicator are both in a narrow range of fluctuations. The BOLLL technical indicator is on the right track and is running in the lower track area, but it has not been able to continue to link the shorts to fall in large volume. The high point MA30 daily moving average continues to suppress downwards. At the same time, the currency price tries to stand firm, above the MA5 daily moving average and the MA10 daily moving average. Combining the decline in the morning and the daily trend, the short-term operation is recommended to focus on retracement and long positions
From the 4-hour technical indicators, the KDJ technical indicators and MACD technical indicators are both in a state of short-term shrinkage, the BOLL technical indicator is running in the lower track area, and there are signs of a slight upward trend. At the same time, the ultra-short-term DIF and DEA technical indicators are working together to press up. From a short-term perspective, the ultra-short-term shorts cannot break the lower support line, so we will take advantage of the trend to go long. At the same time, we also remind everyone that the back and forth wash is very serious during this period, and profits should be pocketed in time.
Ethereum: 2920-2885 near the first-line long order, stop loss 2856, target: 2970-3050
Bitcoin: 61500-61000 near the first-line long order, stop loss 60400, target: 62300-63200
#BTC #ETH $ETH
See original
5.13 Ethereum early morning market analysis and operation ideas
Recently, the market has been in a state of market makers washing the market. Judging from the trend of Ethereum today, the overall trend of Ethereum is still dominated by upward amplitude. Today, the lowest point of Ethereum dropped to around 2900, and then began to move upward. From the perspective of daily technical indicators, the main K of Ethereum and Bitcoin has stabilized to above the MA5 daily moving average. At the same time, from the perspective of TD technical indicators, Ethereum is currently in a green TD1 rising and strengthening signal, and the KDJ technical indicators and MACD technical indicators in the daily technical indicators are both in a state of short shrinkage, but the MA three-day moving averages are still in a strong downward suppression state.
From the perspective of 4-hour technical indicators, KDJ technical indicators and MACD technical indicators are both in a bullish and rising state. At the same time, the ultra-short MA5-day moving average and MA10-day moving average are sticking to each other and rising. From the perspective of daily and short-term technical indicators, the operation strategy in the early morning and morning is recommended to be mainly based on retracement and long positions.
Ethereum: Long positions in the area around 2940-2915, stop loss: 2867, target: 3000-3060
Bitcoin: Long positions in the area around 61700-61000, stop loss: 60600, target: 62500-63600#ETH #BTC $ETH


See original
Stop loss on all short positions, go long, target at 3100
李聖庭win
--
Bearish
5.9 Ethereum Evening Market Analysis and Operation Ideas
Today, Ethereum has been in the 3000 area and is fluctuating in a narrow range. At the same time, the strength of this round of decline in the evening has stabilized Ethereum below the 3000 line. From the perspective of daily technical indicators, the three lines of the KDJ technical indicator turned downward, the MACD technical indicator was in a shrinking state, and the BOLL technical indicator was running in the middle track area. At the same time, there were signs of downward opening. Among them, the MA three-day moving averages were arranged in a short position and fell. At the same time, Ethereum is currently in a red TD9 falling signal. The operation ideas in the evening and early morning are recommended to be mainly rebound shorting
From the perspective of 4-hour technical indicators, the KDJ technical indicator and the MACD technical indicator are in a dead cross structure and fell in coordination, and the ultra-short-term Ethereum and Bitcoin are both in a red TD13 falling trend. At the same time, the high point MA30-day moving average continues to press down. The current short-term rebound is still relatively weak. The short-term MA5-day moving average and the MA10-day moving average are pressed down in coordination. From the perspective of comprehensive technical indicators, the operation ideas in the evening and early morning are recommended to be mainly high-altitude
Ethereum can be shorted near: 2980-3010 Defense: 3027 Target: 2900-2880
Bitcoin can be shorted around: 61100-61500 Defense: 62300 Target: 60200-59600#ETH #BTC $ETH


See original
5.9 Ethereum Evening Market Analysis and Operation Ideas
Today, Ethereum has been in the 3000 area and is fluctuating in a narrow range. At the same time, the strength of this round of decline in the evening has stabilized Ethereum below the 3000 line. From the perspective of daily technical indicators, the three lines of the KDJ technical indicator turned downward, the MACD technical indicator was in a shrinking state, and the BOLL technical indicator was running in the middle track area. At the same time, there were signs of downward opening. Among them, the MA three-day moving averages were arranged in a short position and fell. At the same time, Ethereum is currently in a red TD9 falling signal. The operation ideas in the evening and early morning are recommended to be mainly rebound shorting
From the perspective of 4-hour technical indicators, the KDJ technical indicator and the MACD technical indicator are in a dead cross structure and fell in coordination, and the ultra-short-term Ethereum and Bitcoin are both in a red TD13 falling trend. At the same time, the high point MA30-day moving average continues to press down. The current short-term rebound is still relatively weak. The short-term MA5-day moving average and the MA10-day moving average are pressed down in coordination. From the perspective of comprehensive technical indicators, the operation ideas in the evening and early morning are recommended to be mainly high-altitude
Ethereum can be shorted near: 2980-3010 Defense: 3027 Target: 2900-2880
Bitcoin can be shorted around: 61100-61500 Defense: 62300 Target: 60200-59600#ETH #BTC $ETH
Today, Ethereum has been in the 3000 area and is fluctuating in a narrow range. At the same time, the strength of this round of decline in the evening has stabilized Ethereum below the 3000 line. From the perspective of daily technical indicators, the three lines of the KDJ technical indicator turned downward, the MACD technical indicator was in a shrinking state, and the BOLL technical indicator was running in the middle track area. At the same time, there were signs of downward opening. Among them, the MA three-day moving averages were arranged in a short position and fell. At the same time, Ethereum is currently in a red TD9 falling signal. The operation ideas in the evening and early morning are recommended to be mainly rebound shorting
From the perspective of 4-hour technical indicators, the KDJ technical indicator and the MACD technical indicator are in a dead cross structure and fell in coordination, and the ultra-short-term Ethereum and Bitcoin are both in a red TD13 falling trend. At the same time, the high point MA30-day moving average continues to press down. The current short-term rebound is still relatively weak. The short-term MA5-day moving average and the MA10-day moving average are pressed down in coordination. From the perspective of comprehensive technical indicators, the operation ideas in the evening and early morning are recommended to be mainly high-altitude
Ethereum can be shorted near: 2980-3010 Defense: 3027 Target: 2900-2880
Bitcoin can be shorted around: 61100-61500 Defense: 62300 Target: 60200-59600#ETH #BTC $ETH
See original
5.8 Ethereum midday market analysis
From early morning to the present, the shorts have been fluctuating and falling all the way, which actually violates the technical trend structure of the monthly line. At present, the short volume has also fallen below 3000, and there is a second key support below, which is BTC's monthly MA5 (ETH's conversion support line based on BTC's MA5 daily moving average price is about 2873-2791 area). At present, everyone remembers that as long as Bitcoin's monthly MA5 can stabilize the decline sentiment this time, then the decline before the month is determined to be a wash-out harvest by the dealer.
In fact, I have been skeptical about this round of decline in the past two days, but since the dealer wants to wash, the volume and depth of this wash are something that we retail investors cannot know from the technical aspect. Since Ethereum has broken below 3000 in the short term, the intraday short-term line will see whether it can stabilize below 3000. If 3000 can be stabilized, there will be a second key support area of 2873-2791 to limit it.
From the weekly level, the KDJ and MACD indicators have fallen sharply in short positions, and the current coin price in BOLL is also close to the key support of the middle track (the price of the middle track is probably around 3000, and whether the short-term can effectively break below the middle track will also determine the strength of the short-term volume at the weekly level); the main chart MA5 and MA10 daily moving averages are significantly short-suppressed, but the low MA30 daily moving average continues to strengthen. So overall, the weekly trend indicators BOLL and MA30 are not linked to the shorts.
The 12-hour KDJ, MACD and BOLL indicators are linked to the shorts, but the current BOLL lower track has no opening sentiment, on the contrary, it continues to make a technical closing of oscillating upward; the MA5 daily moving average in the main chart continues to fall and suppress, MA10 has no falling sentiment, and the MA30 daily moving average high point falls very reluctantly. Then according to the normal analysis logic prompted by the current technical indicators, the currency price will continue to fluctuate and fall during the day today, and the low point is expected to run to the BOLL lower track area. The approximate price area is near the key support area of 2873-2791 at the monthly level below.
However, the reference value of the indicators in the past two days is not great, because the trend is completely based on the volume, so I personally do not recommend that you chase the short at a low level today. The ultra-short-term intraday can use the reverse logic to conduct tentative operations. If the situation is not right, you should immediately reverse #ETH #BTC $ETH

See original
5.8 Ethereum early morning market analysis and operation ideas
Today, Ethereum has seen a wave of pin-in market. In fact, to put it bluntly, the dealer is still washing the market. I personally estimate that the market will improve after the washing, and the bulls will increase the volume. There are too many short-term market pins in the past two days, and the actual volume is not large. Everyone knows that if the monthly line is good, then the dealer will naturally not let retail investors make profits in this market so easily, so the bulls must be patient.
In terms of technology, there is actually not much change in the early morning. At present, Bitcoin's daily line is extremely good. The 12-hour line BTC is also trying to break MA5 to increase the volume of bulls. As for the weaker performance of Ethereum, it is still due to the pressure of the exchange rate. The exchange rate of Ethereum has been really "a mess" in the past few days. If it weren't for the exchange rate, the price of Ethereum would have stood above 3200 and taken off. So overall, the current technical changes are not big, and our thinking is still consistent with the daytime analysis.
For the current short-term Ethereum shock and retracement sentiment, I personally believe that the dealer is controlling the market and washing the market. After the wash, the price of Ethereum will take off again with the monthly line. The first strong pressure price of the high point ultra-short-term is still referenced near 3175 (daily MA30). If 3175 is effectively broken and stabilized, the subsequent bulls will connect and increase the volume, and the subsequent high-point strong pressure target can also be progressively seen to the vicinity of 3291-3379.
At present, we still focus on whether this ultra-short-term wash can effectively make the price of Ethereum fall below the key support of the low point. The current price fine-tuning reference is near the 3052-3000 area. Everyone remember that as long as the short-term retracement sentiment cannot effectively fall below 3052-3000, Ethereum will rise back as it fell.
Ethereum can be long in batches around: 3070-3050, stop loss: 3000, target: 3160-3200
Bitcoin: long in batches around 63500-63000, stop loss: 62700, target: 64500-65200
#ETH #BTC $ETH


See original
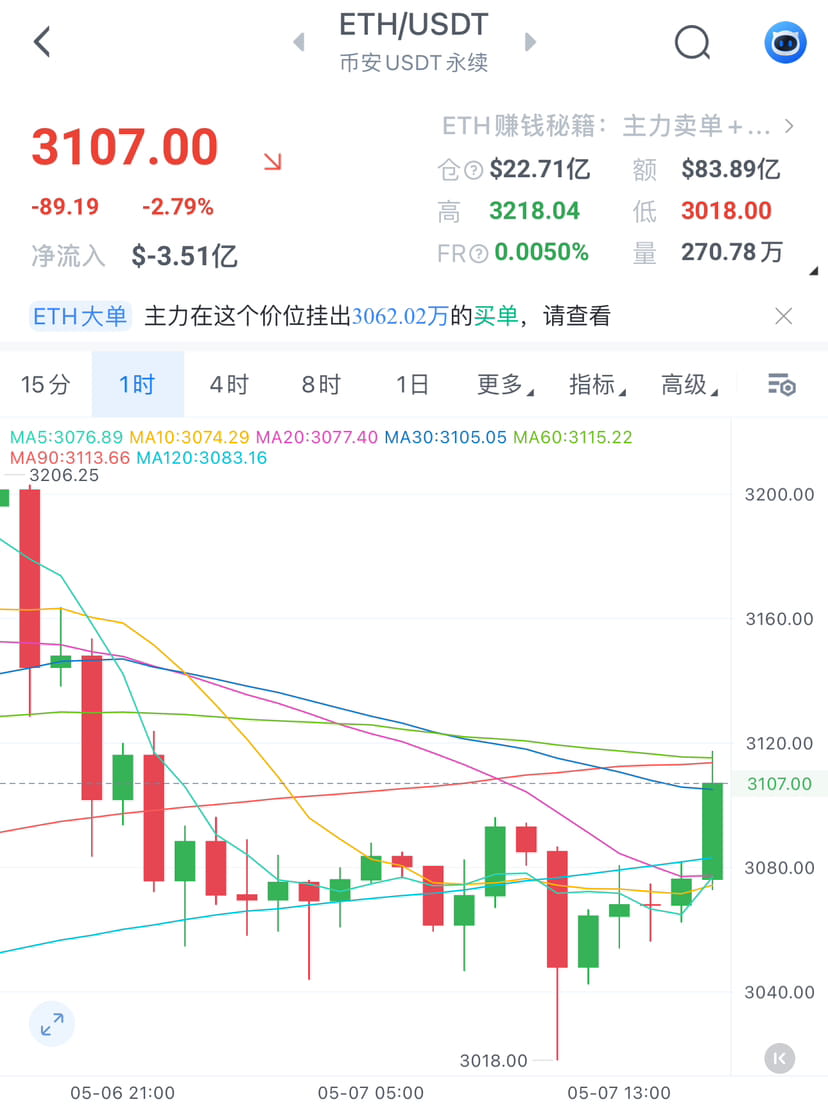
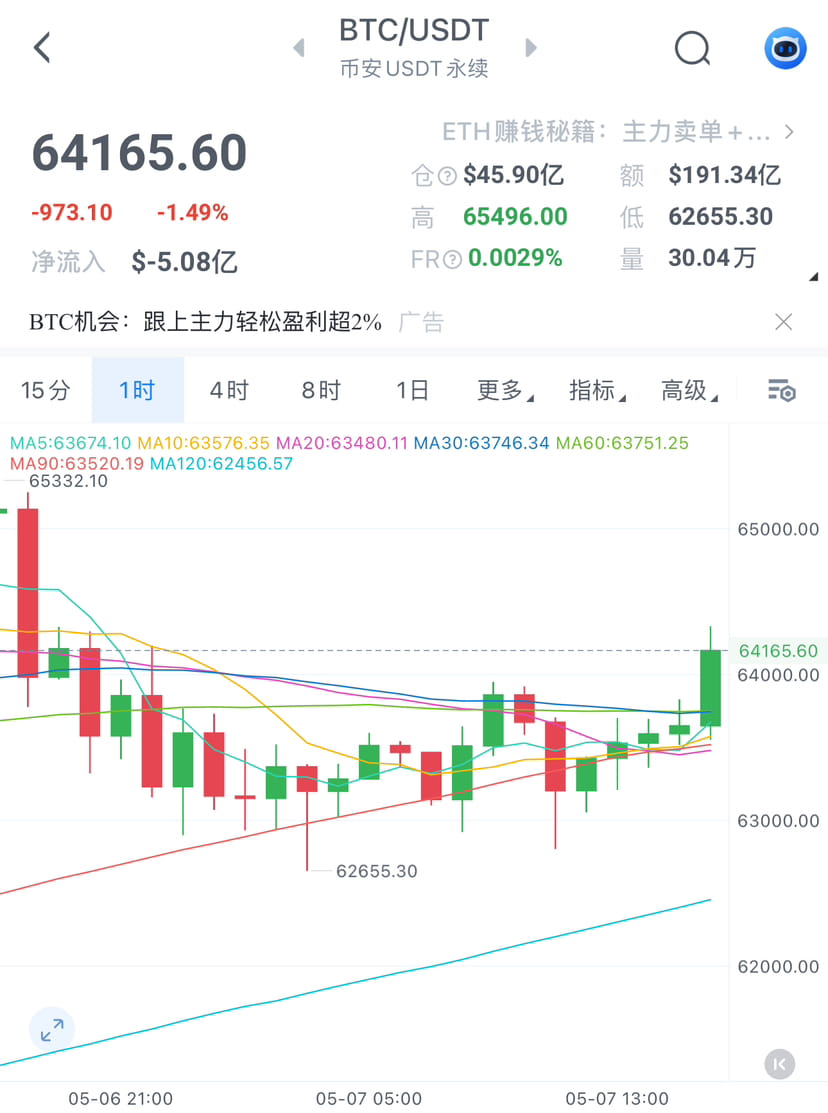
5.7 Ethereum midday market analysis and operation ideas
From early morning to this morning, Ethereum has experienced a wave of continuous short-selling sentiment, but its decline has not effectively broken the key support price of the low point 3070-3026 area. So here we still insist on the short-term idea that if the low point support is not effectively broken, how will Ethereum fall this time and how will it rebound in the future
From the daily level, the KDJ and MACD indicators are still oscillating and rising slightly. In BOLL, the currency price today fell below the BOLL middle track, but everyone should note that the lower track did not produce linkage with the shorts, on the contrary, the indicator closed up and strengthened (this shows the strength of the support below); in the main chart, today's MA10 and MA30 daily moving averages continue to oscillate downward, but the MA5 daily moving average is oscillating upward. Here, MA5 and MA10 cross together, and the directions are inconsistent, so there is a tolerance for short-term trends. In the case of seeking stability, we here refer to the overall trend of BTC. At present, the bullish sentiment of KDJ and MACD at the daily level is greater than that of Ethereum. At the same time, the BOLL price is still active above the middle track; the main chart MA5 daily moving average has a strong sentiment, and the short-term coin price is still active above the MA5 daily moving average. Therefore, from the auxiliary reference of BTC, today's short-term trend should move with the trend of BTC, so the overall trend of the day will be mainly lateral upward.
From the 4-hour level, the 4-hour level of Bitcoin and Ethereum forms a very sharp contrast. At present, the 4H price of Bitcoin has tried to break MA5 and make a long-term increase in the green TD1; on the other hand, the 4H price of Ethereum is still suppressed by the MA5 daily moving average. Fortunately, MA30 did not interact with the shorts, and Bitcoin's MA30 daily moving average was even stronger.
Ethereum can be long at: 3110-3070. Stop loss: 3005. The stop loss is relatively large, leaving room for replenishment. The target is: 3160-3200.
Bitcoin can be long at: 64100-63400. Stop loss: 62600. The target is: 65300-66000.
#ETH #BTC $ETH
See original
5.7 Ethereum early morning market analysis and operation ideas
The extreme door-drawing market that appeared in Ethereum at night today is most likely caused by the market maker's wash. According to the current large-scale trend, the decline is actually because the weekly coin price did not stand firmly above the MA5 daily average line, and then the shorts began to fall in large volume (the weekly line was originally strong during the day today and was heading for the green TD1, and everyone saw the result). In fact, the main reason is that the volume of this rise was not connected. The shorts entered the market near the weekly MA5 daily average line and harvested the short-term contract bulls who were looking for a break. To put it bluntly, it was the market maker's malicious wash to harvest the market. At present, the monthly indicators are still relatively good, especially the monthly Bitcoin line has gone out of the trend rhythm of large-scale pull-up, so today's falling sentiment is more like a prelude to the arrival of the subsequent big market.
From the perspective of daily technical indicators, the KDJ technical indicators and MACD technical indicators are still in the stage of shock and strengthening, and the BOLL medium and short-term coin prices continue to stick to the middle track and oscillate; the main chart MA5 daily moving average also continues to strengthen and rise, and the current daily K coin price is still standing above the MA5 daily moving average to make a green TD3 connection arrangement. As for today's decline sentiment, on the one hand, it is to wash the market and make trouble, and on the other hand, it is to build a bottom again. The key support area of 3070-3026 below. For the short-term trend, whether the daily MA5 can support the main decline this time will also determine the main trend of Ethereum this week.
From the 4-hour level, the current KDJ and MACD indicators are dead crosses and falling, and the BOLL medium and short-term coin price has also fallen below the middle track, but the lower track trend is continuously rising and strengthening (this shows that there is a strong support below to limit the decline of short-term shorts); the main chart MA5 and MA10 daily moving averages cross downward (in fact, this time MA5 and MA10 fell very reluctantly), but the MA30 daily moving average continues to strengthen and rise below, which is the same as the BOLL lower track. Overall, as long as the short-term level of falling sentiment cannot effectively fall below 3070-3026, the subsequent V-reversal will be pulled back in the same way as the short-term price fell this time. Note that only when the short-term coin price effectively falls below 3070-3026 and stabilizes below it, the subsequent weekly retracement may change the technical trend of the monthly level.
$ETH #BTC #ETH
See original
5.6 Ethereum Evening Market Analysis and Operation Ideas
In recent days, Ethereum has been in a narrow range of fluctuations. The price of Ethereum rose to around 3223 at noon, and then the price of the currency appeared in the evening. The hourly level gate was drawn, which shows that it is likely caused by malicious selling by large external investors. From the perspective of daily technical indicators, the KDJ technical indicator and the MACD technical indicator are moving upward in coordination, and the BOLL technical indicator is running in the middle track area and rising in coordination. The MA5-day moving average and the MA10-day moving average are working together to press upward. From the perspective of daily technical indicators, the evening gate drawing cannot affect the trend of long technical indicators. The short-term operation strategy is recommended to focus on retracement and long positions.
From the perspective of 4-hour technical indicators, KDJ technical indicators and MACD technical indicators are in the stage of coordinated rise of bulls, and BOLL technical indicators are in the middle track area in the short term, but they have not linked the MA30-day moving average to rise in coordination. DIF and DEA technical indicators are coordinated to press down, and the ultra-short MA5-day moving average and MA10-day moving average continue to strengthen. For evening operation ideas, it is recommended to focus on retracement and long positions.
Ethereum can be long positions near 3085-3105, stop loss: 3053, target: 3160-3220
Bitcoin can be long positions near 63200-63600, stop loss: 62500, target: 64500-65200
#ETH #BTC $ETH
See original
The long position strategy of Bitcoin/Ethereum arranged in the early morning of today. Ethereum first gave a long position near 2860, but found that it could not be placed, so it was given near 2870 in the comment area. The price of the currency touched 2868 in the early morning of today, reaching the entry position. The highest point today touched near 2977, successfully reaching the stop-profit target. The long position of 57000 line given by the current price of Bitcoin, the price of the currency touched the 58000 line in the early morning, successfully won 1000 points of space #BTC #ETH $ETH


李聖庭win
--
Bullish
5.1 Ethereum early morning market analysis and operation ideas
In the past few days, Ethereum has fallen from the high point of 3359 to around 2796. In just three days, the price of Ethereum has fallen by nearly 500 points, and there is no sign of rebound adjustment in this round of short selling. It can be said that this round of unilateral decline is also very strong. It is not a normal technical decline. It is likely caused by the malicious selling of chips by the dealer or the big outsiders. From the perspective of daily technical indicators, Ethereum and Bitcoin fell today in a broken decline. There is a large gap between the daily price of Ethereum and the MA5 daily moving average. From the perspective of technical indicators, the decline today is beyond expectations.
From the 4-hour technical indicators, the three lines of the KDJ technical indicators turned downward, the BOLL technical indicators and the MACD technical indicators were in a state of falling, and the short-term MA three-day moving average remained in a falling state, but the short-term MA5-day moving average's falling strength was obviously weakening, and at the same time, the short-term MA5-day moving average also had a certain gap. At the same time, short-term Bitcoin and Ethereum have coordinated to stand firm in the green TD9. From the perspective of the TD technical indicators, the current round of decline is likely to have bottomed out, which means that the short-term 2800 line cannot be broken, so it can be understood that Ethereum has completed the bottoming out and will continue to rise in the future.
Ethereum can be long at around 2835-2860, stop loss: 2772, target: 2950-2980
Bitcoin can be long at around 56400-57000, stop loss 55800, target: 57800-58600#BTC #ETH $ETH
See original
4.30 Ethereum midday market analysis and operation ideas
The Bitcoin/Ethereum long-order strategy given in the early morning yesterday also successfully reached the target point. At present, the Ethereum price is in a box structure near 3170. From the perspective of daily technical indicators, the Ethereum price has not effectively fallen below the MA5 daily average, and the current price has been above the MA5 daily average, showing a green TD3 bullish rising pattern. The Bitcoin daily line stabilizes above the MA30 daily average. From the perspective of daily technical indicators, there is little technical change. The Ethereum price is still above the MA5 daily average and the MA10 daily average. From the perspective of technical indicators, the Ethereum bullish sentiment is stronger than Bitcoin. The daily operation ideas remain unchanged, and the main focus is still on retracement and long positions.
From the 4-hour technical indicators, the three lines of the KDJ technical indicator turned upward, and the MACD technical indicator and the BOLL technical indicator were in an upward amplitude. Although the short-term coin price closed below the MA5-day moving average, there was no red TD1 decline signal. At the same time, the MA three-day moving average rose in a bullish pattern, so today's operation ideas remain unchanged, and the main focus is still on retracement.
Ethereum can be long in the area around 3125-3160. Stop loss: 3089. Target: 3230-3280
Bitcoin can be long in the area around 62700-63300. Stop loss: 61800. Target: 64500-65200#ETH #BTC $ETH
See original
All the Ethereum/Bitcoin long strategies given this morning have reached the profit-taking target points. During the early morning, Ethereum was long at around 3135-3170. The highest point this morning reached around 3230, successfully taking nearly 60 points of space. Bitcoin was long at around 63,000. The highest price this morning reached 64,200, successfully taking 800 points of space.


李聖庭win
--
Bullish
4.30 Ethereum early morning market analysis and operation ideas
Ethereum shorts fell again in large volume at noon and evening today, with the lowest point falling to around 3113, and then the currency price began to rebound. From the perspective of daily technical indicators, the KDJ technical indicator and MACD technical indicator are in an upward state as a whole, but the long volume has weakened, and the BOLL technical indicator is in a downward trend. From the perspective of daily technical indicators, the MA5-day moving average and the MA10-day moving average are glued together upward, but the high point MA30-day moving average continues to suppress downward. Judging from the comprehensive technical indicators, the long-short battle is very fierce
From the perspective of the 4-hour ultra-short-term technical indicators, the KDJ technical indicator and the MACD technical indicator continue to strengthen, and the BOLL technical indicator is running in the middle track area. At the same time, the ultra-short MA5-day moving average and the MA10-day moving average continue to be arranged in a bullish pattern, and the ultra-short DIF and DEA technical indicators work together to press upward. The operation ideas in the early morning and early morning are recommended to go long on retracement.
Ethereum can be long in the area around 3135-3170. Stop loss: 3102. Target: 3250-3280
Bitcoin can be long in the area around 62500-63000. Stop loss: 61700. Target: 63800-64500#ETH #BTC $ETH
See original
4.29 Ethereum midday market analysis and operation ideas
Yesterday, I kept suggesting shorting Ethereum/Bitcoin. The general trend is fine. The strategy given in the evening was also lost by the pin in the square. Looking back at the market, it is highly likely that the dealer wanted to increase shipments yesterday, which led to the selling of chips today. From the perspective of daily technical indicators, the KDJ technical indicator and the MACD technical indicator are both in the long resonance stage, the BOLL technical indicator is still running in the middle track area, and the currency price has been active near the middle track. In the daily technical indicators, the MA5-day moving average and the MA10-day moving average are also in a cross-up, but it should be noted that the MA30-day moving average still forms a strong downward pressure, but the monthly bullish trend is still good
From the 4-hour technical indicators, the BOLL technical indicator and the MACD indicator are oscillating slightly upward. The ultra-short-term coin price is still sticking to the MA5 and MA30 daily moving averages. The three lines of the KDJ technical indicator are turning upward. The DIF and DEA technical indicators are working together to press upward. Therefore, the operation ideas for noon and evening are mainly based on retracement and long positions.
Ethereum can be long positions near 3190-3165. Stop loss: 3123. Target: 3260-3300
Bitcoin can be long positions near 62000-62400. Stop loss: 61300. Target: 63500-64200#ETH #BTC $ETH
Explore the lastest crypto news
⚡️ Be a part of the latests discussions in crypto
💬 Interact with your favorite creators
👍 Enjoy content that interests you
Email / Phone number
Trending Topics
bitcoin
14.9M views
4,419 Posts
$BTC #bitcoin Boooooooooooooooooom
JUST IN:
Former PayPal President and Lightspark CEO David Marcus says every corporation in the world will end up using #Bitcoin Lightning to settle transactions 🚀
CZ fan official
17 Likes
16.4k views
Binance
18.6M views
8,183 Posts
USDT
2.9M views
737 Posts


