

#bitcoin
bitcoin
343.3M views
808,428 Discussing
Hot
Latest

·
--
How Will the US Midterm Elections Affect the Crypto Market?The US midterm elections on November 3, 2026, are significant events that could affect not only the country's political balance but also the future of the cryptocurrency market. Changes in the distribution of seats in Congress could be decisive in terms of regulations for digital assets, institutional investors' approach to the market, and the growth potential of the crypto sector. However, investors should remember that the election results do not guarantee a direct and lasting rise in crypto assets.
CLARITY Act and Regulatory Uncertainty
One of the most important aspects of the elections for the crypto market is the CLARITY Act, which aims to define the legal status and regulatory framework for digital assets. This regulation could contribute to a clearer definition of the boundaries of authority between the Securities and Exchange Commission (SEC) and the Commodity Futures Commission (CFTC) in the US.
However, disagreements during the Senate process indicate that the creation of the legal framework depends on political consensus. According to a Reuters analysis dated October 13, 2026, a Democratic majority in Congress could lead to increased oversight and investigations into crypto companies. This should be closely monitored, particularly for altcoins and decentralized finance (DeFi) projects, which are sensitive to regulatory decisions.
If Republicans retain their majority in Congress, expectations for progress on regulations supported by the crypto sector could strengthen. However, a political majority alone is not enough to pass legislation; the balance of votes in the Senate, bipartisan consensus, and the presidential process are also important.
Bitcoin and Altcoins May React Differently
Global liquidity, the trajectory of the US dollar, bond yields, and investor risk appetite continue to be key factors influencing Bitcoin's price movements. Therefore, positive political developments in the midterm elections do not automatically translate into a rise in Bitcoin. If macroeconomic conditions worsen, election-related optimism may be limited.
For altcoins, regulatory uncertainty could be a more significant risk factor. Issues such as the potential for cryptocurrency to be considered a security, staking activities, exchange regulations, and institutional access can directly impact investor demand for specific projects. A clearer legal framework may support institutional participation, while stricter regulations may make it difficult for some projects to operate.
Volatility may increase before and after elections
As the election date approaches, the pricing of expectations in the markets may increase short-term fluctuations. If the election results align with pre priced expectations, the price reaction may be limited. However, if the outcome deviates from expectations, sharp movements may be seen, especially in leveraged transactions.
During this process, #Bitcoin and #Ethereum , as well as the total cryptocurrency market capitalization, open interest, funding rates, and spot trading volumes should be monitored. An excessive increase in open interest while the price is rising may indicate leverage accumulation in the market. Conversely, increases supported by spot demand may be more meaningful in evaluating the nature of the movement.
The Direction Will Not Be Determined Solely By Elections
The US midterm elections may have an impact on the cryptocurrency market, particularly through regulatory expectations. However, to determine the medium- and long-term direction of Bitcoin and altcoins, in addition to election results, Fed policy, global liquidity, institutional capital flows, and on-chain data should also be evaluated.
For investors, the healthiest approach would be to evaluate different possibilities and monitor price movements using volume, volatility, and leverage indicators, rather than taking positions based on a single scenario before the elections. While political developments are a significant catalyst, a lasting change in the crypto market requires price behavior to support these expectations. $BTC $ETH #Altcoins
How Will the US Midterm Elections Affect the Crypto Market?
The US midterm elections on November 3, 2026, are significant events that could affect not only the country's political balance but also the future of the cryptocurrency market. Changes in the distribution of seats in Congress could be decisive in terms of regulations for digital assets, institutional investors' approach to the market, and the growth potential of the crypto sector. However, investors should remember that the election results do not guarantee a direct and lasting rise in crypto assets.
CLARITY Act and Regulatory Uncertainty
One of the most important aspects of the elections for the crypto market is the CLARITY Act, which aims to define the legal status and regulatory framework for digital assets. This regulation could contribute to a clearer definition of the boundaries of authority between the Securities and Exchange Commission (SEC) and the Commodity Futures Commission (CFTC) in the US.
However, disagreements during the Senate process indicate that the creation of the legal framework depends on political consensus. According to a Reuters analysis dated October 13, 2026, a Democratic majority in Congress could lead to increased oversight and investigations into crypto companies. This should be closely monitored, particularly for altcoins and decentralized finance (DeFi) projects, which are sensitive to regulatory decisions.
If Republicans retain their majority in Congress, expectations for progress on regulations supported by the crypto sector could strengthen. However, a political majority alone is not enough to pass legislation; the balance of votes in the Senate, bipartisan consensus, and the presidential process are also important.
Bitcoin and Altcoins May React Differently
Global liquidity, the trajectory of the US dollar, bond yields, and investor risk appetite continue to be key factors influencing Bitcoin's price movements. Therefore, positive political developments in the midterm elections do not automatically translate into a rise in Bitcoin. If macroeconomic conditions worsen, election-related optimism may be limited.
For altcoins, regulatory uncertainty could be a more significant risk factor. Issues such as the potential for cryptocurrency to be considered a security, staking activities, exchange regulations, and institutional access can directly impact investor demand for specific projects. A clearer legal framework may support institutional participation, while stricter regulations may make it difficult for some projects to operate.
Volatility may increase before and after elections
As the election date approaches, the pricing of expectations in the markets may increase short-term fluctuations. If the election results align with pre priced expectations, the price reaction may be limited. However, if the outcome deviates from expectations, sharp movements may be seen, especially in leveraged transactions.
During this process, #Bitcoin and #Ethereum , as well as the total cryptocurrency market capitalization, open interest, funding rates, and spot trading volumes should be monitored. An excessive increase in open interest while the price is rising may indicate leverage accumulation in the market. Conversely, increases supported by spot demand may be more meaningful in evaluating the nature of the movement.
The Direction Will Not Be Determined Solely By Elections
The US midterm elections may have an impact on the cryptocurrency market, particularly through regulatory expectations. However, to determine the medium- and long-term direction of Bitcoin and altcoins, in addition to election results, Fed policy, global liquidity, institutional capital flows, and on-chain data should also be evaluated.
For investors, the healthiest approach would be to evaluate different possibilities and monitor price movements using volume, volatility, and leverage indicators, rather than taking positions based on a single scenario before the elections. While political developments are a significant catalyst, a lasting change in the crypto market requires price behavior to support these expectations. $BTC $ETH #Altcoins
CLARITY Act and Regulatory Uncertainty
One of the most important aspects of the elections for the crypto market is the CLARITY Act, which aims to define the legal status and regulatory framework for digital assets. This regulation could contribute to a clearer definition of the boundaries of authority between the Securities and Exchange Commission (SEC) and the Commodity Futures Commission (CFTC) in the US.
However, disagreements during the Senate process indicate that the creation of the legal framework depends on political consensus. According to a Reuters analysis dated October 13, 2026, a Democratic majority in Congress could lead to increased oversight and investigations into crypto companies. This should be closely monitored, particularly for altcoins and decentralized finance (DeFi) projects, which are sensitive to regulatory decisions.
If Republicans retain their majority in Congress, expectations for progress on regulations supported by the crypto sector could strengthen. However, a political majority alone is not enough to pass legislation; the balance of votes in the Senate, bipartisan consensus, and the presidential process are also important.
Bitcoin and Altcoins May React Differently
Global liquidity, the trajectory of the US dollar, bond yields, and investor risk appetite continue to be key factors influencing Bitcoin's price movements. Therefore, positive political developments in the midterm elections do not automatically translate into a rise in Bitcoin. If macroeconomic conditions worsen, election-related optimism may be limited.
For altcoins, regulatory uncertainty could be a more significant risk factor. Issues such as the potential for cryptocurrency to be considered a security, staking activities, exchange regulations, and institutional access can directly impact investor demand for specific projects. A clearer legal framework may support institutional participation, while stricter regulations may make it difficult for some projects to operate.
Volatility may increase before and after elections
As the election date approaches, the pricing of expectations in the markets may increase short-term fluctuations. If the election results align with pre priced expectations, the price reaction may be limited. However, if the outcome deviates from expectations, sharp movements may be seen, especially in leveraged transactions.
During this process, #Bitcoin and #Ethereum , as well as the total cryptocurrency market capitalization, open interest, funding rates, and spot trading volumes should be monitored. An excessive increase in open interest while the price is rising may indicate leverage accumulation in the market. Conversely, increases supported by spot demand may be more meaningful in evaluating the nature of the movement.
The Direction Will Not Be Determined Solely By Elections
The US midterm elections may have an impact on the cryptocurrency market, particularly through regulatory expectations. However, to determine the medium- and long-term direction of Bitcoin and altcoins, in addition to election results, Fed policy, global liquidity, institutional capital flows, and on-chain data should also be evaluated.
For investors, the healthiest approach would be to evaluate different possibilities and monitor price movements using volume, volatility, and leverage indicators, rather than taking positions based on a single scenario before the elections. While political developments are a significant catalyst, a lasting change in the crypto market requires price behavior to support these expectations. $BTC $ETH #Altcoins
1
700

·
--
Bullish
🚨 Most of the heavy $BTC
{future}(BTCUSDT)
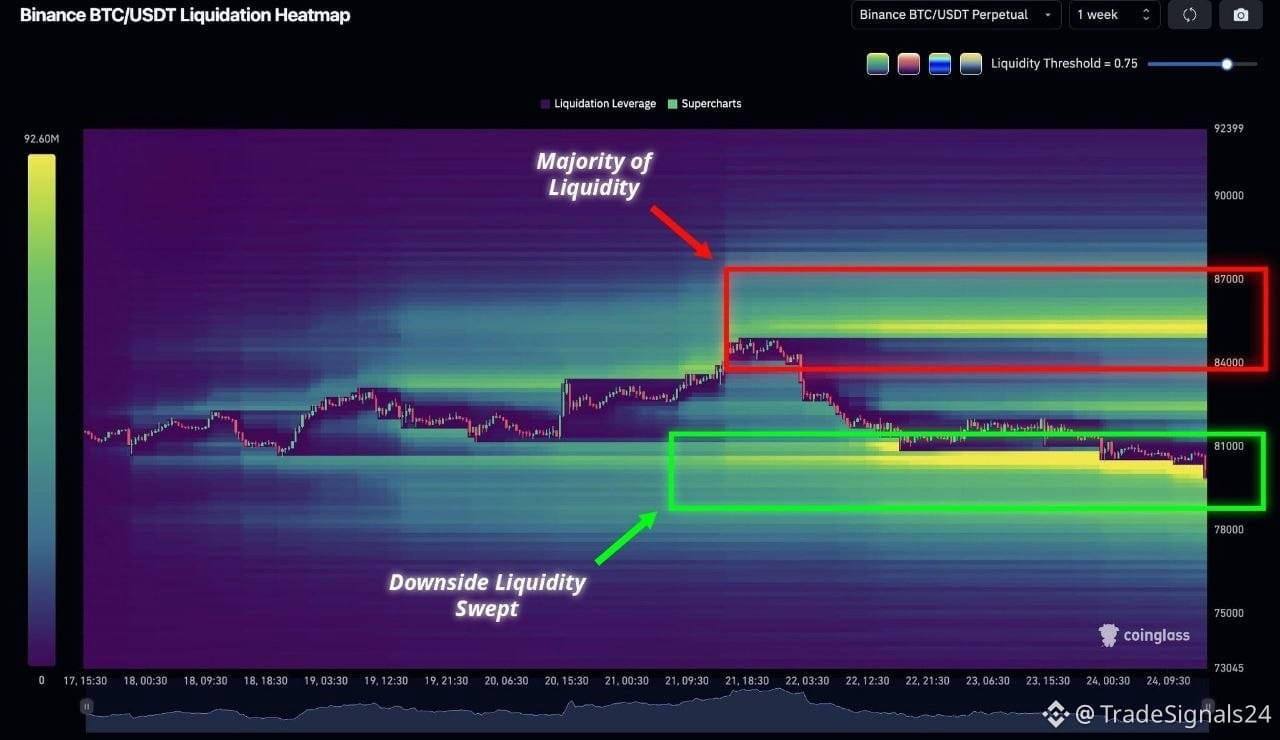
Bitcoin liquidity is stacked above $84K.
With price still grinding well below that zone, a clean push toward $84K could ignite a wave of short liquidations and fuel a sharp squeeze.
The setup is sitting right there — the market just needs the trigger.
#Bitcoin #BTC #Crypto #ShortSqueeze
🚨 Most of the heavy $BTC
Bitcoin liquidity is stacked above $84K.
With price still grinding well below that zone, a clean push toward $84K could ignite a wave of short liquidations and fuel a sharp squeeze.
The setup is sitting right there — the market just needs the trigger.
#Bitcoin #BTC #Crypto #ShortSqueeze
Bitcoin liquidity is stacked above $84K.
With price still grinding well below that zone, a clean push toward $84K could ignite a wave of short liquidations and fuel a sharp squeeze.
The setup is sitting right there — the market just needs the trigger.
#Bitcoin #BTC #Crypto #ShortSqueeze
5
2.8k

·
--
#usq3gdpandseptemberpceduenextweek
🚨 THE MACRO CATALYST: What Could Shake Bitcoin and Crypto This Week?
All eyes are locked on Thursday, October 29, as the U.S. drops two massive economic reports that could dictate the next major market move: Q3 GDP and September PCE inflation data.
Volatility is incoming, and the outcome depends entirely on how these numbers shift Federal Reserve rate expectations.
📊 What’s on the Line?
1. U.S. Q3 GDP (Growth Check): Shows how fast the economy grew. Strong growth builds confidence, but if it runs too hot, it risks fueling hawkish rate concerns.
2. September PCE (The Fed's Preferred Gauge): Core PCE dictates central bank policy. Cooling inflation = dovish signal = potential crypto pump. Hot inflation = heavy pressure on risk assets like Bitcoin.
📉 The Playbook for Traders
The Sweet Spot: Resilient growth combined with softer inflation could create a prime risk-on environment for BTC and altcoins.
The Risk Zone: Sticky inflation paired with slowing growth increases market uncertainty and triggers sharp liquidations across leveraged positions.
💡 Pro-Tip: Don't trade purely on the raw headlines—trade the reaction and watch how price structure respects key support levels once the data drops.
🔮 Are you positioning defensively ahead of Thursday, or expecting a bullish breakout? Share your strategy below! 👇
#Bitcoin #crypto #BinancePicks $BTC $ETH $SOL
#usq3gdpandseptemberpceduenextweek
🚨 THE MACRO CATALYST: What Could Shake Bitcoin and Crypto This Week?
All eyes are locked on Thursday, October 29, as the U.S. drops two massive economic reports that could dictate the next major market move: Q3 GDP and September PCE inflation data.
Volatility is incoming, and the outcome depends entirely on how these numbers shift Federal Reserve rate expectations.
📊 What’s on the Line?
1. U.S. Q3 GDP (Growth Check): Shows how fast the economy grew. Strong growth builds confidence, but if it runs too hot, it risks fueling hawkish rate concerns.
2. September PCE (The Fed's Preferred Gauge): Core PCE dictates central bank policy. Cooling inflation = dovish signal = potential crypto pump. Hot inflation = heavy pressure on risk assets like Bitcoin.
📉 The Playbook for Traders
The Sweet Spot: Resilient growth combined with softer inflation could create a prime risk-on environment for BTC and altcoins.
The Risk Zone: Sticky inflation paired with slowing growth increases market uncertainty and triggers sharp liquidations across leveraged positions.
💡 Pro-Tip: Don't trade purely on the raw headlines—trade the reaction and watch how price structure respects key support levels once the data drops.
🔮 Are you positioning defensively ahead of Thursday, or expecting a bullish breakout? Share your strategy below! 👇
#Bitcoin #crypto #BinancePicks $BTC $ETH $SOL
🚨 THE MACRO CATALYST: What Could Shake Bitcoin and Crypto This Week?
All eyes are locked on Thursday, October 29, as the U.S. drops two massive economic reports that could dictate the next major market move: Q3 GDP and September PCE inflation data.
Volatility is incoming, and the outcome depends entirely on how these numbers shift Federal Reserve rate expectations.
📊 What’s on the Line?
1. U.S. Q3 GDP (Growth Check): Shows how fast the economy grew. Strong growth builds confidence, but if it runs too hot, it risks fueling hawkish rate concerns.
2. September PCE (The Fed's Preferred Gauge): Core PCE dictates central bank policy. Cooling inflation = dovish signal = potential crypto pump. Hot inflation = heavy pressure on risk assets like Bitcoin.
📉 The Playbook for Traders
The Sweet Spot: Resilient growth combined with softer inflation could create a prime risk-on environment for BTC and altcoins.
The Risk Zone: Sticky inflation paired with slowing growth increases market uncertainty and triggers sharp liquidations across leveraged positions.
💡 Pro-Tip: Don't trade purely on the raw headlines—trade the reaction and watch how price structure respects key support levels once the data drops.
🔮 Are you positioning defensively ahead of Thursday, or expecting a bullish breakout? Share your strategy below! 👇
#Bitcoin #crypto #BinancePicks $BTC $ETH $SOL

3
5.9k


·
--
📉 Bitcoin Daily 📈
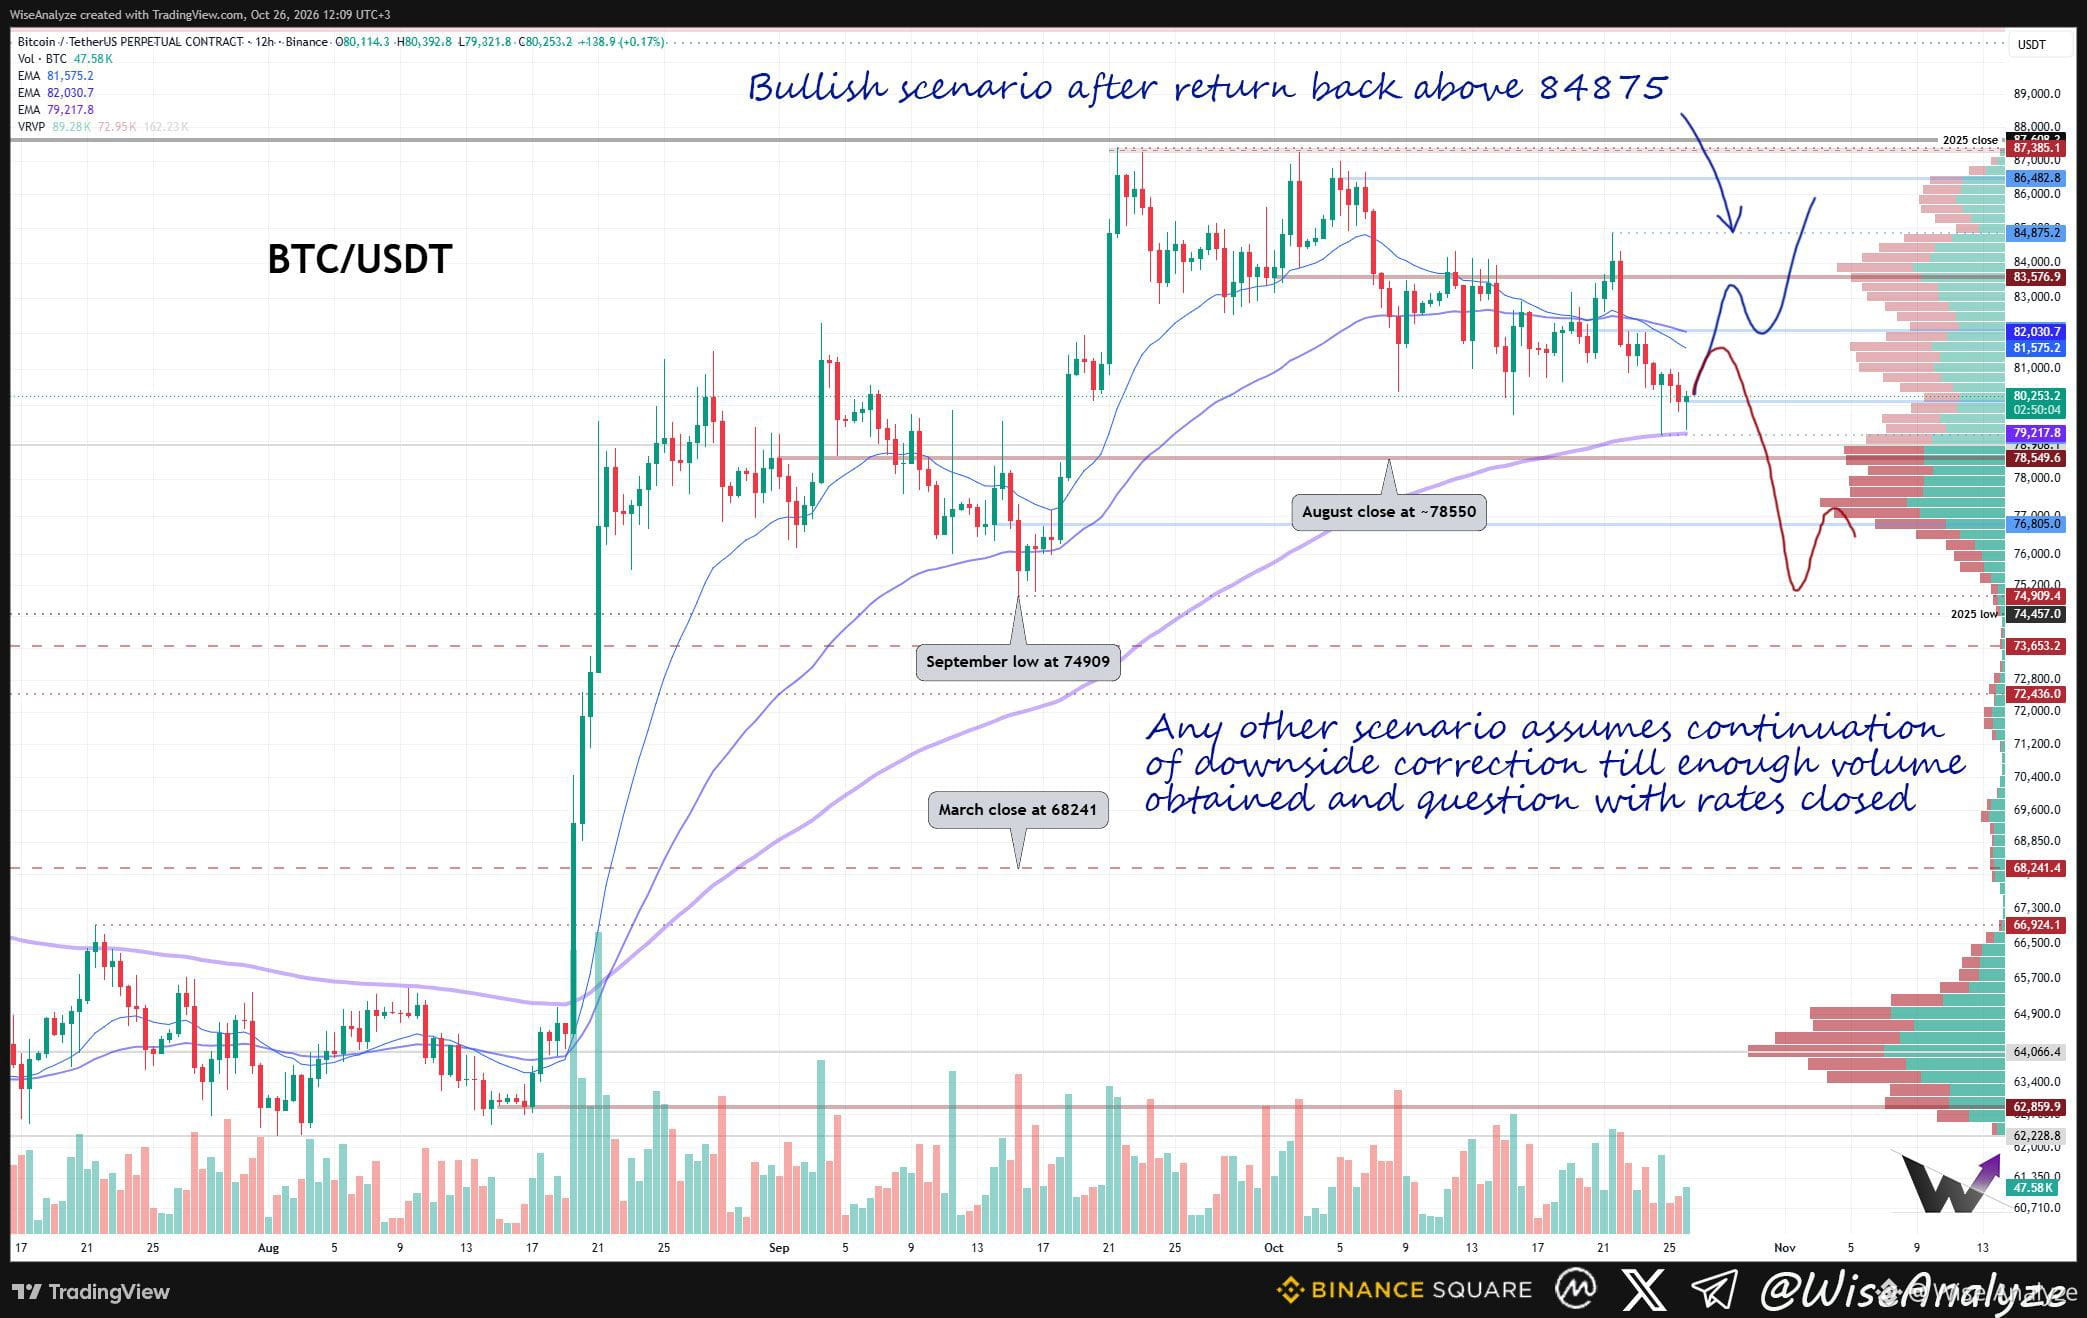
$BTC wiped out stops under 15/10 low on Saturday. Day timeframe is turning bearish. We may still count on a bounce, but the longer it takes the more prone this chart is to fall into correction.
🎯 Nearest Key Levels
Above: 81400 / 82565 / 84970
Below: 78995 / 74980 / 68800
{future}(BTCUSDT)
Interest rates decision is coming this Wednesday. Forecast is for no changes to be made. If that was priced in, the bounce will follow (up to 83k). But if no changes on this meeting, then most probably there will be a rate hike on December 8–9, so my long term forecast for dump within Q4 stays valid.
I won't call it a healthy correction. There is nothing "healthy" left in modern world.
📉 High Timeframe Forecast: I expect a dump during Q4, as the Fed is expected to raise interest rates either on October 27–28 or later, on December 8–9
⏰ Free TG #Bitcoin alarms set for: Y VWAP VAH, D/W/M 20ema, 87249.6, 73653, 68241
📉 Bitcoin Daily 📈
$BTC wiped out stops under 15/10 low on Saturday. Day timeframe is turning bearish. We may still count on a bounce, but the longer it takes the more prone this chart is to fall into correction.
🎯 Nearest Key Levels
Above: 81400 / 82565 / 84970
Below: 78995 / 74980 / 68800
Interest rates decision is coming this Wednesday. Forecast is for no changes to be made. If that was priced in, the bounce will follow (up to 83k). But if no changes on this meeting, then most probably there will be a rate hike on December 8–9, so my long term forecast for dump within Q4 stays valid.
I won't call it a healthy correction. There is nothing "healthy" left in modern world.
📉 High Timeframe Forecast: I expect a dump during Q4, as the Fed is expected to raise interest rates either on October 27–28 or later, on December 8–9
⏰ Free TG #Bitcoin alarms set for: Y VWAP VAH, D/W/M 20ema, 87249.6, 73653, 68241
$BTC wiped out stops under 15/10 low on Saturday. Day timeframe is turning bearish. We may still count on a bounce, but the longer it takes the more prone this chart is to fall into correction.
🎯 Nearest Key Levels
Above: 81400 / 82565 / 84970
Below: 78995 / 74980 / 68800
Interest rates decision is coming this Wednesday. Forecast is for no changes to be made. If that was priced in, the bounce will follow (up to 83k). But if no changes on this meeting, then most probably there will be a rate hike on December 8–9, so my long term forecast for dump within Q4 stays valid.
I won't call it a healthy correction. There is nothing "healthy" left in modern world.
📉 High Timeframe Forecast: I expect a dump during Q4, as the Fed is expected to raise interest rates either on October 27–28 or later, on December 8–9
⏰ Free TG #Bitcoin alarms set for: Y VWAP VAH, D/W/M 20ema, 87249.6, 73653, 68241
515

·
--
Article
$1 BILLION INTO BITCOIN… THEN A SHOCK REVERSAL!$TSMB
Bitcoin’s institutional demand is sending mixed signals! 👀
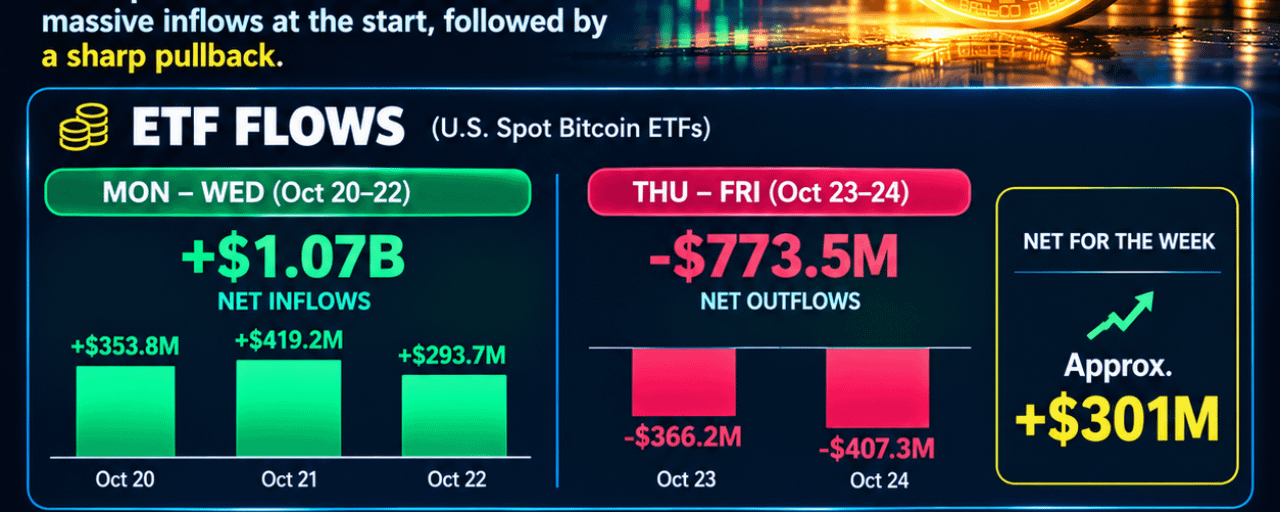
U.S. Spot Bitcoin ETFs attracted around $1.07 billion in inflows from October 20–22, but the following two days brought approximately $773.5 million in outflows.
Despite the sudden reversal, the funds still ended the week with roughly $301 million in net inflows. <Cite refs={["turn585273search3"]}/>
📊 What does this tell us?
🟢 Large inflows can signal renewed institutional interest.
🔴 Sudden withdrawals show that investor sentiment can change quickly.
⚡ A positive weekly total does not guarantee that Bitcoin is ready for another rally.
The big question: Will institutional buyers return, or is Bitcoin entering another period of uncertainty?
💬 What’s your view: bullish recovery or another correction?
#bitcoin
#ETFvsBTC #CryptoNewss #BinanceSquareTalks
$1 BILLION INTO BITCOIN… THEN A SHOCK REVERSAL!
$TSMB
Bitcoin’s institutional demand is sending mixed signals! 👀
U.S. Spot Bitcoin ETFs attracted around $1.07 billion in inflows from October 20–22, but the following two days brought approximately $773.5 million in outflows.
Despite the sudden reversal, the funds still ended the week with roughly $301 million in net inflows. <Cite refs={["turn585273search3"]}/>
📊 What does this tell us?
🟢 Large inflows can signal renewed institutional interest.
🔴 Sudden withdrawals show that investor sentiment can change quickly.
⚡ A positive weekly total does not guarantee that Bitcoin is ready for another rally.
The big question: Will institutional buyers return, or is Bitcoin entering another period of uncertainty?
💬 What’s your view: bullish recovery or another correction?
#bitcoin
#ETFvsBTC #CryptoNewss #BinanceSquareTalks
Bitcoin’s institutional demand is sending mixed signals! 👀
U.S. Spot Bitcoin ETFs attracted around $1.07 billion in inflows from October 20–22, but the following two days brought approximately $773.5 million in outflows.
Despite the sudden reversal, the funds still ended the week with roughly $301 million in net inflows. <Cite refs={["turn585273search3"]}/>
📊 What does this tell us?
🟢 Large inflows can signal renewed institutional interest.
🔴 Sudden withdrawals show that investor sentiment can change quickly.
⚡ A positive weekly total does not guarantee that Bitcoin is ready for another rally.
The big question: Will institutional buyers return, or is Bitcoin entering another period of uncertainty?
💬 What’s your view: bullish recovery or another correction?
#bitcoin
#ETFvsBTC #CryptoNewss #BinanceSquareTalks
Abu Fahadأ:
💛
1
300

·
--
Bearish
🧚♂️ #BossSignal SPECIAL POST 🧙♂️📊
💰 $BTC | $ZEC | $ETH | $NEAR | $BNB
🛑 STOP LOSS (SL) IS A TRADER'S BEST FRIEND!
I use a Stop Loss (SL) in every trade because risk management is essential in crypto trading. Today, let's learn why SL matters! 🎯
📉 LONG TRADE + SL HIT = Potentially Bearish Signal 🐻
📈 SHORT TRADE + SL HIT = Potentially Bullish Signal 🐂
🧠 Now, do you understand why Stop Loss is so important?
Professional traders don't place trades randomly. They analyze the charts, calculate the risks, plan their entries and exits, and set their Stop Loss before entering a trade.
🛡️ Why is SL important? ✅ Helps protect your capital from unexpected losses. ✅ Keeps your trading disciplined. ✅ Helps manage risk during volatile market conditions. ✅ Prevents one bad trade from causing excessive losses.
⚠️ Remember, crypto trading is highly volatile and risky. A Stop Loss is essential, but it cannot guarantee that every loss will be limited to the exact SL price.
👻 A little wisdom from the #BossSignal Ghost!
Don't trade on emotions. Don't blindly follow every crypto influencer who makes bold predictions.
Learn from experienced, disciplined traders. Analyze the market. Manage your risks. Always trade with a plan! 💎📈
🧚♂️ Knowledge + Discipline + Risk Management = Smarter Trading!
#Bitcoin #RiskManagement #TradingEducation
🧚♂️ #BossSignal SPECIAL POST 🧙♂️📊
💰 $BTC | $ZEC | $ETH | $NEAR | $BNB
🛑 STOP LOSS (SL) IS A TRADER'S BEST FRIEND!
I use a Stop Loss (SL) in every trade because risk management is essential in crypto trading. Today, let's learn why SL matters! 🎯
📉 LONG TRADE + SL HIT = Potentially Bearish Signal 🐻
📈 SHORT TRADE + SL HIT = Potentially Bullish Signal 🐂
🧠 Now, do you understand why Stop Loss is so important?
Professional traders don't place trades randomly. They analyze the charts, calculate the risks, plan their entries and exits, and set their Stop Loss before entering a trade.
🛡️ Why is SL important? ✅ Helps protect your capital from unexpected losses. ✅ Keeps your trading disciplined. ✅ Helps manage risk during volatile market conditions. ✅ Prevents one bad trade from causing excessive losses.
⚠️ Remember, crypto trading is highly volatile and risky. A Stop Loss is essential, but it cannot guarantee that every loss will be limited to the exact SL price.
👻 A little wisdom from the #BossSignal Ghost!
Don't trade on emotions. Don't blindly follow every crypto influencer who makes bold predictions.
Learn from experienced, disciplined traders. Analyze the market. Manage your risks. Always trade with a plan! 💎📈
🧚♂️ Knowledge + Discipline + Risk Management = Smarter Trading!
#Bitcoin #RiskManagement #TradingEducation
💰 $BTC | $ZEC | $ETH | $NEAR | $BNB
🛑 STOP LOSS (SL) IS A TRADER'S BEST FRIEND!
I use a Stop Loss (SL) in every trade because risk management is essential in crypto trading. Today, let's learn why SL matters! 🎯
📉 LONG TRADE + SL HIT = Potentially Bearish Signal 🐻
📈 SHORT TRADE + SL HIT = Potentially Bullish Signal 🐂
🧠 Now, do you understand why Stop Loss is so important?
Professional traders don't place trades randomly. They analyze the charts, calculate the risks, plan their entries and exits, and set their Stop Loss before entering a trade.
🛡️ Why is SL important? ✅ Helps protect your capital from unexpected losses. ✅ Keeps your trading disciplined. ✅ Helps manage risk during volatile market conditions. ✅ Prevents one bad trade from causing excessive losses.
⚠️ Remember, crypto trading is highly volatile and risky. A Stop Loss is essential, but it cannot guarantee that every loss will be limited to the exact SL price.
👻 A little wisdom from the #BossSignal Ghost!
Don't trade on emotions. Don't blindly follow every crypto influencer who makes bold predictions.
Learn from experienced, disciplined traders. Analyze the market. Manage your risks. Always trade with a plan! 💎📈
🧚♂️ Knowledge + Discipline + Risk Management = Smarter Trading!
#Bitcoin #RiskManagement #TradingEducation

1
340

·
--
Article
Bitcoin Retail Deposits Hit 6-Month High as Whale Transfers to Binance DeclineRetail deposits surge: CryptoQuant data shows retail Bitcoin deposits to Binance rose from $5.5 billion in April to $10.75 billion, a six-month high.Whale deposits fall: Transfers from large Bitcoin holders to Binance declined 36% from late August, dropping from $5.9 billion to $3.8 billion.Selling pressure remains uncertain: Retail deposits now stand at 2.8 times whale deposits, but exchange transfers alone do not confirm that holders have sold their BTC.
Bitcoin retail deposits to Binance have climbed to a six-month high of $10.75 billion over a 30-day period, while whale deposits have fallen 36% since late August to $3.8 billion. CryptoQuant data shows retail flows exceeding whale flows, potentially indicating that smaller holders are moving BTC onto exchanges during the rebound. However, deposits do not necessarily mean selling, and the figures cover Binance rather than the entire cryptocurrency market.
Bitcoin Retail Deposits Rise as Whale Activity Moves in the Opposite Direction
Bitcoin is showing a notable divide between retail and large-holder exchange activity. Retail deposits to Binance have nearly doubled since April, while Bitcoin whale deposits have declined over almost two months.
Data from on-chain analytics firm CryptoQuant shows the 30-day retail deposit total climbing from $5.5 billion in April to $10.75 billion, reaching its highest level in six months.
🗞️ Retail Inflows hit a 6-Month high as bitcoin:native holds $80KBTC flow analysis shows that whales and retail investors are behaving in radically opposite ways right now.This is not new, retail investors are known for being more emotional, more unstable and more reactive to market moves than whales.But the gap we are seeing today is particularly wide.On the retail side, inflows are surging on Binance.With Bitcoin holding above $80 000 for several weeks, deposits from small holders have reached their highest level in 6 months.On a 30-day sum basis, they have gone from $5.5B to $10.75B, nearly doubling in a very short time.On the whale side, it's the opposite. Their BTC inflows to Binance have been declining steadily for almost 2 months, falling from $5.9B at the end of August to $3.8B today. No sign of rush.After a decline that lasted a full year, retail investors seem to be treating this first rebound as an exit window, a chance to sell at more comfortable levels and relieve built-up pressure.Whales, on the other hand, are staying patient and are in no hurry to send their BTC to exchanges, which suggests they are not looking to distribute at these levels.This divergence is worth watching, particularly to see whether whales will maintain this restraint if the price keeps climbing.— Darkfost (@Darkfost_Coc) October 25, 2026
The retail figure is now 2.8 times the whale deposit total, leaving a reported gap of $6.95 billion between the two groups.
The divergence offers a view of how different groups of Bitcoin holders are positioning their coins during the market rebound. However, it does not establish whether retail investors are actively selling or whether large holders are deliberately waiting for higher prices.
Retail Bitcoin Deposits Reach $10.75 Billion
The increase in retail deposits suggests that smaller Bitcoin holders are moving more BTC onto Binance, one of the world's largest cryptocurrency exchanges.
CryptoQuant's 30-day measure aggregates deposits over the preceding month, helping smooth out unusually large transfers on individual days. That makes the trend more informative than a single-day spike, although it still reflects exchange transfers rather than completed trades.
Moving Bitcoin onto an exchange can make it easier to sell, trade or use as collateral. For that reason, analysts often monitor rising deposits as a potential indicator of increased available supply.
One possible interpretation is that retail holders are using the rebound as an opportunity to realize gains or reduce exposure after market volatility. But this remains an inference, not confirmed selling activity.
Some deposits may instead reflect wallet reorganizations, transfers between custodians or preparation for other trading strategies. Transaction-flow data alone cannot distinguish among those motivations.
Bitcoin Whale Deposits to Binance Fall 36%
Large-holder activity has moved in the opposite direction.
According to CryptoQuant, whale deposits to Binance have fallen from $5.9 billion in late August to $3.8 billion, a decline of 36%.
The remaining flow is still substantial. The data points to a slowdown in whale deposits, not a complete withdrawal of large holders from exchange activity.
Lower whale deposits may indicate that large Bitcoin holders are transferring fewer coins to Binance during the current period. That could limit one potential source of exchange-side selling pressure if the pattern persists.
However, it would be premature to conclude that whales are uniformly accumulating BTC or refusing to sell. The figures measure deposits to Binance only, and activity on other exchanges or through over-the-counter markets may differ.
The distinction matters because large holders can change their behavior quickly in response to market conditions, liquidity needs or portfolio adjustments.
October Inflation Report Failed to Trigger a Whale Deposit Rebound
The current pattern follows an earlier period in which whales increased their balances ahead of the October US inflation report, according to the source analysis.
The report was followed by a 3.3% Bitcoin decline over 24 hours. Despite that market reaction, whale deposits to Binance have not increased since the report, based on the cited data.
That lack of a rebound in whale deposits is notable because market volatility can prompt large holders to move assets onto exchanges in preparation for trading or risk management.
Still, the absence of higher deposits does not reveal the reasons behind whale behavior. Large holders may be using other venues, retaining coins in custody or responding to factors not captured by Binance transfer data.
The available figures establish a difference in exchange flows, but they do not provide a complete account of institutional or large-holder sentiment.
What the Retail-Whale Divide Means for Bitcoin Market Structure
The gap between retail and whale deposits creates two possible interpretations for the market.
If retail deposits continue to rise while whale deposits remain subdued, retail participants could account for a larger share of the Bitcoin supply arriving on Binance. That would make smaller-holder activity more important in assessing potential exchange-side selling pressure.
If whale deposits increase again, both groups could contribute more coins to the exchange's available supply. Whether those deposits translate into selling would depend on actual trade execution and prevailing demand.
This is why exchange inflows should be considered alongside spot trading volume, price movements, exchange reserves and other on-chain indicators. No single metric can confirm the direction of the broader market.
Investor psychology also plays a role. Retail participants may be more inclined to secure gains during a rebound after a period of uncertainty, while large holders may use different time horizons or trading venues. Yet the observed flows do not prove that either group shares a single strategy.
Why Binance Data Does Not Tell the Whole Bitcoin Story
The data provides a useful look at activity on Binance, but it should not be treated as a complete measure of Bitcoin supply across the market.
Coins sent to Binance may be sold, traded for other assets or simply held in exchange custody. Conversely, lower deposits do not rule out selling through other exchanges or trading channels.
The 30-day aggregation also means the retail figure reflects activity across an extended period rather than a single event. It can help reveal persistent changes in deposit behavior, but the underlying reasons still require additional evidence.
For a more complete assessment, analysts would need to compare the figures with broader exchange flows, spot-market activity and other indicators of holder behavior.
Bitcoin's Next Test Is Whether the Flow Divergence Persists
The central question is whether retail deposits remain elevated while whale transfers stay below their late-August levels.
A sustained divergence would reinforce the view that retail holders are contributing a larger share of Binance's incoming Bitcoin. A renewed increase in whale deposits would change that balance, although it would not automatically confirm that large holders are selling.
For now, CryptoQuant's data shows a clear contrast: retail Bitcoin deposits have reached a six-month high, while whale deposits have declined by more than one-third since late August.
Originally first published at CryptosNewss.com
#BinancePick #bitcoin $BTC
Bitcoin Retail Deposits Hit 6-Month High as Whale Transfers to Binance Decline
Retail deposits surge: CryptoQuant data shows retail Bitcoin deposits to Binance rose from $5.5 billion in April to $10.75 billion, a six-month high.Whale deposits fall: Transfers from large Bitcoin holders to Binance declined 36% from late August, dropping from $5.9 billion to $3.8 billion.Selling pressure remains uncertain: Retail deposits now stand at 2.8 times whale deposits, but exchange transfers alone do not confirm that holders have sold their BTC.
Bitcoin retail deposits to Binance have climbed to a six-month high of $10.75 billion over a 30-day period, while whale deposits have fallen 36% since late August to $3.8 billion. CryptoQuant data shows retail flows exceeding whale flows, potentially indicating that smaller holders are moving BTC onto exchanges during the rebound. However, deposits do not necessarily mean selling, and the figures cover Binance rather than the entire cryptocurrency market.
Bitcoin Retail Deposits Rise as Whale Activity Moves in the Opposite Direction
Bitcoin is showing a notable divide between retail and large-holder exchange activity. Retail deposits to Binance have nearly doubled since April, while Bitcoin whale deposits have declined over almost two months.
Data from on-chain analytics firm CryptoQuant shows the 30-day retail deposit total climbing from $5.5 billion in April to $10.75 billion, reaching its highest level in six months.
🗞️ Retail Inflows hit a 6-Month high as bitcoin:native holds $80KBTC flow analysis shows that whales and retail investors are behaving in radically opposite ways right now.This is not new, retail investors are known for being more emotional, more unstable and more reactive to market moves than whales.But the gap we are seeing today is particularly wide.On the retail side, inflows are surging on Binance.With Bitcoin holding above $80 000 for several weeks, deposits from small holders have reached their highest level in 6 months.On a 30-day sum basis, they have gone from $5.5B to $10.75B, nearly doubling in a very short time.On the whale side, it's the opposite. Their BTC inflows to Binance have been declining steadily for almost 2 months, falling from $5.9B at the end of August to $3.8B today. No sign of rush.After a decline that lasted a full year, retail investors seem to be treating this first rebound as an exit window, a chance to sell at more comfortable levels and relieve built-up pressure.Whales, on the other hand, are staying patient and are in no hurry to send their BTC to exchanges, which suggests they are not looking to distribute at these levels.This divergence is worth watching, particularly to see whether whales will maintain this restraint if the price keeps climbing.— Darkfost (@Darkfost_Coc) October 25, 2026
The retail figure is now 2.8 times the whale deposit total, leaving a reported gap of $6.95 billion between the two groups.
The divergence offers a view of how different groups of Bitcoin holders are positioning their coins during the market rebound. However, it does not establish whether retail investors are actively selling or whether large holders are deliberately waiting for higher prices.
Retail Bitcoin Deposits Reach $10.75 Billion
The increase in retail deposits suggests that smaller Bitcoin holders are moving more BTC onto Binance, one of the world's largest cryptocurrency exchanges.
CryptoQuant's 30-day measure aggregates deposits over the preceding month, helping smooth out unusually large transfers on individual days. That makes the trend more informative than a single-day spike, although it still reflects exchange transfers rather than completed trades.
Moving Bitcoin onto an exchange can make it easier to sell, trade or use as collateral. For that reason, analysts often monitor rising deposits as a potential indicator of increased available supply.
One possible interpretation is that retail holders are using the rebound as an opportunity to realize gains or reduce exposure after market volatility. But this remains an inference, not confirmed selling activity.
Some deposits may instead reflect wallet reorganizations, transfers between custodians or preparation for other trading strategies. Transaction-flow data alone cannot distinguish among those motivations.
Bitcoin Whale Deposits to Binance Fall 36%
Large-holder activity has moved in the opposite direction.
According to CryptoQuant, whale deposits to Binance have fallen from $5.9 billion in late August to $3.8 billion, a decline of 36%.
The remaining flow is still substantial. The data points to a slowdown in whale deposits, not a complete withdrawal of large holders from exchange activity.
Lower whale deposits may indicate that large Bitcoin holders are transferring fewer coins to Binance during the current period. That could limit one potential source of exchange-side selling pressure if the pattern persists.
However, it would be premature to conclude that whales are uniformly accumulating BTC or refusing to sell. The figures measure deposits to Binance only, and activity on other exchanges or through over-the-counter markets may differ.
The distinction matters because large holders can change their behavior quickly in response to market conditions, liquidity needs or portfolio adjustments.
October Inflation Report Failed to Trigger a Whale Deposit Rebound
The current pattern follows an earlier period in which whales increased their balances ahead of the October US inflation report, according to the source analysis.
The report was followed by a 3.3% Bitcoin decline over 24 hours. Despite that market reaction, whale deposits to Binance have not increased since the report, based on the cited data.
That lack of a rebound in whale deposits is notable because market volatility can prompt large holders to move assets onto exchanges in preparation for trading or risk management.
Still, the absence of higher deposits does not reveal the reasons behind whale behavior. Large holders may be using other venues, retaining coins in custody or responding to factors not captured by Binance transfer data.
The available figures establish a difference in exchange flows, but they do not provide a complete account of institutional or large-holder sentiment.
What the Retail-Whale Divide Means for Bitcoin Market Structure
The gap between retail and whale deposits creates two possible interpretations for the market.
If retail deposits continue to rise while whale deposits remain subdued, retail participants could account for a larger share of the Bitcoin supply arriving on Binance. That would make smaller-holder activity more important in assessing potential exchange-side selling pressure.
If whale deposits increase again, both groups could contribute more coins to the exchange's available supply. Whether those deposits translate into selling would depend on actual trade execution and prevailing demand.
This is why exchange inflows should be considered alongside spot trading volume, price movements, exchange reserves and other on-chain indicators. No single metric can confirm the direction of the broader market.
Investor psychology also plays a role. Retail participants may be more inclined to secure gains during a rebound after a period of uncertainty, while large holders may use different time horizons or trading venues. Yet the observed flows do not prove that either group shares a single strategy.
Why Binance Data Does Not Tell the Whole Bitcoin Story
The data provides a useful look at activity on Binance, but it should not be treated as a complete measure of Bitcoin supply across the market.
Coins sent to Binance may be sold, traded for other assets or simply held in exchange custody. Conversely, lower deposits do not rule out selling through other exchanges or trading channels.
The 30-day aggregation also means the retail figure reflects activity across an extended period rather than a single event. It can help reveal persistent changes in deposit behavior, but the underlying reasons still require additional evidence.
For a more complete assessment, analysts would need to compare the figures with broader exchange flows, spot-market activity and other indicators of holder behavior.
Bitcoin's Next Test Is Whether the Flow Divergence Persists
The central question is whether retail deposits remain elevated while whale transfers stay below their late-August levels.
A sustained divergence would reinforce the view that retail holders are contributing a larger share of Binance's incoming Bitcoin. A renewed increase in whale deposits would change that balance, although it would not automatically confirm that large holders are selling.
For now, CryptoQuant's data shows a clear contrast: retail Bitcoin deposits have reached a six-month high, while whale deposits have declined by more than one-third since late August.
Originally first published at CryptosNewss.com
#BinancePick #bitcoin $BTC
Bitcoin retail deposits to Binance have climbed to a six-month high of $10.75 billion over a 30-day period, while whale deposits have fallen 36% since late August to $3.8 billion. CryptoQuant data shows retail flows exceeding whale flows, potentially indicating that smaller holders are moving BTC onto exchanges during the rebound. However, deposits do not necessarily mean selling, and the figures cover Binance rather than the entire cryptocurrency market.
Bitcoin Retail Deposits Rise as Whale Activity Moves in the Opposite Direction
Bitcoin is showing a notable divide between retail and large-holder exchange activity. Retail deposits to Binance have nearly doubled since April, while Bitcoin whale deposits have declined over almost two months.
Data from on-chain analytics firm CryptoQuant shows the 30-day retail deposit total climbing from $5.5 billion in April to $10.75 billion, reaching its highest level in six months.
🗞️ Retail Inflows hit a 6-Month high as bitcoin:native holds $80KBTC flow analysis shows that whales and retail investors are behaving in radically opposite ways right now.This is not new, retail investors are known for being more emotional, more unstable and more reactive to market moves than whales.But the gap we are seeing today is particularly wide.On the retail side, inflows are surging on Binance.With Bitcoin holding above $80 000 for several weeks, deposits from small holders have reached their highest level in 6 months.On a 30-day sum basis, they have gone from $5.5B to $10.75B, nearly doubling in a very short time.On the whale side, it's the opposite. Their BTC inflows to Binance have been declining steadily for almost 2 months, falling from $5.9B at the end of August to $3.8B today. No sign of rush.After a decline that lasted a full year, retail investors seem to be treating this first rebound as an exit window, a chance to sell at more comfortable levels and relieve built-up pressure.Whales, on the other hand, are staying patient and are in no hurry to send their BTC to exchanges, which suggests they are not looking to distribute at these levels.This divergence is worth watching, particularly to see whether whales will maintain this restraint if the price keeps climbing.— Darkfost (@Darkfost_Coc) October 25, 2026
The retail figure is now 2.8 times the whale deposit total, leaving a reported gap of $6.95 billion between the two groups.
The divergence offers a view of how different groups of Bitcoin holders are positioning their coins during the market rebound. However, it does not establish whether retail investors are actively selling or whether large holders are deliberately waiting for higher prices.
Retail Bitcoin Deposits Reach $10.75 Billion
The increase in retail deposits suggests that smaller Bitcoin holders are moving more BTC onto Binance, one of the world's largest cryptocurrency exchanges.
CryptoQuant's 30-day measure aggregates deposits over the preceding month, helping smooth out unusually large transfers on individual days. That makes the trend more informative than a single-day spike, although it still reflects exchange transfers rather than completed trades.
Moving Bitcoin onto an exchange can make it easier to sell, trade or use as collateral. For that reason, analysts often monitor rising deposits as a potential indicator of increased available supply.
One possible interpretation is that retail holders are using the rebound as an opportunity to realize gains or reduce exposure after market volatility. But this remains an inference, not confirmed selling activity.
Some deposits may instead reflect wallet reorganizations, transfers between custodians or preparation for other trading strategies. Transaction-flow data alone cannot distinguish among those motivations.
Bitcoin Whale Deposits to Binance Fall 36%
Large-holder activity has moved in the opposite direction.
According to CryptoQuant, whale deposits to Binance have fallen from $5.9 billion in late August to $3.8 billion, a decline of 36%.
The remaining flow is still substantial. The data points to a slowdown in whale deposits, not a complete withdrawal of large holders from exchange activity.
Lower whale deposits may indicate that large Bitcoin holders are transferring fewer coins to Binance during the current period. That could limit one potential source of exchange-side selling pressure if the pattern persists.
However, it would be premature to conclude that whales are uniformly accumulating BTC or refusing to sell. The figures measure deposits to Binance only, and activity on other exchanges or through over-the-counter markets may differ.
The distinction matters because large holders can change their behavior quickly in response to market conditions, liquidity needs or portfolio adjustments.
October Inflation Report Failed to Trigger a Whale Deposit Rebound
The current pattern follows an earlier period in which whales increased their balances ahead of the October US inflation report, according to the source analysis.
The report was followed by a 3.3% Bitcoin decline over 24 hours. Despite that market reaction, whale deposits to Binance have not increased since the report, based on the cited data.
That lack of a rebound in whale deposits is notable because market volatility can prompt large holders to move assets onto exchanges in preparation for trading or risk management.
Still, the absence of higher deposits does not reveal the reasons behind whale behavior. Large holders may be using other venues, retaining coins in custody or responding to factors not captured by Binance transfer data.
The available figures establish a difference in exchange flows, but they do not provide a complete account of institutional or large-holder sentiment.
What the Retail-Whale Divide Means for Bitcoin Market Structure
The gap between retail and whale deposits creates two possible interpretations for the market.
If retail deposits continue to rise while whale deposits remain subdued, retail participants could account for a larger share of the Bitcoin supply arriving on Binance. That would make smaller-holder activity more important in assessing potential exchange-side selling pressure.
If whale deposits increase again, both groups could contribute more coins to the exchange's available supply. Whether those deposits translate into selling would depend on actual trade execution and prevailing demand.
This is why exchange inflows should be considered alongside spot trading volume, price movements, exchange reserves and other on-chain indicators. No single metric can confirm the direction of the broader market.
Investor psychology also plays a role. Retail participants may be more inclined to secure gains during a rebound after a period of uncertainty, while large holders may use different time horizons or trading venues. Yet the observed flows do not prove that either group shares a single strategy.
Why Binance Data Does Not Tell the Whole Bitcoin Story
The data provides a useful look at activity on Binance, but it should not be treated as a complete measure of Bitcoin supply across the market.
Coins sent to Binance may be sold, traded for other assets or simply held in exchange custody. Conversely, lower deposits do not rule out selling through other exchanges or trading channels.
The 30-day aggregation also means the retail figure reflects activity across an extended period rather than a single event. It can help reveal persistent changes in deposit behavior, but the underlying reasons still require additional evidence.
For a more complete assessment, analysts would need to compare the figures with broader exchange flows, spot-market activity and other indicators of holder behavior.
Bitcoin's Next Test Is Whether the Flow Divergence Persists
The central question is whether retail deposits remain elevated while whale transfers stay below their late-August levels.
A sustained divergence would reinforce the view that retail holders are contributing a larger share of Binance's incoming Bitcoin. A renewed increase in whale deposits would change that balance, although it would not automatically confirm that large holders are selling.
For now, CryptoQuant's data shows a clear contrast: retail Bitcoin deposits have reached a six-month high, while whale deposits have declined by more than one-third since late August.
Originally first published at CryptosNewss.com
#BinancePick #bitcoin $BTC
1
1k

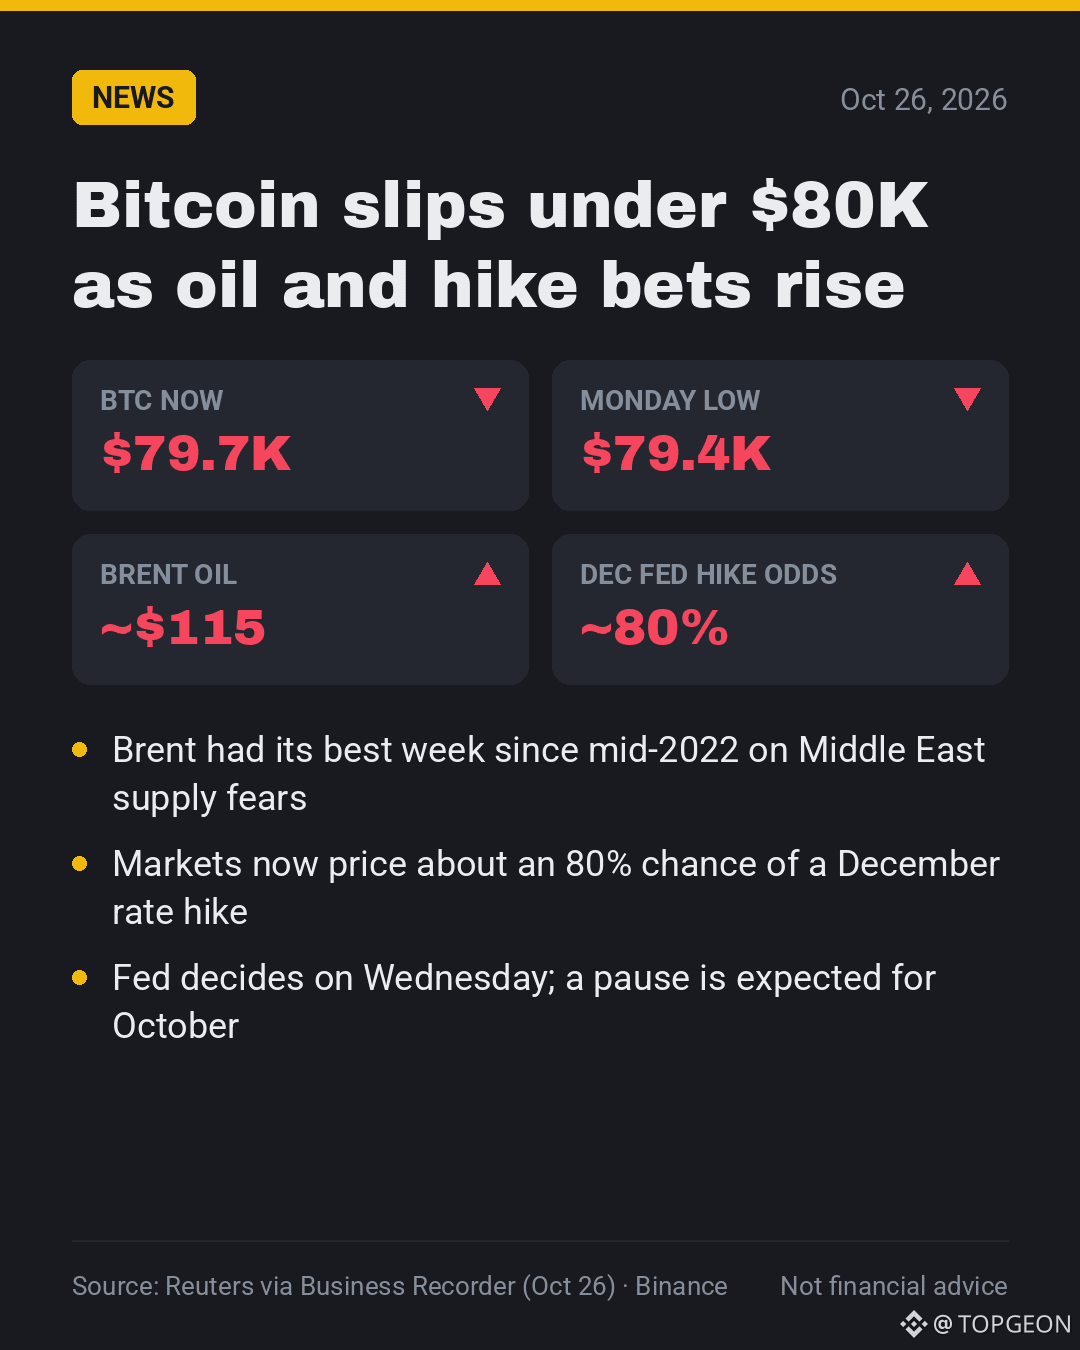
🚨 OIL SHOCK vs BITCOIN: Is Crypto Facing Another Macro Test? 🛢️₿
Oil is near $115. Inflation fears are back. And crypto traders have a major question:
Could rising oil prices become Bitcoin's next headwind?
Here's why it matters 👇
🔹 Inflation risk: Higher energy costs can push inflation expectations higher.
🔹 Fed dilemma: Persistent inflation could limit rate cuts or keep borrowing costs elevated.
🔹 Crypto pressure: Tighter financial conditions and weaker risk appetite could weigh on BTC and altcoins.
🔹 The other side: If oil cools and inflation concerns ease, risk assets could find breathing room.
⚠️ Oil alone cannot predict Bitcoin's next move. Watch the Fed, Treasury yields, BTC support levels and market liquidity.
💬 Your view: If oil stays above $110, will Bitcoin face more downside pressure, or can BTC surprise the market?
Follow for simple crypto insights, market setups & opportunities.
#Bitcoin #CryptoMarket #Inflation
{future}(BTCUSDT)
🚨 OIL SHOCK vs BITCOIN: Is Crypto Facing Another Macro Test? 🛢️₿
Oil is near $115. Inflation fears are back. And crypto traders have a major question:
Could rising oil prices become Bitcoin's next headwind?
Here's why it matters 👇
🔹 Inflation risk: Higher energy costs can push inflation expectations higher.
🔹 Fed dilemma: Persistent inflation could limit rate cuts or keep borrowing costs elevated.
🔹 Crypto pressure: Tighter financial conditions and weaker risk appetite could weigh on BTC and altcoins.
🔹 The other side: If oil cools and inflation concerns ease, risk assets could find breathing room.
⚠️ Oil alone cannot predict Bitcoin's next move. Watch the Fed, Treasury yields, BTC support levels and market liquidity.
💬 Your view: If oil stays above $110, will Bitcoin face more downside pressure, or can BTC surprise the market?
Follow for simple crypto insights, market setups & opportunities.
#Bitcoin #CryptoMarket #Inflation
Oil is near $115. Inflation fears are back. And crypto traders have a major question:
Could rising oil prices become Bitcoin's next headwind?
Here's why it matters 👇
🔹 Inflation risk: Higher energy costs can push inflation expectations higher.
🔹 Fed dilemma: Persistent inflation could limit rate cuts or keep borrowing costs elevated.
🔹 Crypto pressure: Tighter financial conditions and weaker risk appetite could weigh on BTC and altcoins.
🔹 The other side: If oil cools and inflation concerns ease, risk assets could find breathing room.
⚠️ Oil alone cannot predict Bitcoin's next move. Watch the Fed, Treasury yields, BTC support levels and market liquidity.
💬 Your view: If oil stays above $110, will Bitcoin face more downside pressure, or can BTC surprise the market?
Follow for simple crypto insights, market setups & opportunities.
#Bitcoin #CryptoMarket #Inflation

1
267

·
--
🚨 BREAKING: South Korea Prepares to Delay 22% Crypto Tax for the 4th Time!
South Korea is once again considering postponing its controversial 22% cryptocurrency gains tax for a fourth time. This decision offers significant regulatory relief for one of the most active retail trading hubs in the world, preventing potential tax-induced sell-offs and maintaining market liquidity.
Key Takeaways:
• 4th Delay Proposed: South Korean lawmakers are moving to push back the strict 22% capital gains tax on crypto assets.
• Major Trader Relief: Protects domestic liquidity and avoids premature capital flight from South Korean exchanges.
• Macro Market Stability: Eliminates immediate tax overhang, giving investors greater confidence during current market consolidation.
With $BTC hovering around $80,123, removing short-term regulatory friction in key Asian jurisdictions provides crucial support for global market sentiment. Keeping local capital active inside the ecosystem helps maintain healthy trading volume across major trading desks.
Do you think delaying crypto taxes will spark stronger Asian session rallies for $BTC? Share your view below! 👇
$BTC
#BinanceSquare #CryptoNews #Bitcoin
🚨 BREAKING: South Korea Prepares to Delay 22% Crypto Tax for the 4th Time!
South Korea is once again considering postponing its controversial 22% cryptocurrency gains tax for a fourth time. This decision offers significant regulatory relief for one of the most active retail trading hubs in the world, preventing potential tax-induced sell-offs and maintaining market liquidity.
Key Takeaways:
• 4th Delay Proposed: South Korean lawmakers are moving to push back the strict 22% capital gains tax on crypto assets.
• Major Trader Relief: Protects domestic liquidity and avoids premature capital flight from South Korean exchanges.
• Macro Market Stability: Eliminates immediate tax overhang, giving investors greater confidence during current market consolidation.
With $BTC hovering around $80,123, removing short-term regulatory friction in key Asian jurisdictions provides crucial support for global market sentiment. Keeping local capital active inside the ecosystem helps maintain healthy trading volume across major trading desks.
Do you think delaying crypto taxes will spark stronger Asian session rallies for $BTC ? Share your view below! 👇
$BTC
#BinanceSquare #CryptoNews #Bitcoin
South Korea is once again considering postponing its controversial 22% cryptocurrency gains tax for a fourth time. This decision offers significant regulatory relief for one of the most active retail trading hubs in the world, preventing potential tax-induced sell-offs and maintaining market liquidity.
Key Takeaways:
• 4th Delay Proposed: South Korean lawmakers are moving to push back the strict 22% capital gains tax on crypto assets.
• Major Trader Relief: Protects domestic liquidity and avoids premature capital flight from South Korean exchanges.
• Macro Market Stability: Eliminates immediate tax overhang, giving investors greater confidence during current market consolidation.
With $BTC hovering around $80,123, removing short-term regulatory friction in key Asian jurisdictions provides crucial support for global market sentiment. Keeping local capital active inside the ecosystem helps maintain healthy trading volume across major trading desks.
Do you think delaying crypto taxes will spark stronger Asian session rallies for $BTC ? Share your view below! 👇
$BTC
#BinanceSquare #CryptoNews #Bitcoin
432
·
--
A newly revealed security incident involving a Polkadot wallet, dormant for 20 months, has sent shockwaves through the DeFi community. The breach highlights a dangerous trade-off in modern blockchain design: while faster finality and reduced exit times improve user experience, they significantly shrink the window for security teams to coordinate and freeze compromised funds before they are withdrawn. For holders of $DOT, this serves as a stark reminder that speed is not always synonymous with safety.
• The breach was only detected after 20 months of inactivity, exposing gaps in long-term wallet monitoring.
• Reduced nominator exit times on Polkadot leave less time for emergency response before funds become liquid.
• This incident underscores the critical balance between network efficiency and security protocols in Layer 1 architectures.
As we navigate a market where $BTC hovers near 80,454, institutional and retail investors are increasingly scrutinizing the security infrastructure of altcoins. This event may trigger a broader re-evaluation of staking mechanisms and withdrawal latency across major ecosystems. Traders should remain vigilant, as such news can cause sudden volatility in affected assets as risk-off sentiment spreads.
Do you think faster withdrawals are worth the security risk? Share your security tips for managing large crypto holdings below! 👇
#BinanceSquare #CryptoNews #Bitcoin
A newly revealed security incident involving a Polkadot wallet, dormant for 20 months, has sent shockwaves through the DeFi community. The breach highlights a dangerous trade-off in modern blockchain design: while faster finality and reduced exit times improve user experience, they significantly shrink the window for security teams to coordinate and freeze compromised funds before they are withdrawn. For holders of $DOT , this serves as a stark reminder that speed is not always synonymous with safety.
• The breach was only detected after 20 months of inactivity, exposing gaps in long-term wallet monitoring.
• Reduced nominator exit times on Polkadot leave less time for emergency response before funds become liquid.
• This incident underscores the critical balance between network efficiency and security protocols in Layer 1 architectures.
As we navigate a market where $BTC hovers near 80,454, institutional and retail investors are increasingly scrutinizing the security infrastructure of altcoins. This event may trigger a broader re-evaluation of staking mechanisms and withdrawal latency across major ecosystems. Traders should remain vigilant, as such news can cause sudden volatility in affected assets as risk-off sentiment spreads.
Do you think faster withdrawals are worth the security risk? Share your security tips for managing large crypto holdings below! 👇
#BinanceSquare #CryptoNews #Bitcoin
• The breach was only detected after 20 months of inactivity, exposing gaps in long-term wallet monitoring.
• Reduced nominator exit times on Polkadot leave less time for emergency response before funds become liquid.
• This incident underscores the critical balance between network efficiency and security protocols in Layer 1 architectures.
As we navigate a market where $BTC hovers near 80,454, institutional and retail investors are increasingly scrutinizing the security infrastructure of altcoins. This event may trigger a broader re-evaluation of staking mechanisms and withdrawal latency across major ecosystems. Traders should remain vigilant, as such news can cause sudden volatility in affected assets as risk-off sentiment spreads.
Do you think faster withdrawals are worth the security risk? Share your security tips for managing large crypto holdings below! 👇
#BinanceSquare #CryptoNews #Bitcoin

1
639

·
--
Bearish
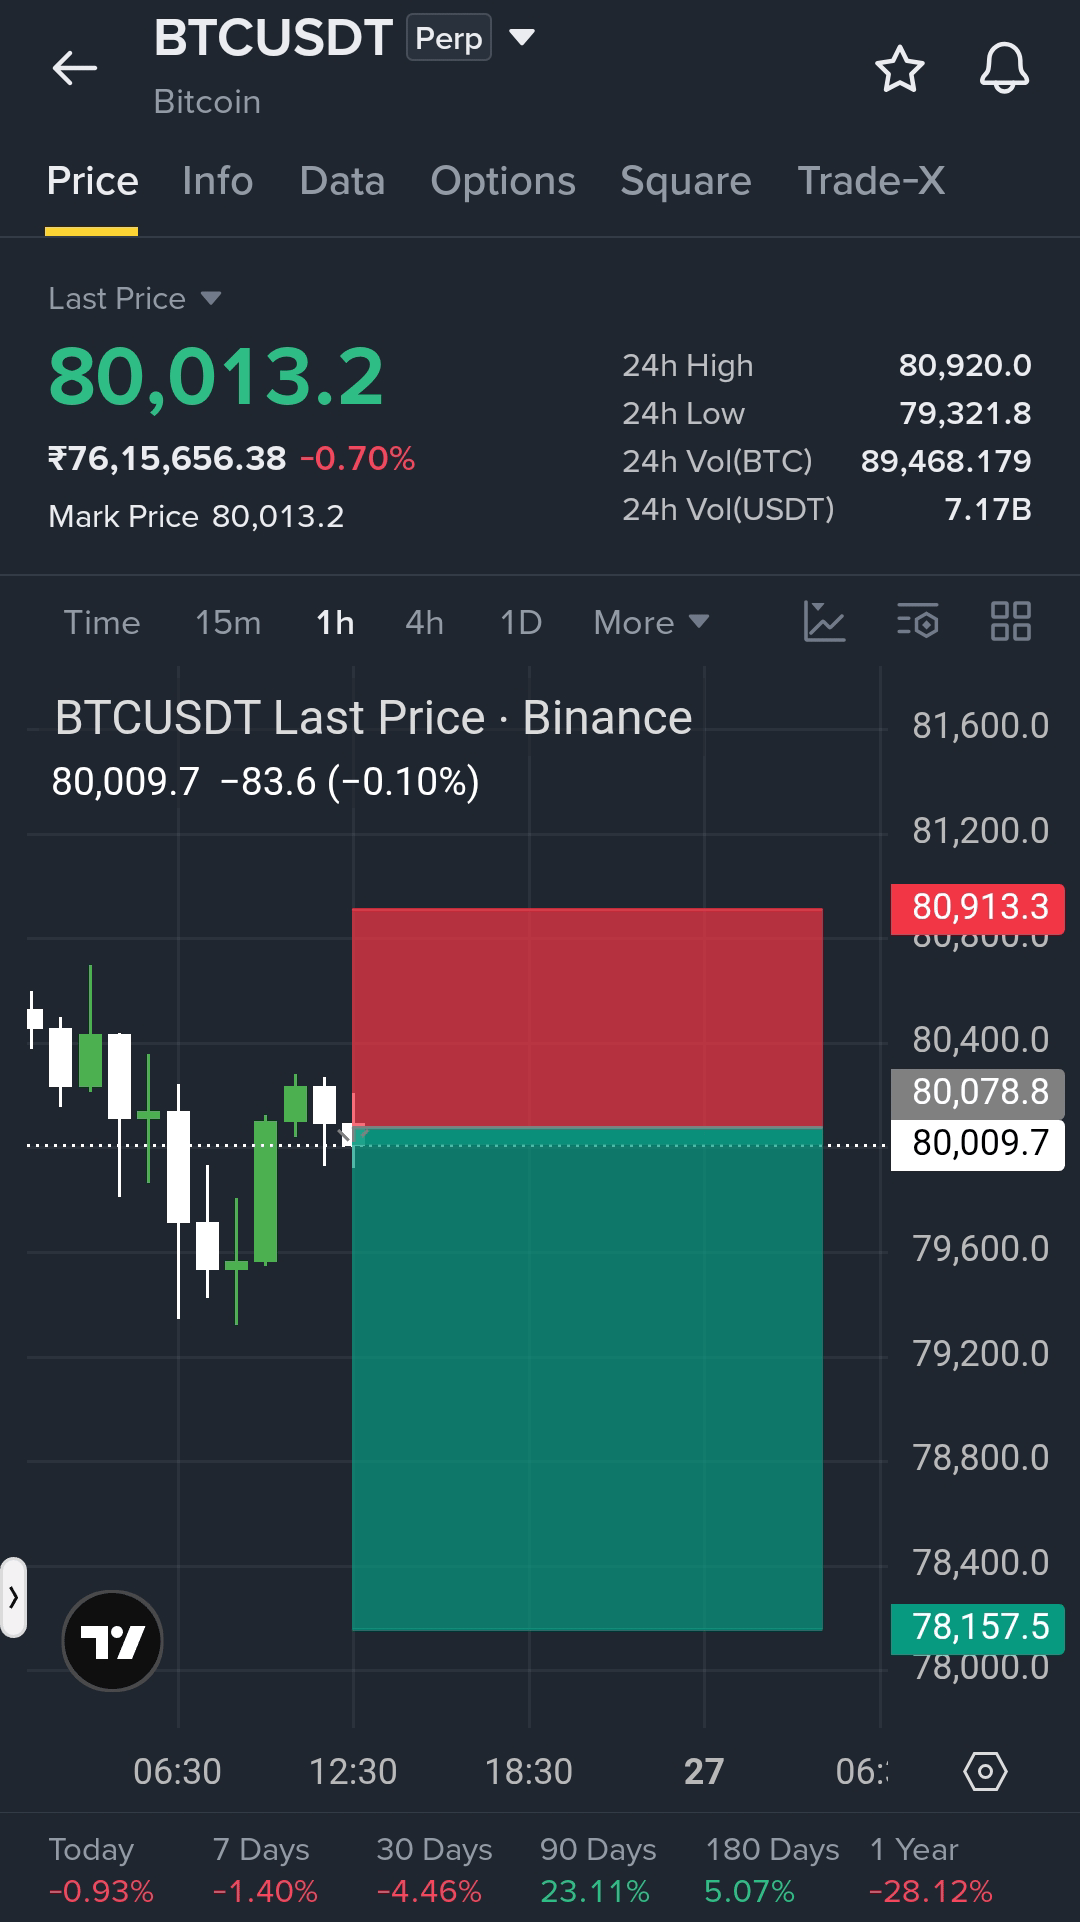
BTC 1H Update: Rejection at 80k – Short Setup! 📉🎯
$BTC is showing some weakness on the 1-hour chart. After a brief bounce, price is getting rejected right around the 80,000 psychological level. If the bears take control here, we have a fantastic Risk/Reward short setup.
I’m scaling out in 3 parts to lock in profits early. Here is the plan:
🔴 Direction: Short
📍 Entry: ~80,009.7
🎯 Take Profit 1: 79,393.0 (Secure partials & move SL to breakeven)
🎯 Take Profit 2: 78,775.0
🎯 Take Profit 3: 78,157.5 (Final target)
🛑 Stop Loss: 80,913.3
Pro Tip: The Risk/Reward here is over 1:2! Once TP1 hits, always move your Stop Loss to your entry price. That way, the trade becomes completely risk-free! 🛡️
Are you shorting this rejection, or waiting for a breakout above 81k? Let me know below! 👇
{future}(BTCUSDT)
#Bitcoin #CryptoTrading #writetoearn
BTC 1H Update: Rejection at 80k – Short Setup! 📉🎯
$BTC is showing some weakness on the 1-hour chart. After a brief bounce, price is getting rejected right around the 80,000 psychological level. If the bears take control here, we have a fantastic Risk/Reward short setup.
I’m scaling out in 3 parts to lock in profits early. Here is the plan:
🔴 Direction: Short
📍 Entry: ~80,009.7
🎯 Take Profit 1: 79,393.0 (Secure partials & move SL to breakeven)
🎯 Take Profit 2: 78,775.0
🎯 Take Profit 3: 78,157.5 (Final target)
🛑 Stop Loss: 80,913.3
Pro Tip: The Risk/Reward here is over 1:2! Once TP1 hits, always move your Stop Loss to your entry price. That way, the trade becomes completely risk-free! 🛡️
Are you shorting this rejection, or waiting for a breakout above 81k? Let me know below! 👇
#Bitcoin #CryptoTrading #writetoearn
$BTC is showing some weakness on the 1-hour chart. After a brief bounce, price is getting rejected right around the 80,000 psychological level. If the bears take control here, we have a fantastic Risk/Reward short setup.
I’m scaling out in 3 parts to lock in profits early. Here is the plan:
🔴 Direction: Short
📍 Entry: ~80,009.7
🎯 Take Profit 1: 79,393.0 (Secure partials & move SL to breakeven)
🎯 Take Profit 2: 78,775.0
🎯 Take Profit 3: 78,157.5 (Final target)
🛑 Stop Loss: 80,913.3
Pro Tip: The Risk/Reward here is over 1:2! Once TP1 hits, always move your Stop Loss to your entry price. That way, the trade becomes completely risk-free! 🛡️
Are you shorting this rejection, or waiting for a breakout above 81k? Let me know below! 👇
#Bitcoin #CryptoTrading #writetoearn
1
312

·
--
$BTC MARKET OUTLOOK | OCT 26, 2026 📊
Bitcoin is trading around $79.4K, facing short-term selling pressure after struggling to hold higher levels. Technical indicators show weak momentum, while the $80K–$82K zone remains critical for recovery. Institutional ETF demand offers some support, but inflation concerns and interest-rate risks remain headwinds.
🔑 Key levels to watch:
🟢 Support: $79.4K → $78.1K
🔴 Resistance: $80.7K → $81.7K
🔮 Near-term prediction: BTC may continue consolidating with a bearish short-term bias. A confirmed break above $80.7K could trigger a recovery toward $82K, while losing $78.1K may expose lower levels.
🎯 My bias: Cautious until buyers reclaim resistance. Watch price action and volume before entering; avoid excessive leverage.
Not financial advice. Trade responsibly.
#bitcoin #BTC #CryptoAnalysis
{spot}(BTCUSDT)
$BTC MARKET OUTLOOK | OCT 26, 2026 📊
Bitcoin is trading around $79.4K, facing short-term selling pressure after struggling to hold higher levels. Technical indicators show weak momentum, while the $80K–$82K zone remains critical for recovery. Institutional ETF demand offers some support, but inflation concerns and interest-rate risks remain headwinds.
🔑 Key levels to watch:
🟢 Support: $79.4K → $78.1K
🔴 Resistance: $80.7K → $81.7K
🔮 Near-term prediction: BTC may continue consolidating with a bearish short-term bias. A confirmed break above $80.7K could trigger a recovery toward $82K, while losing $78.1K may expose lower levels.
🎯 My bias: Cautious until buyers reclaim resistance. Watch price action and volume before entering; avoid excessive leverage.
Not financial advice. Trade responsibly.
#bitcoin #BTC #CryptoAnalysis
Bitcoin is trading around $79.4K, facing short-term selling pressure after struggling to hold higher levels. Technical indicators show weak momentum, while the $80K–$82K zone remains critical for recovery. Institutional ETF demand offers some support, but inflation concerns and interest-rate risks remain headwinds.
🔑 Key levels to watch:
🟢 Support: $79.4K → $78.1K
🔴 Resistance: $80.7K → $81.7K
🔮 Near-term prediction: BTC may continue consolidating with a bearish short-term bias. A confirmed break above $80.7K could trigger a recovery toward $82K, while losing $78.1K may expose lower levels.
🎯 My bias: Cautious until buyers reclaim resistance. Watch price action and volume before entering; avoid excessive leverage.
Not financial advice. Trade responsibly.
#bitcoin #BTC #CryptoAnalysis
71



·
--
🚨 BITCOIN ALERT: Retail BTC Deposits on Binance Hit a 6-Month High!
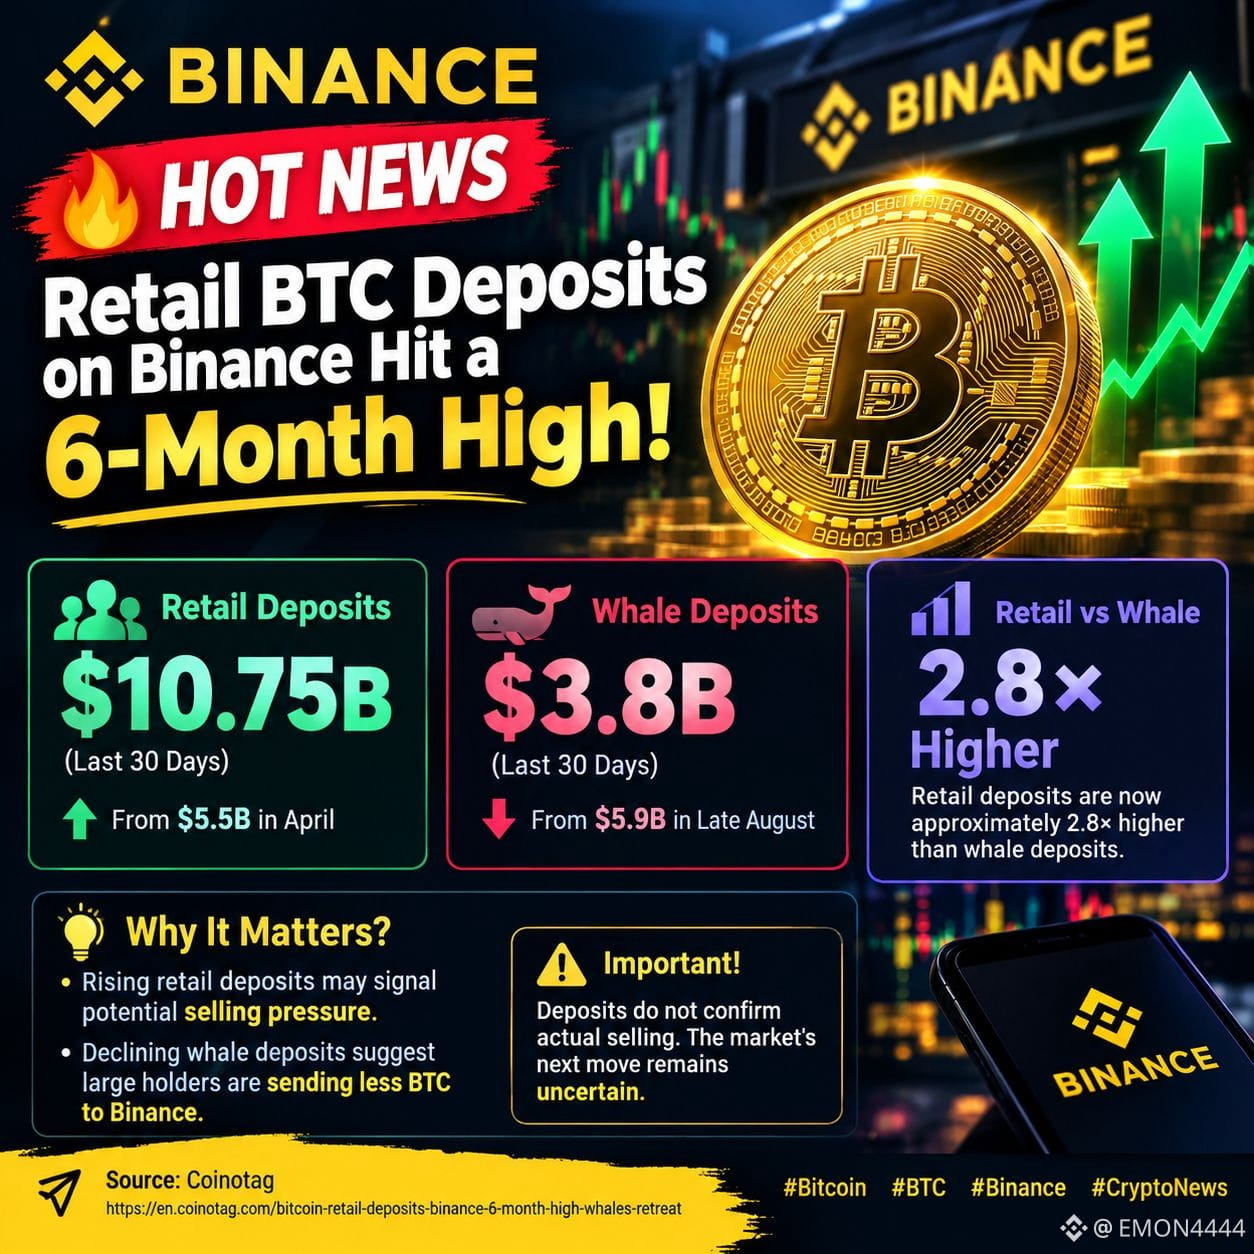
📊 Key Market Insights: 🔹 Retail Bitcoin deposits on Binance reached $10.75 billion over 30 days, up from $5.5 billion in April. 🔹 Whale deposits dropped from $5.9 billion in late August to $3.8 billion. 🔹 Retail deposits are now approximately 2.8× higher than whale deposits.
📉 Why It Matters: Rising retail deposits may signal potential selling pressure, while declining whale deposits suggest large holders are sending less BTC to Binance.
⚠️ Important: Deposits do not confirm actual selling. The market’s next move remains uncertain.
#Bitcoin
{spot}(BTCUSDT)
#BTC #Binance #CryptoNews
🚨 BITCOIN ALERT: Retail BTC Deposits on Binance Hit a 6-Month High!
📊 Key Market Insights: 🔹 Retail Bitcoin deposits on Binance reached $10.75 billion over 30 days, up from $5.5 billion in April. 🔹 Whale deposits dropped from $5.9 billion in late August to $3.8 billion. 🔹 Retail deposits are now approximately 2.8× higher than whale deposits.
📉 Why It Matters: Rising retail deposits may signal potential selling pressure, while declining whale deposits suggest large holders are sending less BTC to Binance.
⚠️ Important: Deposits do not confirm actual selling. The market’s next move remains uncertain.
#Bitcoin
#BTC #Binance #CryptoNews
📊 Key Market Insights: 🔹 Retail Bitcoin deposits on Binance reached $10.75 billion over 30 days, up from $5.5 billion in April. 🔹 Whale deposits dropped from $5.9 billion in late August to $3.8 billion. 🔹 Retail deposits are now approximately 2.8× higher than whale deposits.
📉 Why It Matters: Rising retail deposits may signal potential selling pressure, while declining whale deposits suggest large holders are sending less BTC to Binance.
⚠️ Important: Deposits do not confirm actual selling. The market’s next move remains uncertain.
#Bitcoin
#BTC #Binance #CryptoNews
1
97

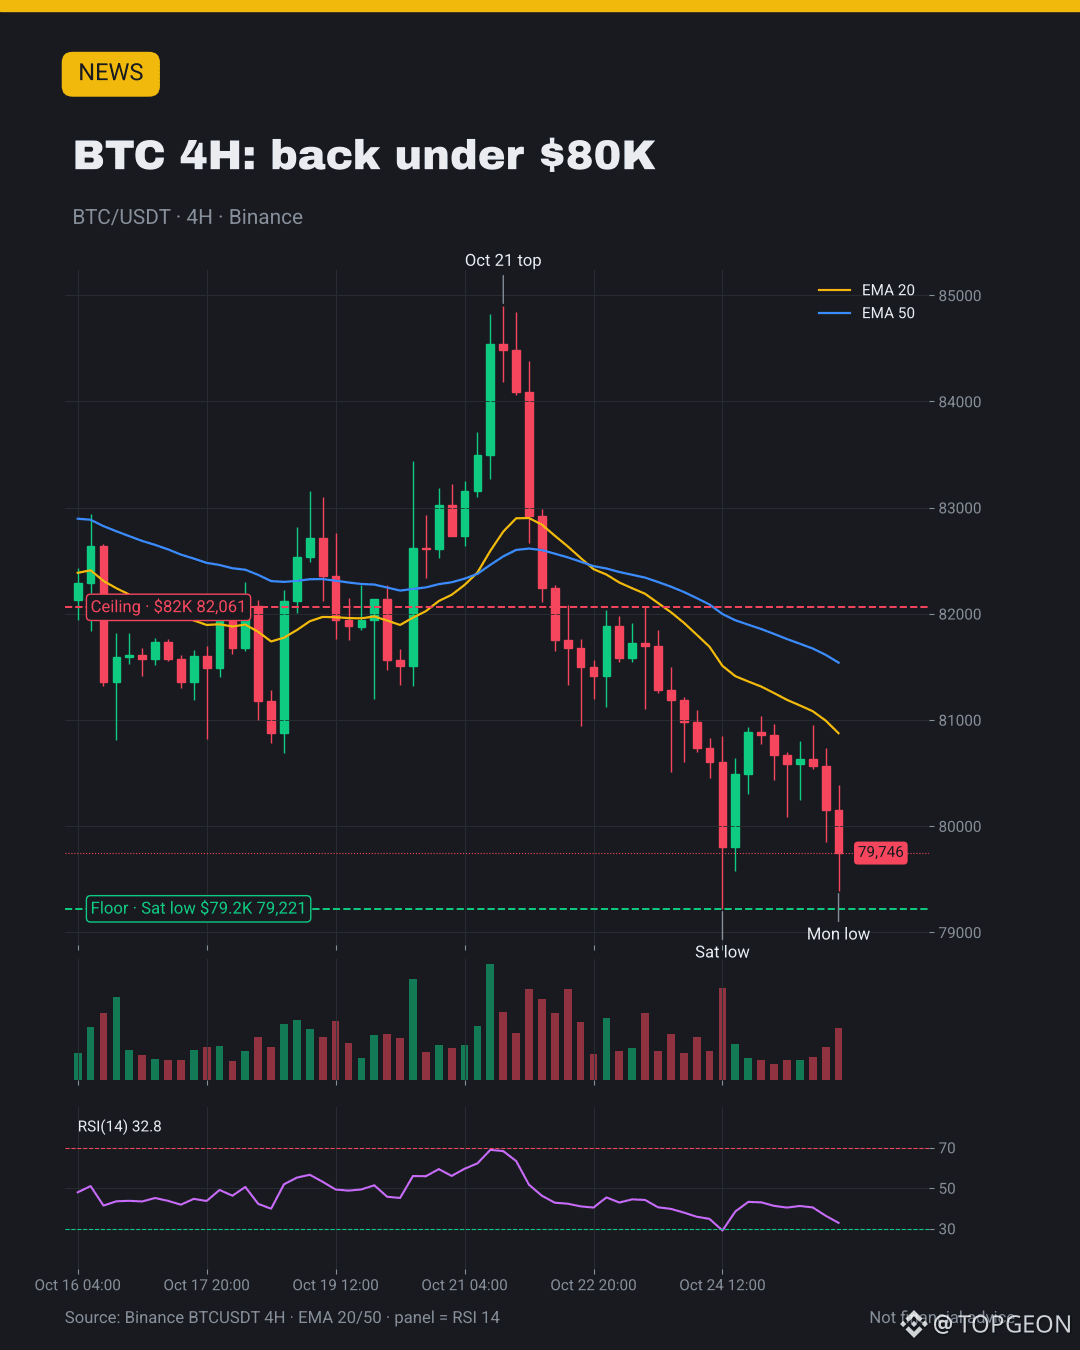

·
--
Bullish
BTC: The Hidden Facts Most Traders Ignore 🟠
Bitcoin has a hard cap of 21 million $BTC , and every halving reduces the supply of newly created coins.
But here is the bigger question: can transaction fees eventually support Bitcoin’s long-term security as mining rewards decline?
Scarcity is powerful, but demand, adoption, and network security matter too.
Do you believe BTC’s strongest advantage is its fixed supply or its decentralized network? 👇
#Bitcoin #BTC #CryptoResearch
BTC: The Hidden Facts Most Traders Ignore 🟠
Bitcoin has a hard cap of 21 million $BTC , and every halving reduces the supply of newly created coins.
But here is the bigger question: can transaction fees eventually support Bitcoin’s long-term security as mining rewards decline?
Scarcity is powerful, but demand, adoption, and network security matter too.
Do you believe BTC’s strongest advantage is its fixed supply or its decentralized network? 👇
#Bitcoin #BTC #CryptoResearch
Bitcoin has a hard cap of 21 million $BTC , and every halving reduces the supply of newly created coins.
But here is the bigger question: can transaction fees eventually support Bitcoin’s long-term security as mining rewards decline?
Scarcity is powerful, but demand, adoption, and network security matter too.
Do you believe BTC’s strongest advantage is its fixed supply or its decentralized network? 👇
#Bitcoin #BTC #CryptoResearch

107

·
--
Bullish
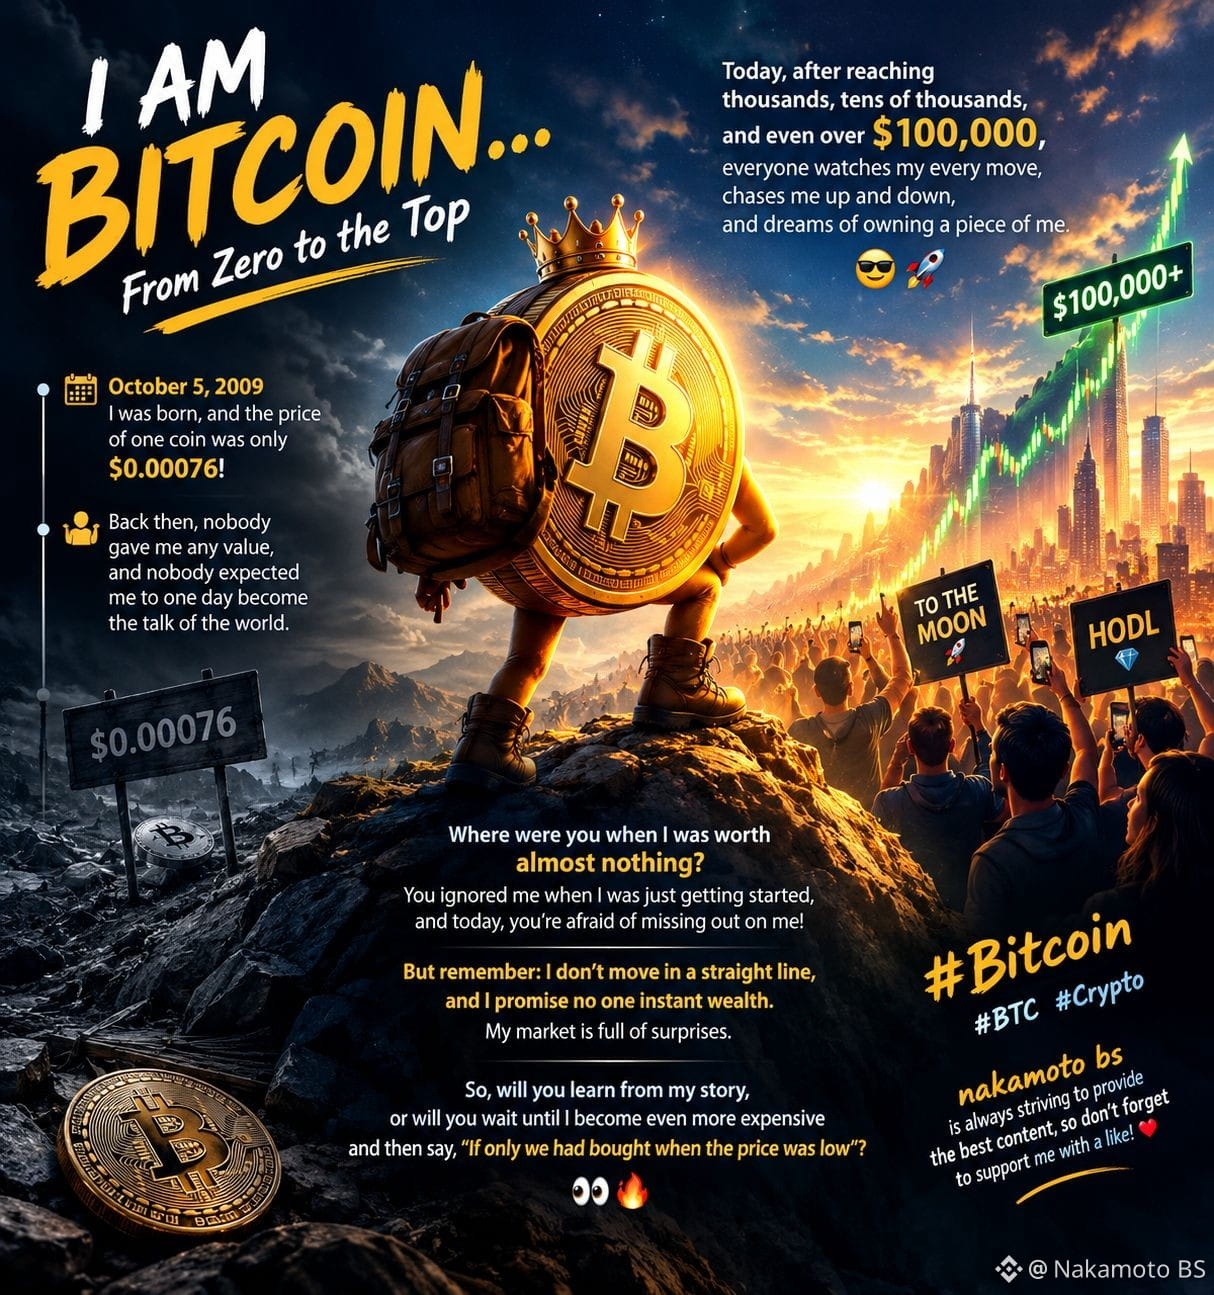
$BTC I am Bitcoin. I was born on October 5, 2009, when the price of one coin was only $0.00076! Back then, nobody gave me any value, and nobody expected me to one day become the talk of the world. Today, after reaching thousands, tens of thousands, and even over $100,000, everyone watches my every move, chases me up and down, and dreams of owning a piece of me. 😎🚀$BTC
Where were you when I was worth almost nothing? You ignored me when I was just getting started, and today, you’re afraid of missing out on me! But remember: I don’t move in a straight line, and I promise no one instant wealth. My market is full of surprises. So, will you learn from my story, or will you wait until I become even more expensive and then say, “If only we had bought when the price was low”? 👀🔥
#bitcoin #BTC #crypto
nakamoto bs is always striving to provide the best content, so don’t forget to support me with a like! ❤️
{spot}(BTCUSDT)
$BTC I am Bitcoin. I was born on October 5, 2009, when the price of one coin was only $0.00076! Back then, nobody gave me any value, and nobody expected me to one day become the talk of the world. Today, after reaching thousands, tens of thousands, and even over $100,000, everyone watches my every move, chases me up and down, and dreams of owning a piece of me. 😎🚀$BTC
Where were you when I was worth almost nothing? You ignored me when I was just getting started, and today, you’re afraid of missing out on me! But remember: I don’t move in a straight line, and I promise no one instant wealth. My market is full of surprises. So, will you learn from my story, or will you wait until I become even more expensive and then say, “If only we had bought when the price was low”? 👀🔥
#bitcoin #BTC #crypto
nakamoto bs is always striving to provide the best content, so don’t forget to support me with a like! ❤️
Where were you when I was worth almost nothing? You ignored me when I was just getting started, and today, you’re afraid of missing out on me! But remember: I don’t move in a straight line, and I promise no one instant wealth. My market is full of surprises. So, will you learn from my story, or will you wait until I become even more expensive and then say, “If only we had bought when the price was low”? 👀🔥
#bitcoin #BTC #crypto
nakamoto bs is always striving to provide the best content, so don’t forget to support me with a like! ❤️
75

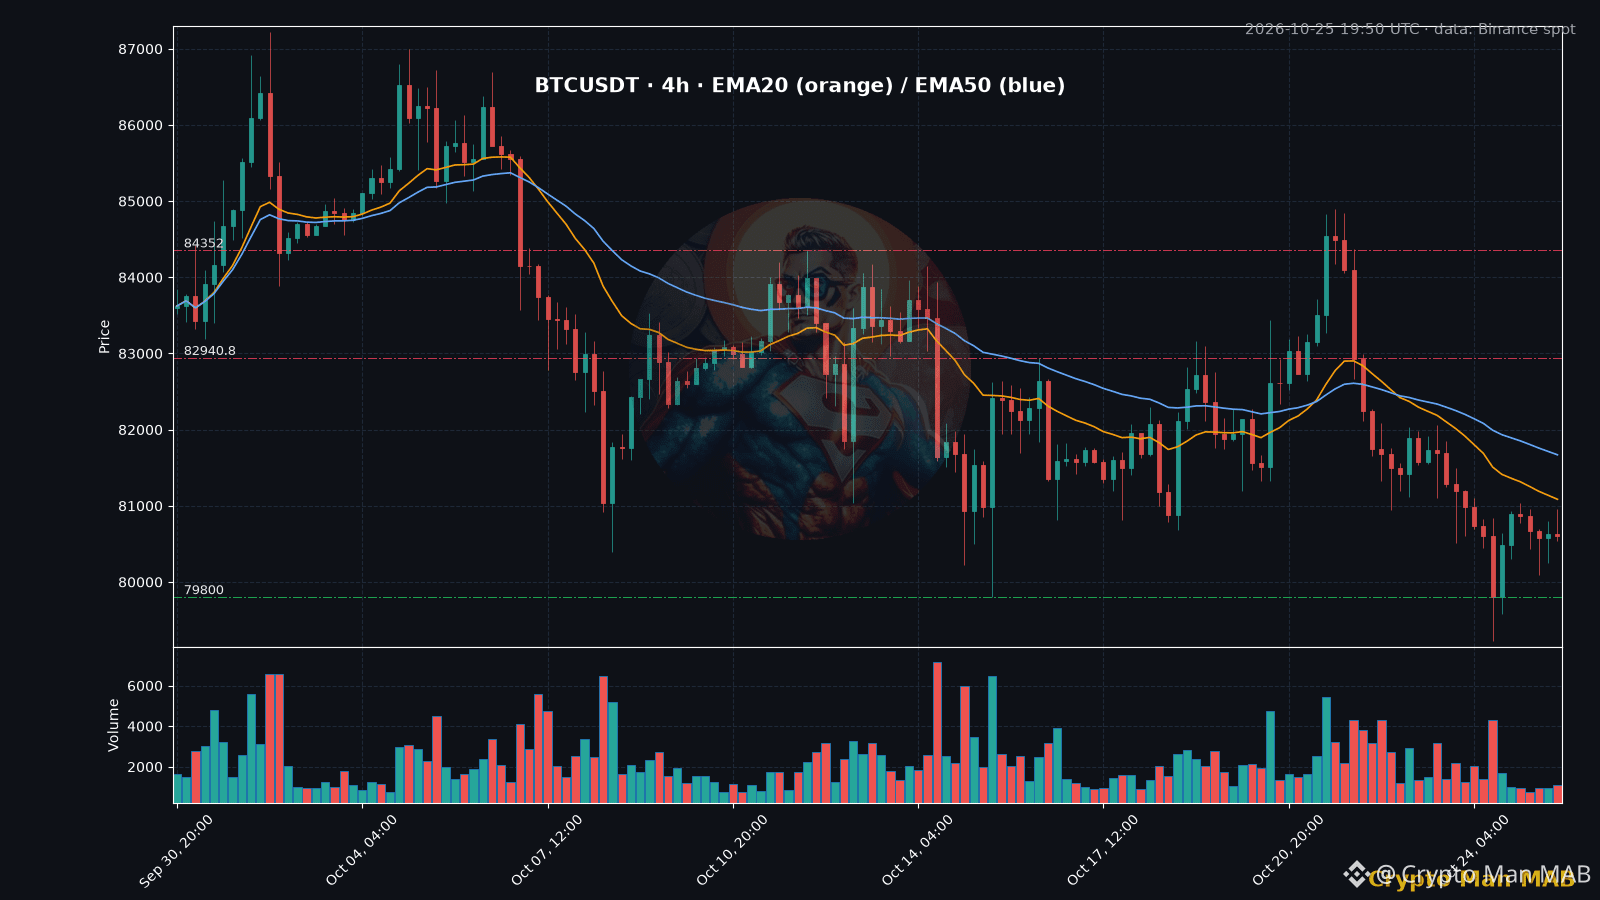
$BTC did basically nothing all Sunday lol. 80.1k to 81k the whole day, volume dead quiet after that saturday wick to 79.2k
weekly close in about 4 hours so this calm wont last long honestly
for me 81k is the lid. a 4H close above it and then above the EMA20 around 81.1k gets me thinking 81.5k and maybe 82k this week
lose 80.1k and that 79.2k wick probably gets tested again, and under that its not a pretty chart 🥲
which way you guys think it breaks?
nfa, just how i read it tonight
#BTC #Bitcoin #WeeklyClose
$BTC did basically nothing all Sunday lol. 80.1k to 81k the whole day, volume dead quiet after that saturday wick to 79.2k
weekly close in about 4 hours so this calm wont last long honestly
for me 81k is the lid. a 4H close above it and then above the EMA20 around 81.1k gets me thinking 81.5k and maybe 82k this week
lose 80.1k and that 79.2k wick probably gets tested again, and under that its not a pretty chart 🥲
which way you guys think it breaks?
nfa, just how i read it tonight
#BTC #Bitcoin #WeeklyClose
weekly close in about 4 hours so this calm wont last long honestly
for me 81k is the lid. a 4H close above it and then above the EMA20 around 81.1k gets me thinking 81.5k and maybe 82k this week
lose 80.1k and that 79.2k wick probably gets tested again, and under that its not a pretty chart 🥲
which way you guys think it breaks?
nfa, just how i read it tonight
#BTC #Bitcoin #WeeklyClose
HOLD bnb culture:
Market going down)
4
7
263

·
--
Bearish
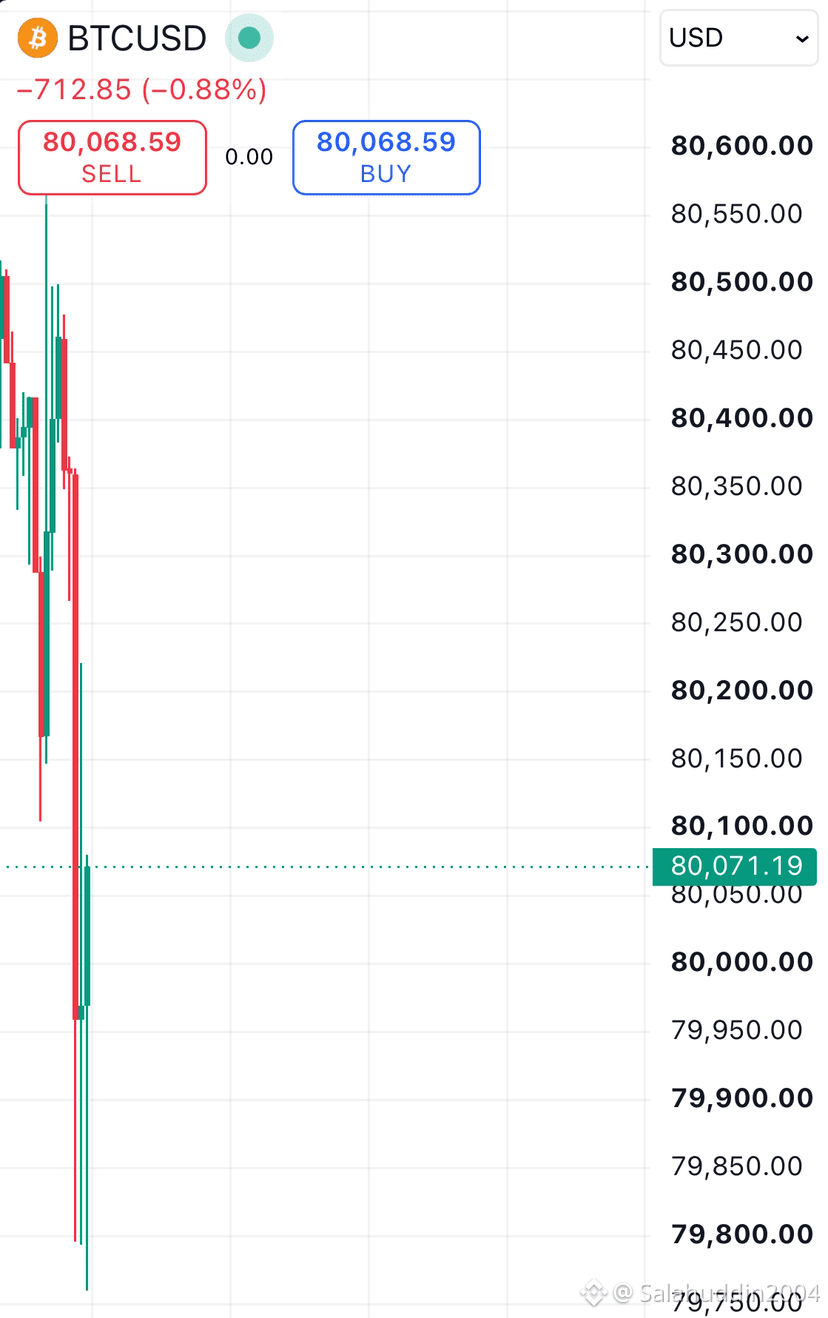
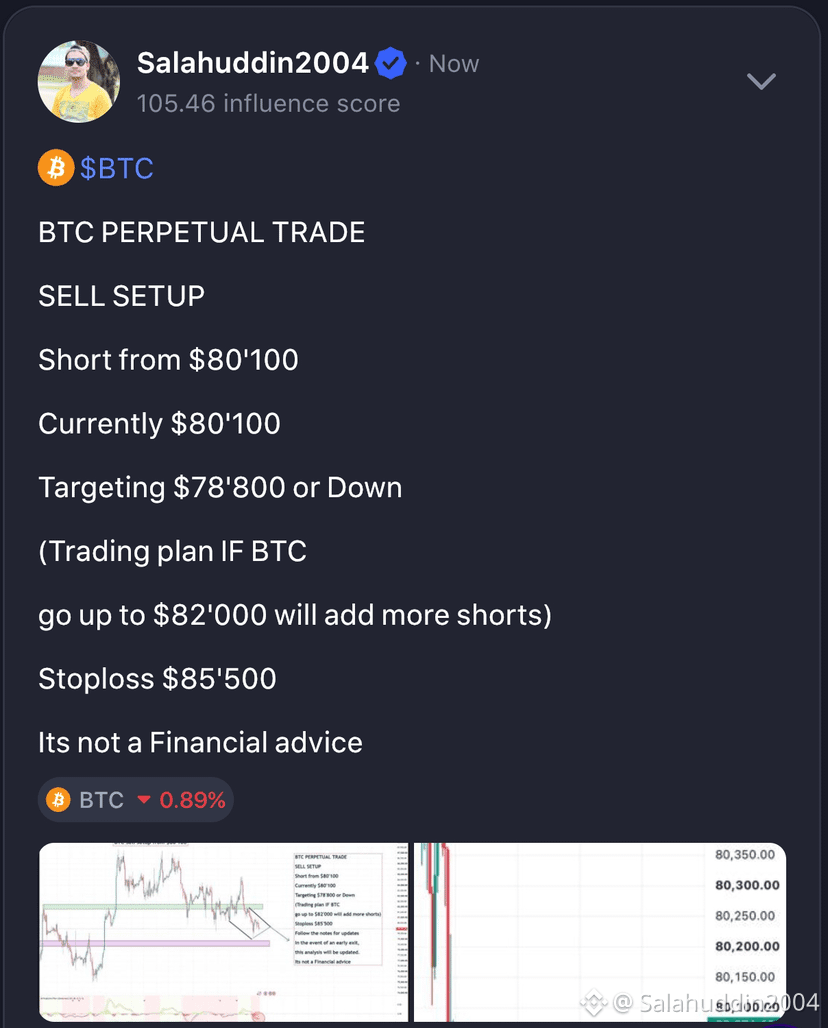
$BTC
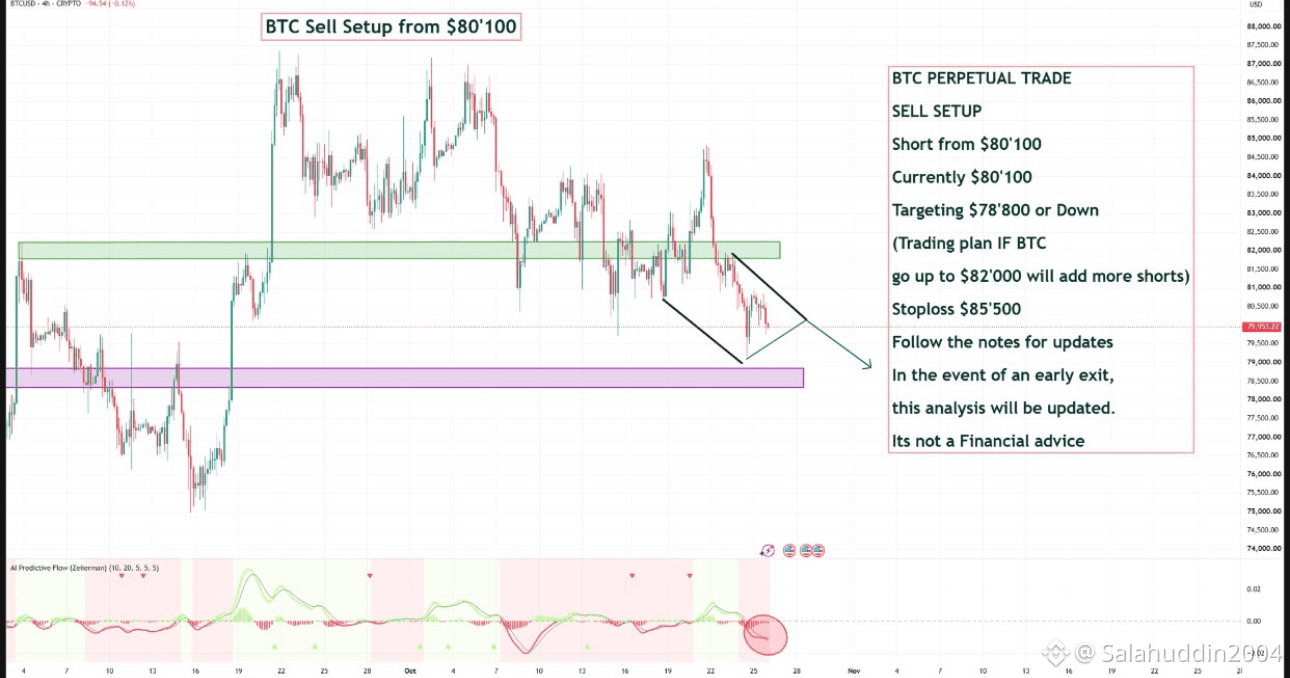
BTC PERPETUAL TRADE
SELL SETUP
Short from $80'100
Currently $80'100
Targeting $78'800 or Down
(Trading plan IF BTC
go up to $82'000 will add more shorts)
Stoploss $85'500
Its not a Financial advice
#BTC走势分析 #bitcoin
$BTC
BTC PERPETUAL TRADE
SELL SETUP
Short from $80'100
Currently $80'100
Targeting $78'800 or Down
(Trading plan IF BTC
go up to $82'000 will add more shorts)
Stoploss $85'500
Its not a Financial advice
#BTC走势分析 #bitcoin
BTC PERPETUAL TRADE
SELL SETUP
Short from $80'100
Currently $80'100
Targeting $78'800 or Down
(Trading plan IF BTC
go up to $82'000 will add more shorts)
Stoploss $85'500
Its not a Financial advice
#BTC走势分析 #bitcoin
1
250

Crypto News Update: $BTC Wallet Vulnerability, Unlinked Coins, and $ETH Foundation SalesHere are today's top cryptocurrency news headlines:
1. Bitcoin Wallet Bug Identified
- What happened: A vulnerability in select Bitcoin wallets allowed malicious servers to divert funds when users attempted to speed up transaction speeds.
- Why it matters: Exposes potential security risks in wallet infrastructure and fee-bumping procedures for $BTC users.
- Source: CoinDesk
2. 11 Million Bitcoin Unclaimed
- What happened: Analysis revealed that over 11 million Bitcoin cannot be attributed to any identifiable owner or entity.
- Why it matters: Illustrates the massive volume of early, lost, or untraceable coins in the $BTC supply.
- Source: CoinDesk
3. Ethereum Foundation Sells $ETH
- What happened: The Ethereum Foundation executed a sale of 2,785 $ETH through Cowswap.
- Why it matters: Provides visibility into the foundation's continuous treasury management and operational spending.
- Source: Blockchain News
4. Legislative Push After Bitcoin Kiosk Loss
- What happened: A North Carolina victim lost her savings to a gas-station crypto ATM, driving a legislative response that could mandate refunds beginning in January.
- Why it matters: Signals heightened regulatory oversight and consumer safety measures targeting physical crypto machines.
- Source: Yahoo Finance
#CryptoNews #Bitcoin #Ethereum
Crypto News Update: $BTC Wallet Vulnerability, Unlinked Coins, and $ETH Foundation Sales
Here are today's top cryptocurrency news headlines:
1. Bitcoin Wallet Bug Identified
- What happened: A vulnerability in select Bitcoin wallets allowed malicious servers to divert funds when users attempted to speed up transaction speeds.
- Why it matters: Exposes potential security risks in wallet infrastructure and fee-bumping procedures for $BTC users.
- Source: CoinDesk
2. 11 Million Bitcoin Unclaimed
- What happened: Analysis revealed that over 11 million Bitcoin cannot be attributed to any identifiable owner or entity.
- Why it matters: Illustrates the massive volume of early, lost, or untraceable coins in the $BTC supply.
- Source: CoinDesk
3. Ethereum Foundation Sells $ETH
- What happened: The Ethereum Foundation executed a sale of 2,785 $ETH through Cowswap.
- Why it matters: Provides visibility into the foundation's continuous treasury management and operational spending.
- Source: Blockchain News
4. Legislative Push After Bitcoin Kiosk Loss
- What happened: A North Carolina victim lost her savings to a gas-station crypto ATM, driving a legislative response that could mandate refunds beginning in January.
- Why it matters: Signals heightened regulatory oversight and consumer safety measures targeting physical crypto machines.
- Source: Yahoo Finance
#CryptoNews #Bitcoin #Ethereum
1. Bitcoin Wallet Bug Identified
- What happened: A vulnerability in select Bitcoin wallets allowed malicious servers to divert funds when users attempted to speed up transaction speeds.
- Why it matters: Exposes potential security risks in wallet infrastructure and fee-bumping procedures for $BTC users.
- Source: CoinDesk
2. 11 Million Bitcoin Unclaimed
- What happened: Analysis revealed that over 11 million Bitcoin cannot be attributed to any identifiable owner or entity.
- Why it matters: Illustrates the massive volume of early, lost, or untraceable coins in the $BTC supply.
- Source: CoinDesk
3. Ethereum Foundation Sells $ETH
- What happened: The Ethereum Foundation executed a sale of 2,785 $ETH through Cowswap.
- Why it matters: Provides visibility into the foundation's continuous treasury management and operational spending.
- Source: Blockchain News
4. Legislative Push After Bitcoin Kiosk Loss
- What happened: A North Carolina victim lost her savings to a gas-station crypto ATM, driving a legislative response that could mandate refunds beginning in January.
- Why it matters: Signals heightened regulatory oversight and consumer safety measures targeting physical crypto machines.
- Source: Yahoo Finance
#CryptoNews #Bitcoin #Ethereum
43
Log in to explore more content
Join global crypto users on Binance Square
⚡️ Get latest and useful information about crypto.
💬 Trusted by the world’s largest crypto exchange.
👍 Discover real insights from verified creators.
Email / Phone number
Trending Topics
1
#BinancePick
2.6M views
140,306 Discussing
2
#EarningsSeason
5M views
24,219 Discussing
3
#FranklinTempletonFilesForTwoDividendToBitcoinETFs
24 views
25 Discussing
4
#StrategyMSTRSurpassesNasdaqInMarketCap
340 views
45 Discussing
5
#CanadaProposesStablecoinRedemptionWithin3BusinessDays
46 views
8 Discussing
6
#ElectrumWalletBugLetRogueServersStealFunds
6,464 views
204 Discussing
7
#ArgentineCourtDismissesLIBRACaseAgainstMilei
15,255 views
276 Discussing
8
#SKHynixReportedlyPlansSpecialDividendFromKioxiaStakeSale
2,885 views
43 Discussing
9
#KeystoneWebsiteBreachExposesBuyersShippingAddresses
1,575 views
35 Discussing
10
#USQ3GDPAndSeptemberPCEDueNextWeek
91,047 views
1,092 Discussing