
BlockHub
46 Posts

BlockHub
Report
Block User
Crypto insights • Smart trades • Real growth
Building wealth one block at a time 📈
#BinanceSquare #Crypto
Open Trade
Occasional Trader
5.1 Years
3 Following
19 Followers
20 Liked
Posts
Portfolio
All
Quotes
·
--
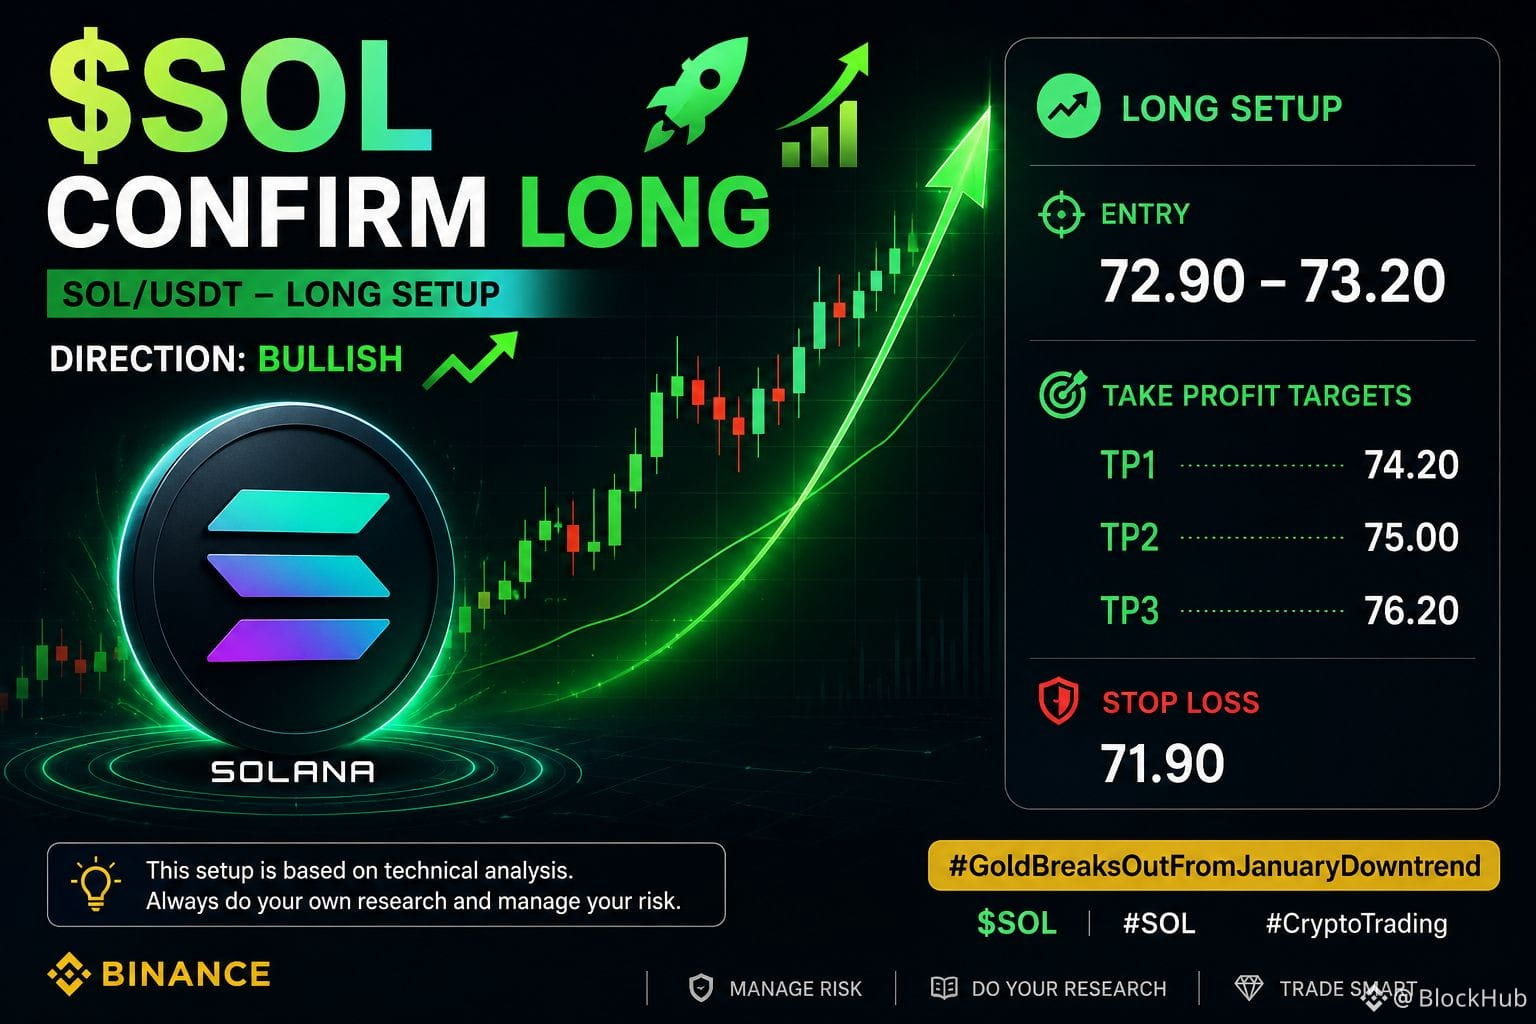
🚀 $SOL | Confirmed Long Setup 📈
SOL/USDT – Bullish Outlook
Price is holding above a key support area, and bullish momentum remains intact. As long as the entry zone is respected, the move toward higher resistance levels remains in focus.
📍 Entry: 72.90 – 73.20
🛑 Stop Loss: 71.90
🎯 Take Profit Targets
• TP1: 74.20
• TP2: 75.00
• TP3: 76.20
Always manage your risk and wait for confirmation before entering a trade. Markets are volatile, so adjust your position size accordingly.
$SOL #GoldBreaksOutFromJanuaryDowntrend #SOL #CryptoTrading #BinanceSquare #TradingSetup
🚀 $SOL | Confirmed Long Setup 📈
SOL/USDT – Bullish Outlook
Price is holding above a key support area, and bullish momentum remains intact. As long as the entry zone is respected, the move toward higher resistance levels remains in focus.
📍 Entry: 72.90 – 73.20
🛑 Stop Loss: 71.90
🎯 Take Profit Targets
• TP1: 74.20
• TP2: 75.00
• TP3: 76.20
Always manage your risk and wait for confirmation before entering a trade. Markets are volatile, so adjust your position size accordingly.
$SOL #GoldBreaksOutFromJanuaryDowntrend #SOL #CryptoTrading #BinanceSquare #TradingSetup
SOL/USDT – Bullish Outlook
Price is holding above a key support area, and bullish momentum remains intact. As long as the entry zone is respected, the move toward higher resistance levels remains in focus.
📍 Entry: 72.90 – 73.20
🛑 Stop Loss: 71.90
🎯 Take Profit Targets
• TP1: 74.20
• TP2: 75.00
• TP3: 76.20
Always manage your risk and wait for confirmation before entering a trade. Markets are volatile, so adjust your position size accordingly.
$SOL #GoldBreaksOutFromJanuaryDowntrend #SOL #CryptoTrading #BinanceSquare #TradingSetup
73
·
--
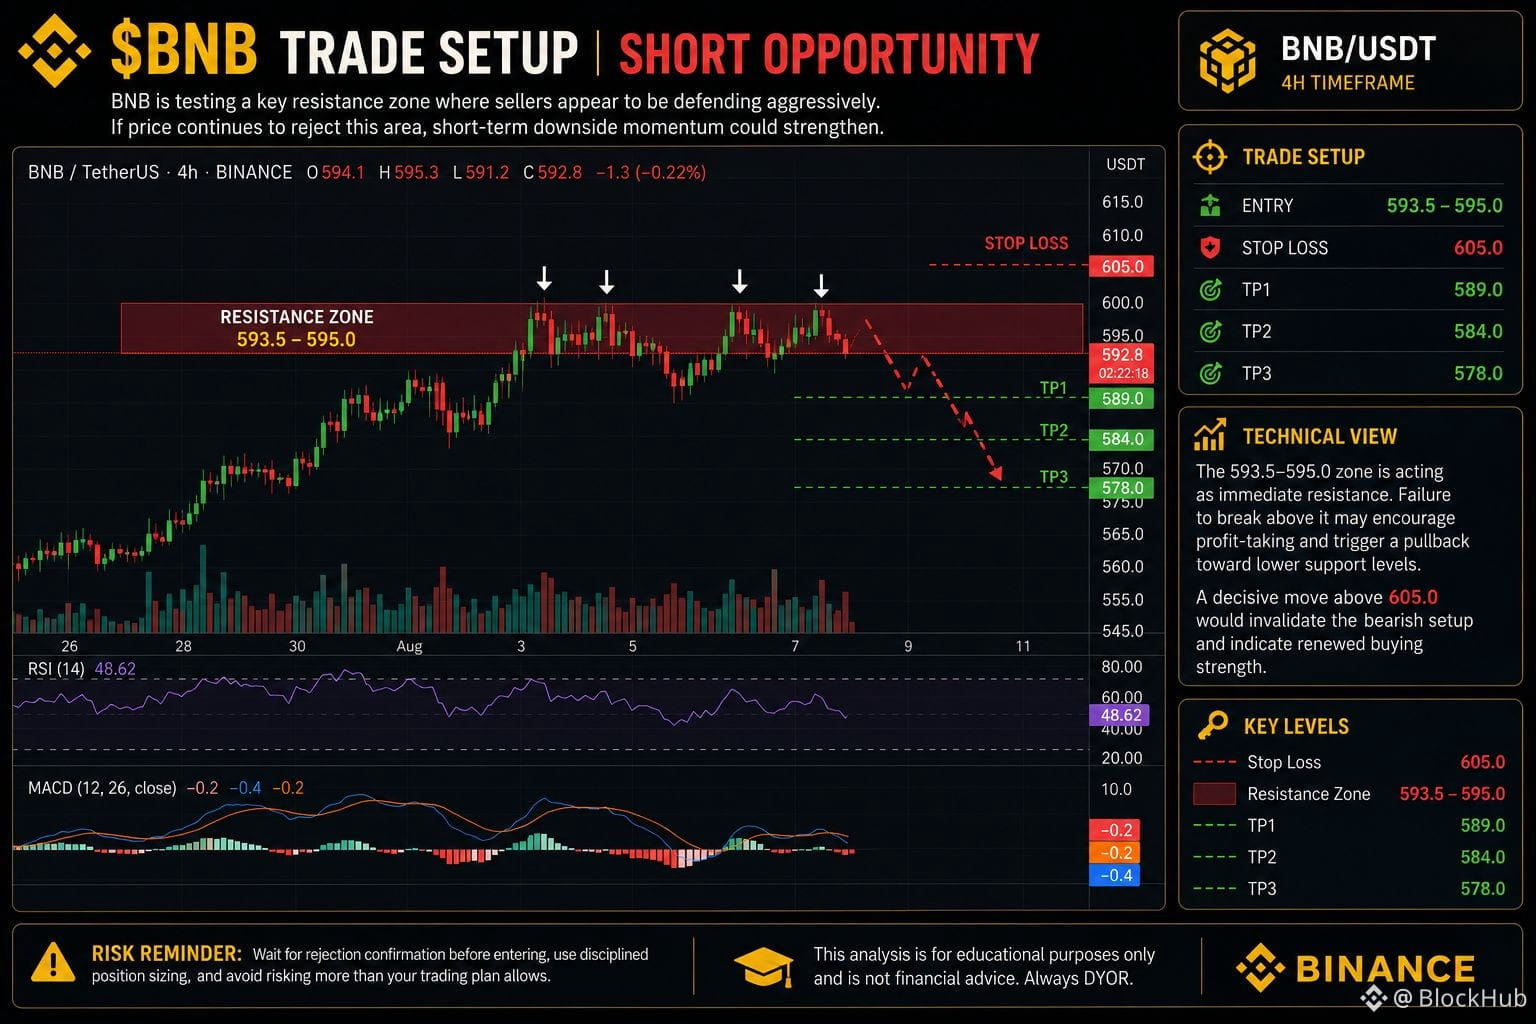
📉 $BNB Trade Setup | Short Opportunity
BNB is testing a key resistance zone where sellers appear to be defending aggressively. If price continues to reject this area, short-term downside momentum could strengthen.
🎯 Trade Setup
• Entry: 593.5–595.0
• Stop Loss: 605.0
• TP1: 589.0
• TP2: 584.0
• TP3: 578.0
🔍 Technical View
The 593.5–595.0 zone is acting as immediate resistance. Failure to break above it may encourage profit-taking and trigger a pullback toward lower support levels. A decisive move above 605.0 would invalidate the bearish setup and indicate renewed buying strength.
⚠️ Risk Reminder
Wait for rejection confirmation before entering, use disciplined position sizing, and avoid risking more than your trading plan allows.
This analysis is for educational purposes only and is not financial advice. Always DYOR.
📉 $BNB Trade Setup | Short Opportunity
BNB is testing a key resistance zone where sellers appear to be defending aggressively. If price continues to reject this area, short-term downside momentum could strengthen.
🎯 Trade Setup
• Entry: 593.5–595.0
• Stop Loss: 605.0
• TP1: 589.0
• TP2: 584.0
• TP3: 578.0
🔍 Technical View
The 593.5–595.0 zone is acting as immediate resistance. Failure to break above it may encourage profit-taking and trigger a pullback toward lower support levels. A decisive move above 605.0 would invalidate the bearish setup and indicate renewed buying strength.
⚠️ Risk Reminder
Wait for rejection confirmation before entering, use disciplined position sizing, and avoid risking more than your trading plan allows.
This analysis is for educational purposes only and is not financial advice. Always DYOR.
BNB is testing a key resistance zone where sellers appear to be defending aggressively. If price continues to reject this area, short-term downside momentum could strengthen.
🎯 Trade Setup
• Entry: 593.5–595.0
• Stop Loss: 605.0
• TP1: 589.0
• TP2: 584.0
• TP3: 578.0
🔍 Technical View
The 593.5–595.0 zone is acting as immediate resistance. Failure to break above it may encourage profit-taking and trigger a pullback toward lower support levels. A decisive move above 605.0 would invalidate the bearish setup and indicate renewed buying strength.
⚠️ Risk Reminder
Wait for rejection confirmation before entering, use disciplined position sizing, and avoid risking more than your trading plan allows.
This analysis is for educational purposes only and is not financial advice. Always DYOR.
48
·
--
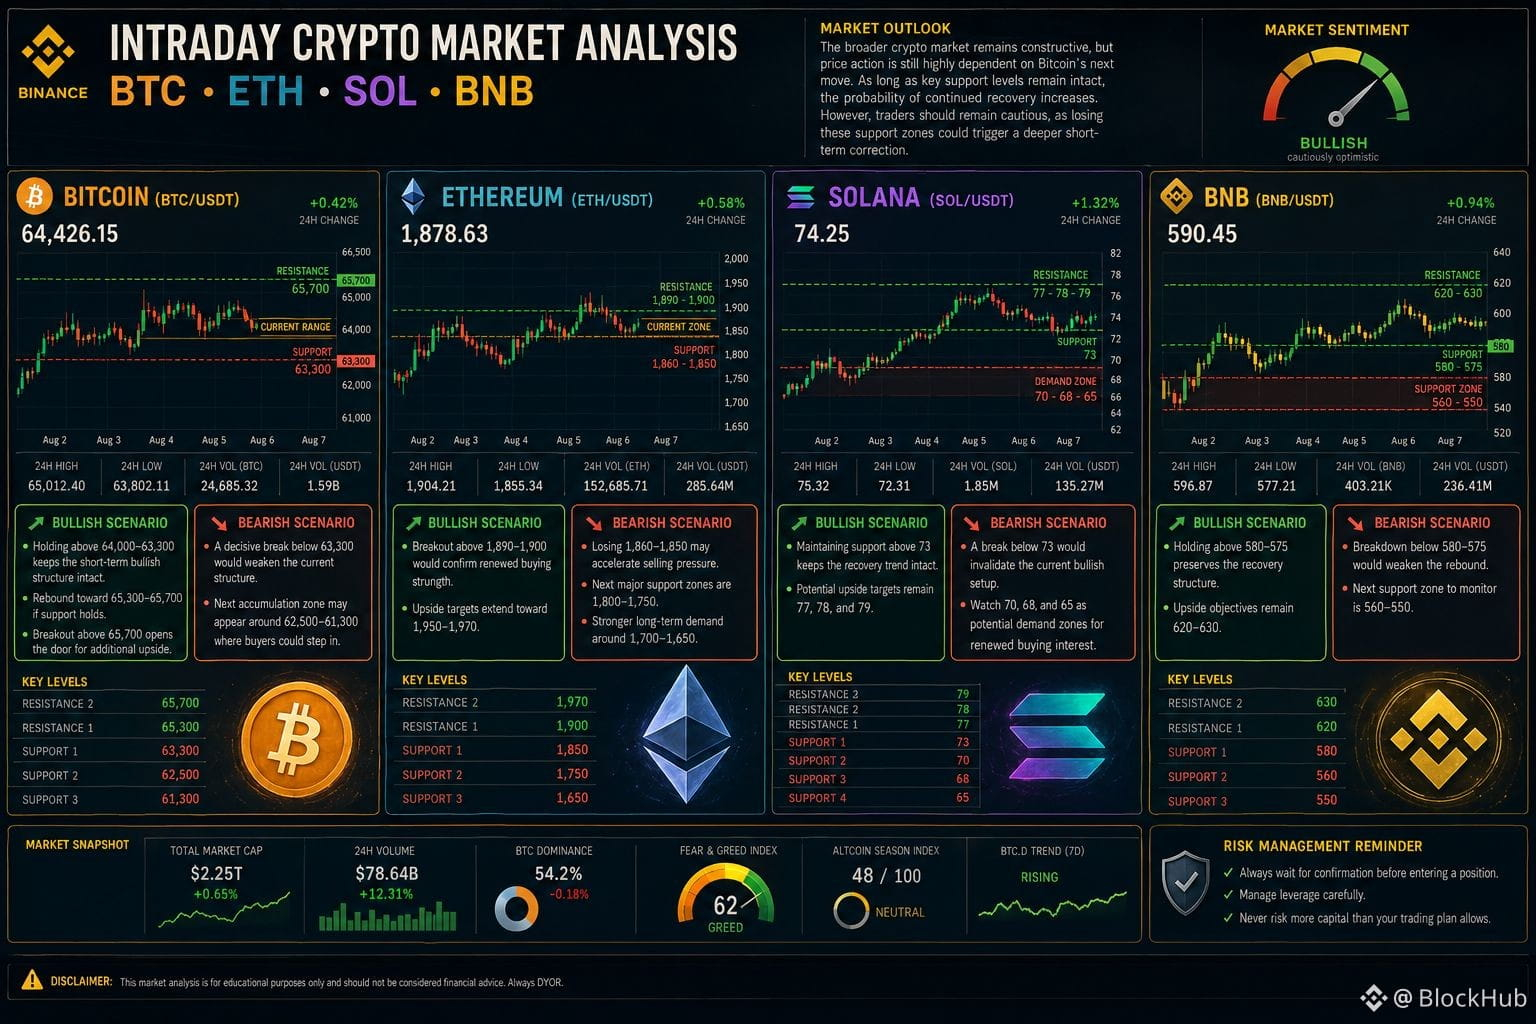
📊 Intraday Crypto Market Analysis | BTC • ETH • SOL • BNB
The crypto market remains in a consolidation phase, with Bitcoin trading inside a key range while major altcoins continue to show relative strength. The next breakout could determine short-term market direction.
🟠 BTC: Holding 64,000–63,300 keeps the bullish structure intact, with upside targets at 65,300–65,700. A break below 63,300 could open the door toward 62,500–61,300.
🔷 ETH: A breakout above 1,890–1,900 may push price toward 1,950–1,970. Losing 1,860–1,850 could trigger a move toward 1,800–1,750.
🟣 SOL: Staying above 73 supports further gains toward 77–79. A drop below 73 shifts focus to 70–68–65.
🟡 BNB: Holding 580–575 keeps the rebound alive, targeting 620–630. A breakdown below support could lead to 560–550.
⚠️ Market Outlook: Bitcoin remains the key driver for overall market sentiment. Watch for confirmation before entering trades and always manage risk carefully.
This analysis is for educational purposes only and is not financial advice. DYOR.
📊 Intraday Crypto Market Analysis | BTC • ETH • SOL • BNB
The crypto market remains in a consolidation phase, with Bitcoin trading inside a key range while major altcoins continue to show relative strength. The next breakout could determine short-term market direction.
🟠 BTC: Holding 64,000–63,300 keeps the bullish structure intact, with upside targets at 65,300–65,700. A break below 63,300 could open the door toward 62,500–61,300.
🔷 ETH: A breakout above 1,890–1,900 may push price toward 1,950–1,970. Losing 1,860–1,850 could trigger a move toward 1,800–1,750.
🟣 SOL: Staying above 73 supports further gains toward 77–79. A drop below 73 shifts focus to 70–68–65.
🟡 BNB: Holding 580–575 keeps the rebound alive, targeting 620–630. A breakdown below support could lead to 560–550.
⚠️ Market Outlook: Bitcoin remains the key driver for overall market sentiment. Watch for confirmation before entering trades and always manage risk carefully.
This analysis is for educational purposes only and is not financial advice. DYOR.
The crypto market remains in a consolidation phase, with Bitcoin trading inside a key range while major altcoins continue to show relative strength. The next breakout could determine short-term market direction.
🟠 BTC: Holding 64,000–63,300 keeps the bullish structure intact, with upside targets at 65,300–65,700. A break below 63,300 could open the door toward 62,500–61,300.
🔷 ETH: A breakout above 1,890–1,900 may push price toward 1,950–1,970. Losing 1,860–1,850 could trigger a move toward 1,800–1,750.
🟣 SOL: Staying above 73 supports further gains toward 77–79. A drop below 73 shifts focus to 70–68–65.
🟡 BNB: Holding 580–575 keeps the rebound alive, targeting 620–630. A breakdown below support could lead to 560–550.
⚠️ Market Outlook: Bitcoin remains the key driver for overall market sentiment. Watch for confirmation before entering trades and always manage risk carefully.
This analysis is for educational purposes only and is not financial advice. DYOR.
77
·
--
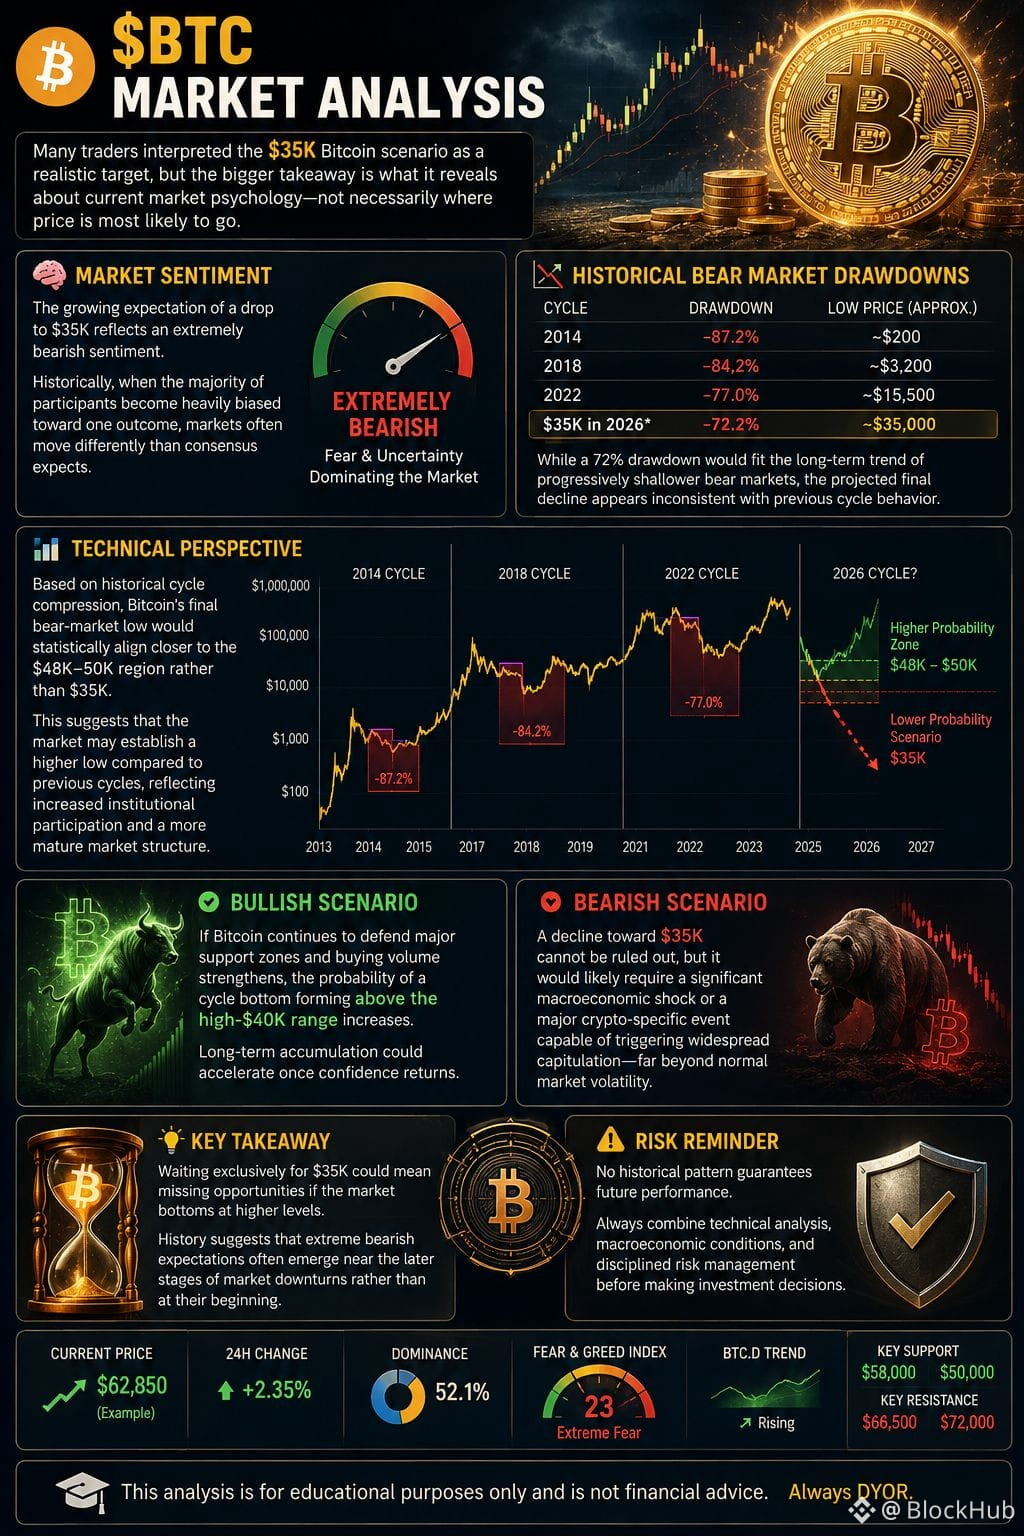
📊 $BTC Market Analysis
Many traders interpreted the $35K Bitcoin scenario as a realistic target, but the bigger takeaway is what it reveals about current market psychology—not necessarily where price is most likely to go.
🧠 Market Sentiment
The growing expectation of a drop to $35K reflects an extremely bearish sentiment. Historically, when the majority of participants become heavily biased toward one outcome, markets often move differently than consensus expects.
📉 Historical Bear Market Drawdowns
• 2014: -87.2%
• 2018: -84.2%
• 2022: -77.0%
• $35K in 2026: -72.2%
While a 72% drawdown would fit the long-term trend of progressively shallower bear markets, the projected final decline appears inconsistent with previous cycle behavior.
📈 Technical Perspective
Based on historical cycle compression, Bitcoin's final bear-market low would statistically align closer to the $48K–50K region rather than $35K. This suggests that the market may establish a higher low compared to previous cycles, reflecting increased institutional participation and a more mature market structure.
⚡ Bullish Scenario
If Bitcoin continues to defend major support zones and buying volume strengthens, the probability of a cycle bottom forming above the high-$40K range increases. Long-term accumulation could accelerate once confidence returns.
📉 Bearish Scenario
A decline toward $35K cannot be ruled out, but it would likely require a significant macroeconomic shock or a major crypto-specific event capable of triggering widespread capitulation—far beyond normal market volatility.
💡 Key Takeaway
Waiting exclusively for $35K could mean missing opportunities if the market bottoms at higher levels. History suggests that extreme bearish expectations often emerge near the later stages of market downturns rather than at their beginning.
⚠️ Risk Reminder
No historical pattern guarantees future performance. Always combine technical analysis, macroeconomic conditions, and disciplined risk management before making investment decisions.
📊 $BTC Market Analysis
Many traders interpreted the $35K Bitcoin scenario as a realistic target, but the bigger takeaway is what it reveals about current market psychology—not necessarily where price is most likely to go.
🧠 Market Sentiment
The growing expectation of a drop to $35K reflects an extremely bearish sentiment. Historically, when the majority of participants become heavily biased toward one outcome, markets often move differently than consensus expects.
📉 Historical Bear Market Drawdowns
• 2014: -87.2%
• 2018: -84.2%
• 2022: -77.0%
• $35K in 2026: -72.2%
While a 72% drawdown would fit the long-term trend of progressively shallower bear markets, the projected final decline appears inconsistent with previous cycle behavior.
📈 Technical Perspective
Based on historical cycle compression, Bitcoin's final bear-market low would statistically align closer to the $48K–50K region rather than $35K. This suggests that the market may establish a higher low compared to previous cycles, reflecting increased institutional participation and a more mature market structure.
⚡ Bullish Scenario
If Bitcoin continues to defend major support zones and buying volume strengthens, the probability of a cycle bottom forming above the high-$40K range increases. Long-term accumulation could accelerate once confidence returns.
📉 Bearish Scenario
A decline toward $35K cannot be ruled out, but it would likely require a significant macroeconomic shock or a major crypto-specific event capable of triggering widespread capitulation—far beyond normal market volatility.
💡 Key Takeaway
Waiting exclusively for $35K could mean missing opportunities if the market bottoms at higher levels. History suggests that extreme bearish expectations often emerge near the later stages of market downturns rather than at their beginning.
⚠️ Risk Reminder
No historical pattern guarantees future performance. Always combine technical analysis, macroeconomic conditions, and disciplined risk management before making investment decisions.
Many traders interpreted the $35K Bitcoin scenario as a realistic target, but the bigger takeaway is what it reveals about current market psychology—not necessarily where price is most likely to go.
🧠 Market Sentiment
The growing expectation of a drop to $35K reflects an extremely bearish sentiment. Historically, when the majority of participants become heavily biased toward one outcome, markets often move differently than consensus expects.
📉 Historical Bear Market Drawdowns
• 2014: -87.2%
• 2018: -84.2%
• 2022: -77.0%
• $35K in 2026: -72.2%
While a 72% drawdown would fit the long-term trend of progressively shallower bear markets, the projected final decline appears inconsistent with previous cycle behavior.
📈 Technical Perspective
Based on historical cycle compression, Bitcoin's final bear-market low would statistically align closer to the $48K–50K region rather than $35K. This suggests that the market may establish a higher low compared to previous cycles, reflecting increased institutional participation and a more mature market structure.
⚡ Bullish Scenario
If Bitcoin continues to defend major support zones and buying volume strengthens, the probability of a cycle bottom forming above the high-$40K range increases. Long-term accumulation could accelerate once confidence returns.
📉 Bearish Scenario
A decline toward $35K cannot be ruled out, but it would likely require a significant macroeconomic shock or a major crypto-specific event capable of triggering widespread capitulation—far beyond normal market volatility.
💡 Key Takeaway
Waiting exclusively for $35K could mean missing opportunities if the market bottoms at higher levels. History suggests that extreme bearish expectations often emerge near the later stages of market downturns rather than at their beginning.
⚠️ Risk Reminder
No historical pattern guarantees future performance. Always combine technical analysis, macroeconomic conditions, and disciplined risk management before making investment decisions.
72
·
--
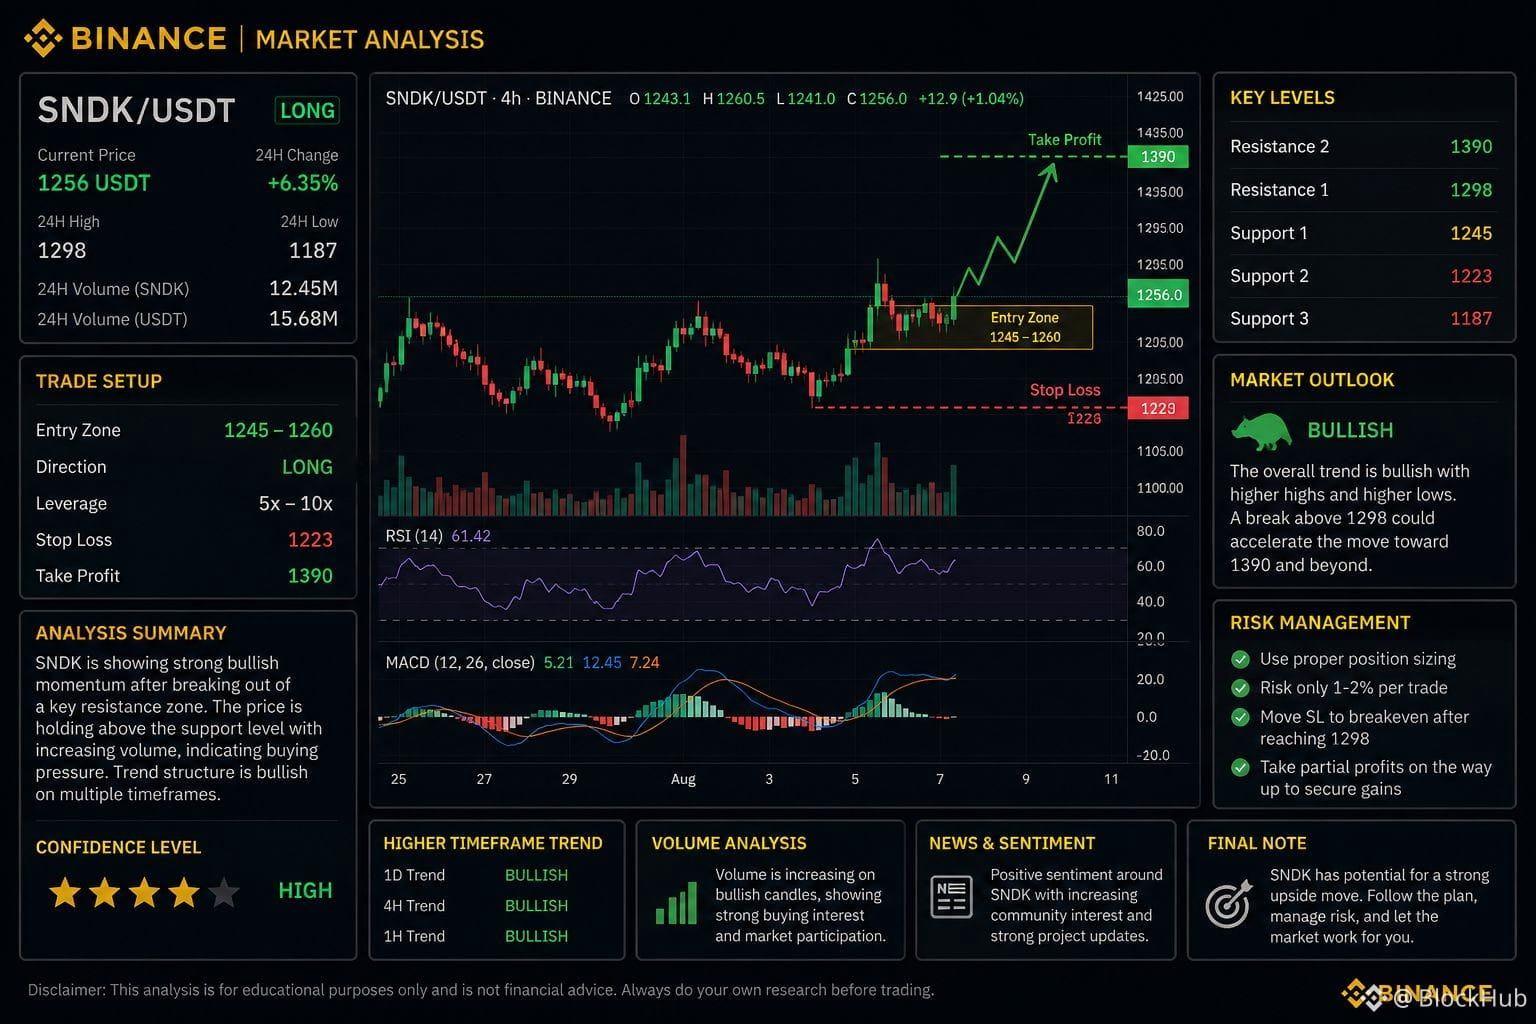
📈 $SNDK Trading Setup
🚀 Potential LONG Opportunity
The current price structure suggests a possible bullish continuation if buying momentum remains strong. A sustained move above nearby resistance could increase the probability of an upward expansion.
🎯 Trade Plan
• Position: LONG
• Stop Loss: 1223
• Take Profit: 1390
🔍 What to Watch
• Increasing trading volume on the breakout.
• RSI holding above neutral levels.
• Confirmation from MACD bullish momentum.
• Bitcoin's overall market direction, as it may influence altcoin volatility.
⚠️ Risk Management
Always size your position appropriately and never risk more than you can afford to lose. Wait for confirmation rather than chasing sudden price spikes.
This is a market analysis based on the current setup, not financial advice. DYOR.
📈 $SNDK Trading Setup
🚀 Potential LONG Opportunity
The current price structure suggests a possible bullish continuation if buying momentum remains strong. A sustained move above nearby resistance could increase the probability of an upward expansion.
🎯 Trade Plan
• Position: LONG
• Stop Loss: 1223
• Take Profit: 1390
🔍 What to Watch
• Increasing trading volume on the breakout.
• RSI holding above neutral levels.
• Confirmation from MACD bullish momentum.
• Bitcoin's overall market direction, as it may influence altcoin volatility.
⚠️ Risk Management
Always size your position appropriately and never risk more than you can afford to lose. Wait for confirmation rather than chasing sudden price spikes.
This is a market analysis based on the current setup, not financial advice. DYOR.
🚀 Potential LONG Opportunity
The current price structure suggests a possible bullish continuation if buying momentum remains strong. A sustained move above nearby resistance could increase the probability of an upward expansion.
🎯 Trade Plan
• Position: LONG
• Stop Loss: 1223
• Take Profit: 1390
🔍 What to Watch
• Increasing trading volume on the breakout.
• RSI holding above neutral levels.
• Confirmation from MACD bullish momentum.
• Bitcoin's overall market direction, as it may influence altcoin volatility.
⚠️ Risk Management
Always size your position appropriately and never risk more than you can afford to lose. Wait for confirmation rather than chasing sudden price spikes.
This is a market analysis based on the current setup, not financial advice. DYOR.
263
·
--
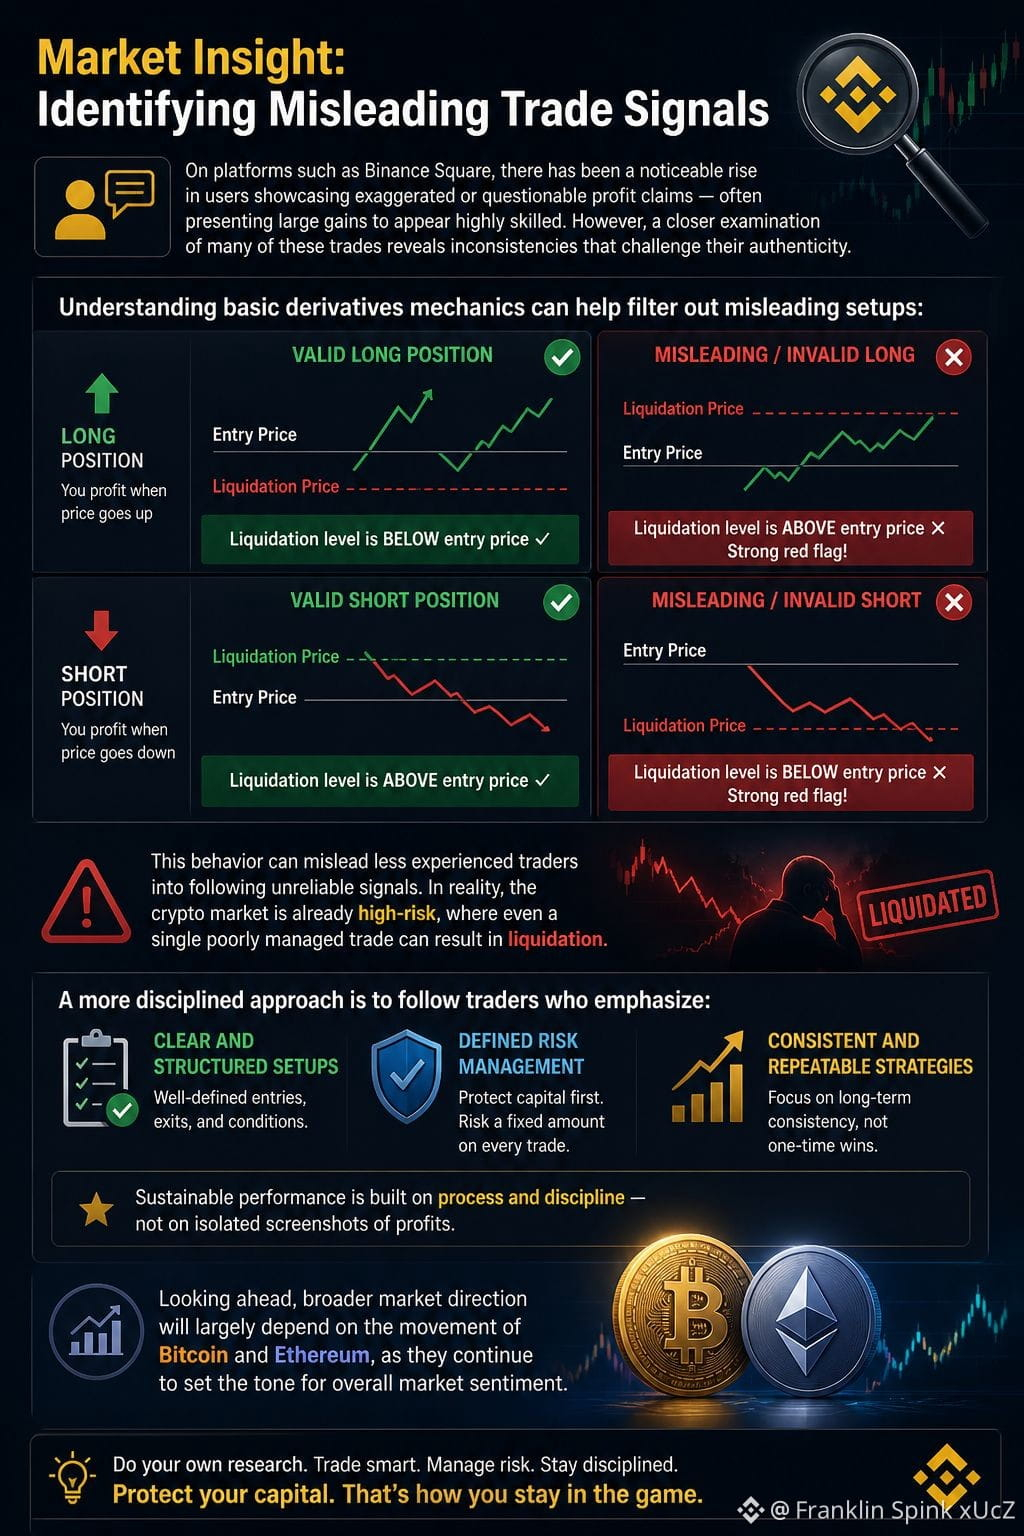
Market Insight: Identifying Misleading Trade Signals
On platforms such as Binance Square, there has been a noticeable rise in users showcasing exaggerated or questionable profit claims — often presenting large gains to appear highly skilled. However, a closer examination of many of these trades reveals inconsistencies that challenge their authenticity.
Understanding basic derivatives mechanics can help filter out misleading setups:
In a valid long position, the liquidation level is positioned below the entry price.
In a valid short position, the liquidation level is positioned above the entry price.
If these conditions appear reversed, it is a strong red flag that the position may be misrepresented or entirely fabricated.
This behavior can mislead less experienced traders into following unreliable signals. In reality, the crypto market is already high-risk, where even a single poorly managed trade can result in liquidation.
A more disciplined approach is to follow traders who emphasize:
Clear and structured setups
Defined risk management
Consistent and repeatable strategies
Sustainable performance is built on process and discipline — not on isolated screenshots of profits.
Looking ahead, broader market direction will largely depend on the movement of Bitcoin and Ethereum, as they continue to set the tone for overall market sentiment.
Market Insight: Identifying Misleading Trade Signals
On platforms such as Binance Square, there has been a noticeable rise in users showcasing exaggerated or questionable profit claims — often presenting large gains to appear highly skilled. However, a closer examination of many of these trades reveals inconsistencies that challenge their authenticity.
Understanding basic derivatives mechanics can help filter out misleading setups:
In a valid long position, the liquidation level is positioned below the entry price.
In a valid short position, the liquidation level is positioned above the entry price.
If these conditions appear reversed, it is a strong red flag that the position may be misrepresented or entirely fabricated.
This behavior can mislead less experienced traders into following unreliable signals. In reality, the crypto market is already high-risk, where even a single poorly managed trade can result in liquidation.
A more disciplined approach is to follow traders who emphasize:
Clear and structured setups
Defined risk management
Consistent and repeatable strategies
Sustainable performance is built on process and discipline — not on isolated screenshots of profits.
Looking ahead, broader market direction will largely depend on the movement of Bitcoin and Ethereum, as they continue to set the tone for overall market sentiment.
On platforms such as Binance Square, there has been a noticeable rise in users showcasing exaggerated or questionable profit claims — often presenting large gains to appear highly skilled. However, a closer examination of many of these trades reveals inconsistencies that challenge their authenticity.
Understanding basic derivatives mechanics can help filter out misleading setups:
In a valid long position, the liquidation level is positioned below the entry price.
In a valid short position, the liquidation level is positioned above the entry price.
If these conditions appear reversed, it is a strong red flag that the position may be misrepresented or entirely fabricated.
This behavior can mislead less experienced traders into following unreliable signals. In reality, the crypto market is already high-risk, where even a single poorly managed trade can result in liquidation.
A more disciplined approach is to follow traders who emphasize:
Clear and structured setups
Defined risk management
Consistent and repeatable strategies
Sustainable performance is built on process and discipline — not on isolated screenshots of profits.
Looking ahead, broader market direction will largely depend on the movement of Bitcoin and Ethereum, as they continue to set the tone for overall market sentiment.
60
·
--
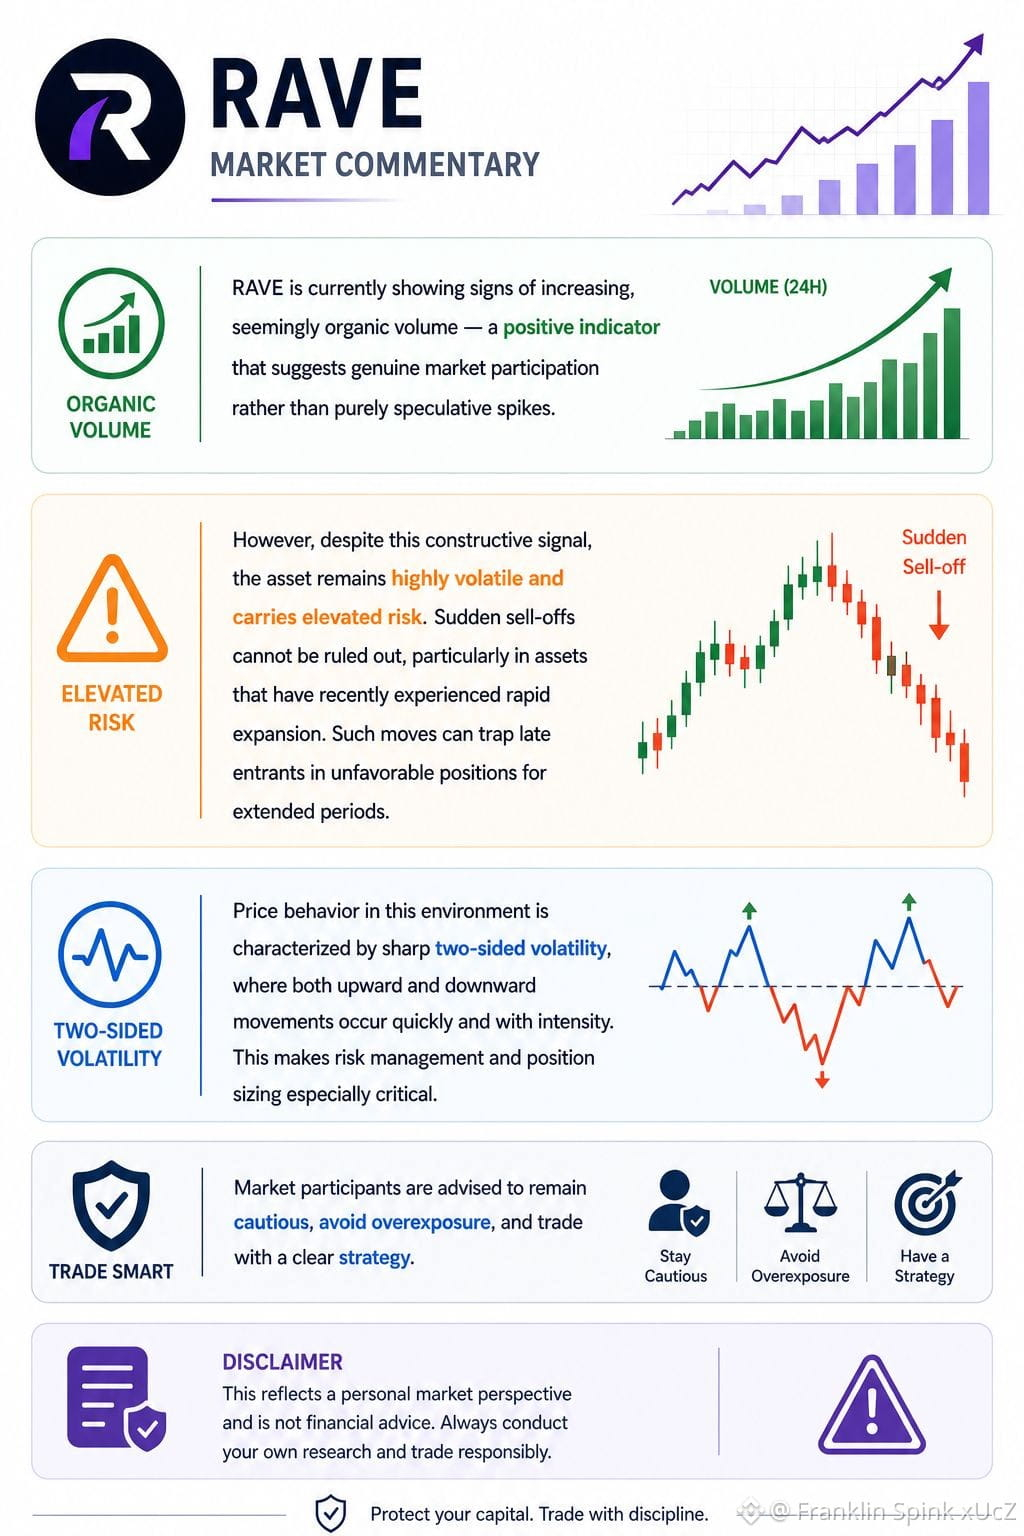
RAVE is currently showing signs of increasing, seemingly organic volume — a positive indicator that suggests genuine market participation rather than purely speculative spikes.
However, despite this constructive signal, the asset remains highly volatile and carries elevated risk. Sudden sell-offs cannot be ruled out, particularly in assets that have recently experienced rapid expansion. Such moves can trap late entrants in unfavorable positions for extended periods.
Price behavior in this environment is characterized by sharp two-sided volatility, where both upward and downward movements occur quickly and with intensity. This makes risk management and position sizing especially critical.
Market participants are advised to remain cautious, avoid overexposure, and trade with a clear strategy.
Disclaimer:
This reflects a personal market perspective and is not financial advice. Always conduct your own research and trade responsibly.
RAVE is currently showing signs of increasing, seemingly organic volume — a positive indicator that suggests genuine market participation rather than purely speculative spikes.
However, despite this constructive signal, the asset remains highly volatile and carries elevated risk. Sudden sell-offs cannot be ruled out, particularly in assets that have recently experienced rapid expansion. Such moves can trap late entrants in unfavorable positions for extended periods.
Price behavior in this environment is characterized by sharp two-sided volatility, where both upward and downward movements occur quickly and with intensity. This makes risk management and position sizing especially critical.
Market participants are advised to remain cautious, avoid overexposure, and trade with a clear strategy.
Disclaimer:
This reflects a personal market perspective and is not financial advice. Always conduct your own research and trade responsibly.
However, despite this constructive signal, the asset remains highly volatile and carries elevated risk. Sudden sell-offs cannot be ruled out, particularly in assets that have recently experienced rapid expansion. Such moves can trap late entrants in unfavorable positions for extended periods.
Price behavior in this environment is characterized by sharp two-sided volatility, where both upward and downward movements occur quickly and with intensity. This makes risk management and position sizing especially critical.
Market participants are advised to remain cautious, avoid overexposure, and trade with a clear strategy.
Disclaimer:
This reflects a personal market perspective and is not financial advice. Always conduct your own research and trade responsibly.
95
·
--
Bullish
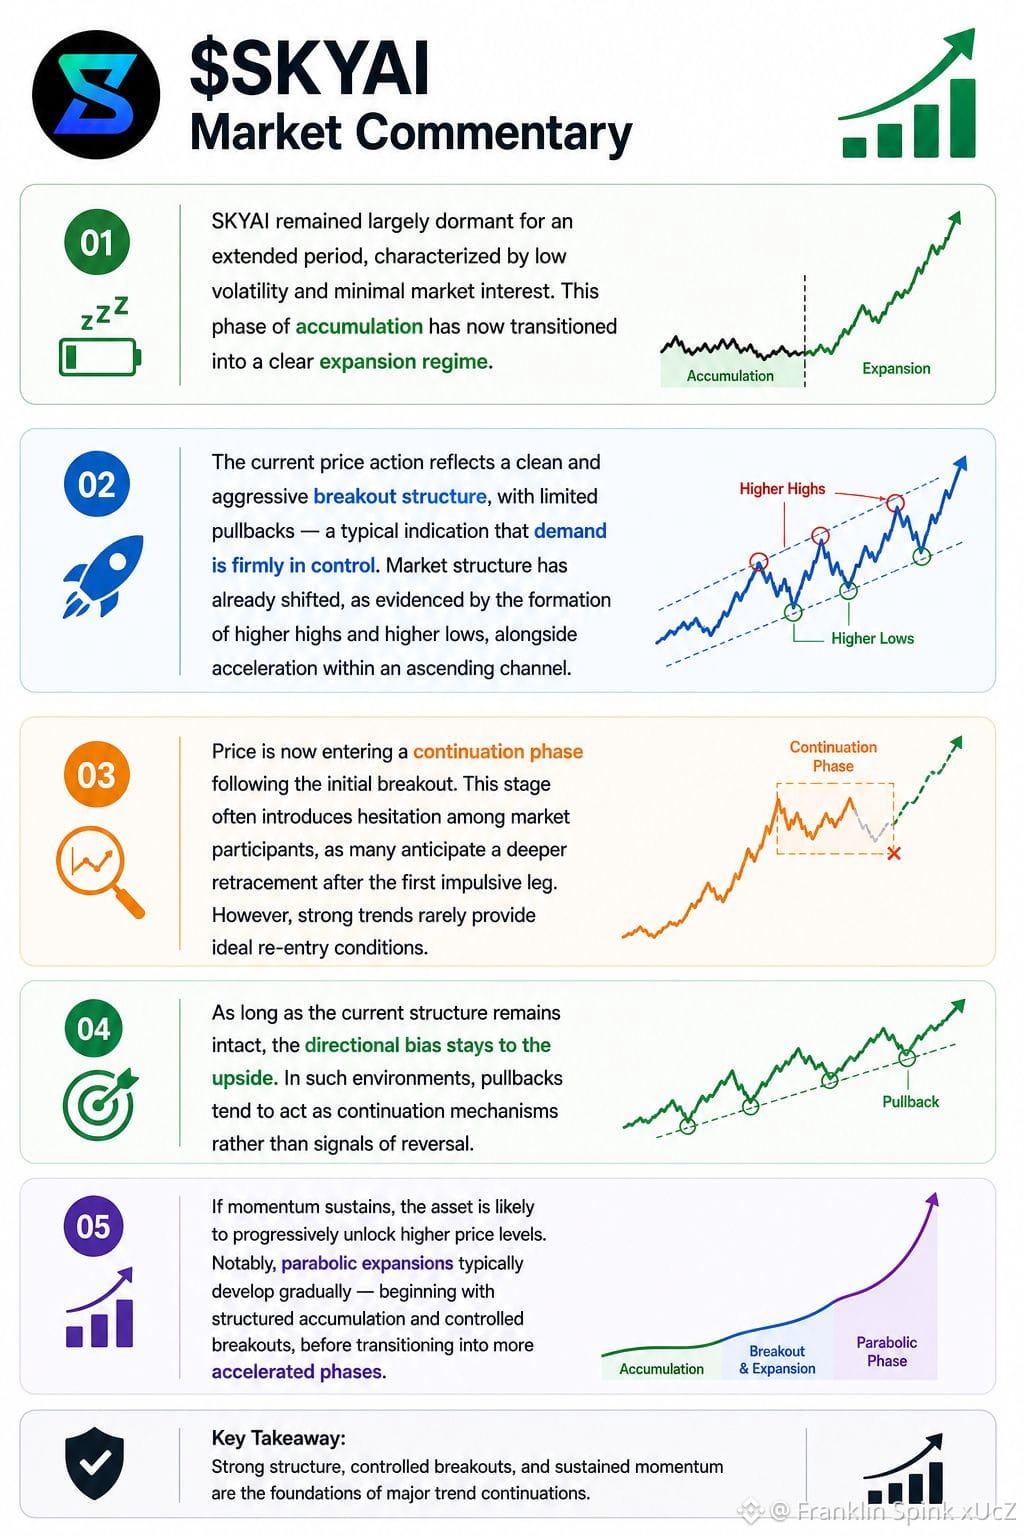
$SKYAI Market Commentary
SKYAI remained largely dormant for an extended period, characterized by low volatility and minimal market interest. This phase of accumulation has now transitioned into a clear expansion regime.
The current price action reflects a clean and aggressive breakout structure, with limited pullbacks — a typical indication that demand is firmly in control. Market structure has already shifted, as evidenced by the formation of higher highs and higher lows, alongside acceleration within an ascending channel.
Price is now entering a continuation phase following the initial breakout. This stage often introduces hesitation among market participants, as many anticipate a deeper retracement after the first impulsive leg. However, strong trends rarely provide ideal re-entry conditions.
As long as the current structure remains intact, the directional bias stays to the upside. In such environments, pullbacks tend to act as continuation mechanisms rather than signals of reversal.
If momentum sustains, the asset is likely to progressively unlock higher price levels. Notably, parabolic expansions typically develop gradually — beginning with structured accumulation and controlled breakouts, before transitioning into more accelerated phases.
$SKYAI Market Commentary
SKYAI remained largely dormant for an extended period, characterized by low volatility and minimal market interest. This phase of accumulation has now transitioned into a clear expansion regime.
The current price action reflects a clean and aggressive breakout structure, with limited pullbacks — a typical indication that demand is firmly in control. Market structure has already shifted, as evidenced by the formation of higher highs and higher lows, alongside acceleration within an ascending channel.
Price is now entering a continuation phase following the initial breakout. This stage often introduces hesitation among market participants, as many anticipate a deeper retracement after the first impulsive leg. However, strong trends rarely provide ideal re-entry conditions.
As long as the current structure remains intact, the directional bias stays to the upside. In such environments, pullbacks tend to act as continuation mechanisms rather than signals of reversal.
If momentum sustains, the asset is likely to progressively unlock higher price levels. Notably, parabolic expansions typically develop gradually — beginning with structured accumulation and controlled breakouts, before transitioning into more accelerated phases.
SKYAI remained largely dormant for an extended period, characterized by low volatility and minimal market interest. This phase of accumulation has now transitioned into a clear expansion regime.
The current price action reflects a clean and aggressive breakout structure, with limited pullbacks — a typical indication that demand is firmly in control. Market structure has already shifted, as evidenced by the formation of higher highs and higher lows, alongside acceleration within an ascending channel.
Price is now entering a continuation phase following the initial breakout. This stage often introduces hesitation among market participants, as many anticipate a deeper retracement after the first impulsive leg. However, strong trends rarely provide ideal re-entry conditions.
As long as the current structure remains intact, the directional bias stays to the upside. In such environments, pullbacks tend to act as continuation mechanisms rather than signals of reversal.
If momentum sustains, the asset is likely to progressively unlock higher price levels. Notably, parabolic expansions typically develop gradually — beginning with structured accumulation and controlled breakouts, before transitioning into more accelerated phases.
41
·
--
$LUNC Market Commentary
LUNC has recently exhibited a decisive upside breakout, reflecting a resurgence in market participation and bullish momentum. Despite the strength of the current move, the asset may still be in the early stages of a broader expansion cycle.
For investors evaluating entry at these levels, a cautious and disciplined approach is warranted. Pursuing price during an extended rally often results in suboptimal positioning from a risk-reward standpoint. A more strategic framework would involve waiting for a period of consolidation or a technical pullback before initiating exposure.
Entering at peak momentum without structural confirmation increases the likelihood of short-term volatility and drawdowns — a common characteristic of high-beta crypto assets. Effective timing, combined with proper market structure analysis, remains essential.
It is also critical to recognize that the cryptocurrency market is inherently volatile and influenced by rapidly shifting sentiment dynamics. Thorough independent research and robust risk management should underpin every investment decision.
Looking ahead, the medium-term outlook remains constructive. There is a credible pathway for LUNC to continue its recovery trajectory, with potential to approach key psychological price thresholds — including the reduction of one zero in its valuation.
Disclaimer:
This analysis represents a personal market perspective and should not be interpreted as financial advice. Market participants are strongly encouraged to conduct their own due diligence before making any investment decisions.
$LUNC Market Commentary
LUNC has recently exhibited a decisive upside breakout, reflecting a resurgence in market participation and bullish momentum. Despite the strength of the current move, the asset may still be in the early stages of a broader expansion cycle.
For investors evaluating entry at these levels, a cautious and disciplined approach is warranted. Pursuing price during an extended rally often results in suboptimal positioning from a risk-reward standpoint. A more strategic framework would involve waiting for a period of consolidation or a technical pullback before initiating exposure.
Entering at peak momentum without structural confirmation increases the likelihood of short-term volatility and drawdowns — a common characteristic of high-beta crypto assets. Effective timing, combined with proper market structure analysis, remains essential.
It is also critical to recognize that the cryptocurrency market is inherently volatile and influenced by rapidly shifting sentiment dynamics. Thorough independent research and robust risk management should underpin every investment decision.
Looking ahead, the medium-term outlook remains constructive. There is a credible pathway for LUNC to continue its recovery trajectory, with potential to approach key psychological price thresholds — including the reduction of one zero in its valuation.
Disclaimer:
This analysis represents a personal market perspective and should not be interpreted as financial advice. Market participants are strongly encouraged to conduct their own due diligence before making any investment decisions.
LUNC has recently exhibited a decisive upside breakout, reflecting a resurgence in market participation and bullish momentum. Despite the strength of the current move, the asset may still be in the early stages of a broader expansion cycle.
For investors evaluating entry at these levels, a cautious and disciplined approach is warranted. Pursuing price during an extended rally often results in suboptimal positioning from a risk-reward standpoint. A more strategic framework would involve waiting for a period of consolidation or a technical pullback before initiating exposure.
Entering at peak momentum without structural confirmation increases the likelihood of short-term volatility and drawdowns — a common characteristic of high-beta crypto assets. Effective timing, combined with proper market structure analysis, remains essential.
It is also critical to recognize that the cryptocurrency market is inherently volatile and influenced by rapidly shifting sentiment dynamics. Thorough independent research and robust risk management should underpin every investment decision.
Looking ahead, the medium-term outlook remains constructive. There is a credible pathway for LUNC to continue its recovery trajectory, with potential to approach key psychological price thresholds — including the reduction of one zero in its valuation.
Disclaimer:
This analysis represents a personal market perspective and should not be interpreted as financial advice. Market participants are strongly encouraged to conduct their own due diligence before making any investment decisions.
50
·
--
$LUNC Market Commentary
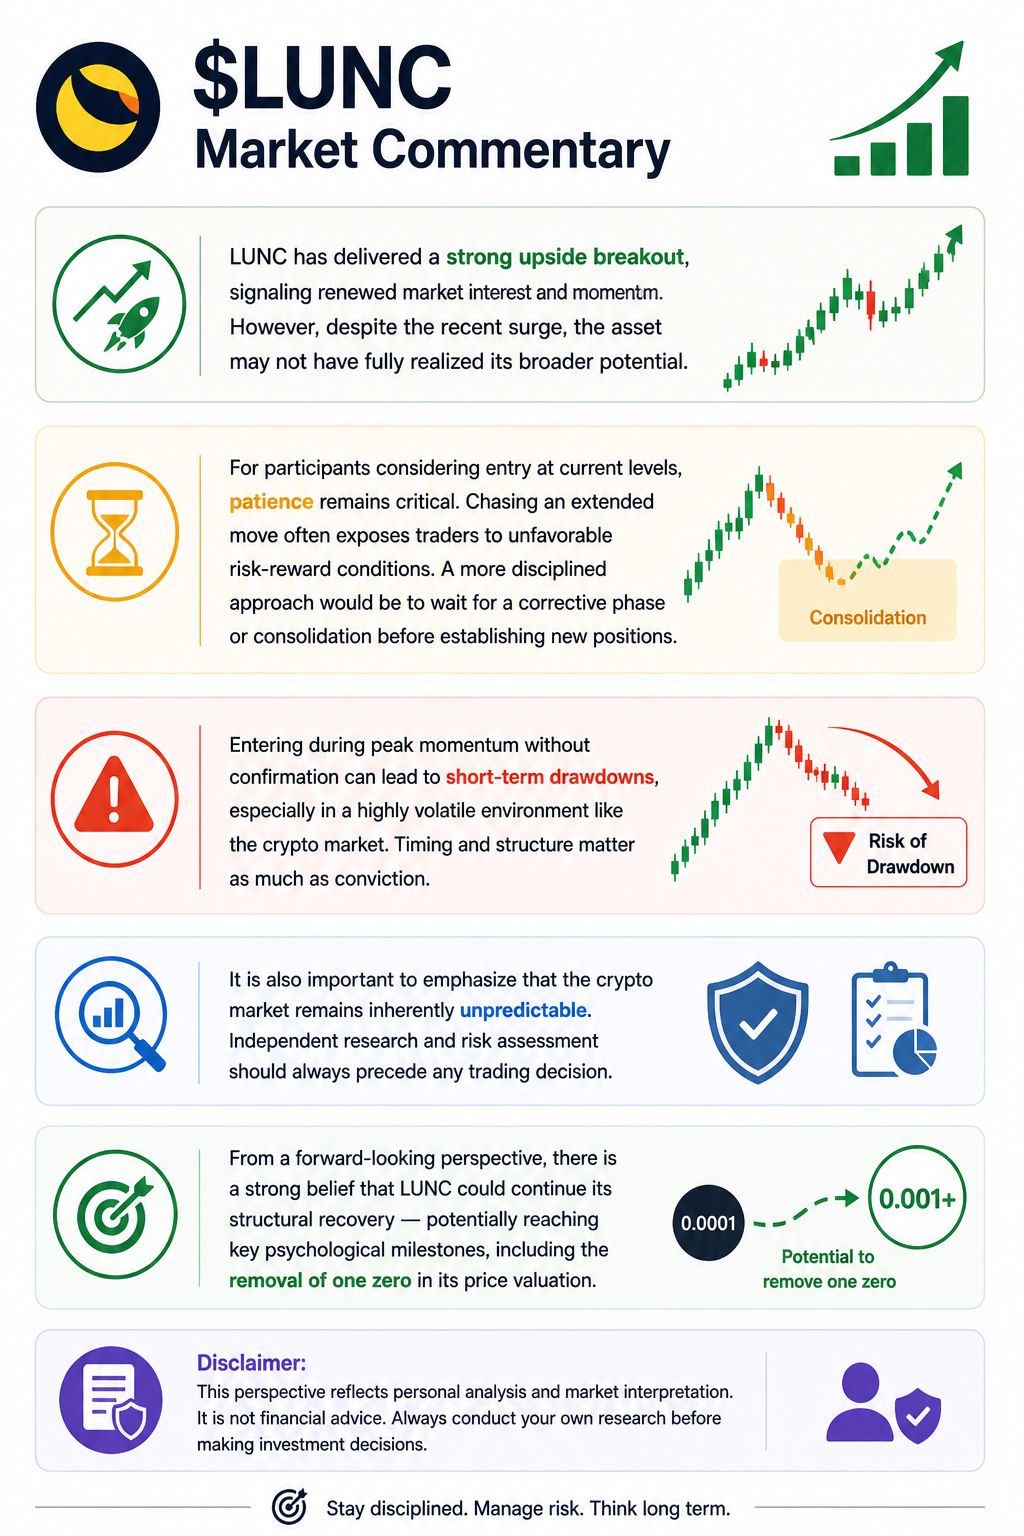
LUNC has delivered a strong upside breakout, signaling renewed market interest and momentum. However, despite the recent surge, the asset may not have fully realized its broader potential.
For participants considering entry at current levels, patience remains critical. Chasing an extended move often exposes traders to unfavorable risk-reward conditions. A more disciplined approach would be to wait for a corrective phase or consolidation before establishing new positions.
Entering during peak momentum without confirmation can lead to short-term drawdowns, especially in a highly volatile environment like the crypto market. Timing and structure matter as much as conviction.
It is also important to emphasize that the crypto market remains inherently unpredictable. Independent research and risk assessment should always precede any trading decision.
From a forward-looking perspective, there is a strong belief that LUNC could continue its structural recovery — potentially reaching key psychological milestones, including the removal of one zero in its price valuation.
Disclaimer:
This perspective reflects personal analysis and market interpretation. It is not financial advice. Always conduct your own research before making investment decisions.
$LUNC Market Commentary
LUNC has delivered a strong upside breakout, signaling renewed market interest and momentum. However, despite the recent surge, the asset may not have fully realized its broader potential.
For participants considering entry at current levels, patience remains critical. Chasing an extended move often exposes traders to unfavorable risk-reward conditions. A more disciplined approach would be to wait for a corrective phase or consolidation before establishing new positions.
Entering during peak momentum without confirmation can lead to short-term drawdowns, especially in a highly volatile environment like the crypto market. Timing and structure matter as much as conviction.
It is also important to emphasize that the crypto market remains inherently unpredictable. Independent research and risk assessment should always precede any trading decision.
From a forward-looking perspective, there is a strong belief that LUNC could continue its structural recovery — potentially reaching key psychological milestones, including the removal of one zero in its price valuation.
Disclaimer:
This perspective reflects personal analysis and market interpretation. It is not financial advice. Always conduct your own research before making investment decisions.
LUNC has delivered a strong upside breakout, signaling renewed market interest and momentum. However, despite the recent surge, the asset may not have fully realized its broader potential.
For participants considering entry at current levels, patience remains critical. Chasing an extended move often exposes traders to unfavorable risk-reward conditions. A more disciplined approach would be to wait for a corrective phase or consolidation before establishing new positions.
Entering during peak momentum without confirmation can lead to short-term drawdowns, especially in a highly volatile environment like the crypto market. Timing and structure matter as much as conviction.
It is also important to emphasize that the crypto market remains inherently unpredictable. Independent research and risk assessment should always precede any trading decision.
From a forward-looking perspective, there is a strong belief that LUNC could continue its structural recovery — potentially reaching key psychological milestones, including the removal of one zero in its price valuation.
Disclaimer:
This perspective reflects personal analysis and market interpretation. It is not financial advice. Always conduct your own research before making investment decisions.
61
·
--
Market Insight: Respecting Trend Momentum
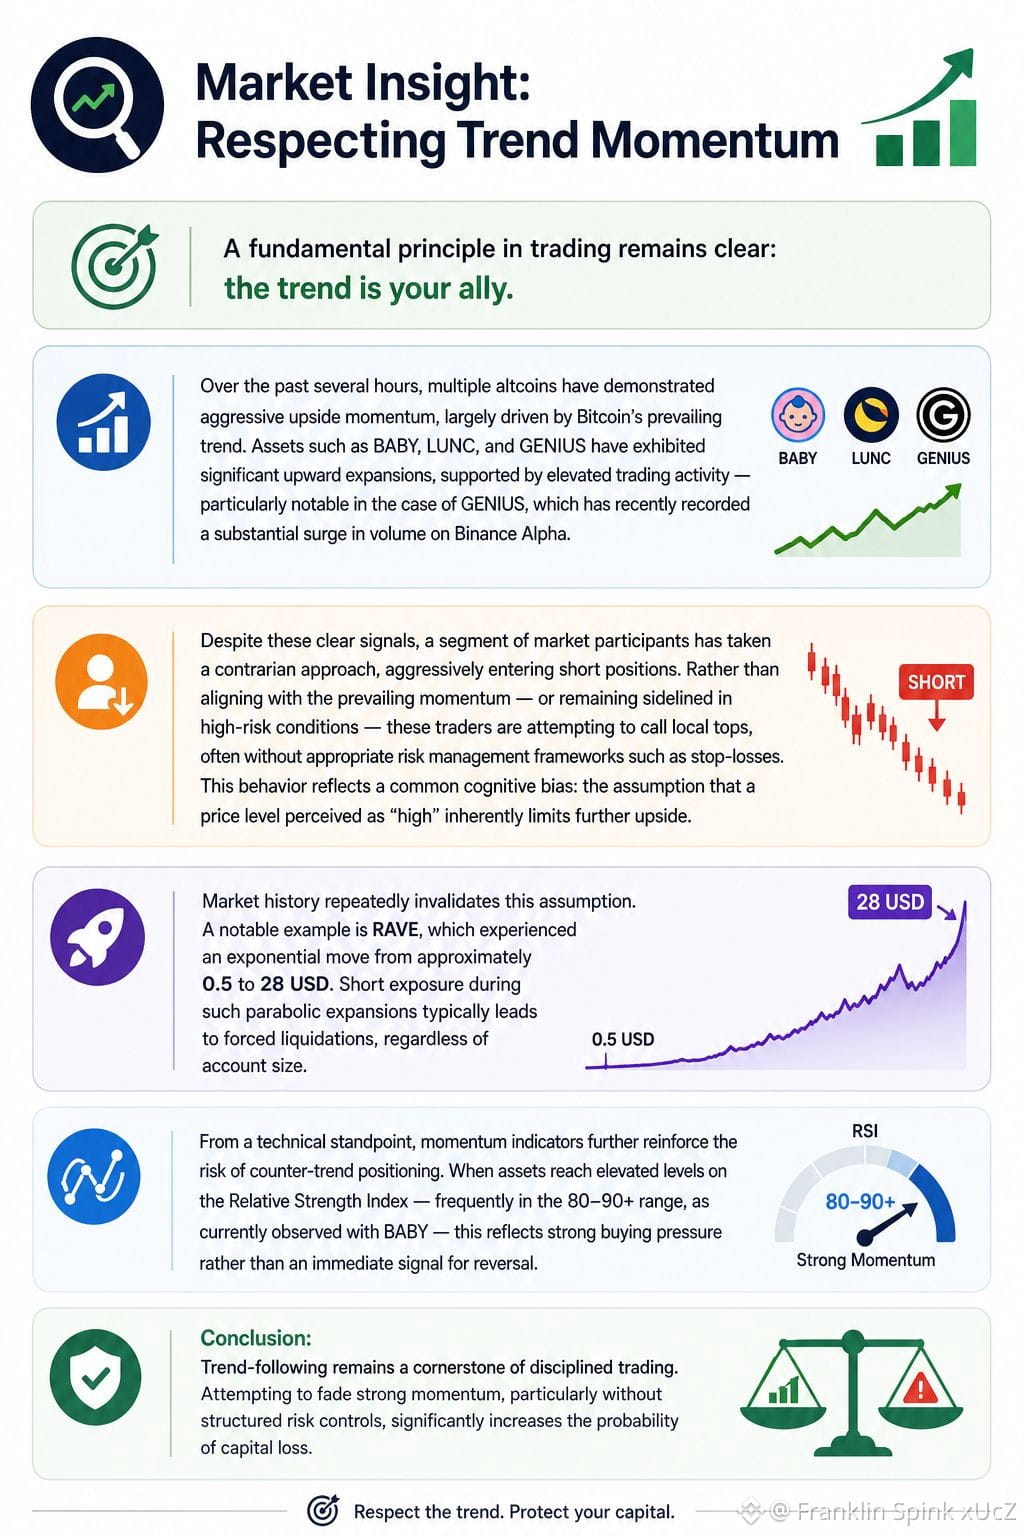
A fundamental principle in trading remains clear: the trend is your ally.
Over the past several hours, multiple altcoins have demonstrated aggressive upside momentum, largely driven by Bitcoin’s prevailing trend. Assets such as BABY, LUNC, and GENIUS have exhibited significant upward expansions, supported by elevated trading activity — particularly notable in the case of GENIUS, which has recently recorded a substantial surge in volume on Binance Alpha.
Despite these clear signals, a segment of market participants has taken a contrarian approach, aggressively entering short positions. Rather than aligning with the prevailing momentum — or remaining sidelined in high-risk conditions — these traders are attempting to call local tops, often without appropriate risk management frameworks such as stop-losses. This behavior reflects a common cognitive bias: the assumption that a price level perceived as “high” inherently limits further upside.
Market history repeatedly invalidates this assumption. A notable example is RAVE, which experienced an exponential move from approximately 0.5 to 28 USD. Short exposure during such parabolic expansions typically leads to forced liquidations, regardless of account size.
From a technical standpoint, momentum indicators further reinforce the risk of counter-trend positioning. When assets reach elevated levels on the Relative Strength Index — frequently in the 80–90+ range, as currently observed with BABY — this reflects strong buying pressure rather than an immediate signal for reversal.
Conclusion:
Trend-following remains a cornerstone of disciplined trading. Attempting to fade strong momentum, particularly without structured risk controls, significantly increases the probability of capital loss.
Market Insight: Respecting Trend Momentum
A fundamental principle in trading remains clear: the trend is your ally.
Over the past several hours, multiple altcoins have demonstrated aggressive upside momentum, largely driven by Bitcoin’s prevailing trend. Assets such as BABY, LUNC, and GENIUS have exhibited significant upward expansions, supported by elevated trading activity — particularly notable in the case of GENIUS, which has recently recorded a substantial surge in volume on Binance Alpha.
Despite these clear signals, a segment of market participants has taken a contrarian approach, aggressively entering short positions. Rather than aligning with the prevailing momentum — or remaining sidelined in high-risk conditions — these traders are attempting to call local tops, often without appropriate risk management frameworks such as stop-losses. This behavior reflects a common cognitive bias: the assumption that a price level perceived as “high” inherently limits further upside.
Market history repeatedly invalidates this assumption. A notable example is RAVE, which experienced an exponential move from approximately 0.5 to 28 USD. Short exposure during such parabolic expansions typically leads to forced liquidations, regardless of account size.
From a technical standpoint, momentum indicators further reinforce the risk of counter-trend positioning. When assets reach elevated levels on the Relative Strength Index — frequently in the 80–90+ range, as currently observed with BABY — this reflects strong buying pressure rather than an immediate signal for reversal.
Conclusion:
Trend-following remains a cornerstone of disciplined trading. Attempting to fade strong momentum, particularly without structured risk controls, significantly increases the probability of capital loss.
A fundamental principle in trading remains clear: the trend is your ally.
Over the past several hours, multiple altcoins have demonstrated aggressive upside momentum, largely driven by Bitcoin’s prevailing trend. Assets such as BABY, LUNC, and GENIUS have exhibited significant upward expansions, supported by elevated trading activity — particularly notable in the case of GENIUS, which has recently recorded a substantial surge in volume on Binance Alpha.
Despite these clear signals, a segment of market participants has taken a contrarian approach, aggressively entering short positions. Rather than aligning with the prevailing momentum — or remaining sidelined in high-risk conditions — these traders are attempting to call local tops, often without appropriate risk management frameworks such as stop-losses. This behavior reflects a common cognitive bias: the assumption that a price level perceived as “high” inherently limits further upside.
Market history repeatedly invalidates this assumption. A notable example is RAVE, which experienced an exponential move from approximately 0.5 to 28 USD. Short exposure during such parabolic expansions typically leads to forced liquidations, regardless of account size.
From a technical standpoint, momentum indicators further reinforce the risk of counter-trend positioning. When assets reach elevated levels on the Relative Strength Index — frequently in the 80–90+ range, as currently observed with BABY — this reflects strong buying pressure rather than an immediate signal for reversal.
Conclusion:
Trend-following remains a cornerstone of disciplined trading. Attempting to fade strong momentum, particularly without structured risk controls, significantly increases the probability of capital loss.
76
·
--
$STO Market Commentary
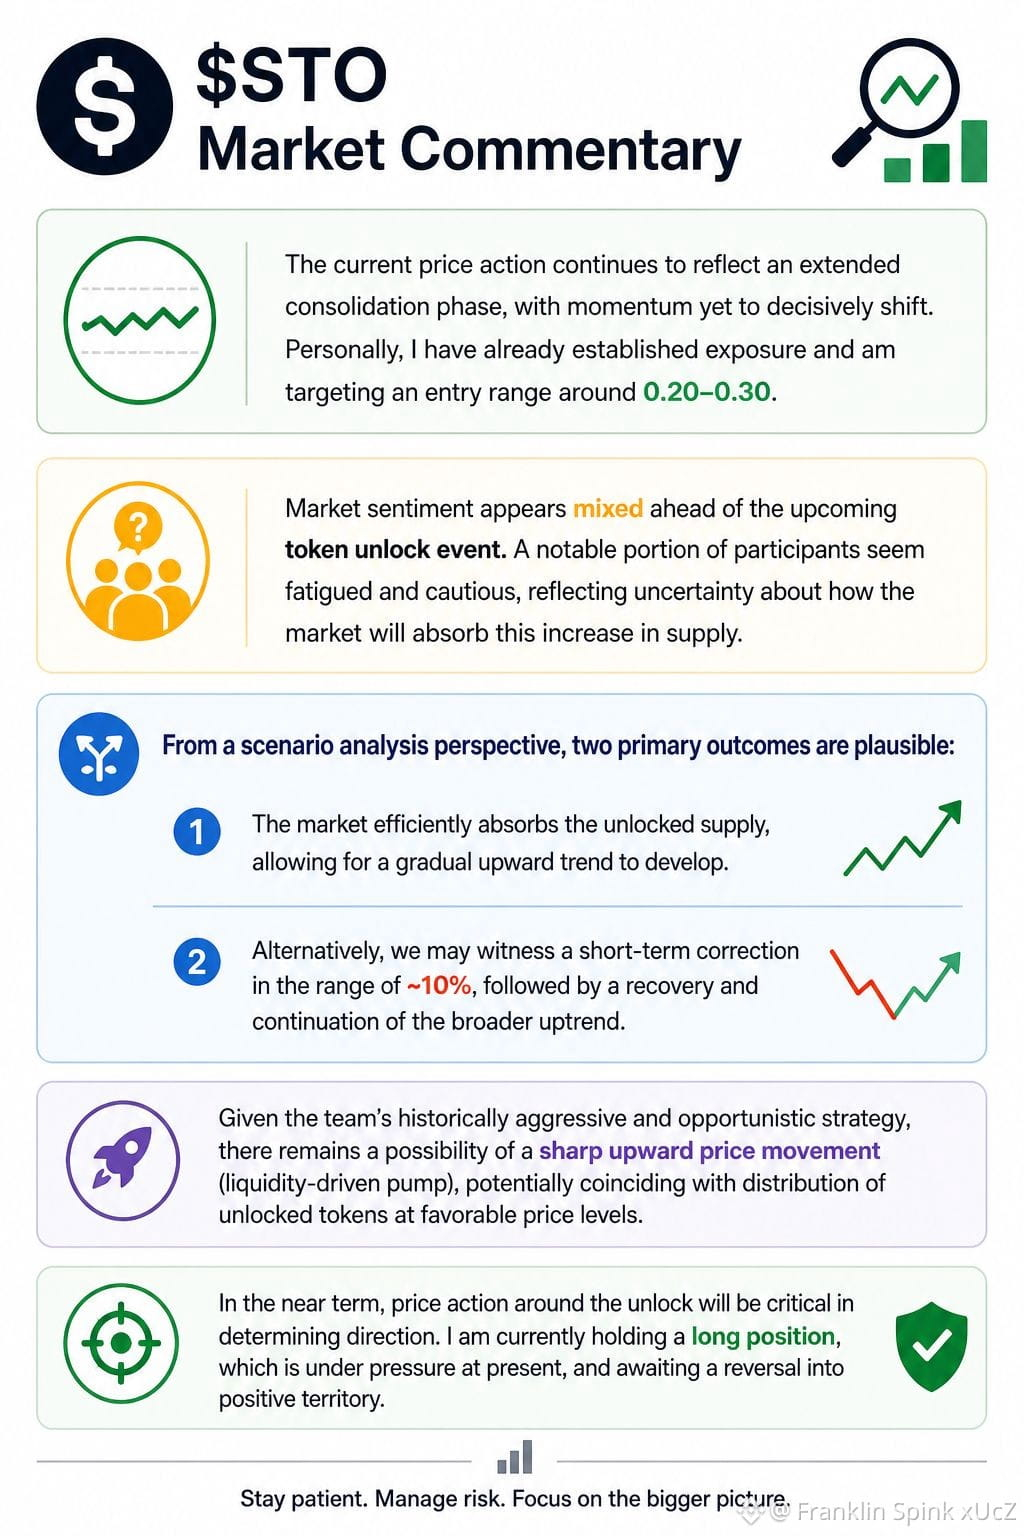
The current price action remains in an extended consolidation phase, with no clear breakout in momentum yet. I have already established exposure and am monitoring the 0.20–0.30 range as a key area of interest.
Market sentiment appears increasingly cautious ahead of the upcoming token unlock. Many participants seem fatigued and concerned about potential downside pressure as new supply enters the market.
From a scenario standpoint, two primary outcomes are likely:
The market successfully absorbs the additional supply, allowing for a gradual continuation of the uptrend.
A short-term pullback of approximately 10% occurs, followed by stabilization and renewed upward movement.
Considering the team’s historically aggressive and opportunistic approach, there is also a credible possibility of a sharp upward move, potentially enabling distribution of unlocked tokens at more favorable price levels.
The reaction around the unlock event will be decisive for short-term direction. I am currently holding a long position, which is in negative territory, and awaiting a reversal back into profit.
$STO Market Commentary
The current price action remains in an extended consolidation phase, with no clear breakout in momentum yet. I have already established exposure and am monitoring the 0.20–0.30 range as a key area of interest.
Market sentiment appears increasingly cautious ahead of the upcoming token unlock. Many participants seem fatigued and concerned about potential downside pressure as new supply enters the market.
From a scenario standpoint, two primary outcomes are likely:
The market successfully absorbs the additional supply, allowing for a gradual continuation of the uptrend.
A short-term pullback of approximately 10% occurs, followed by stabilization and renewed upward movement.
Considering the team’s historically aggressive and opportunistic approach, there is also a credible possibility of a sharp upward move, potentially enabling distribution of unlocked tokens at more favorable price levels.
The reaction around the unlock event will be decisive for short-term direction. I am currently holding a long position, which is in negative territory, and awaiting a reversal back into profit.
The current price action remains in an extended consolidation phase, with no clear breakout in momentum yet. I have already established exposure and am monitoring the 0.20–0.30 range as a key area of interest.
Market sentiment appears increasingly cautious ahead of the upcoming token unlock. Many participants seem fatigued and concerned about potential downside pressure as new supply enters the market.
From a scenario standpoint, two primary outcomes are likely:
The market successfully absorbs the additional supply, allowing for a gradual continuation of the uptrend.
A short-term pullback of approximately 10% occurs, followed by stabilization and renewed upward movement.
Considering the team’s historically aggressive and opportunistic approach, there is also a credible possibility of a sharp upward move, potentially enabling distribution of unlocked tokens at more favorable price levels.
The reaction around the unlock event will be decisive for short-term direction. I am currently holding a long position, which is in negative territory, and awaiting a reversal back into profit.
90
·
--
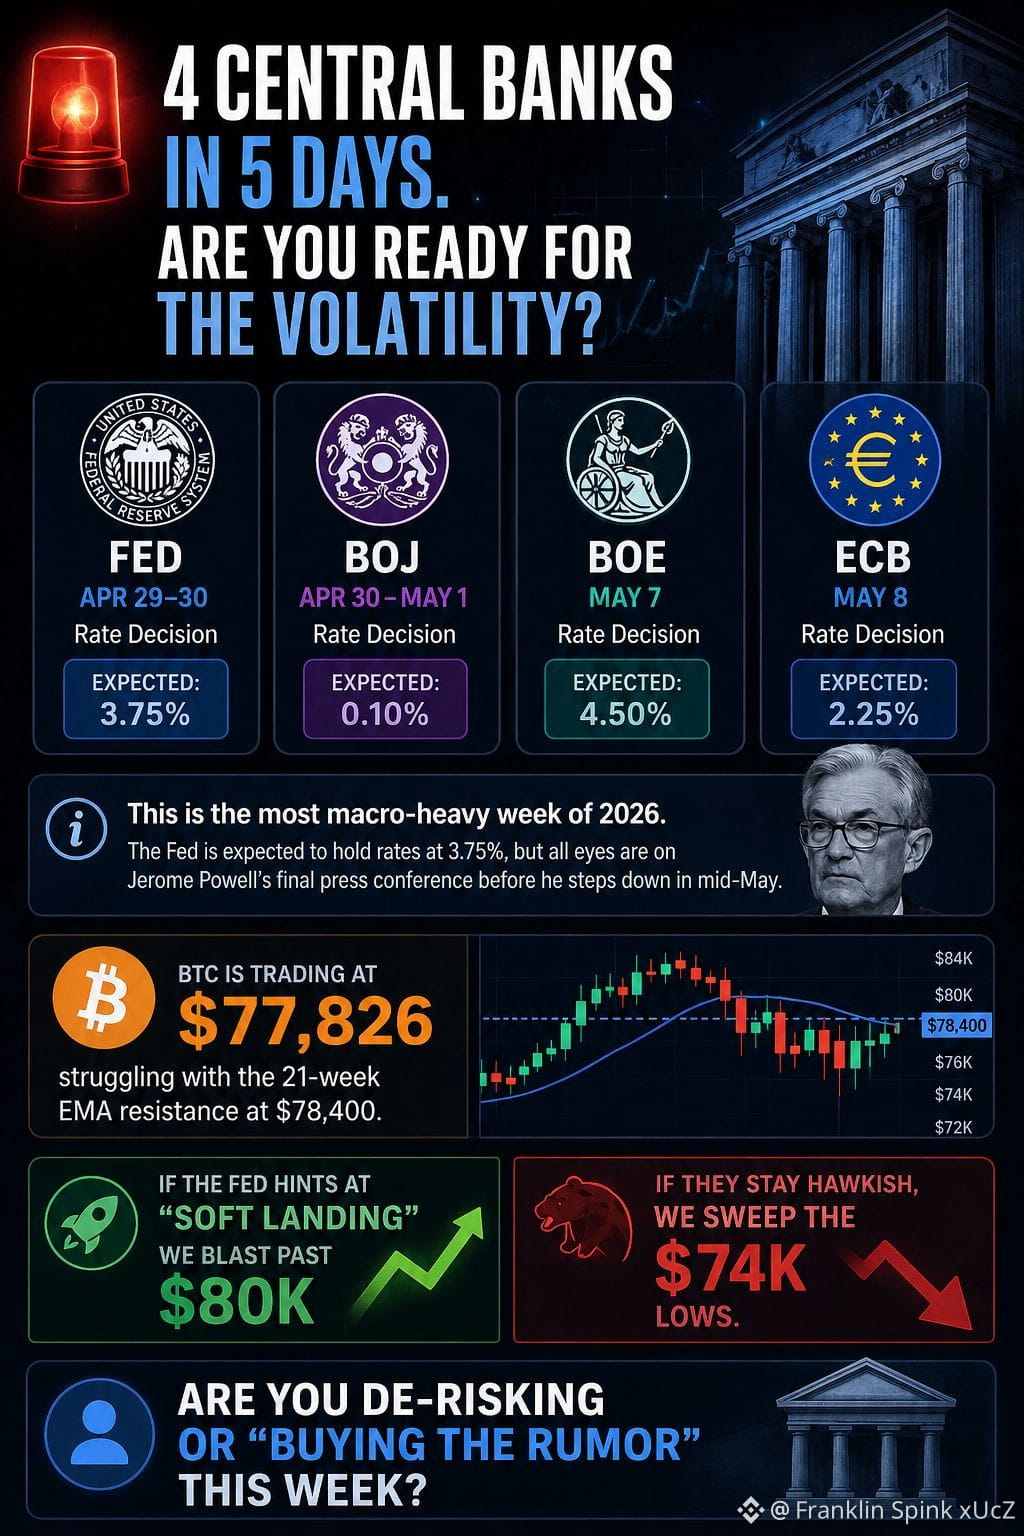
🚨 4 Central Banks. 5 Days. One Macro Catalyst Window.
• Macro Landscape:
This is easily the most policy-heavy stretch of 2026. The spotlight is on the Federal Reserve, with markets expecting rates to hold around 3.75%. But the real driver isn’t the decision — it’s the tone. This will be Jerome Powell’s final press conference before stepping down in mid-May, which adds an extra layer of uncertainty and potential narrative shift.
• $BTC Technical Context:
Bitcoin is currently trading around $77.8K, pressing against the 21-week EMA near $78.4K — a key dynamic resistance. Price is compressing right under a major macro trigger, which typically precedes expansion.
• Scenario Mapping:
🟢 Dovish / Soft Landing Signal:
If the Fed leans toward easing or signals confidence in a soft landing:
→ Expect a clean break above $78.4K
→ Momentum continuation toward $80K+
→ احتمالية تسارع FOMO ودخول سيولة جديدة
🔴 Hawkish / Higher-for-Longer Tone:
If Powell maintains a restrictive stance:
→ Rejection from resistance likely
→ Sweep of $74K liquidity zone
→ Potential deeper pullback if risk-off accelerates
• Positioning Insight:
This isn’t the week to trade emotionally. Macro weeks like this are liquidity traps for impatient traders. The move will come from interpretation, not just the headline.
• Professional Approach:
Smart money doesn’t guess — it reacts.
Reduce exposure into uncertainty
Let the event play out
Trade confirmation, not anticipation
• The Real Question:
Are you positioning ahead of the narrative — or waiting for the market to confirm direction?
🚨 4 Central Banks. 5 Days. One Macro Catalyst Window.
• Macro Landscape:
This is easily the most policy-heavy stretch of 2026. The spotlight is on the Federal Reserve, with markets expecting rates to hold around 3.75%. But the real driver isn’t the decision — it’s the tone. This will be Jerome Powell’s final press conference before stepping down in mid-May, which adds an extra layer of uncertainty and potential narrative shift.
• $BTC Technical Context:
Bitcoin is currently trading around $77.8K, pressing against the 21-week EMA near $78.4K — a key dynamic resistance. Price is compressing right under a major macro trigger, which typically precedes expansion.
• Scenario Mapping:
🟢 Dovish / Soft Landing Signal:
If the Fed leans toward easing or signals confidence in a soft landing:
→ Expect a clean break above $78.4K
→ Momentum continuation toward $80K+
→ احتمالية تسارع FOMO ودخول سيولة جديدة
🔴 Hawkish / Higher-for-Longer Tone:
If Powell maintains a restrictive stance:
→ Rejection from resistance likely
→ Sweep of $74K liquidity zone
→ Potential deeper pullback if risk-off accelerates
• Positioning Insight:
This isn’t the week to trade emotionally. Macro weeks like this are liquidity traps for impatient traders. The move will come from interpretation, not just the headline.
• Professional Approach:
Smart money doesn’t guess — it reacts.
Reduce exposure into uncertainty
Let the event play out
Trade confirmation, not anticipation
• The Real Question:
Are you positioning ahead of the narrative — or waiting for the market to confirm direction?
• Macro Landscape:
This is easily the most policy-heavy stretch of 2026. The spotlight is on the Federal Reserve, with markets expecting rates to hold around 3.75%. But the real driver isn’t the decision — it’s the tone. This will be Jerome Powell’s final press conference before stepping down in mid-May, which adds an extra layer of uncertainty and potential narrative shift.
• $BTC Technical Context:
Bitcoin is currently trading around $77.8K, pressing against the 21-week EMA near $78.4K — a key dynamic resistance. Price is compressing right under a major macro trigger, which typically precedes expansion.
• Scenario Mapping:
🟢 Dovish / Soft Landing Signal:
If the Fed leans toward easing or signals confidence in a soft landing:
→ Expect a clean break above $78.4K
→ Momentum continuation toward $80K+
→ احتمالية تسارع FOMO ودخول سيولة جديدة
🔴 Hawkish / Higher-for-Longer Tone:
If Powell maintains a restrictive stance:
→ Rejection from resistance likely
→ Sweep of $74K liquidity zone
→ Potential deeper pullback if risk-off accelerates
• Positioning Insight:
This isn’t the week to trade emotionally. Macro weeks like this are liquidity traps for impatient traders. The move will come from interpretation, not just the headline.
• Professional Approach:
Smart money doesn’t guess — it reacts.
Reduce exposure into uncertainty
Let the event play out
Trade confirmation, not anticipation
• The Real Question:
Are you positioning ahead of the narrative — or waiting for the market to confirm direction?
34
·
--
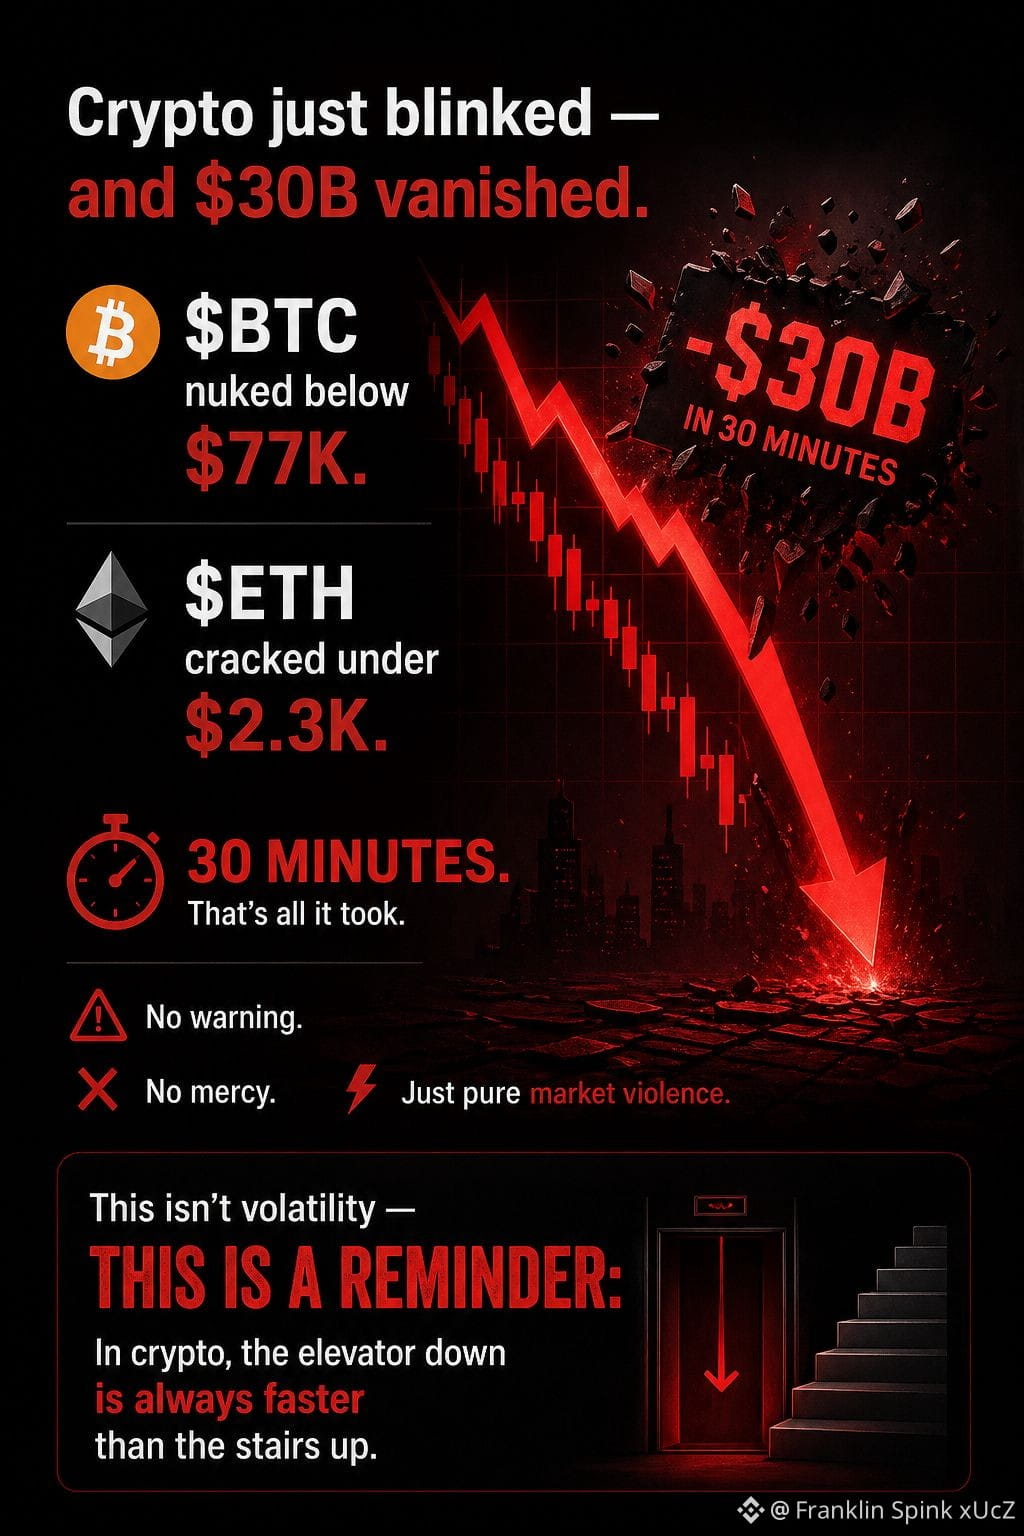
💥 Crypto Just Flashed Risk-Off — $30B Wiped in Minutes
• What Just Happened:
Bitcoin sliced through the $77K level with force, while Ethereum lost the $2.3K handle almost simultaneously. The move unfolded in under 30 minutes — a classic cascade where liquidity vanishes and price seeks the next bid aggressively.
• Market Read:
This wasn’t random volatility — it was a liquidity event. Stops got triggered, leverage got flushed, and thin order books accelerated the drop. When positioning is crowded, it only takes a spark to unwind billions.
• Reality Check:
Crypto doesn’t trend in straight lines. It compresses, builds leverage, then releases violently. The downside is always faster because fear is faster than greed.
• Professional Take:
Moments like this separate reactive traders from disciplined ones. You either:
Respect risk and survive
Or chase price and get liquidated
• Key Insight:
The market just reminded everyone of one rule:
Risk management isn’t optional — it’s survival.
• Execution Mindset:
Don’t trade the panic. Let structure rebuild. The real opportunities come after the flush, not during it.
💥 Crypto Just Flashed Risk-Off — $30B Wiped in Minutes
• What Just Happened:
Bitcoin sliced through the $77K level with force, while Ethereum lost the $2.3K handle almost simultaneously. The move unfolded in under 30 minutes — a classic cascade where liquidity vanishes and price seeks the next bid aggressively.
• Market Read:
This wasn’t random volatility — it was a liquidity event. Stops got triggered, leverage got flushed, and thin order books accelerated the drop. When positioning is crowded, it only takes a spark to unwind billions.
• Reality Check:
Crypto doesn’t trend in straight lines. It compresses, builds leverage, then releases violently. The downside is always faster because fear is faster than greed.
• Professional Take:
Moments like this separate reactive traders from disciplined ones. You either:
Respect risk and survive
Or chase price and get liquidated
• Key Insight:
The market just reminded everyone of one rule:
Risk management isn’t optional — it’s survival.
• Execution Mindset:
Don’t trade the panic. Let structure rebuild. The real opportunities come after the flush, not during it.
• What Just Happened:
Bitcoin sliced through the $77K level with force, while Ethereum lost the $2.3K handle almost simultaneously. The move unfolded in under 30 minutes — a classic cascade where liquidity vanishes and price seeks the next bid aggressively.
• Market Read:
This wasn’t random volatility — it was a liquidity event. Stops got triggered, leverage got flushed, and thin order books accelerated the drop. When positioning is crowded, it only takes a spark to unwind billions.
• Reality Check:
Crypto doesn’t trend in straight lines. It compresses, builds leverage, then releases violently. The downside is always faster because fear is faster than greed.
• Professional Take:
Moments like this separate reactive traders from disciplined ones. You either:
Respect risk and survive
Or chase price and get liquidated
• Key Insight:
The market just reminded everyone of one rule:
Risk management isn’t optional — it’s survival.
• Execution Mindset:
Don’t trade the panic. Let structure rebuild. The real opportunities come after the flush, not during it.
48
·
--
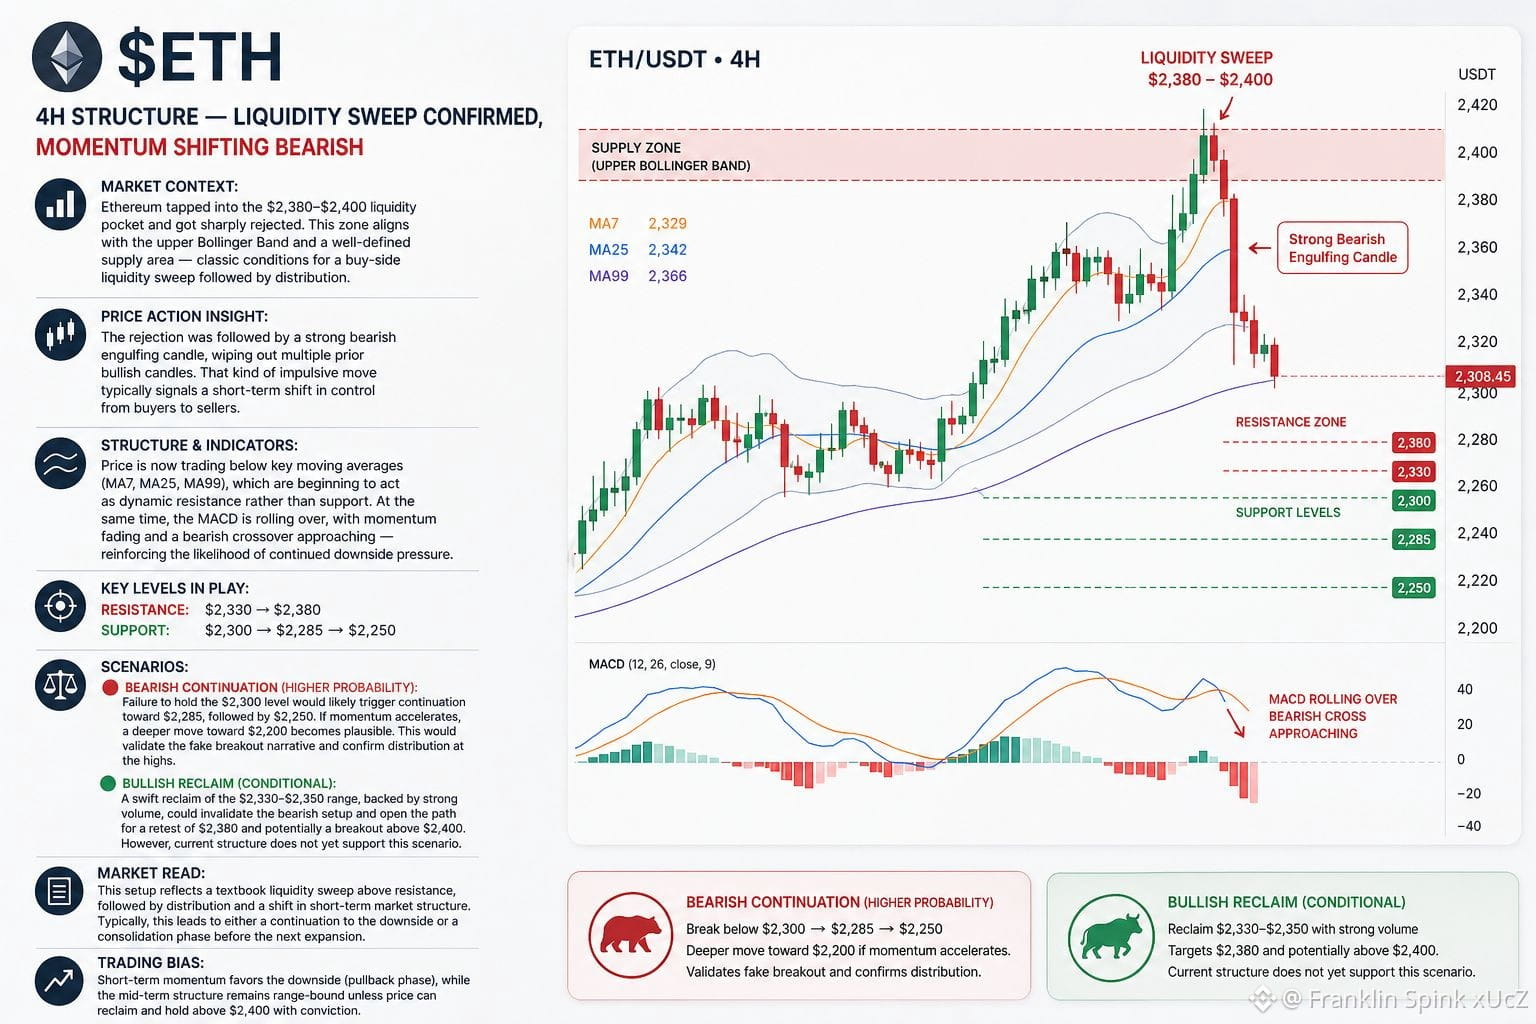
📊 $ETH 4H Structure — Liquidity Sweep Confirmed, Momentum Shifting Bearish
• Market Context: Ethereum tapped into the $2,380–$2,400 liquidity pocket and got sharply rejected. This zone aligns with the upper Bollinger Band and a well-defined supply area — classic conditions for a buy-side liquidity sweep followed by distribution.
• Price Action Insight: The rejection was followed by a strong bearish engulfing candle, wiping out multiple prior bullish candles. That kind of impulsive move typically signals a short-term shift in control from buyers to sellers.
• Structure & Indicators: Price is now trading below key moving averages (MA7, MA25, MA99), which are beginning to act as dynamic resistance rather than support. At the same time, the MACD is rolling over, with momentum fading and a bearish crossover approaching — reinforcing the likelihood of continued downside pressure.
• Key Levels in Play:
Resistance: $2,330 → $2,380
Support: $2,300 → $2,285 → $2,250
• Scenarios:
🔴 Bearish Continuation (Higher Probability):
Failure to hold the $2,300 level would likely trigger continuation toward $2,285, followed by $2,250. If momentum accelerates, a deeper move toward $2,200 becomes plausible. This would validate the fake breakout narrative and confirm distribution at the highs.
🟢 Bullish Reclaim (Conditional):
A swift reclaim of the $2,330–$2,350 range, backed by strong volume, could invalidate the bearish setup and open the path for a retest of $2,380 and potentially a breakout above $2,400. However, current structure does not yet support this scenario.
• Market Read:
This setup reflects a textbook liquidity sweep above resistance, followed by distribution and a shift in short-term market structure. Typically, this leads to either a continuation to the downside or a consolidation phase before the next expansion.
• Trading Bias:
Short-term momentum favors the downside (pullback phase), while the mid-term structure remains range-bound unless price can reclaim and hold above $2,400 with conviction.
📊 $ETH 4H Structure — Liquidity Sweep Confirmed, Momentum Shifting Bearish
• Market Context: Ethereum tapped into the $2,380–$2,400 liquidity pocket and got sharply rejected. This zone aligns with the upper Bollinger Band and a well-defined supply area — classic conditions for a buy-side liquidity sweep followed by distribution.
• Price Action Insight: The rejection was followed by a strong bearish engulfing candle, wiping out multiple prior bullish candles. That kind of impulsive move typically signals a short-term shift in control from buyers to sellers.
• Structure & Indicators: Price is now trading below key moving averages (MA7, MA25, MA99), which are beginning to act as dynamic resistance rather than support. At the same time, the MACD is rolling over, with momentum fading and a bearish crossover approaching — reinforcing the likelihood of continued downside pressure.
• Key Levels in Play:
Resistance: $2,330 → $2,380
Support: $2,300 → $2,285 → $2,250
• Scenarios:
🔴 Bearish Continuation (Higher Probability):
Failure to hold the $2,300 level would likely trigger continuation toward $2,285, followed by $2,250. If momentum accelerates, a deeper move toward $2,200 becomes plausible. This would validate the fake breakout narrative and confirm distribution at the highs.
🟢 Bullish Reclaim (Conditional):
A swift reclaim of the $2,330–$2,350 range, backed by strong volume, could invalidate the bearish setup and open the path for a retest of $2,380 and potentially a breakout above $2,400. However, current structure does not yet support this scenario.
• Market Read:
This setup reflects a textbook liquidity sweep above resistance, followed by distribution and a shift in short-term market structure. Typically, this leads to either a continuation to the downside or a consolidation phase before the next expansion.
• Trading Bias:
Short-term momentum favors the downside (pullback phase), while the mid-term structure remains range-bound unless price can reclaim and hold above $2,400 with conviction.
• Market Context: Ethereum tapped into the $2,380–$2,400 liquidity pocket and got sharply rejected. This zone aligns with the upper Bollinger Band and a well-defined supply area — classic conditions for a buy-side liquidity sweep followed by distribution.
• Price Action Insight: The rejection was followed by a strong bearish engulfing candle, wiping out multiple prior bullish candles. That kind of impulsive move typically signals a short-term shift in control from buyers to sellers.
• Structure & Indicators: Price is now trading below key moving averages (MA7, MA25, MA99), which are beginning to act as dynamic resistance rather than support. At the same time, the MACD is rolling over, with momentum fading and a bearish crossover approaching — reinforcing the likelihood of continued downside pressure.
• Key Levels in Play:
Resistance: $2,330 → $2,380
Support: $2,300 → $2,285 → $2,250
• Scenarios:
🔴 Bearish Continuation (Higher Probability):
Failure to hold the $2,300 level would likely trigger continuation toward $2,285, followed by $2,250. If momentum accelerates, a deeper move toward $2,200 becomes plausible. This would validate the fake breakout narrative and confirm distribution at the highs.
🟢 Bullish Reclaim (Conditional):
A swift reclaim of the $2,330–$2,350 range, backed by strong volume, could invalidate the bearish setup and open the path for a retest of $2,380 and potentially a breakout above $2,400. However, current structure does not yet support this scenario.
• Market Read:
This setup reflects a textbook liquidity sweep above resistance, followed by distribution and a shift in short-term market structure. Typically, this leads to either a continuation to the downside or a consolidation phase before the next expansion.
• Trading Bias:
Short-term momentum favors the downside (pullback phase), while the mid-term structure remains range-bound unless price can reclaim and hold above $2,400 with conviction.
60
·
--
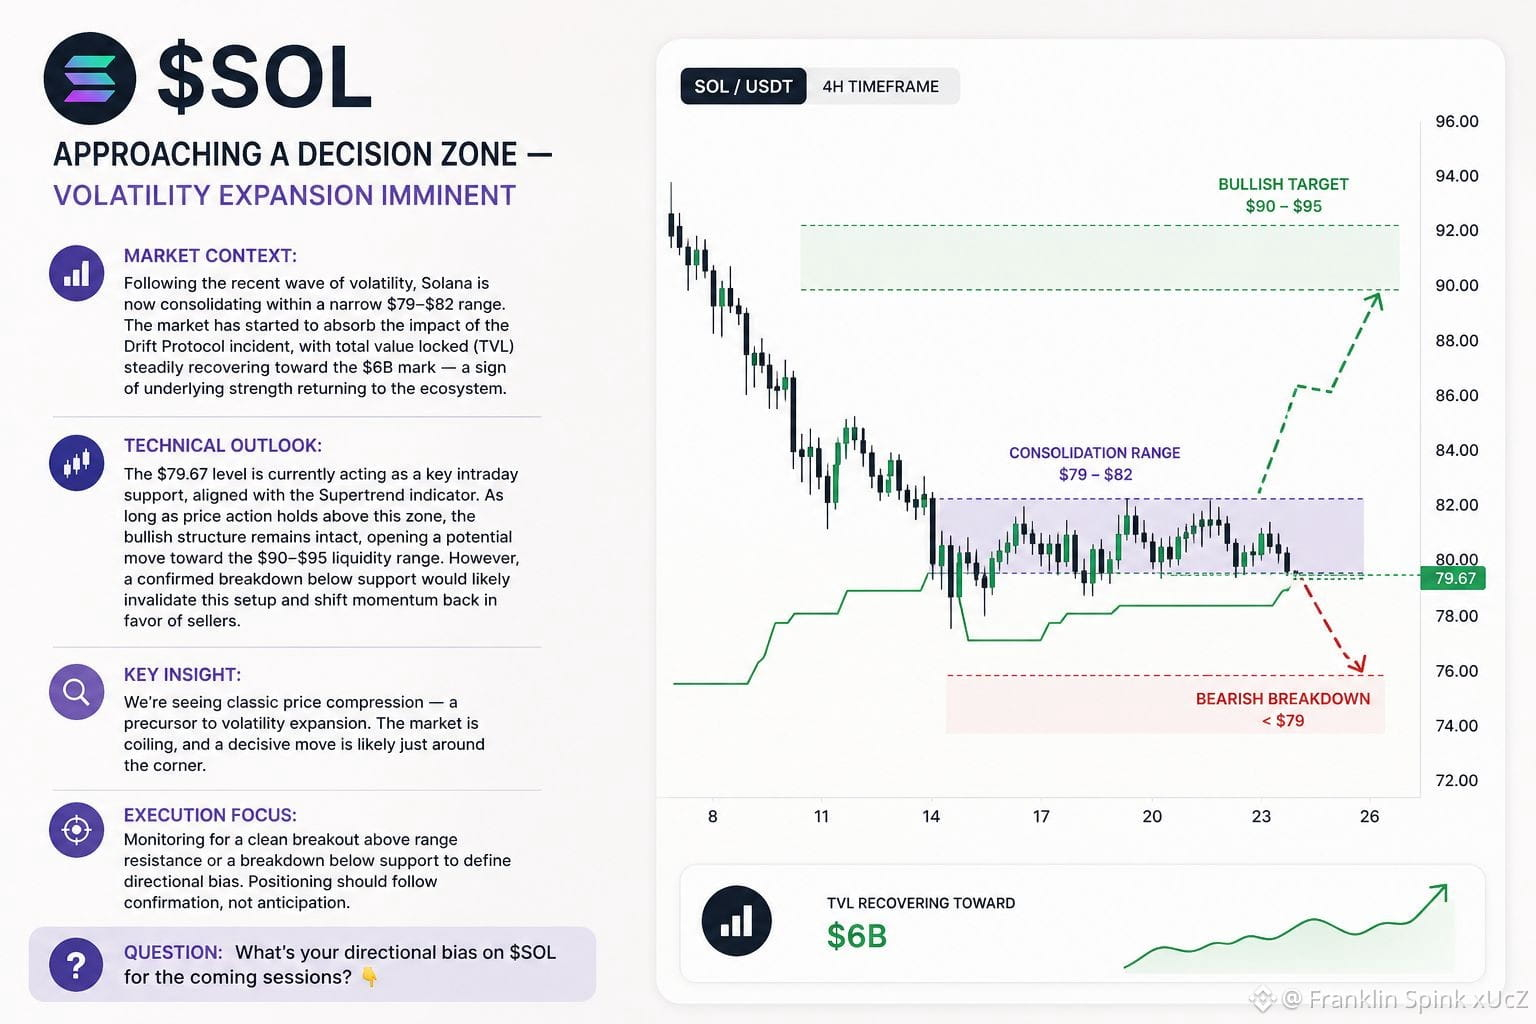
📊 $SOL Approaching a Decision Zone — Volatility Expansion Imminent
• Market Context: Following the recent wave of volatility, Solana is now consolidating within a narrow $79–$82 range. The market has started to absorb the impact of the Drift Protocol incident, with total value locked (TVL) steadily recovering toward the $6B mark — a sign of underlying strength returning to the ecosystem.
• Technical Outlook: The $79.67 level is currently acting as a key intraday support, aligned with the Supertrend indicator. As long as price action holds above this zone, the bullish structure remains intact, opening a potential move toward the $90–$95 liquidity range. However, a confirmed breakdown below support would likely invalidate this setup and shift momentum back in favor of sellers.
• Key Insight: We’re seeing classic price compression — a precursor to volatility expansion. The market is coiling, and a decisive move is likely just around the corner.
• Execution Focus: Monitoring for a clean breakout above range resistance or a breakdown below support to define directional bias. Positioning should follow confirmation, not anticipation.
• Question: What’s your directional bias on $SOL for the coming sessions? 👇
📊 $SOL Approaching a Decision Zone — Volatility Expansion Imminent
• Market Context: Following the recent wave of volatility, Solana is now consolidating within a narrow $79–$82 range. The market has started to absorb the impact of the Drift Protocol incident, with total value locked (TVL) steadily recovering toward the $6B mark — a sign of underlying strength returning to the ecosystem.
• Technical Outlook: The $79.67 level is currently acting as a key intraday support, aligned with the Supertrend indicator. As long as price action holds above this zone, the bullish structure remains intact, opening a potential move toward the $90–$95 liquidity range. However, a confirmed breakdown below support would likely invalidate this setup and shift momentum back in favor of sellers.
• Key Insight: We’re seeing classic price compression — a precursor to volatility expansion. The market is coiling, and a decisive move is likely just around the corner.
• Execution Focus: Monitoring for a clean breakout above range resistance or a breakdown below support to define directional bias. Positioning should follow confirmation, not anticipation.
• Question: What’s your directional bias on $SOL for the coming sessions? 👇
• Market Context: Following the recent wave of volatility, Solana is now consolidating within a narrow $79–$82 range. The market has started to absorb the impact of the Drift Protocol incident, with total value locked (TVL) steadily recovering toward the $6B mark — a sign of underlying strength returning to the ecosystem.
• Technical Outlook: The $79.67 level is currently acting as a key intraday support, aligned with the Supertrend indicator. As long as price action holds above this zone, the bullish structure remains intact, opening a potential move toward the $90–$95 liquidity range. However, a confirmed breakdown below support would likely invalidate this setup and shift momentum back in favor of sellers.
• Key Insight: We’re seeing classic price compression — a precursor to volatility expansion. The market is coiling, and a decisive move is likely just around the corner.
• Execution Focus: Monitoring for a clean breakout above range resistance or a breakdown below support to define directional bias. Positioning should follow confirmation, not anticipation.
• Question: What’s your directional bias on $SOL for the coming sessions? 👇
85
·
--
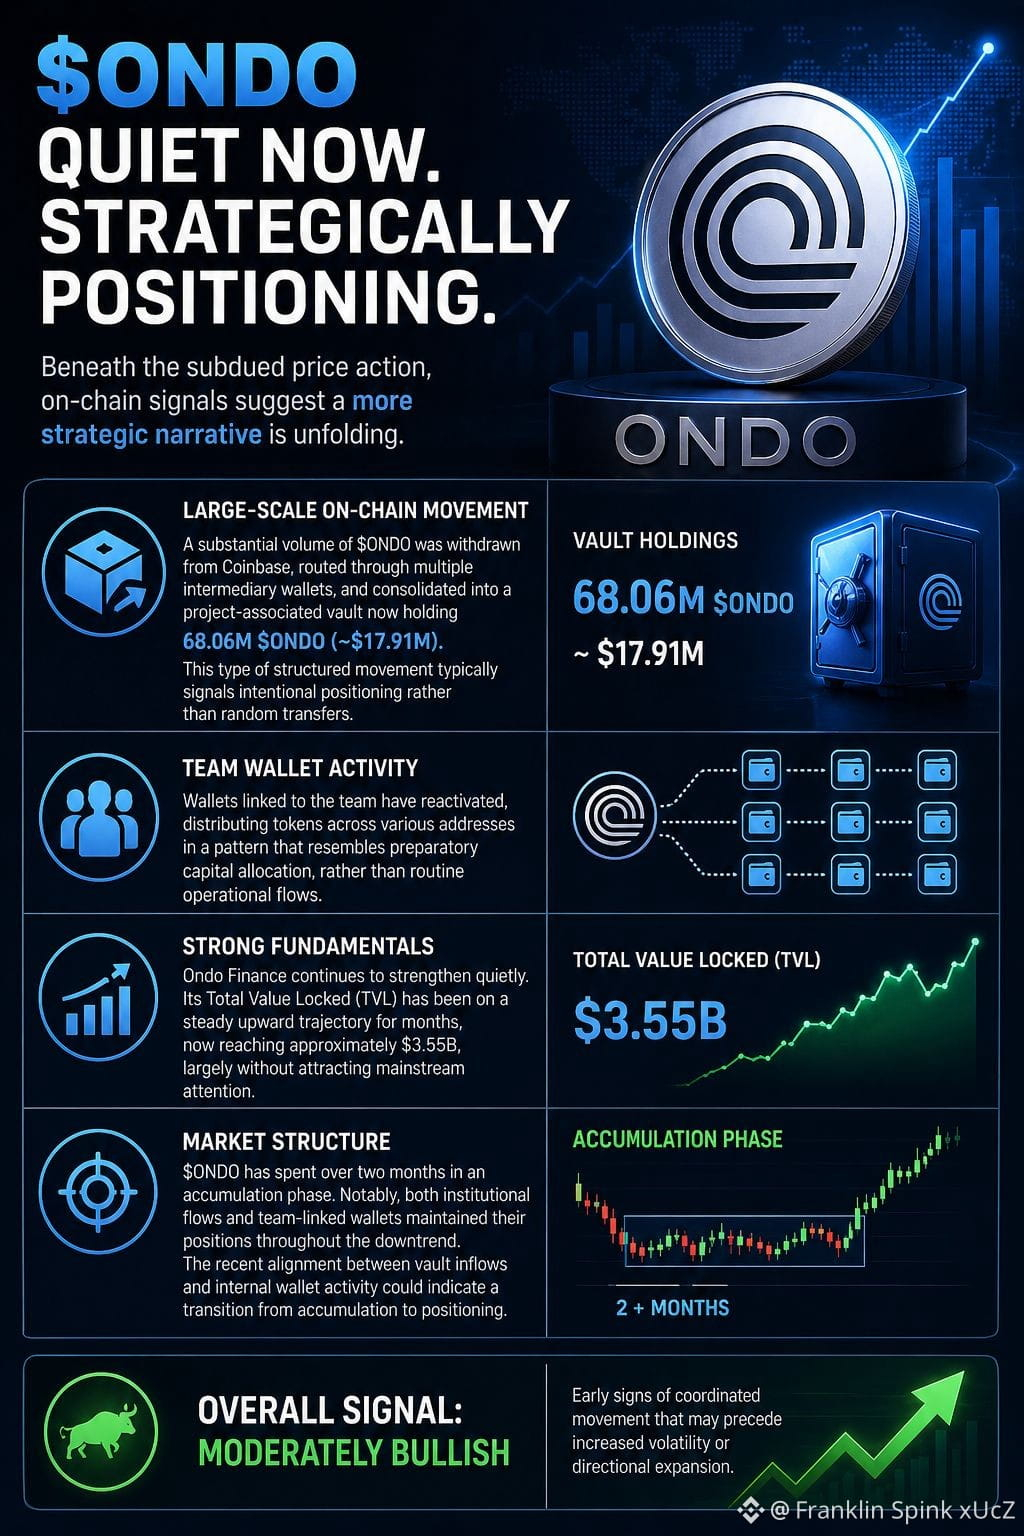
$ONDO’s price action may appear subdued on the surface, but on-chain activity suggests a more strategic narrative unfolding beneath.
Several hours ago, a substantial volume of tokens was withdrawn from Coinbase, routed through multiple intermediary wallets, and ultimately consolidated into a project-associated vault now holding approximately 68.06M $ONDO (~$17.91M). This type of structured movement typically signals intentional positioning rather than random transfers.
Concurrently, wallets linked to the team have reactivated, distributing tokens across various addresses in a pattern that resembles preparatory capital allocation, rather than routine operational flows.
On the fundamentals side, Ondo Finance continues to strengthen quietly. Its Total Value Locked (TVL) has been on a steady upward trajectory for months, now reaching approximately $3.55B, largely without attracting mainstream attention.
From a market structure perspective, $ONDO has spent over two months in an accumulation phase. Notably, both institutional flows and team-linked wallets maintained their positions throughout the downtrend. The recent alignment between vault inflows and internal wallet activity could indicate a transition from accumulation to positioning.
Overall signal: moderately bullish, with early signs of coordinated movement that may precede increased volatility or directional expansion.
#ONDO #Crypto #DeFi #OnChainAnalysis #SmartMoney
$ONDO’s price action may appear subdued on the surface, but on-chain activity suggests a more strategic narrative unfolding beneath.
Several hours ago, a substantial volume of tokens was withdrawn from Coinbase, routed through multiple intermediary wallets, and ultimately consolidated into a project-associated vault now holding approximately 68.06M $ONDO (~$17.91M). This type of structured movement typically signals intentional positioning rather than random transfers.
Concurrently, wallets linked to the team have reactivated, distributing tokens across various addresses in a pattern that resembles preparatory capital allocation, rather than routine operational flows.
On the fundamentals side, Ondo Finance continues to strengthen quietly. Its Total Value Locked (TVL) has been on a steady upward trajectory for months, now reaching approximately $3.55B, largely without attracting mainstream attention.
From a market structure perspective, $ONDO has spent over two months in an accumulation phase. Notably, both institutional flows and team-linked wallets maintained their positions throughout the downtrend. The recent alignment between vault inflows and internal wallet activity could indicate a transition from accumulation to positioning.
Overall signal: moderately bullish, with early signs of coordinated movement that may precede increased volatility or directional expansion.
#ONDO #Crypto #DeFi #OnChainAnalysis #SmartMoney
Several hours ago, a substantial volume of tokens was withdrawn from Coinbase, routed through multiple intermediary wallets, and ultimately consolidated into a project-associated vault now holding approximately 68.06M $ONDO (~$17.91M). This type of structured movement typically signals intentional positioning rather than random transfers.
Concurrently, wallets linked to the team have reactivated, distributing tokens across various addresses in a pattern that resembles preparatory capital allocation, rather than routine operational flows.
On the fundamentals side, Ondo Finance continues to strengthen quietly. Its Total Value Locked (TVL) has been on a steady upward trajectory for months, now reaching approximately $3.55B, largely without attracting mainstream attention.
From a market structure perspective, $ONDO has spent over two months in an accumulation phase. Notably, both institutional flows and team-linked wallets maintained their positions throughout the downtrend. The recent alignment between vault inflows and internal wallet activity could indicate a transition from accumulation to positioning.
Overall signal: moderately bullish, with early signs of coordinated movement that may precede increased volatility or directional expansion.
#ONDO #Crypto #DeFi #OnChainAnalysis #SmartMoney
73
·
--
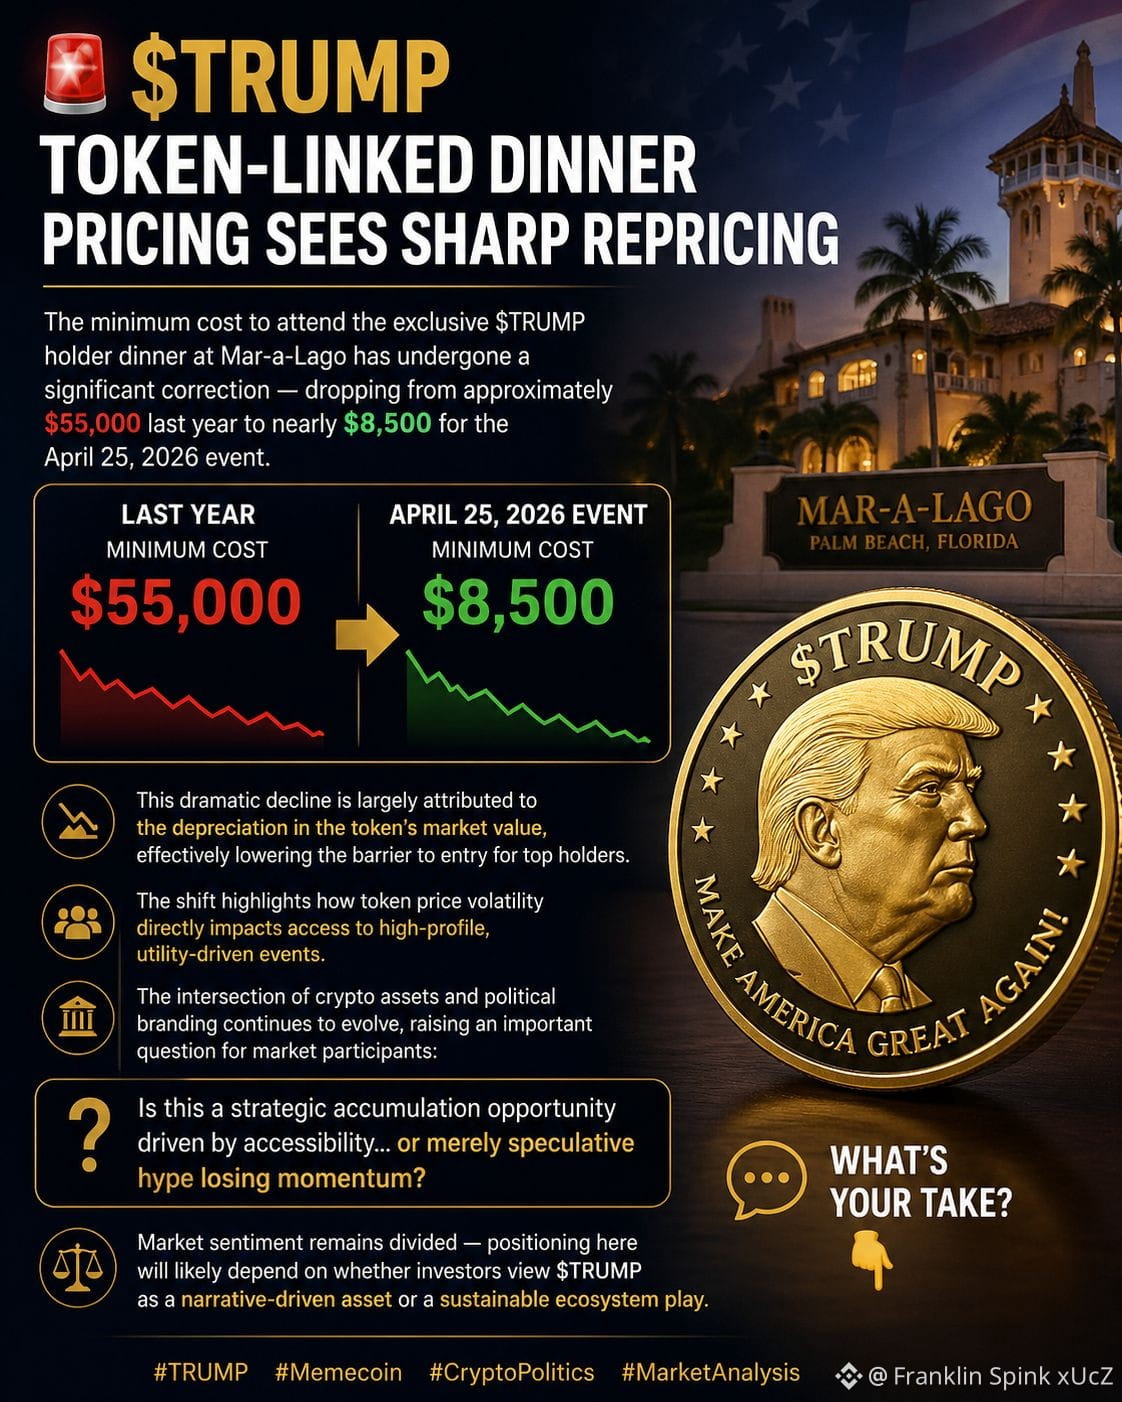
🚨 $TRUMP Token-Linked Dinner Pricing Sees Sharp Repricing
The minimum cost to attend the exclusive $TRUMP holder dinner at Mar-a-Lago has undergone a significant correction — dropping from approximately $55,000 last year to nearly $8,500 for the April 25, 2026 event.
This dramatic decline is largely attributed to the depreciation in the token’s market value, effectively lowering the barrier to entry for top holders. The shift highlights how token price volatility directly impacts access to high-profile, utility-driven events.
The intersection of crypto assets and political branding continues to evolve, raising an important question for market participants:
Is this a strategic accumulation opportunity driven by accessibility… or merely speculative hype losing momentum?
Market sentiment remains divided — positioning here will likely depend on whether investors view $TRUMP as a narrative-driven asset or a sustainable ecosystem play.
What’s your take? 👇
#TRUMP #Memecoin #CryptoPolitic #MarketAnalysis
🚨 $TRUMP Token-Linked Dinner Pricing Sees Sharp Repricing
The minimum cost to attend the exclusive $TRUMP holder dinner at Mar-a-Lago has undergone a significant correction — dropping from approximately $55,000 last year to nearly $8,500 for the April 25, 2026 event.
This dramatic decline is largely attributed to the depreciation in the token’s market value, effectively lowering the barrier to entry for top holders. The shift highlights how token price volatility directly impacts access to high-profile, utility-driven events.
The intersection of crypto assets and political branding continues to evolve, raising an important question for market participants:
Is this a strategic accumulation opportunity driven by accessibility… or merely speculative hype losing momentum?
Market sentiment remains divided — positioning here will likely depend on whether investors view $TRUMP as a narrative-driven asset or a sustainable ecosystem play.
What’s your take? 👇
#TRUMP #Memecoin #CryptoPolitic #MarketAnalysis
The minimum cost to attend the exclusive $TRUMP holder dinner at Mar-a-Lago has undergone a significant correction — dropping from approximately $55,000 last year to nearly $8,500 for the April 25, 2026 event.
This dramatic decline is largely attributed to the depreciation in the token’s market value, effectively lowering the barrier to entry for top holders. The shift highlights how token price volatility directly impacts access to high-profile, utility-driven events.
The intersection of crypto assets and political branding continues to evolve, raising an important question for market participants:
Is this a strategic accumulation opportunity driven by accessibility… or merely speculative hype losing momentum?
Market sentiment remains divided — positioning here will likely depend on whether investors view $TRUMP as a narrative-driven asset or a sustainable ecosystem play.
What’s your take? 👇
#TRUMP #Memecoin #CryptoPolitic #MarketAnalysis
78
·
--
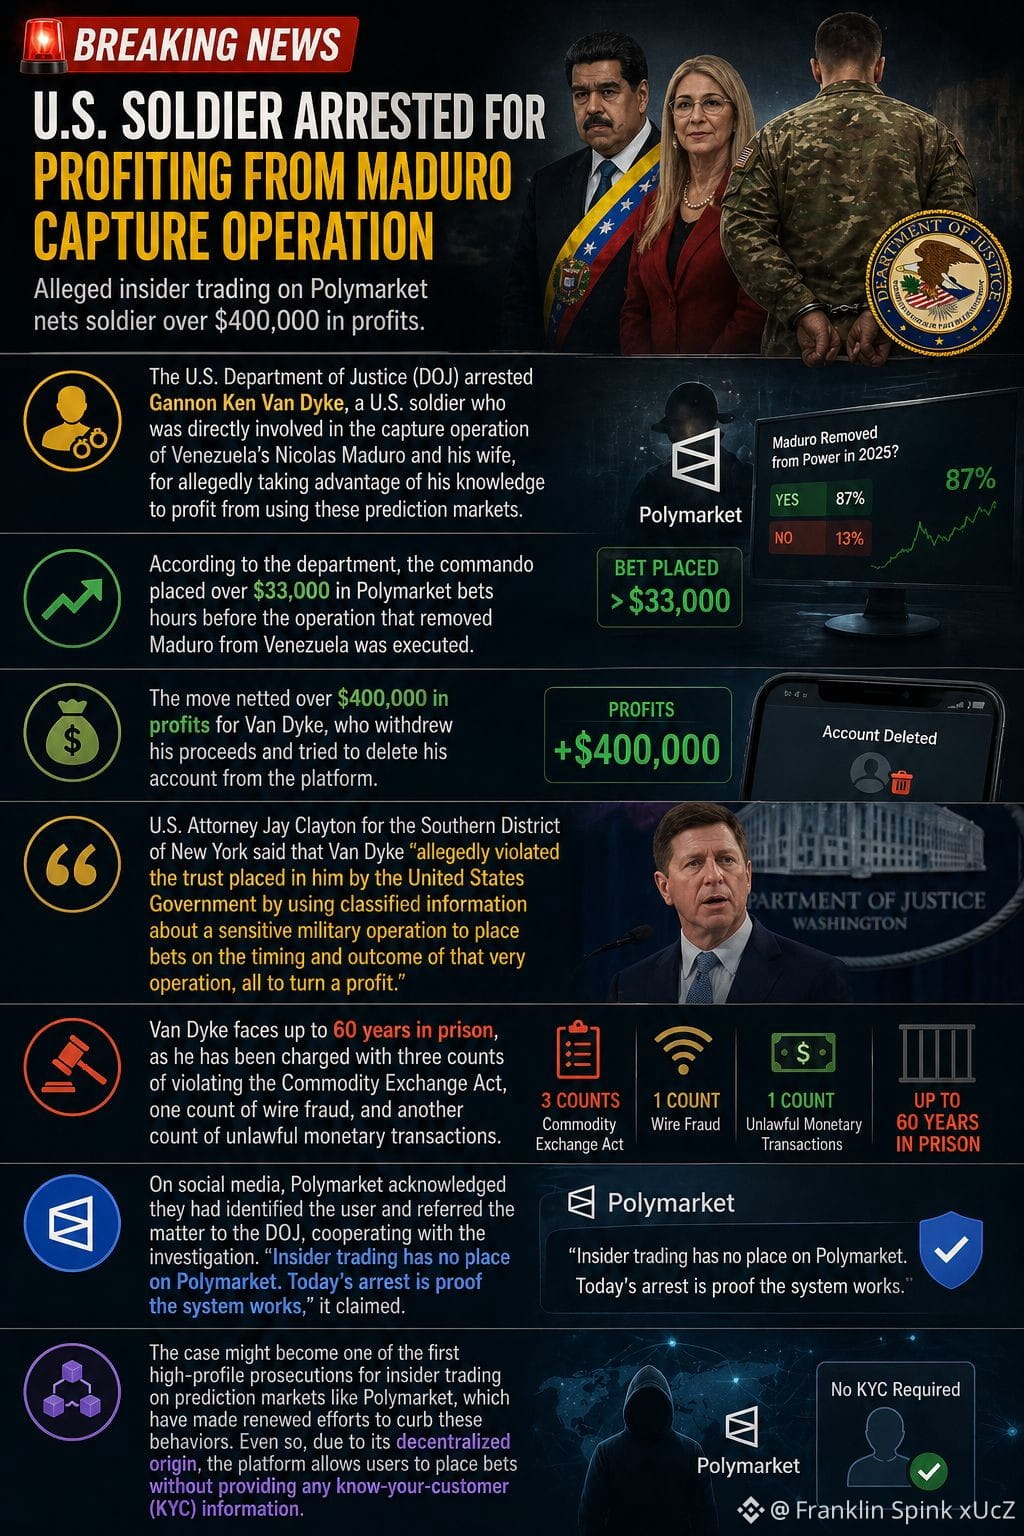
🚨 BREAKING — Market Integrity Shock
The U.S. Department of Justice has charged Gannon Ken Van Dyke, a U.S. Special Forces soldier, for allegedly exploiting classified military intelligence to generate profits on the prediction market Polymarket.
According to prosecutors, Van Dyke—who was directly involved in the operation targeting Nicolás Maduro—placed over $33,000 in bets shortly before the mission was executed. These trades, based on non-public information, resulted in profits exceeding $400,000.
After cashing out, he allegedly attempted to cover his tracks by withdrawing funds and requesting account deletion—moves that ultimately triggered scrutiny. Authorities later stepped in, and the platform itself flagged the suspicious activity and cooperated with investigators.
📊 What This Means for Markets
This case is more than just a legal story—it’s a turning point for prediction markets and crypto-adjacent platforms:
First major insider trading case tied to a decentralized-style prediction market
Reinforces that “on-chain ≠ unregulated”
Highlights the growing reach of regulators like the DOJ and CFTC into emerging financial ecosystems
Exposes a structural weakness: lack of strict KYC can attract abuse—but not immunity
⚖️ Legal Fallout
Van Dyke now faces multiple serious charges, including:
Fraud and unlawful use of confidential information
Violations of the Commodity Exchange Act
Wire fraud and financial misconduct
If convicted, he could face decades in prison (up to ~60 years).
🧠 Pro Insight
This situation delivers a clear message to traders and investors:
Information asymmetry is still the strongest edge in any market
But exploiting illegal or classified information = catastrophic risk
Platforms may appear decentralized, but enforcement is increasingly real-time and coordinated
Smart money doesn’t chase unfair advantages—it builds repeatable, compliant strategies.
🚨 BREAKING — Market Integrity Shock
The U.S. Department of Justice has charged Gannon Ken Van Dyke, a U.S. Special Forces soldier, for allegedly exploiting classified military intelligence to generate profits on the prediction market Polymarket.
According to prosecutors, Van Dyke—who was directly involved in the operation targeting Nicolás Maduro—placed over $33,000 in bets shortly before the mission was executed. These trades, based on non-public information, resulted in profits exceeding $400,000.
After cashing out, he allegedly attempted to cover his tracks by withdrawing funds and requesting account deletion—moves that ultimately triggered scrutiny. Authorities later stepped in, and the platform itself flagged the suspicious activity and cooperated with investigators.
📊 What This Means for Markets
This case is more than just a legal story—it’s a turning point for prediction markets and crypto-adjacent platforms:
First major insider trading case tied to a decentralized-style prediction market
Reinforces that “on-chain ≠ unregulated”
Highlights the growing reach of regulators like the DOJ and CFTC into emerging financial ecosystems
Exposes a structural weakness: lack of strict KYC can attract abuse—but not immunity
⚖️ Legal Fallout
Van Dyke now faces multiple serious charges, including:
Fraud and unlawful use of confidential information
Violations of the Commodity Exchange Act
Wire fraud and financial misconduct
If convicted, he could face decades in prison (up to ~60 years).
🧠 Pro Insight
This situation delivers a clear message to traders and investors:
Information asymmetry is still the strongest edge in any market
But exploiting illegal or classified information = catastrophic risk
Platforms may appear decentralized, but enforcement is increasingly real-time and coordinated
Smart money doesn’t chase unfair advantages—it builds repeatable, compliant strategies.
The U.S. Department of Justice has charged Gannon Ken Van Dyke, a U.S. Special Forces soldier, for allegedly exploiting classified military intelligence to generate profits on the prediction market Polymarket.
According to prosecutors, Van Dyke—who was directly involved in the operation targeting Nicolás Maduro—placed over $33,000 in bets shortly before the mission was executed. These trades, based on non-public information, resulted in profits exceeding $400,000.
After cashing out, he allegedly attempted to cover his tracks by withdrawing funds and requesting account deletion—moves that ultimately triggered scrutiny. Authorities later stepped in, and the platform itself flagged the suspicious activity and cooperated with investigators.
📊 What This Means for Markets
This case is more than just a legal story—it’s a turning point for prediction markets and crypto-adjacent platforms:
First major insider trading case tied to a decentralized-style prediction market
Reinforces that “on-chain ≠ unregulated”
Highlights the growing reach of regulators like the DOJ and CFTC into emerging financial ecosystems
Exposes a structural weakness: lack of strict KYC can attract abuse—but not immunity
⚖️ Legal Fallout
Van Dyke now faces multiple serious charges, including:
Fraud and unlawful use of confidential information
Violations of the Commodity Exchange Act
Wire fraud and financial misconduct
If convicted, he could face decades in prison (up to ~60 years).
🧠 Pro Insight
This situation delivers a clear message to traders and investors:
Information asymmetry is still the strongest edge in any market
But exploiting illegal or classified information = catastrophic risk
Platforms may appear decentralized, but enforcement is increasingly real-time and coordinated
Smart money doesn’t chase unfair advantages—it builds repeatable, compliant strategies.
61
·
--
🚨 BREAKING
Tether has frozen $344 million in USDT following a request from U.S. law enforcement authorities.
This development highlights a critical reality: despite the decentralized narrative of crypto, centralized stablecoins remain subject to regulatory control and compliance measures. Actions like these reinforce the growing intersection between blockchain infrastructure and traditional financial oversight.
For traders and investors, this is more than just news—it’s a signal. Regulatory influence is no longer a distant factor; it’s actively shaping market dynamics, risk exposure, and asset security.
Smart capital adapts. Stay informed, manage counterparty risk, and understand the level of control behind the assets you hold.
#breakingnews #Tether #USDT #TetherUpdate
🚨 BREAKING
Tether has frozen $344 million in USDT following a request from U.S. law enforcement authorities.
This development highlights a critical reality: despite the decentralized narrative of crypto, centralized stablecoins remain subject to regulatory control and compliance measures. Actions like these reinforce the growing intersection between blockchain infrastructure and traditional financial oversight.
For traders and investors, this is more than just news—it’s a signal. Regulatory influence is no longer a distant factor; it’s actively shaping market dynamics, risk exposure, and asset security.
Smart capital adapts. Stay informed, manage counterparty risk, and understand the level of control behind the assets you hold.
#breakingnews #Tether #USDT #TetherUpdate
Tether has frozen $344 million in USDT following a request from U.S. law enforcement authorities.
This development highlights a critical reality: despite the decentralized narrative of crypto, centralized stablecoins remain subject to regulatory control and compliance measures. Actions like these reinforce the growing intersection between blockchain infrastructure and traditional financial oversight.
For traders and investors, this is more than just news—it’s a signal. Regulatory influence is no longer a distant factor; it’s actively shaping market dynamics, risk exposure, and asset security.
Smart capital adapts. Stay informed, manage counterparty risk, and understand the level of control behind the assets you hold.
#breakingnews #Tether #USDT #TetherUpdate
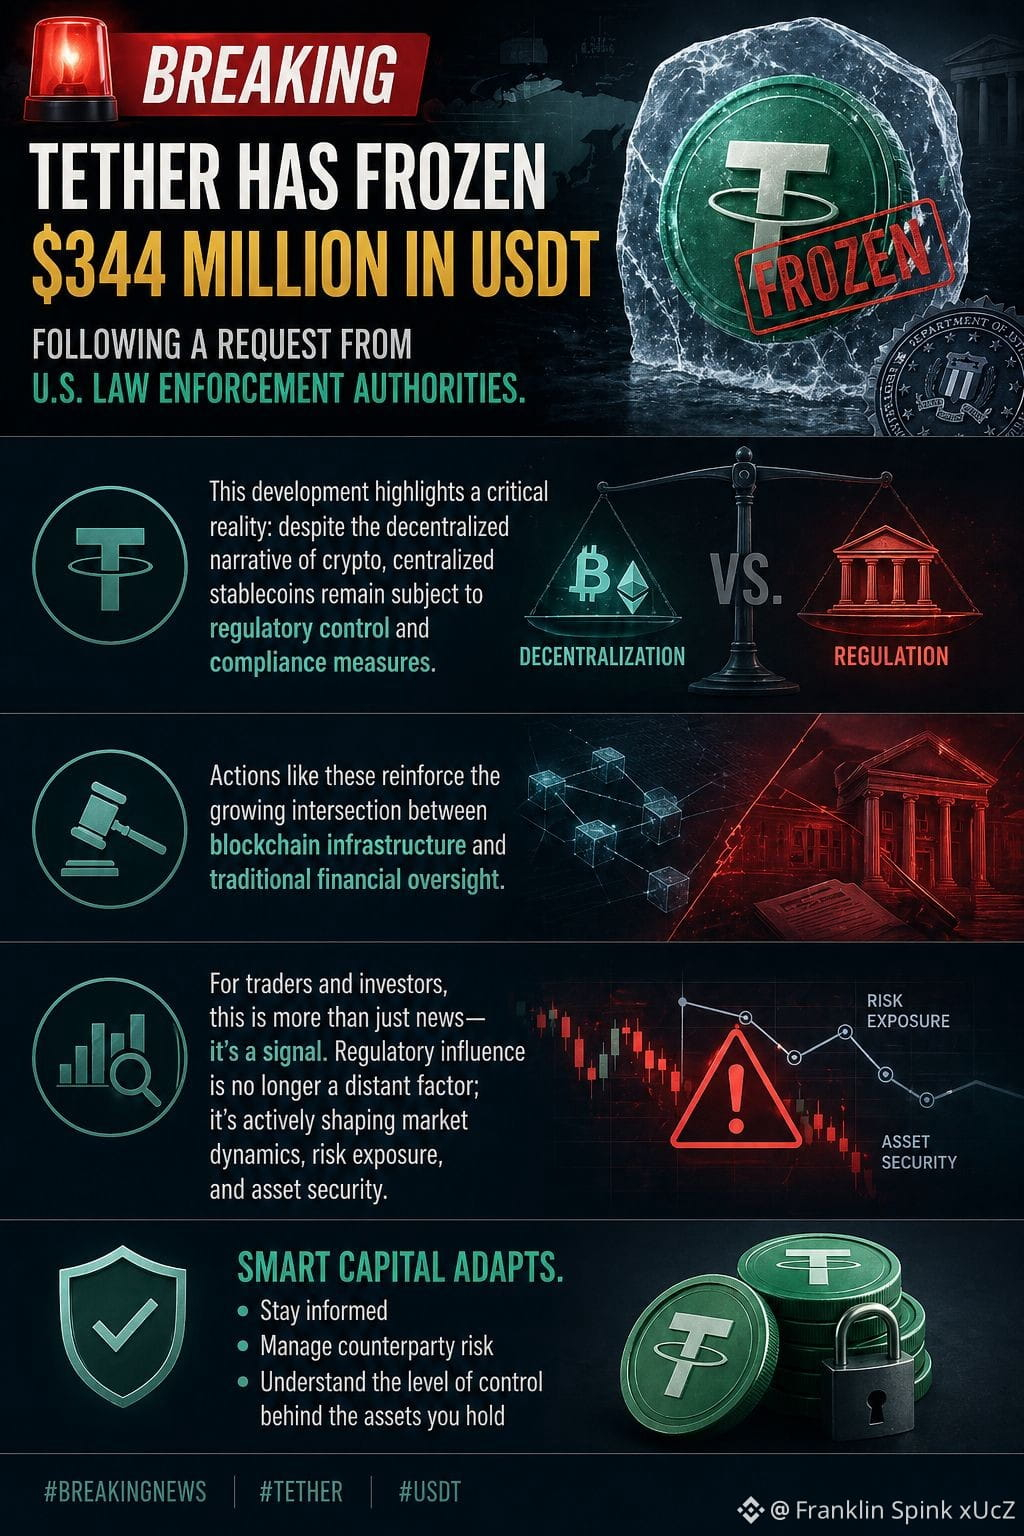
75
Log in to explore more content
Join global crypto users on Binance Square
⚡️ Get latest and useful information about crypto.
💬 Trusted by the world’s largest crypto exchange.
👍 Discover real insights from verified creators.
Email / Phone number
Trending Topics
SaylorHintsStrategyBitcoinBuy
2.3M views
12,351 Discussing
#saylorhintsstrategybitcoinbuy
🚨 SAYLOR JUST DROPPED THE SUNDAY $BTC HINT 👀
Michael Saylor reposted his usual Bitcoin chart again.
If history repeats, those orange dots could be signaling another Strategy BTC purchase is coming. 🟠
And when Saylor buys, the market watches.
🐋 Massive BTC holdings
💰 Continued accumulation strategy
📈 Potential short-term sentiment boost
But here’s the key:
A repost is NOT confirmation of a purchase.
The real signal comes when Strategy officially reports the transaction.
🔥 If another major BTC buy is announced, will the market react this time?
Or is Saylor’s accumulation becoming so routine that traders barely react anymore?
👀 Watch the announcement.
$MSTRB
#BTC #strategy #crypto #BitcoinNews
sdatta
·5 Likes
·5.9k views
BOJRaisesRatesTo31YearHigh
244,924 views
3,236 Discussing
BuffettStepsDownAsBerkshireChairman
118,279 views
1,734 Discussing