
Bitcoinworld
69k Posts

Bitcoinworld
 Square Verified+
Report
Block User
BitcoinWorld is a leading media publication bringing the latest happenings in the Blockchain and Crypto Space.

#BinanceTurns7

Excellence Award (Market Buzz)

Creator of the Year
2 Following
100.6K+ Followers
287.3K+ Liked
4 Badges
Posts
All
Videos
Live
·
--
Article
Forex Expo Dubai to Take Place As Scheduled on 22–23 September 2026BitcoinWorldForex Expo Dubai to Take Place as Scheduled on 22–23 September 2026
Ninth edition proceeds as planned, bringing the industry together as the sector moves through a period of rapid platform and technology change.
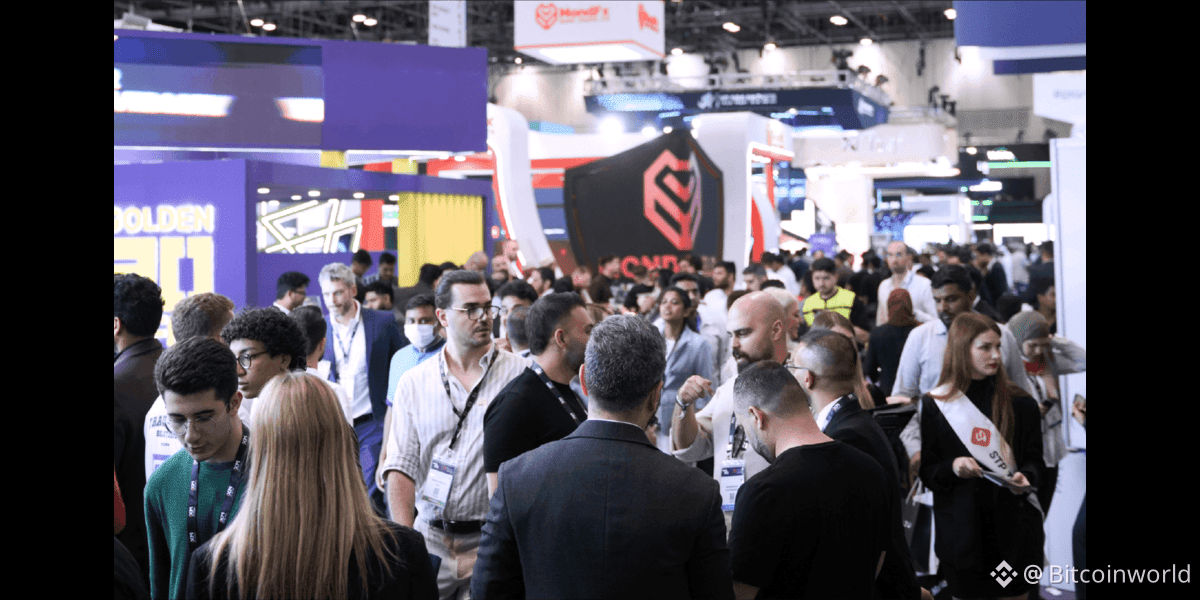
DUBAI, United Arab Emirates — Dubai’s business calendar picks up pace after the summer lull, and this September, the global trading and fintech community comes together at Forex Expo Dubai, taking place 22-23 September 2026 at Dubai World Trade Centre, Halls 1-5.
What Attendees Can Expect
Across the five halls, the event brings together more than 250 exhibitors and 150 speakers, traders, introducing brokers, investors, brokerages, liquidity providers, payment providers and trading-technology firms — building on an edition that already holds a Guinness World Record for attendance at a forex exhibition.
“Preparations for this year’s event are on track, and the dates and venue remain unchanged,” said Niyaz Mohammed, Commercial Director at HQMENA. “Sponsors and exhibitors who’ve been with us before are back this year, and we’re seeing new brands join alongside them. Everything is moving as scheduled, and we’re excited for what this edition has in store.”
Beyond the exhibition floor, conference sessions will cover affiliate models built around client quality over deposit volume, portfolios designed to hold up across shifting policy and commodity regimes, and what trader behaviour data reveals about platform and risk design.
An Expo Built for Different Goals
The event introduces dedicated experiences for Verified Traders, Introducing Brokers and Affiliates, helping exhibitors connect with audiences based on their role and interests. Eligible attendees also have a shot at winning a share of 160 grams of 24-karat gold in the Gold Lucky Draw.* Private meeting zones, live product demonstrations and side events before and after the expo extend the experience further.
*T&Cs apply.
Dubai’s business and events calendar continues to run through September without disruption, and exhibitors, sponsors and attendees will be kept updated through official channels in the lead-up to the event.
About Forex Expo Dubai
Forex Expo Dubai is one of the region’s leading gatherings for the global online trading and fintech industry, bringing together brokerages, fintech innovators, institutional traders, investors, payment solution providers, IBs, affiliates and online trading technology companies under one roof. The expo serves as a platform for industry dialogue, business networking, technology showcases, and market-focused conversations shaping the future of modern finance.
This post Forex Expo Dubai to Take Place as Scheduled on 22–23 September 2026 first appeared on BitcoinWorld.
Forex Expo Dubai to Take Place As Scheduled on 22–23 September 2026
BitcoinWorldForex Expo Dubai to Take Place as Scheduled on 22–23 September 2026
Ninth edition proceeds as planned, bringing the industry together as the sector moves through a period of rapid platform and technology change.
DUBAI, United Arab Emirates — Dubai’s business calendar picks up pace after the summer lull, and this September, the global trading and fintech community comes together at Forex Expo Dubai, taking place 22-23 September 2026 at Dubai World Trade Centre, Halls 1-5.
What Attendees Can Expect
Across the five halls, the event brings together more than 250 exhibitors and 150 speakers, traders, introducing brokers, investors, brokerages, liquidity providers, payment providers and trading-technology firms — building on an edition that already holds a Guinness World Record for attendance at a forex exhibition.
“Preparations for this year’s event are on track, and the dates and venue remain unchanged,” said Niyaz Mohammed, Commercial Director at HQMENA. “Sponsors and exhibitors who’ve been with us before are back this year, and we’re seeing new brands join alongside them. Everything is moving as scheduled, and we’re excited for what this edition has in store.”
Beyond the exhibition floor, conference sessions will cover affiliate models built around client quality over deposit volume, portfolios designed to hold up across shifting policy and commodity regimes, and what trader behaviour data reveals about platform and risk design.
An Expo Built for Different Goals
The event introduces dedicated experiences for Verified Traders, Introducing Brokers and Affiliates, helping exhibitors connect with audiences based on their role and interests. Eligible attendees also have a shot at winning a share of 160 grams of 24-karat gold in the Gold Lucky Draw.* Private meeting zones, live product demonstrations and side events before and after the expo extend the experience further.
*T&Cs apply.
Dubai’s business and events calendar continues to run through September without disruption, and exhibitors, sponsors and attendees will be kept updated through official channels in the lead-up to the event.
About Forex Expo Dubai
Forex Expo Dubai is one of the region’s leading gatherings for the global online trading and fintech industry, bringing together brokerages, fintech innovators, institutional traders, investors, payment solution providers, IBs, affiliates and online trading technology companies under one roof. The expo serves as a platform for industry dialogue, business networking, technology showcases, and market-focused conversations shaping the future of modern finance.
This post Forex Expo Dubai to Take Place as Scheduled on 22–23 September 2026 first appeared on BitcoinWorld.
Ninth edition proceeds as planned, bringing the industry together as the sector moves through a period of rapid platform and technology change.
DUBAI, United Arab Emirates — Dubai’s business calendar picks up pace after the summer lull, and this September, the global trading and fintech community comes together at Forex Expo Dubai, taking place 22-23 September 2026 at Dubai World Trade Centre, Halls 1-5.
What Attendees Can Expect
Across the five halls, the event brings together more than 250 exhibitors and 150 speakers, traders, introducing brokers, investors, brokerages, liquidity providers, payment providers and trading-technology firms — building on an edition that already holds a Guinness World Record for attendance at a forex exhibition.
“Preparations for this year’s event are on track, and the dates and venue remain unchanged,” said Niyaz Mohammed, Commercial Director at HQMENA. “Sponsors and exhibitors who’ve been with us before are back this year, and we’re seeing new brands join alongside them. Everything is moving as scheduled, and we’re excited for what this edition has in store.”
Beyond the exhibition floor, conference sessions will cover affiliate models built around client quality over deposit volume, portfolios designed to hold up across shifting policy and commodity regimes, and what trader behaviour data reveals about platform and risk design.
An Expo Built for Different Goals
The event introduces dedicated experiences for Verified Traders, Introducing Brokers and Affiliates, helping exhibitors connect with audiences based on their role and interests. Eligible attendees also have a shot at winning a share of 160 grams of 24-karat gold in the Gold Lucky Draw.* Private meeting zones, live product demonstrations and side events before and after the expo extend the experience further.
*T&Cs apply.
Dubai’s business and events calendar continues to run through September without disruption, and exhibitors, sponsors and attendees will be kept updated through official channels in the lead-up to the event.
About Forex Expo Dubai
Forex Expo Dubai is one of the region’s leading gatherings for the global online trading and fintech industry, bringing together brokerages, fintech innovators, institutional traders, investors, payment solution providers, IBs, affiliates and online trading technology companies under one roof. The expo serves as a platform for industry dialogue, business networking, technology showcases, and market-focused conversations shaping the future of modern finance.
This post Forex Expo Dubai to Take Place as Scheduled on 22–23 September 2026 first appeared on BitcoinWorld.
1
136
·
--
Article
LABITCONF 2026 Arrives With Its HODL EditionBitcoinWorld
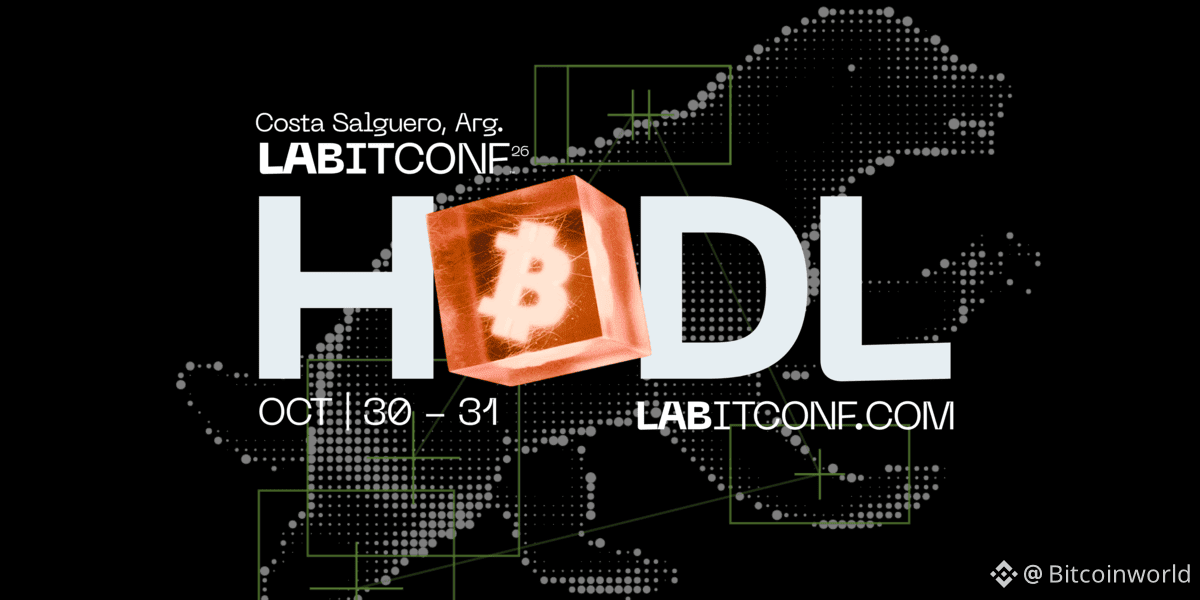
LABITCONF 2026 arrives with its HODL edition
One of the most recognized Spanish-language events on Bitcoin, Blockchain, and now AI, returns to Buenos Aires to bring together thousands of people to learn, debate, and reflect on the impact and future of these technologies in our lives and businesses.
Buenos Aires, August 2026. For the fifth consecutive year, LABITCONF chooses Argentina to host its 14th edition. The region’s flagship conference and one of the world’s oldest on Bitcoin and Blockchain technology adds Artificial Intelligence this year as a key protagonist in its conversations.
LABITCONF 2026 Arrives With Its HODL Edition
BitcoinWorld
LABITCONF 2026 arrives with its HODL edition
One of the most recognized Spanish-language events on Bitcoin, Blockchain, and now AI, returns to Buenos Aires to bring together thousands of people to learn, debate, and reflect on the impact and future of these technologies in our lives and businesses.
Buenos Aires, August 2026. For the fifth consecutive year, LABITCONF chooses Argentina to host its 14th edition. The region’s flagship conference and one of the world’s oldest on Bitcoin and Blockchain technology adds Artificial Intelligence this year as a key protagonist in its conversations.
LABITCONF 2026 arrives with its HODL edition
One of the most recognized Spanish-language events on Bitcoin, Blockchain, and now AI, returns to Buenos Aires to bring together thousands of people to learn, debate, and reflect on the impact and future of these technologies in our lives and businesses.
Buenos Aires, August 2026. For the fifth consecutive year, LABITCONF chooses Argentina to host its 14th edition. The region’s flagship conference and one of the world’s oldest on Bitcoin and Blockchain technology adds Artificial Intelligence this year as a key protagonist in its conversations.
98
·
--

Article
Banking Reimagined: Johannesburg to Host 28th Connected Banking Summit As Southern Africa Races T...BitcoinWorldBanking Reimagined: Johannesburg to Host 28th Connected Banking Summit as Southern Africa Races Toward Digital-First Finance
“Advancing Intelligent Banking, Security, and Enterprise Digital Modernization in South Africa”
The International Centre for Strategic Alliances (ICSA) is pleased to announce the 28th Connected Banking Summit – Southern Africa, Innovation & Excellence Awards 2026, set to take place on 14th October 2026 at a premier venue in Johannesburg, South Africa. This landmark hybrid event will bring together senior executives, regulators, fintech innovators, and technology leaders from across Southern Africa to explore the transformative potential of digital banking and financial infrastructure in driving a secure, inclusive, and resilient financial ecosystem.
Held under the strategic theme “Advancing Intelligent Banking, Security, and Enterprise Digital Modernization in South Africa,” the summit will serve as a critical forum for sharing insights, best practices, and innovative solutions that enable financial institutions to modernize legacy systems, strengthen cybersecurity postures, advance financial inclusion, and deliver seamless, customer-centric digital banking experiences.
Summit Highlights and Program
The 28th Connected Banking Summit will feature an immersive, full-day program including:
Keynote Addresses: Opening and closing keynotes from leading banking chief executives, chief digital officers, and globally recognized experts covering intelligent banking transformation, cybersecurity and zero trust frameworks, payments innovation, and enterprise digital modernization.
Executive Panel Discussions: High-level panels examining critical topics including financial inclusion strategies, AI-driven banking transformation, data governance, cloud migration, and cross-border payments and trade finance.
Technology Showcase: Live demonstrations of next-generation banking platforms, cloud infrastructure offerings, AI-powered analytics tools, cybersecurity solutions, and blockchain applications.
Networking Sessions: Exclusive opportunities for VIP networking with C-suite executives, chief information and data officers, fintech founders, and technology leaders.
Innovation & Excellence Awards: Recognition of standout achievements in digital transformation, security, and customer experience across Southern Africa’s banking and fintech sectors.
Expected Attendee Profile
The summit will attract senior decision-makers including:
C-suite executives (CEOs, COOs, CFOs) from leading banks across Southern Africa
Central bank governors and senior regulatory officials
Chief Information Officers and Chief Technology Officers responsible for digital transformation
Fintech founders and venture capital investors focused on emerging markets
Technology providers and cloud infrastructure specialists
Government officials responsible for financial sector development and digital strategy
Telecommunications executives and payment network operators
Academic researchers and think tank experts focused on financial inclusion
Key Discussion Themes
Building Resilient Financial Ecosystems: Strategies for strengthening infrastructure and operational resilience across the banking sector.
AI-Driven Banking Transformation: Applications of artificial intelligence for credit risk assessment, fraud detection, customer service automation, and predictive analytics.
Cybersecurity and Zero Trust Frameworks: Advanced threat detection, incident response, and data privacy in an increasingly digital threat landscape.
Fintech and Bank Collaboration: Partnerships that extend digital banking access and drive financial inclusion.
Payments and Customer Experience: Revolutionizing payments infrastructure and digital-first customer journeys.
Open Banking and Blockchain: Building secure, interoperable financial ecosystems that enable third-party innovation.
Cloud Solutions and Digital Lending: Scalable infrastructure and expanded access to capital through digital channels.
Sustainable Finance: Integrating environmental and social governance (ESG) considerations into banking operations and lending practices.
Strategic Value for Attendees
Attend the 28th Connected Banking Summit – Southern Africa to:
Gain unparalleled access to decision-makers and innovators shaping Southern Africa’s digital finance ecosystem
Learn real-world use cases demonstrating successful AI, cloud migration, and digital transformation initiatives from the region’s leading banks
Understand evolving regulatory frameworks and industry expectations for digital and intelligent banking
Discover partnership opportunities with fintech innovators and technology providers
Build relationships with peers facing similar digital transformation challenges
Position your organization as an industry thought leader through speaking, sponsorship, or exhibition opportunities
Registration & Partnership Opportunities
Early-bird registration is now open. Organizations interested in sponsorship, exhibition, speaking opportunities, or media partnerships should contact ICSA directly.
Register now: https://connected-banking.com/summit/southern-africa/
Media Contacts
For media inquiries, interview requests, or accreditation:
General Inquiries: info@connected-banking.com Phone: +44 20 3808 8625
This post Banking Reimagined: Johannesburg to Host 28th Connected Banking Summit as Southern Africa Races Toward Digital-First Finance first appeared on BitcoinWorld.
Banking Reimagined: Johannesburg to Host 28th Connected Banking Summit As Southern Africa Races T...
BitcoinWorldBanking Reimagined: Johannesburg to Host 28th Connected Banking Summit as Southern Africa Races Toward Digital-First Finance
“Advancing Intelligent Banking, Security, and Enterprise Digital Modernization in South Africa”
The International Centre for Strategic Alliances (ICSA) is pleased to announce the 28th Connected Banking Summit – Southern Africa, Innovation & Excellence Awards 2026, set to take place on 14th October 2026 at a premier venue in Johannesburg, South Africa. This landmark hybrid event will bring together senior executives, regulators, fintech innovators, and technology leaders from across Southern Africa to explore the transformative potential of digital banking and financial infrastructure in driving a secure, inclusive, and resilient financial ecosystem.
Held under the strategic theme “Advancing Intelligent Banking, Security, and Enterprise Digital Modernization in South Africa,” the summit will serve as a critical forum for sharing insights, best practices, and innovative solutions that enable financial institutions to modernize legacy systems, strengthen cybersecurity postures, advance financial inclusion, and deliver seamless, customer-centric digital banking experiences.
Summit Highlights and Program
The 28th Connected Banking Summit will feature an immersive, full-day program including:
Keynote Addresses: Opening and closing keynotes from leading banking chief executives, chief digital officers, and globally recognized experts covering intelligent banking transformation, cybersecurity and zero trust frameworks, payments innovation, and enterprise digital modernization.
Executive Panel Discussions: High-level panels examining critical topics including financial inclusion strategies, AI-driven banking transformation, data governance, cloud migration, and cross-border payments and trade finance.
Technology Showcase: Live demonstrations of next-generation banking platforms, cloud infrastructure offerings, AI-powered analytics tools, cybersecurity solutions, and blockchain applications.
Networking Sessions: Exclusive opportunities for VIP networking with C-suite executives, chief information and data officers, fintech founders, and technology leaders.
Innovation & Excellence Awards: Recognition of standout achievements in digital transformation, security, and customer experience across Southern Africa’s banking and fintech sectors.
Expected Attendee Profile
The summit will attract senior decision-makers including:
C-suite executives (CEOs, COOs, CFOs) from leading banks across Southern Africa
Central bank governors and senior regulatory officials
Chief Information Officers and Chief Technology Officers responsible for digital transformation
Fintech founders and venture capital investors focused on emerging markets
Technology providers and cloud infrastructure specialists
Government officials responsible for financial sector development and digital strategy
Telecommunications executives and payment network operators
Academic researchers and think tank experts focused on financial inclusion
Key Discussion Themes
Building Resilient Financial Ecosystems: Strategies for strengthening infrastructure and operational resilience across the banking sector.
AI-Driven Banking Transformation: Applications of artificial intelligence for credit risk assessment, fraud detection, customer service automation, and predictive analytics.
Cybersecurity and Zero Trust Frameworks: Advanced threat detection, incident response, and data privacy in an increasingly digital threat landscape.
Fintech and Bank Collaboration: Partnerships that extend digital banking access and drive financial inclusion.
Payments and Customer Experience: Revolutionizing payments infrastructure and digital-first customer journeys.
Open Banking and Blockchain: Building secure, interoperable financial ecosystems that enable third-party innovation.
Cloud Solutions and Digital Lending: Scalable infrastructure and expanded access to capital through digital channels.
Sustainable Finance: Integrating environmental and social governance (ESG) considerations into banking operations and lending practices.
Strategic Value for Attendees
Attend the 28th Connected Banking Summit – Southern Africa to:
Gain unparalleled access to decision-makers and innovators shaping Southern Africa’s digital finance ecosystem
Learn real-world use cases demonstrating successful AI, cloud migration, and digital transformation initiatives from the region’s leading banks
Understand evolving regulatory frameworks and industry expectations for digital and intelligent banking
Discover partnership opportunities with fintech innovators and technology providers
Build relationships with peers facing similar digital transformation challenges
Position your organization as an industry thought leader through speaking, sponsorship, or exhibition opportunities
Registration & Partnership Opportunities
Early-bird registration is now open. Organizations interested in sponsorship, exhibition, speaking opportunities, or media partnerships should contact ICSA directly.
Register now: https://connected-banking.com/summit/southern-africa/
Media Contacts
For media inquiries, interview requests, or accreditation:
General Inquiries: info@connected-banking.com Phone: +44 20 3808 8625
This post Banking Reimagined: Johannesburg to Host 28th Connected Banking Summit as Southern Africa Races Toward Digital-First Finance first appeared on BitcoinWorld.
“Advancing Intelligent Banking, Security, and Enterprise Digital Modernization in South Africa”
The International Centre for Strategic Alliances (ICSA) is pleased to announce the 28th Connected Banking Summit – Southern Africa, Innovation & Excellence Awards 2026, set to take place on 14th October 2026 at a premier venue in Johannesburg, South Africa. This landmark hybrid event will bring together senior executives, regulators, fintech innovators, and technology leaders from across Southern Africa to explore the transformative potential of digital banking and financial infrastructure in driving a secure, inclusive, and resilient financial ecosystem.
Held under the strategic theme “Advancing Intelligent Banking, Security, and Enterprise Digital Modernization in South Africa,” the summit will serve as a critical forum for sharing insights, best practices, and innovative solutions that enable financial institutions to modernize legacy systems, strengthen cybersecurity postures, advance financial inclusion, and deliver seamless, customer-centric digital banking experiences.
Summit Highlights and Program
The 28th Connected Banking Summit will feature an immersive, full-day program including:
Keynote Addresses: Opening and closing keynotes from leading banking chief executives, chief digital officers, and globally recognized experts covering intelligent banking transformation, cybersecurity and zero trust frameworks, payments innovation, and enterprise digital modernization.
Executive Panel Discussions: High-level panels examining critical topics including financial inclusion strategies, AI-driven banking transformation, data governance, cloud migration, and cross-border payments and trade finance.
Technology Showcase: Live demonstrations of next-generation banking platforms, cloud infrastructure offerings, AI-powered analytics tools, cybersecurity solutions, and blockchain applications.
Networking Sessions: Exclusive opportunities for VIP networking with C-suite executives, chief information and data officers, fintech founders, and technology leaders.
Innovation & Excellence Awards: Recognition of standout achievements in digital transformation, security, and customer experience across Southern Africa’s banking and fintech sectors.
Expected Attendee Profile
The summit will attract senior decision-makers including:
C-suite executives (CEOs, COOs, CFOs) from leading banks across Southern Africa
Central bank governors and senior regulatory officials
Chief Information Officers and Chief Technology Officers responsible for digital transformation
Fintech founders and venture capital investors focused on emerging markets
Technology providers and cloud infrastructure specialists
Government officials responsible for financial sector development and digital strategy
Telecommunications executives and payment network operators
Academic researchers and think tank experts focused on financial inclusion
Key Discussion Themes
Building Resilient Financial Ecosystems: Strategies for strengthening infrastructure and operational resilience across the banking sector.
AI-Driven Banking Transformation: Applications of artificial intelligence for credit risk assessment, fraud detection, customer service automation, and predictive analytics.
Cybersecurity and Zero Trust Frameworks: Advanced threat detection, incident response, and data privacy in an increasingly digital threat landscape.
Fintech and Bank Collaboration: Partnerships that extend digital banking access and drive financial inclusion.
Payments and Customer Experience: Revolutionizing payments infrastructure and digital-first customer journeys.
Open Banking and Blockchain: Building secure, interoperable financial ecosystems that enable third-party innovation.
Cloud Solutions and Digital Lending: Scalable infrastructure and expanded access to capital through digital channels.
Sustainable Finance: Integrating environmental and social governance (ESG) considerations into banking operations and lending practices.
Strategic Value for Attendees
Attend the 28th Connected Banking Summit – Southern Africa to:
Gain unparalleled access to decision-makers and innovators shaping Southern Africa’s digital finance ecosystem
Learn real-world use cases demonstrating successful AI, cloud migration, and digital transformation initiatives from the region’s leading banks
Understand evolving regulatory frameworks and industry expectations for digital and intelligent banking
Discover partnership opportunities with fintech innovators and technology providers
Build relationships with peers facing similar digital transformation challenges
Position your organization as an industry thought leader through speaking, sponsorship, or exhibition opportunities
Registration & Partnership Opportunities
Early-bird registration is now open. Organizations interested in sponsorship, exhibition, speaking opportunities, or media partnerships should contact ICSA directly.
Register now: https://connected-banking.com/summit/southern-africa/
Media Contacts
For media inquiries, interview requests, or accreditation:
General Inquiries: info@connected-banking.com Phone: +44 20 3808 8625
This post Banking Reimagined: Johannesburg to Host 28th Connected Banking Summit as Southern Africa Races Toward Digital-First Finance first appeared on BitcoinWorld.
1
1
120
·
--

Article
SPARK 2026, 6 Weeks Away: Software, Payments, Affiliates and Revenue on the AgendaBitcoinWorldSPARK 2026, 6 Weeks Away: Software, Payments, Affiliates and Revenue on the Agenda
For gaming businesses looking towards Southeast Europe, there is more to consider than simply market growth, and in just six weeks, the inaugural SPARK (Software, Payments, Affiliates, Revenue Kickoff) 2026 will put those questions directly to the operators, affiliates and providers navigating the region, when it takes place in Sofia, Bulgaria, on 19 – 20 October.
Day One: Product, Payments and Acquisition
Proceedings open with a keynote on the trends, regulation and strategy shaping product, payments and affiliates across the region, a timely focus given that acquiring a new player can cost several times more than retaining an existing one, with payment experience alone remaining a leading factor in operator choice. Sessions across the day will then move through retention over acquisition, live ops as a revenue engine, the evolving role of retail gaming in a digital-first market, payments as a conversion lever, and the challenge of balancing compliance with user experience across multiple jurisdictions.
Day Two: Scaling With Confidence
Confidence in scaling becomes the focus next, with an opening keynote on the shift from search engine optimisation to AI-driven answer engines. Sessions will explore the changing role of affiliates, post-SEO acquisition strategies, what’s truly working in modern iGaming operations, responsible AI in marketing under the EU AI Act, and the balance between proactive and reactive compliance, before closing out with a session on translating this year’s takeaways into lasting, resilient growth.
Speakers Weigh In
Ahead of SPARK 2026, a number of this year’s confirmed speakers shared insight into what they’ll bring to the stage.
On what Skyrocket Marketers Agency brings to the iGaming space, the company’s CEO, Andreas Ioannou, said: “We create AI chatbots for iGaming businesses that can handle customer questions, support players 24/7, and improve the overall player experience. Available in multiple languages and tailored to your business needs.”
Hanna Plachkova (The Persona Lab) shared: “So much is shifting right now – AI alone is rewriting the rules – and it’s easy to fall behind. That’s exactly why events like SPARK matter: they’re where you catch the trends early, find real solutions, and take back things that help your company grow. What I’m most eager to do is help the audience make sense of the biggest insights from these two days and leave with specific, actionable next steps.”
Retention, not acquisition, is where Henk Wolff (iGaming Consultant) believes the real money is being left on the table:
“New operators spend their entire budget acquiring players and nothing on keeping them. Then they wonder why the numbers don’t add up.
85%+ of casino revenue comes from recurring players. Not first deposits. Recurring players. And a player who hears nothing from you after signing up does not come back. He just moves on to the next operator that does talk to him.
That is the biggest leak in the industry. New operators have it. Plenty of established ones have it too.
At SPARK 2026, I’ll be showing what retention marketing actually does to an operation’s bottom line.”
For Chrysothemi Valanidou (Startwise Ltd), compliance and growth aren’t separate conversations:
“Regulation in iGaming is constantly evolving, and businesses need to do more than simply keep up, they need to understand how regulatory requirements translate into practical, sustainable business decisions. At SPARK 2026, I’m looking forward to sharing practical insights from my experience in AML, regulatory compliance and the betting industry, and discussing how businesses can approach compliance as part of their wider strategy and growth.”
Governance built in from day one, not added later, is the case Mark McGuinness (CreateFuture) plans to make at SPARK 2026:
“Compliance rarely costs performance. Retrofitting does. The teams that design governance in from the start keep shipping, while the ones bolting it on later end up unpicking systems that already work. That is the conversation I want to have at SPARK 2026.”
Secure Your Package Now
With six weeks remaining, there is still time for organisations to put their brand in front of Southeast Europe’s gaming community, connect with potential partners and build valuable relationships with key industry contacts through the available delegate, sponsorship and exhibition packages.
For sponsorship or exhibition enquiries, contact:
Lou-Mari Burnett, Chief Operating Officer, Eventus International
loumari@eventus-international.com
+27 82 907 5850
Register here: https://www.eventus-international.com/spark
19 – 20 October 2026 | Sofia, Bulgaria
This post SPARK 2026, 6 Weeks Away: Software, Payments, Affiliates and Revenue on the Agenda first appeared on BitcoinWorld.
SPARK 2026, 6 Weeks Away: Software, Payments, Affiliates and Revenue on the Agenda
BitcoinWorldSPARK 2026, 6 Weeks Away: Software, Payments, Affiliates and Revenue on the Agenda
For gaming businesses looking towards Southeast Europe, there is more to consider than simply market growth, and in just six weeks, the inaugural SPARK (Software, Payments, Affiliates, Revenue Kickoff) 2026 will put those questions directly to the operators, affiliates and providers navigating the region, when it takes place in Sofia, Bulgaria, on 19 – 20 October.
Day One: Product, Payments and Acquisition
Proceedings open with a keynote on the trends, regulation and strategy shaping product, payments and affiliates across the region, a timely focus given that acquiring a new player can cost several times more than retaining an existing one, with payment experience alone remaining a leading factor in operator choice. Sessions across the day will then move through retention over acquisition, live ops as a revenue engine, the evolving role of retail gaming in a digital-first market, payments as a conversion lever, and the challenge of balancing compliance with user experience across multiple jurisdictions.
Day Two: Scaling With Confidence
Confidence in scaling becomes the focus next, with an opening keynote on the shift from search engine optimisation to AI-driven answer engines. Sessions will explore the changing role of affiliates, post-SEO acquisition strategies, what’s truly working in modern iGaming operations, responsible AI in marketing under the EU AI Act, and the balance between proactive and reactive compliance, before closing out with a session on translating this year’s takeaways into lasting, resilient growth.
Speakers Weigh In
Ahead of SPARK 2026, a number of this year’s confirmed speakers shared insight into what they’ll bring to the stage.
On what Skyrocket Marketers Agency brings to the iGaming space, the company’s CEO, Andreas Ioannou, said: “We create AI chatbots for iGaming businesses that can handle customer questions, support players 24/7, and improve the overall player experience. Available in multiple languages and tailored to your business needs.”
Hanna Plachkova (The Persona Lab) shared: “So much is shifting right now – AI alone is rewriting the rules – and it’s easy to fall behind. That’s exactly why events like SPARK matter: they’re where you catch the trends early, find real solutions, and take back things that help your company grow. What I’m most eager to do is help the audience make sense of the biggest insights from these two days and leave with specific, actionable next steps.”
Retention, not acquisition, is where Henk Wolff (iGaming Consultant) believes the real money is being left on the table:
“New operators spend their entire budget acquiring players and nothing on keeping them. Then they wonder why the numbers don’t add up.
85%+ of casino revenue comes from recurring players. Not first deposits. Recurring players. And a player who hears nothing from you after signing up does not come back. He just moves on to the next operator that does talk to him.
That is the biggest leak in the industry. New operators have it. Plenty of established ones have it too.
At SPARK 2026, I’ll be showing what retention marketing actually does to an operation’s bottom line.”
For Chrysothemi Valanidou (Startwise Ltd), compliance and growth aren’t separate conversations:
“Regulation in iGaming is constantly evolving, and businesses need to do more than simply keep up, they need to understand how regulatory requirements translate into practical, sustainable business decisions. At SPARK 2026, I’m looking forward to sharing practical insights from my experience in AML, regulatory compliance and the betting industry, and discussing how businesses can approach compliance as part of their wider strategy and growth.”
Governance built in from day one, not added later, is the case Mark McGuinness (CreateFuture) plans to make at SPARK 2026:
“Compliance rarely costs performance. Retrofitting does. The teams that design governance in from the start keep shipping, while the ones bolting it on later end up unpicking systems that already work. That is the conversation I want to have at SPARK 2026.”
Secure Your Package Now
With six weeks remaining, there is still time for organisations to put their brand in front of Southeast Europe’s gaming community, connect with potential partners and build valuable relationships with key industry contacts through the available delegate, sponsorship and exhibition packages.
For sponsorship or exhibition enquiries, contact:
Lou-Mari Burnett, Chief Operating Officer, Eventus International
loumari@eventus-international.com
+27 82 907 5850
Register here: https://www.eventus-international.com/spark
19 – 20 October 2026 | Sofia, Bulgaria
This post SPARK 2026, 6 Weeks Away: Software, Payments, Affiliates and Revenue on the Agenda first appeared on BitcoinWorld.
For gaming businesses looking towards Southeast Europe, there is more to consider than simply market growth, and in just six weeks, the inaugural SPARK (Software, Payments, Affiliates, Revenue Kickoff) 2026 will put those questions directly to the operators, affiliates and providers navigating the region, when it takes place in Sofia, Bulgaria, on 19 – 20 October.
Day One: Product, Payments and Acquisition
Proceedings open with a keynote on the trends, regulation and strategy shaping product, payments and affiliates across the region, a timely focus given that acquiring a new player can cost several times more than retaining an existing one, with payment experience alone remaining a leading factor in operator choice. Sessions across the day will then move through retention over acquisition, live ops as a revenue engine, the evolving role of retail gaming in a digital-first market, payments as a conversion lever, and the challenge of balancing compliance with user experience across multiple jurisdictions.
Day Two: Scaling With Confidence
Confidence in scaling becomes the focus next, with an opening keynote on the shift from search engine optimisation to AI-driven answer engines. Sessions will explore the changing role of affiliates, post-SEO acquisition strategies, what’s truly working in modern iGaming operations, responsible AI in marketing under the EU AI Act, and the balance between proactive and reactive compliance, before closing out with a session on translating this year’s takeaways into lasting, resilient growth.
Speakers Weigh In
Ahead of SPARK 2026, a number of this year’s confirmed speakers shared insight into what they’ll bring to the stage.
On what Skyrocket Marketers Agency brings to the iGaming space, the company’s CEO, Andreas Ioannou, said: “We create AI chatbots for iGaming businesses that can handle customer questions, support players 24/7, and improve the overall player experience. Available in multiple languages and tailored to your business needs.”
Hanna Plachkova (The Persona Lab) shared: “So much is shifting right now – AI alone is rewriting the rules – and it’s easy to fall behind. That’s exactly why events like SPARK matter: they’re where you catch the trends early, find real solutions, and take back things that help your company grow. What I’m most eager to do is help the audience make sense of the biggest insights from these two days and leave with specific, actionable next steps.”
Retention, not acquisition, is where Henk Wolff (iGaming Consultant) believes the real money is being left on the table:
“New operators spend their entire budget acquiring players and nothing on keeping them. Then they wonder why the numbers don’t add up.
85%+ of casino revenue comes from recurring players. Not first deposits. Recurring players. And a player who hears nothing from you after signing up does not come back. He just moves on to the next operator that does talk to him.
That is the biggest leak in the industry. New operators have it. Plenty of established ones have it too.
At SPARK 2026, I’ll be showing what retention marketing actually does to an operation’s bottom line.”
For Chrysothemi Valanidou (Startwise Ltd), compliance and growth aren’t separate conversations:
“Regulation in iGaming is constantly evolving, and businesses need to do more than simply keep up, they need to understand how regulatory requirements translate into practical, sustainable business decisions. At SPARK 2026, I’m looking forward to sharing practical insights from my experience in AML, regulatory compliance and the betting industry, and discussing how businesses can approach compliance as part of their wider strategy and growth.”
Governance built in from day one, not added later, is the case Mark McGuinness (CreateFuture) plans to make at SPARK 2026:
“Compliance rarely costs performance. Retrofitting does. The teams that design governance in from the start keep shipping, while the ones bolting it on later end up unpicking systems that already work. That is the conversation I want to have at SPARK 2026.”
Secure Your Package Now
With six weeks remaining, there is still time for organisations to put their brand in front of Southeast Europe’s gaming community, connect with potential partners and build valuable relationships with key industry contacts through the available delegate, sponsorship and exhibition packages.
For sponsorship or exhibition enquiries, contact:
Lou-Mari Burnett, Chief Operating Officer, Eventus International
loumari@eventus-international.com
+27 82 907 5850
Register here: https://www.eventus-international.com/spark
19 – 20 October 2026 | Sofia, Bulgaria
This post SPARK 2026, 6 Weeks Away: Software, Payments, Affiliates and Revenue on the Agenda first appeared on BitcoinWorld.
55
·
--

Article
SPiCE Central Asia Awards 2026 to Honour Industry Leaders & Standout AchievementsBitcoinWorldSPiCE Central Asia Awards 2026 to Honour Industry Leaders & Standout Achievements
As SPiCE Central Asia returns to Tbilisi, Georgia, for its third year, Eventus International will recognise outstanding industry professionals and organisations with seven awards at this year’s event. The SPiCE Central Asia Awards 2026 will take place on the first evening of the event, 24 September, at The Biltmore Hotel Tbilisi.
This Year’s Award Categories:
SPiCE Central Asia Technology Provider of the Year Award 2026Recognising the technology provider that combines strong commercial performance with innovative thinking and a high-quality user experience.
SPiCE Central Asia Payment Provider of the Year Award 2026Acknowledging the payment provider that delivers commercial success through innovative solutions and a seamless user experience.
SPiCE Central Asia Innovation of the Year Award 2026Recognising an outstanding innovation for its commercial impact, originality and ability to improve the user experience.
SPiCE Central Asia Operator of the Year Award 2026Applauding the operator that demonstrates strong commercial performance, innovation and a consistent focus on the user experience.
SPiCE Central Asia Speaker of the Year Award 2026Recognising a speaker who connects with diverse audiences through engaging delivery, strong communication and demonstrable industry expertise.
SPiCE-IEST Expo Stand of the Year Award 2026Awarded to the expo stand that makes the strongest visual and experiential impression, with the shortlist announced after the first day of the expo.
SPiCE Central Asia Honorary Award 2026Recognising an individual for significant lifetime achievements, outstanding service or a lasting contribution to the gaming industry.
Key Dates
Nominations for the Technology Provider of the Year, Payment Provider of the Year, Innovation of the Year and Operator of the Year awards close on 16 September. The shortlist will be announced on 18 September, and the winners will be revealed at the SPiCE Central Asia Awards 2026 ceremony on 24 September.
Nominate a leader: https://www.spiceseries.com/sca-award-nomination
This post SPiCE Central Asia Awards 2026 to Honour Industry Leaders & Standout Achievements first appeared on BitcoinWorld.
SPiCE Central Asia Awards 2026 to Honour Industry Leaders & Standout Achievements
BitcoinWorldSPiCE Central Asia Awards 2026 to Honour Industry Leaders & Standout Achievements
As SPiCE Central Asia returns to Tbilisi, Georgia, for its third year, Eventus International will recognise outstanding industry professionals and organisations with seven awards at this year’s event. The SPiCE Central Asia Awards 2026 will take place on the first evening of the event, 24 September, at The Biltmore Hotel Tbilisi.
This Year’s Award Categories:
SPiCE Central Asia Technology Provider of the Year Award 2026Recognising the technology provider that combines strong commercial performance with innovative thinking and a high-quality user experience.
SPiCE Central Asia Payment Provider of the Year Award 2026Acknowledging the payment provider that delivers commercial success through innovative solutions and a seamless user experience.
SPiCE Central Asia Innovation of the Year Award 2026Recognising an outstanding innovation for its commercial impact, originality and ability to improve the user experience.
SPiCE Central Asia Operator of the Year Award 2026Applauding the operator that demonstrates strong commercial performance, innovation and a consistent focus on the user experience.
SPiCE Central Asia Speaker of the Year Award 2026Recognising a speaker who connects with diverse audiences through engaging delivery, strong communication and demonstrable industry expertise.
SPiCE-IEST Expo Stand of the Year Award 2026Awarded to the expo stand that makes the strongest visual and experiential impression, with the shortlist announced after the first day of the expo.
SPiCE Central Asia Honorary Award 2026Recognising an individual for significant lifetime achievements, outstanding service or a lasting contribution to the gaming industry.
Key Dates
Nominations for the Technology Provider of the Year, Payment Provider of the Year, Innovation of the Year and Operator of the Year awards close on 16 September. The shortlist will be announced on 18 September, and the winners will be revealed at the SPiCE Central Asia Awards 2026 ceremony on 24 September.
Nominate a leader: https://www.spiceseries.com/sca-award-nomination
This post SPiCE Central Asia Awards 2026 to Honour Industry Leaders & Standout Achievements first appeared on BitcoinWorld.
As SPiCE Central Asia returns to Tbilisi, Georgia, for its third year, Eventus International will recognise outstanding industry professionals and organisations with seven awards at this year’s event. The SPiCE Central Asia Awards 2026 will take place on the first evening of the event, 24 September, at The Biltmore Hotel Tbilisi.
This Year’s Award Categories:
SPiCE Central Asia Technology Provider of the Year Award 2026Recognising the technology provider that combines strong commercial performance with innovative thinking and a high-quality user experience.
SPiCE Central Asia Payment Provider of the Year Award 2026Acknowledging the payment provider that delivers commercial success through innovative solutions and a seamless user experience.
SPiCE Central Asia Innovation of the Year Award 2026Recognising an outstanding innovation for its commercial impact, originality and ability to improve the user experience.
SPiCE Central Asia Operator of the Year Award 2026Applauding the operator that demonstrates strong commercial performance, innovation and a consistent focus on the user experience.
SPiCE Central Asia Speaker of the Year Award 2026Recognising a speaker who connects with diverse audiences through engaging delivery, strong communication and demonstrable industry expertise.
SPiCE-IEST Expo Stand of the Year Award 2026Awarded to the expo stand that makes the strongest visual and experiential impression, with the shortlist announced after the first day of the expo.
SPiCE Central Asia Honorary Award 2026Recognising an individual for significant lifetime achievements, outstanding service or a lasting contribution to the gaming industry.
Key Dates
Nominations for the Technology Provider of the Year, Payment Provider of the Year, Innovation of the Year and Operator of the Year awards close on 16 September. The shortlist will be announced on 18 September, and the winners will be revealed at the SPiCE Central Asia Awards 2026 ceremony on 24 September.
Nominate a leader: https://www.spiceseries.com/sca-award-nomination
This post SPiCE Central Asia Awards 2026 to Honour Industry Leaders & Standout Achievements first appeared on BitcoinWorld.
93
·
--

Article
1 Week Until LiGA Summit 2026: Gaming Leaders Ready to Discuss Peru’s New Licensing FrameworkBitcoinWorld1 Week Until LiGA Summit 2026: Gaming Leaders Ready to Discuss Peru’s New Licensing Framework
There is just one week to go until the inaugural LiGA Summit 2026, which will welcome prominent operators, legal leaders, marketing experts and other key stakeholders to the El Pardo Lima – A DoubleTree by Hilton Hotel in Lima, Peru, on 17–18 September 2026 to discuss the opportunities and challenges created by Peru’s new licensing framework.
Running alongside the main summit on 18 September, the Prediction Markets Summit Americas 2026 will add another dimension to the agenda with a dedicated half-day stream focused on prediction markets, forecasting infrastructure and the expanding role of event-based products across regulated gaming markets.
Topics at the Forefront
Beyond Peru’s new gaming licensing era and its implications for online and land-based market stability, the agenda will cover major themes across Latin America’s gaming industry, from regulatory cooperation, compliance and cybersecurity to affiliate marketing, diversity and inclusion, and the emergence of prediction markets.
LiGA Summit 2026 – Main Programme
Day One | Thursday, 17 September
Regulatory Cooperation Across Latin America – Pathways to Regional Alignment
Peru at the Centre of LatAm iGaming: From Regulation to Profitability
The Rise of Creator Affiliates in Latin America: TikTok, YouTube, and Short-Form Performance Marketing
Day Two | Friday, 18 September
Preventing Fraud and Enhancing Cybersecurity in iGaming
The New Age of AML and KYC in Peru’s Digital Betting Market
Representation Matters: Shaping Gaming Through Diversity
Prediction Markets Summit Americas 2026 – Half-Day Stream
Day Two | Friday, 18 September
Discussion themes will include:
Building Trust in Event-Based Products – fraud prevention, cybersecurity, market integrity and consumer protection
Regulation & Market Development – Brazil’s regulatory approach, evolving frameworks across Latin America, and where prediction markets fit within betting, fintech and digital assets
Product Innovation & User Engagement – lessons from sportsbooks and affiliates, user experience, sustainable growth, and the role of AI and emerging technologies
A Distinguished Line-Up of LatAm Gaming Leaders
The summit will welcome an accomplished group of industry stakeholders, including leading operators, affiliates, legal experts and technology providers.
Confirmed contributors:
Ana María Padrós, Founder & General Manager, Team Seven EIRL
Eduardo Linares, Director of Compliance & Gaming, ECIJA Perú
Jorge Temoche, Head of Cybersecurity & IT Risk, Apuesta Total
Lucas Tapia Luna, CRM Marketing Manager – Sportsbook & Casino, Apuesto.com | Rojabet | Latribet
Milagros Gabriela Seijas Peralta, Head of Legal and Compliance, La Tinka S.A.
AND MANY MORE!
Last Chance to Secure a Place
There is only one week left for industry professionals to secure their place at the LiGA Summit 2026 and Prediction Markets Summit Americas 2026, and connect with the decision-makers, operators and experts influencing Latin America’s gaming market. Reserve a spot today to gain first-hand market insight, strengthen industry connections and raise visibility across the region.
Register here: https://www.eventus-international.com/liga
For sponsorship or exhibition enquiries, contact:
Lou-Mari Burnett, Chief Operating Officer, Eventus International
loumari@eventus-international.com
+27 82 907 5850
This post 1 Week Until LiGA Summit 2026: Gaming Leaders Ready to Discuss Peru’s New Licensing Framework first appeared on BitcoinWorld.
1 Week Until LiGA Summit 2026: Gaming Leaders Ready to Discuss Peru’s New Licensing Framework
BitcoinWorld1 Week Until LiGA Summit 2026: Gaming Leaders Ready to Discuss Peru’s New Licensing Framework
There is just one week to go until the inaugural LiGA Summit 2026, which will welcome prominent operators, legal leaders, marketing experts and other key stakeholders to the El Pardo Lima – A DoubleTree by Hilton Hotel in Lima, Peru, on 17–18 September 2026 to discuss the opportunities and challenges created by Peru’s new licensing framework.
Running alongside the main summit on 18 September, the Prediction Markets Summit Americas 2026 will add another dimension to the agenda with a dedicated half-day stream focused on prediction markets, forecasting infrastructure and the expanding role of event-based products across regulated gaming markets.
Topics at the Forefront
Beyond Peru’s new gaming licensing era and its implications for online and land-based market stability, the agenda will cover major themes across Latin America’s gaming industry, from regulatory cooperation, compliance and cybersecurity to affiliate marketing, diversity and inclusion, and the emergence of prediction markets.
LiGA Summit 2026 – Main Programme
Day One | Thursday, 17 September
Regulatory Cooperation Across Latin America – Pathways to Regional Alignment
Peru at the Centre of LatAm iGaming: From Regulation to Profitability
The Rise of Creator Affiliates in Latin America: TikTok, YouTube, and Short-Form Performance Marketing
Day Two | Friday, 18 September
Preventing Fraud and Enhancing Cybersecurity in iGaming
The New Age of AML and KYC in Peru’s Digital Betting Market
Representation Matters: Shaping Gaming Through Diversity
Prediction Markets Summit Americas 2026 – Half-Day Stream
Day Two | Friday, 18 September
Discussion themes will include:
Building Trust in Event-Based Products – fraud prevention, cybersecurity, market integrity and consumer protection
Regulation & Market Development – Brazil’s regulatory approach, evolving frameworks across Latin America, and where prediction markets fit within betting, fintech and digital assets
Product Innovation & User Engagement – lessons from sportsbooks and affiliates, user experience, sustainable growth, and the role of AI and emerging technologies
A Distinguished Line-Up of LatAm Gaming Leaders
The summit will welcome an accomplished group of industry stakeholders, including leading operators, affiliates, legal experts and technology providers.
Confirmed contributors:
Ana María Padrós, Founder & General Manager, Team Seven EIRL
Eduardo Linares, Director of Compliance & Gaming, ECIJA Perú
Jorge Temoche, Head of Cybersecurity & IT Risk, Apuesta Total
Lucas Tapia Luna, CRM Marketing Manager – Sportsbook & Casino, Apuesto.com | Rojabet | Latribet
Milagros Gabriela Seijas Peralta, Head of Legal and Compliance, La Tinka S.A.
AND MANY MORE!
Last Chance to Secure a Place
There is only one week left for industry professionals to secure their place at the LiGA Summit 2026 and Prediction Markets Summit Americas 2026, and connect with the decision-makers, operators and experts influencing Latin America’s gaming market. Reserve a spot today to gain first-hand market insight, strengthen industry connections and raise visibility across the region.
Register here: https://www.eventus-international.com/liga
For sponsorship or exhibition enquiries, contact:
Lou-Mari Burnett, Chief Operating Officer, Eventus International
loumari@eventus-international.com
+27 82 907 5850
This post 1 Week Until LiGA Summit 2026: Gaming Leaders Ready to Discuss Peru’s New Licensing Framework first appeared on BitcoinWorld.
There is just one week to go until the inaugural LiGA Summit 2026, which will welcome prominent operators, legal leaders, marketing experts and other key stakeholders to the El Pardo Lima – A DoubleTree by Hilton Hotel in Lima, Peru, on 17–18 September 2026 to discuss the opportunities and challenges created by Peru’s new licensing framework.
Running alongside the main summit on 18 September, the Prediction Markets Summit Americas 2026 will add another dimension to the agenda with a dedicated half-day stream focused on prediction markets, forecasting infrastructure and the expanding role of event-based products across regulated gaming markets.
Topics at the Forefront
Beyond Peru’s new gaming licensing era and its implications for online and land-based market stability, the agenda will cover major themes across Latin America’s gaming industry, from regulatory cooperation, compliance and cybersecurity to affiliate marketing, diversity and inclusion, and the emergence of prediction markets.
LiGA Summit 2026 – Main Programme
Day One | Thursday, 17 September
Regulatory Cooperation Across Latin America – Pathways to Regional Alignment
Peru at the Centre of LatAm iGaming: From Regulation to Profitability
The Rise of Creator Affiliates in Latin America: TikTok, YouTube, and Short-Form Performance Marketing
Day Two | Friday, 18 September
Preventing Fraud and Enhancing Cybersecurity in iGaming
The New Age of AML and KYC in Peru’s Digital Betting Market
Representation Matters: Shaping Gaming Through Diversity
Prediction Markets Summit Americas 2026 – Half-Day Stream
Day Two | Friday, 18 September
Discussion themes will include:
Building Trust in Event-Based Products – fraud prevention, cybersecurity, market integrity and consumer protection
Regulation & Market Development – Brazil’s regulatory approach, evolving frameworks across Latin America, and where prediction markets fit within betting, fintech and digital assets
Product Innovation & User Engagement – lessons from sportsbooks and affiliates, user experience, sustainable growth, and the role of AI and emerging technologies
A Distinguished Line-Up of LatAm Gaming Leaders
The summit will welcome an accomplished group of industry stakeholders, including leading operators, affiliates, legal experts and technology providers.
Confirmed contributors:
Ana María Padrós, Founder & General Manager, Team Seven EIRL
Eduardo Linares, Director of Compliance & Gaming, ECIJA Perú
Jorge Temoche, Head of Cybersecurity & IT Risk, Apuesta Total
Lucas Tapia Luna, CRM Marketing Manager – Sportsbook & Casino, Apuesto.com | Rojabet | Latribet
Milagros Gabriela Seijas Peralta, Head of Legal and Compliance, La Tinka S.A.
AND MANY MORE!
Last Chance to Secure a Place
There is only one week left for industry professionals to secure their place at the LiGA Summit 2026 and Prediction Markets Summit Americas 2026, and connect with the decision-makers, operators and experts influencing Latin America’s gaming market. Reserve a spot today to gain first-hand market insight, strengthen industry connections and raise visibility across the region.
Register here: https://www.eventus-international.com/liga
For sponsorship or exhibition enquiries, contact:
Lou-Mari Burnett, Chief Operating Officer, Eventus International
loumari@eventus-international.com
+27 82 907 5850
This post 1 Week Until LiGA Summit 2026: Gaming Leaders Ready to Discuss Peru’s New Licensing Framework first appeared on BitcoinWorld.
91
·
--

Article
6 Weeks Until the Scandinavian & Nordic Gaming Show 2026: Comm100 on AI-Powered Player EngagementBitcoinWorld6 Weeks until the Scandinavian & Nordic Gaming Show 2026: Comm100 on AI-Powered Player Engagement
The Nordic gaming market is seeing regulatory developments in several key areas, from Finland’s preparations for a new licensing framework to Sweden’s stronger regulatory approach and Norway’s increased enforcement. The highly anticipated 8th annual Scandinavian & Nordic Gaming Show (SNGS) 2026, taking place in just 6 weeks on 22–23 October at the Radisson Blu Scandinavia Hotel in Copenhagen, Denmark, will give regulators, operators, providers and investors a platform to discuss the implications of these developments for the industry.
Exhibitor Spotlight: Comm100
SNGS 2026 welcomes Comm100 as an exhibitor for the event’s 8th edition.
Comm100 helps businesses level up their self-serve and human-assisted customer service with AI-driven speed and efficiency. The platform enables businesses to meet their customers where and when they prefer, accelerating resolution with powerful AI agents and enhancements that help everyone get on with their day.
From automated, context-aware support to real-time human assistance, onboarding, and evaluation, Comm100’s solutions are designed with a singular goal in mind: to shorten the path between question and answer.
Learn more about Comm100: https://www.comm100.com/
Exclusive Insights with the Comm100 Team
The team described how its platform supports gaming operators across different customer service channels and player interactions:
“Comm100 is an AI-powered player engagement platform that unifies live chat, email, messaging apps, and ticketing.
AI agents handle routine player queries as the first line of support, and complex cases and high-value players are escalated to live agents with full player context and gaming-specific response suggestions. The platform is used by more than 1,200 international operators, platform providers and BPOs.”
They also outlined the AI and automation tools available across the customer support lifecycle:
“Comm100 offers a suite of AI solutions to empower CS teams across the full support lifecycle:
AI Agent: autonomous AI chatbot that can handle up to 80% of incoming queries
AI Copilot: offers suggestions, responses, and helpful actions to human agents
AI Knowledge: automates knowledge base management, including drafting new articles
AI QA: auto-scores conversations and turns the findings into coaching moments
AI Training: converts that material into simulation-based scenarios and quizzes
AI Insights: reads resolution, sentiment and churn signals across the whole operation
Responsible gambling: Identifying markers of harm, live monitoring, and detailed reporting”
On what Comm100 considers the biggest customer experience challenges facing gaming operators across the Scandinavian and Nordic markets today:
“Regulatory divergence is the immediate pressure. Finland is moving from a state monopoly to a competitive licensing model, Sweden is tightening consumer protection rules inside an already licensed market, and Norway is further adding harm-prevention measures and doubling down on responsible gambling, so operators running across the region are supporting players under three different sets of obligations at once.”
The team further discussed where automation can take on routine player support tasks and where human involvement is still required:
“The biggest upside gains for automation lie in high-volume, repeatable questions: account balances, game rules, promotion eligibility, withdrawal timelines and bonus activation. Automating those requests with no-code workflows frees agents to focus on VIP retention and the cases that need judgment.
Human input stays essential wherever the outcome affects a player’s money, their account status or their wellbeing.”
Lastly, Comm100 commented on the emerging customer service and AI trends they believe will have the biggest impact on the Nordic gaming industry:
“Responsible gambling technology is shifting from retrospective analysis to real-time action, and support conversations are the richest untapped source of risk signals operators already hold. Integrating support systems with responsible gambling solutions is likely a barrier.
The second shift is AI-assisted quality assurance, where every conversation can be reviewed against an operator’s own guidelines.”
Who Will Take Home an SNGS Eventus Award?
Nominations are now open for the SNGS Eventus Awards 2026, taking place during SNGS 2026 on the evening of 22 October 2026.
This is an opportunity to recognise the individuals and organisations making a notable contribution to the region’s gaming industry through leadership, innovation and outstanding achievement.
Entries close on 9 October 2026, ahead of the shortlist announcement on 14 October 2026.
Nominate a leader: https://www.eventus-international.com/sngs-award-nominations
Attend, Sponsor or Exhibit
Delegate, sponsorship and exhibition opportunities are available at the 8th annual SNGS 2026, offering organisations the opportunity to raise their profile, connect with the region’s gaming community and build relationships with key industry stakeholders.
To secure a place, register here: https://www.eventus-international.com/sngs
For sponsorship or exhibition enquiries, contact:
Lou-Mari Burnett, Chief Operating Officer, Eventus International
loumari@eventus-international.com
+27 82 907 5850
This post 6 Weeks until the Scandinavian & Nordic Gaming Show 2026: Comm100 on AI-Powered Player Engagement first appeared on BitcoinWorld.
6 Weeks Until the Scandinavian & Nordic Gaming Show 2026: Comm100 on AI-Powered Player Engagement
BitcoinWorld6 Weeks until the Scandinavian & Nordic Gaming Show 2026: Comm100 on AI-Powered Player Engagement
The Nordic gaming market is seeing regulatory developments in several key areas, from Finland’s preparations for a new licensing framework to Sweden’s stronger regulatory approach and Norway’s increased enforcement. The highly anticipated 8th annual Scandinavian & Nordic Gaming Show (SNGS) 2026, taking place in just 6 weeks on 22–23 October at the Radisson Blu Scandinavia Hotel in Copenhagen, Denmark, will give regulators, operators, providers and investors a platform to discuss the implications of these developments for the industry.
Exhibitor Spotlight: Comm100
SNGS 2026 welcomes Comm100 as an exhibitor for the event’s 8th edition.
Comm100 helps businesses level up their self-serve and human-assisted customer service with AI-driven speed and efficiency. The platform enables businesses to meet their customers where and when they prefer, accelerating resolution with powerful AI agents and enhancements that help everyone get on with their day.
From automated, context-aware support to real-time human assistance, onboarding, and evaluation, Comm100’s solutions are designed with a singular goal in mind: to shorten the path between question and answer.
Learn more about Comm100: https://www.comm100.com/
Exclusive Insights with the Comm100 Team
The team described how its platform supports gaming operators across different customer service channels and player interactions:
“Comm100 is an AI-powered player engagement platform that unifies live chat, email, messaging apps, and ticketing.
AI agents handle routine player queries as the first line of support, and complex cases and high-value players are escalated to live agents with full player context and gaming-specific response suggestions. The platform is used by more than 1,200 international operators, platform providers and BPOs.”
They also outlined the AI and automation tools available across the customer support lifecycle:
“Comm100 offers a suite of AI solutions to empower CS teams across the full support lifecycle:
AI Agent: autonomous AI chatbot that can handle up to 80% of incoming queries
AI Copilot: offers suggestions, responses, and helpful actions to human agents
AI Knowledge: automates knowledge base management, including drafting new articles
AI QA: auto-scores conversations and turns the findings into coaching moments
AI Training: converts that material into simulation-based scenarios and quizzes
AI Insights: reads resolution, sentiment and churn signals across the whole operation
Responsible gambling: Identifying markers of harm, live monitoring, and detailed reporting”
On what Comm100 considers the biggest customer experience challenges facing gaming operators across the Scandinavian and Nordic markets today:
“Regulatory divergence is the immediate pressure. Finland is moving from a state monopoly to a competitive licensing model, Sweden is tightening consumer protection rules inside an already licensed market, and Norway is further adding harm-prevention measures and doubling down on responsible gambling, so operators running across the region are supporting players under three different sets of obligations at once.”
The team further discussed where automation can take on routine player support tasks and where human involvement is still required:
“The biggest upside gains for automation lie in high-volume, repeatable questions: account balances, game rules, promotion eligibility, withdrawal timelines and bonus activation. Automating those requests with no-code workflows frees agents to focus on VIP retention and the cases that need judgment.
Human input stays essential wherever the outcome affects a player’s money, their account status or their wellbeing.”
Lastly, Comm100 commented on the emerging customer service and AI trends they believe will have the biggest impact on the Nordic gaming industry:
“Responsible gambling technology is shifting from retrospective analysis to real-time action, and support conversations are the richest untapped source of risk signals operators already hold. Integrating support systems with responsible gambling solutions is likely a barrier.
The second shift is AI-assisted quality assurance, where every conversation can be reviewed against an operator’s own guidelines.”
Who Will Take Home an SNGS Eventus Award?
Nominations are now open for the SNGS Eventus Awards 2026, taking place during SNGS 2026 on the evening of 22 October 2026.
This is an opportunity to recognise the individuals and organisations making a notable contribution to the region’s gaming industry through leadership, innovation and outstanding achievement.
Entries close on 9 October 2026, ahead of the shortlist announcement on 14 October 2026.
Nominate a leader: https://www.eventus-international.com/sngs-award-nominations
Attend, Sponsor or Exhibit
Delegate, sponsorship and exhibition opportunities are available at the 8th annual SNGS 2026, offering organisations the opportunity to raise their profile, connect with the region’s gaming community and build relationships with key industry stakeholders.
To secure a place, register here: https://www.eventus-international.com/sngs
For sponsorship or exhibition enquiries, contact:
Lou-Mari Burnett, Chief Operating Officer, Eventus International
loumari@eventus-international.com
+27 82 907 5850
This post 6 Weeks until the Scandinavian & Nordic Gaming Show 2026: Comm100 on AI-Powered Player Engagement first appeared on BitcoinWorld.
The Nordic gaming market is seeing regulatory developments in several key areas, from Finland’s preparations for a new licensing framework to Sweden’s stronger regulatory approach and Norway’s increased enforcement. The highly anticipated 8th annual Scandinavian & Nordic Gaming Show (SNGS) 2026, taking place in just 6 weeks on 22–23 October at the Radisson Blu Scandinavia Hotel in Copenhagen, Denmark, will give regulators, operators, providers and investors a platform to discuss the implications of these developments for the industry.
Exhibitor Spotlight: Comm100
SNGS 2026 welcomes Comm100 as an exhibitor for the event’s 8th edition.
Comm100 helps businesses level up their self-serve and human-assisted customer service with AI-driven speed and efficiency. The platform enables businesses to meet their customers where and when they prefer, accelerating resolution with powerful AI agents and enhancements that help everyone get on with their day.
From automated, context-aware support to real-time human assistance, onboarding, and evaluation, Comm100’s solutions are designed with a singular goal in mind: to shorten the path between question and answer.
Learn more about Comm100: https://www.comm100.com/
Exclusive Insights with the Comm100 Team
The team described how its platform supports gaming operators across different customer service channels and player interactions:
“Comm100 is an AI-powered player engagement platform that unifies live chat, email, messaging apps, and ticketing.
AI agents handle routine player queries as the first line of support, and complex cases and high-value players are escalated to live agents with full player context and gaming-specific response suggestions. The platform is used by more than 1,200 international operators, platform providers and BPOs.”
They also outlined the AI and automation tools available across the customer support lifecycle:
“Comm100 offers a suite of AI solutions to empower CS teams across the full support lifecycle:
AI Agent: autonomous AI chatbot that can handle up to 80% of incoming queries
AI Copilot: offers suggestions, responses, and helpful actions to human agents
AI Knowledge: automates knowledge base management, including drafting new articles
AI QA: auto-scores conversations and turns the findings into coaching moments
AI Training: converts that material into simulation-based scenarios and quizzes
AI Insights: reads resolution, sentiment and churn signals across the whole operation
Responsible gambling: Identifying markers of harm, live monitoring, and detailed reporting”
On what Comm100 considers the biggest customer experience challenges facing gaming operators across the Scandinavian and Nordic markets today:
“Regulatory divergence is the immediate pressure. Finland is moving from a state monopoly to a competitive licensing model, Sweden is tightening consumer protection rules inside an already licensed market, and Norway is further adding harm-prevention measures and doubling down on responsible gambling, so operators running across the region are supporting players under three different sets of obligations at once.”
The team further discussed where automation can take on routine player support tasks and where human involvement is still required:
“The biggest upside gains for automation lie in high-volume, repeatable questions: account balances, game rules, promotion eligibility, withdrawal timelines and bonus activation. Automating those requests with no-code workflows frees agents to focus on VIP retention and the cases that need judgment.
Human input stays essential wherever the outcome affects a player’s money, their account status or their wellbeing.”
Lastly, Comm100 commented on the emerging customer service and AI trends they believe will have the biggest impact on the Nordic gaming industry:
“Responsible gambling technology is shifting from retrospective analysis to real-time action, and support conversations are the richest untapped source of risk signals operators already hold. Integrating support systems with responsible gambling solutions is likely a barrier.
The second shift is AI-assisted quality assurance, where every conversation can be reviewed against an operator’s own guidelines.”
Who Will Take Home an SNGS Eventus Award?
Nominations are now open for the SNGS Eventus Awards 2026, taking place during SNGS 2026 on the evening of 22 October 2026.
This is an opportunity to recognise the individuals and organisations making a notable contribution to the region’s gaming industry through leadership, innovation and outstanding achievement.
Entries close on 9 October 2026, ahead of the shortlist announcement on 14 October 2026.
Nominate a leader: https://www.eventus-international.com/sngs-award-nominations
Attend, Sponsor or Exhibit
Delegate, sponsorship and exhibition opportunities are available at the 8th annual SNGS 2026, offering organisations the opportunity to raise their profile, connect with the region’s gaming community and build relationships with key industry stakeholders.
To secure a place, register here: https://www.eventus-international.com/sngs
For sponsorship or exhibition enquiries, contact:
Lou-Mari Burnett, Chief Operating Officer, Eventus International
loumari@eventus-international.com
+27 82 907 5850
This post 6 Weeks until the Scandinavian & Nordic Gaming Show 2026: Comm100 on AI-Powered Player Engagement first appeared on BitcoinWorld.
37
·
--
Article
Why India’s CBI Just Told Crypto Users to Rethink Every P2P TradeBitcoinWorldWhy India’s CBI Just Told Crypto Users to Rethink Every P2P Trade
Key Takeaways
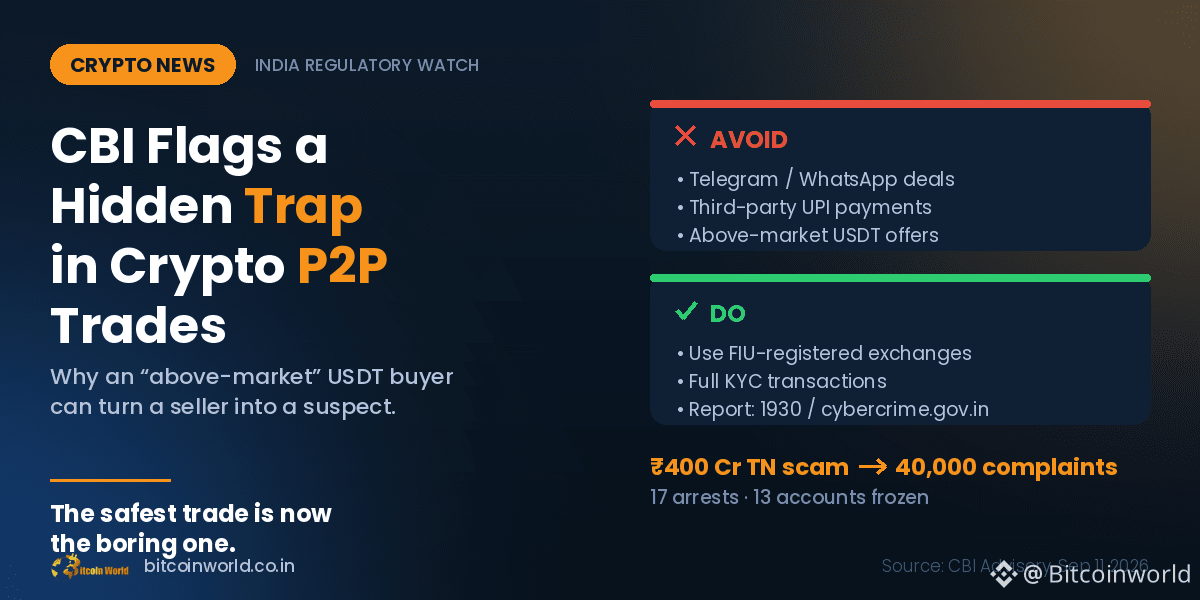
On September 11, India’s Central Bureau of Investigation warned that peer-to-peer crypto trades settled over UPI can quietly turn ordinary sellers into fraud suspects.
The red flag it singled out: buyers offering above-market rates for USDT, often the sign of dirty money looking for a clean exit.
The advice is blunt – stick to FIU-registered exchanges, skip Telegram/WhatsApp deals, and never accept third-party payments.
There’s a quiet trap sitting inside one of crypto’s most convenient features, and India’s top investigative agency has now named it out loud. When you sell USDT to a stranger and they pay you through UPI, you’re trusting that the rupees hitting your account are clean. Increasingly, they aren’t.
Why this matters.
Under India’s anti-money-laundering framework, the account that receives fraud proceeds gets flagged, frozen, and questioned – even if the seller had no idea. A P2P trade that nets you a slightly better price can end with a lien on your bank account and a police visit. The CBI’s core message is that convenience and legal exposure now travel together.
The tell is almost always the same: a buyer willing to overpay. Nobody pays above market to move Tether unless they’re desperate to launder funds, and the CBI is essentially telling retail users to treat generosity as a warning sign, not a bargain.
The timeline.
August 31, 2026 – Tamil Nadu’s Economic Offences Wing takes over a roughly ₹400-crore case spanning Madurai, Virudhunagar, Dindigul, and Sivagangai. Operating under names like “FQL Investment Trading” and “VG Investment Group Syndicate,” agents promised money would double in 40–45 days, collected cash and UPI, funneled it into USDT, then switched the app off. Seventeen arrests, thirteen frozen accounts, and around 40,000 complaints followed.
September 11, 2026 – The CBI publishes its national advisory, pointing users to helpline 1930 and cybercrime.gov.in.
The connection isn’t coincidental. The Tamil Nadu scam shows the full laundering loop – victim rupees in, USDT out – and P2P sellers are the unwitting final link that converts scam money back into “legitimate” bank balances.
Expert read.
India already routes compliant activity through FIU-registered platforms under the PMLA. What’s new here is the shift from regulating exchanges to warning individuals. The state is signaling that “I didn’t know” won’t shield anyone whose account touched tainted funds. On-chain, USDT is fully traceable; the weak point is the fiat off-ramp, which is exactly where enforcement is now aiming.
What comes next.
Expect tighter UPI monitoring on crypto-linked transfers, more account freezes triggered by chargeback complaints, and steady pressure pushing volume off informal P2P desks toward regulated venues. The gray-market spread that made P2P attractive may simply stop being worth the risk.
Conclusion.
The CBI isn’t banning anything – it’s redrawing where responsibility sits. In India’s crypto market, the safest trade is now the boring, fully-KYC’d one on a registered exchange. A few rupees of “extra” profit is no longer worth becoming someone else’s alibi.
This post Why India’s CBI Just Told Crypto Users to Rethink Every P2P Trade first appeared on BitcoinWorld.
Why India’s CBI Just Told Crypto Users to Rethink Every P2P Trade
BitcoinWorldWhy India’s CBI Just Told Crypto Users to Rethink Every P2P Trade
Key Takeaways
On September 11, India’s Central Bureau of Investigation warned that peer-to-peer crypto trades settled over UPI can quietly turn ordinary sellers into fraud suspects.
The red flag it singled out: buyers offering above-market rates for USDT, often the sign of dirty money looking for a clean exit.
The advice is blunt – stick to FIU-registered exchanges, skip Telegram/WhatsApp deals, and never accept third-party payments.
There’s a quiet trap sitting inside one of crypto’s most convenient features, and India’s top investigative agency has now named it out loud. When you sell USDT to a stranger and they pay you through UPI, you’re trusting that the rupees hitting your account are clean. Increasingly, they aren’t.
Why this matters.
Under India’s anti-money-laundering framework, the account that receives fraud proceeds gets flagged, frozen, and questioned – even if the seller had no idea. A P2P trade that nets you a slightly better price can end with a lien on your bank account and a police visit. The CBI’s core message is that convenience and legal exposure now travel together.
The tell is almost always the same: a buyer willing to overpay. Nobody pays above market to move Tether unless they’re desperate to launder funds, and the CBI is essentially telling retail users to treat generosity as a warning sign, not a bargain.
The timeline.
August 31, 2026 – Tamil Nadu’s Economic Offences Wing takes over a roughly ₹400-crore case spanning Madurai, Virudhunagar, Dindigul, and Sivagangai. Operating under names like “FQL Investment Trading” and “VG Investment Group Syndicate,” agents promised money would double in 40–45 days, collected cash and UPI, funneled it into USDT, then switched the app off. Seventeen arrests, thirteen frozen accounts, and around 40,000 complaints followed.
September 11, 2026 – The CBI publishes its national advisory, pointing users to helpline 1930 and cybercrime.gov.in.
The connection isn’t coincidental. The Tamil Nadu scam shows the full laundering loop – victim rupees in, USDT out – and P2P sellers are the unwitting final link that converts scam money back into “legitimate” bank balances.
Expert read.
India already routes compliant activity through FIU-registered platforms under the PMLA. What’s new here is the shift from regulating exchanges to warning individuals. The state is signaling that “I didn’t know” won’t shield anyone whose account touched tainted funds. On-chain, USDT is fully traceable; the weak point is the fiat off-ramp, which is exactly where enforcement is now aiming.
What comes next.
Expect tighter UPI monitoring on crypto-linked transfers, more account freezes triggered by chargeback complaints, and steady pressure pushing volume off informal P2P desks toward regulated venues. The gray-market spread that made P2P attractive may simply stop being worth the risk.
Conclusion.
The CBI isn’t banning anything – it’s redrawing where responsibility sits. In India’s crypto market, the safest trade is now the boring, fully-KYC’d one on a registered exchange. A few rupees of “extra” profit is no longer worth becoming someone else’s alibi.
This post Why India’s CBI Just Told Crypto Users to Rethink Every P2P Trade first appeared on BitcoinWorld.
Key Takeaways
On September 11, India’s Central Bureau of Investigation warned that peer-to-peer crypto trades settled over UPI can quietly turn ordinary sellers into fraud suspects.
The red flag it singled out: buyers offering above-market rates for USDT, often the sign of dirty money looking for a clean exit.
The advice is blunt – stick to FIU-registered exchanges, skip Telegram/WhatsApp deals, and never accept third-party payments.
There’s a quiet trap sitting inside one of crypto’s most convenient features, and India’s top investigative agency has now named it out loud. When you sell USDT to a stranger and they pay you through UPI, you’re trusting that the rupees hitting your account are clean. Increasingly, they aren’t.
Why this matters.
Under India’s anti-money-laundering framework, the account that receives fraud proceeds gets flagged, frozen, and questioned – even if the seller had no idea. A P2P trade that nets you a slightly better price can end with a lien on your bank account and a police visit. The CBI’s core message is that convenience and legal exposure now travel together.
The tell is almost always the same: a buyer willing to overpay. Nobody pays above market to move Tether unless they’re desperate to launder funds, and the CBI is essentially telling retail users to treat generosity as a warning sign, not a bargain.
The timeline.
August 31, 2026 – Tamil Nadu’s Economic Offences Wing takes over a roughly ₹400-crore case spanning Madurai, Virudhunagar, Dindigul, and Sivagangai. Operating under names like “FQL Investment Trading” and “VG Investment Group Syndicate,” agents promised money would double in 40–45 days, collected cash and UPI, funneled it into USDT, then switched the app off. Seventeen arrests, thirteen frozen accounts, and around 40,000 complaints followed.
September 11, 2026 – The CBI publishes its national advisory, pointing users to helpline 1930 and cybercrime.gov.in.
The connection isn’t coincidental. The Tamil Nadu scam shows the full laundering loop – victim rupees in, USDT out – and P2P sellers are the unwitting final link that converts scam money back into “legitimate” bank balances.
Expert read.
India already routes compliant activity through FIU-registered platforms under the PMLA. What’s new here is the shift from regulating exchanges to warning individuals. The state is signaling that “I didn’t know” won’t shield anyone whose account touched tainted funds. On-chain, USDT is fully traceable; the weak point is the fiat off-ramp, which is exactly where enforcement is now aiming.
What comes next.
Expect tighter UPI monitoring on crypto-linked transfers, more account freezes triggered by chargeback complaints, and steady pressure pushing volume off informal P2P desks toward regulated venues. The gray-market spread that made P2P attractive may simply stop being worth the risk.
Conclusion.
The CBI isn’t banning anything – it’s redrawing where responsibility sits. In India’s crypto market, the safest trade is now the boring, fully-KYC’d one on a registered exchange. A few rupees of “extra” profit is no longer worth becoming someone else’s alibi.
This post Why India’s CBI Just Told Crypto Users to Rethink Every P2P Trade first appeared on BitcoinWorld.
189
·
--

Article
Pump.fun Vanishes From Apple’s Store in Two Countries – and No One Will Say WhyBitcoinWorldPump.fun Vanishes From Apple’s Store in Two Countries – And No One Will Say Why
Key Takeaways
Pump.fun’s iOS app disappeared from both the US and India App Stores simultaneously on September 10, 2026, while Google Play access and all existing installs and funds stayed intact.
India’s removal fits a known regulatory playbook; the US removal has no obvious legal trigger, making the timing the real mystery.
The episode underscores how much crypto app distribution depends on a single gatekeeper – Apple – regardless of what regulators formally decide.
When One App Store Blinks in Two Countries at Once
The strange part of Pump.fun’s latest setback isn’t that its app got pulled. Crypto apps get pulled all the time. The strange part is where – the United States and India, two markets with almost nothing in common in how they police digital assets, going dark on the same day, through the same platform, for reasons nobody has explained.
Carl, a mobile lead at the company, confirmed the removal on X late on September 10, stressing that anyone who already installed the app is unaffected, funds are safe, and Android users can still download it via Google Play. Apple has said nothing. The word “temporary” is Pump.fun’s characterization, not Apple’s.
Two countries, two very different stories
India’s half is easy to read. Since early 2024, the Financial Intelligence Unit has leaned on a reliable mechanism: show-cause notices under the Prevention of Money Laundering Act, followed by takedown requests routed through Apple. Binance, KuCoin, HTX and others were swept up that way. Just days earlier, on September 9, FIU-IND reportedly hit 15 more offshore providers – though notably, Pump.fun wasn’t on that list. So the tool is clearly active, even if this specific removal isn’t officially attributed to it.
The American half fits nothing. There’s no comparable app-blocking pipeline in the US, and no regulator has announced action against the platform. Yes, Judge Colleen McMahon dismissed the Securities Act claims against Baton Corporation on August 31 while letting racketeering claims proceed – but connecting that ruling to an App Store delisting would be speculation, and even the company hasn’t suggested a link.
That leaves two theories: a single Apple-side decision applied across both markets, or two unrelated actions that happened to land together. The first is tidier. The second would be an unusual coincidence.
Why this matters
This is a recurring lesson the industry keeps relearning: the last mile of crypto distribution runs through Apple and Google, not through smart contracts. Pump.fun already restricted UK users itself in December 2024 after an FCA warning. The protocol is permissionless; the storefront is not. A platform can quietly narrow a company’s growth funnel overnight, no court order required.
What comes next
Expect Pump.fun to push for relisting and, likely, to lean harder on web and Android channels as insurance. For the broader market, the takeaway is uncomfortable but clarifying – regulatory pressure increasingly expresses itself through app stores, where appeals are opaque and timelines uncertain.
Conclusion
Existing users are fine and funds are safe, but the growth spigot for new iOS users just tightened in two major markets at once. Until Apple or a regulator speaks, the silence itself is the story – and a reminder of how centralized crypto’s front door still is.
This post Pump.fun Vanishes From Apple’s Store in Two Countries – And No One Will Say Why first appeared on BitcoinWorld.
Pump.fun Vanishes From Apple’s Store in Two Countries – and No One Will Say Why
BitcoinWorldPump.fun Vanishes From Apple’s Store in Two Countries – And No One Will Say Why
Key Takeaways
Pump.fun’s iOS app disappeared from both the US and India App Stores simultaneously on September 10, 2026, while Google Play access and all existing installs and funds stayed intact.
India’s removal fits a known regulatory playbook; the US removal has no obvious legal trigger, making the timing the real mystery.
The episode underscores how much crypto app distribution depends on a single gatekeeper – Apple – regardless of what regulators formally decide.
When One App Store Blinks in Two Countries at Once
The strange part of Pump.fun’s latest setback isn’t that its app got pulled. Crypto apps get pulled all the time. The strange part is where – the United States and India, two markets with almost nothing in common in how they police digital assets, going dark on the same day, through the same platform, for reasons nobody has explained.
Carl, a mobile lead at the company, confirmed the removal on X late on September 10, stressing that anyone who already installed the app is unaffected, funds are safe, and Android users can still download it via Google Play. Apple has said nothing. The word “temporary” is Pump.fun’s characterization, not Apple’s.
Two countries, two very different stories
India’s half is easy to read. Since early 2024, the Financial Intelligence Unit has leaned on a reliable mechanism: show-cause notices under the Prevention of Money Laundering Act, followed by takedown requests routed through Apple. Binance, KuCoin, HTX and others were swept up that way. Just days earlier, on September 9, FIU-IND reportedly hit 15 more offshore providers – though notably, Pump.fun wasn’t on that list. So the tool is clearly active, even if this specific removal isn’t officially attributed to it.
The American half fits nothing. There’s no comparable app-blocking pipeline in the US, and no regulator has announced action against the platform. Yes, Judge Colleen McMahon dismissed the Securities Act claims against Baton Corporation on August 31 while letting racketeering claims proceed – but connecting that ruling to an App Store delisting would be speculation, and even the company hasn’t suggested a link.
That leaves two theories: a single Apple-side decision applied across both markets, or two unrelated actions that happened to land together. The first is tidier. The second would be an unusual coincidence.
Why this matters
This is a recurring lesson the industry keeps relearning: the last mile of crypto distribution runs through Apple and Google, not through smart contracts. Pump.fun already restricted UK users itself in December 2024 after an FCA warning. The protocol is permissionless; the storefront is not. A platform can quietly narrow a company’s growth funnel overnight, no court order required.
What comes next
Expect Pump.fun to push for relisting and, likely, to lean harder on web and Android channels as insurance. For the broader market, the takeaway is uncomfortable but clarifying – regulatory pressure increasingly expresses itself through app stores, where appeals are opaque and timelines uncertain.
Conclusion
Existing users are fine and funds are safe, but the growth spigot for new iOS users just tightened in two major markets at once. Until Apple or a regulator speaks, the silence itself is the story – and a reminder of how centralized crypto’s front door still is.
This post Pump.fun Vanishes From Apple’s Store in Two Countries – And No One Will Say Why first appeared on BitcoinWorld.
Key Takeaways
Pump.fun’s iOS app disappeared from both the US and India App Stores simultaneously on September 10, 2026, while Google Play access and all existing installs and funds stayed intact.
India’s removal fits a known regulatory playbook; the US removal has no obvious legal trigger, making the timing the real mystery.
The episode underscores how much crypto app distribution depends on a single gatekeeper – Apple – regardless of what regulators formally decide.
When One App Store Blinks in Two Countries at Once
The strange part of Pump.fun’s latest setback isn’t that its app got pulled. Crypto apps get pulled all the time. The strange part is where – the United States and India, two markets with almost nothing in common in how they police digital assets, going dark on the same day, through the same platform, for reasons nobody has explained.
Carl, a mobile lead at the company, confirmed the removal on X late on September 10, stressing that anyone who already installed the app is unaffected, funds are safe, and Android users can still download it via Google Play. Apple has said nothing. The word “temporary” is Pump.fun’s characterization, not Apple’s.
Two countries, two very different stories
India’s half is easy to read. Since early 2024, the Financial Intelligence Unit has leaned on a reliable mechanism: show-cause notices under the Prevention of Money Laundering Act, followed by takedown requests routed through Apple. Binance, KuCoin, HTX and others were swept up that way. Just days earlier, on September 9, FIU-IND reportedly hit 15 more offshore providers – though notably, Pump.fun wasn’t on that list. So the tool is clearly active, even if this specific removal isn’t officially attributed to it.
The American half fits nothing. There’s no comparable app-blocking pipeline in the US, and no regulator has announced action against the platform. Yes, Judge Colleen McMahon dismissed the Securities Act claims against Baton Corporation on August 31 while letting racketeering claims proceed – but connecting that ruling to an App Store delisting would be speculation, and even the company hasn’t suggested a link.
That leaves two theories: a single Apple-side decision applied across both markets, or two unrelated actions that happened to land together. The first is tidier. The second would be an unusual coincidence.
Why this matters
This is a recurring lesson the industry keeps relearning: the last mile of crypto distribution runs through Apple and Google, not through smart contracts. Pump.fun already restricted UK users itself in December 2024 after an FCA warning. The protocol is permissionless; the storefront is not. A platform can quietly narrow a company’s growth funnel overnight, no court order required.
What comes next
Expect Pump.fun to push for relisting and, likely, to lean harder on web and Android channels as insurance. For the broader market, the takeaway is uncomfortable but clarifying – regulatory pressure increasingly expresses itself through app stores, where appeals are opaque and timelines uncertain.
Conclusion
Existing users are fine and funds are safe, but the growth spigot for new iOS users just tightened in two major markets at once. Until Apple or a regulator speaks, the silence itself is the story – and a reminder of how centralized crypto’s front door still is.
This post Pump.fun Vanishes From Apple’s Store in Two Countries – And No One Will Say Why first appeared on BitcoinWorld.
534
·
--

Article
Alpha Ladder WealthX Among Asia’s First to Bring XStocks US Tokenised Equities to Institutional a...BitcoinWorldAlpha Ladder WealthX Among Asia’s First to Bring xStocks US Tokenised Equities to Institutional and Accredited Investors
Alpha Ladder WealthX, Asia’s leading Web2.5 wealth management platform, expands into tokenised global equities, building on the group’s Memorandum of Understanding with Payward, developer of xStocks framework and parent company of Kraken
SINGAPORE, Sept. 11, 2026 /PRNewswire/ — Alpha Ladder Finance Pte. Ltd. (Alpha Ladder), through Alpha Ladder WealthX, Asia’s leading Web2.5 wealth management platform, today launched access to Payward’s xStocks tokenised equities for institutional and accredited investors in selected markets in the region, making Alpha Ladder one of the first licensed wealth management firms in Asia to offer such access.
The launch follows the recent Memorandum of Understanding (MOU) between Alpha Ladder, MetaComp and Payward to advance tokenised capital markets across APAC. Under the collaboration, Alpha Ladder will serve as a distribution partner for xStocks offering in selected regional markets.
Through Alpha Ladder WealthX, Alpha Ladder will distribute xStocks to institutional and accredited investors in the region, subject to applicable eligibility, onboarding and compliance requirements.
The launch extends Alpha Ladder’s WealthX beyond traditional investment products into one of the fastest-growing areas of digital capital markets, giving eligible investors access to tokenised global equities through an established wealth management relationship.
xStocks brings publicly listed equities onto blockchain infrastructure through fully collateralised, 1:1-backed tokens, combining exposure to global equities with round-the-clock availability and digital-native settlement. According to Dune analytics data[1], xStocks lists over 700 assets, and have processed more than US$40 billion in combined transaction volume, with more than 200,000 unique holders globally.
The launch comes as tokenised securities gain increasing traction among institutional investors. Tokenised equities are among the fastest-growing segments of the broader Real-World Asset (RWA) market, with on-chain RWA value reaching approximately US$19.3 billion as of end-March 2026, up from approximately US$5.4 billion in January 2025, according to Coin Gecko.
Institutional interest in tokenised assets is also rising. According to the 2026 EY and Coinbase Institutional Investor Survey, 63% of institutional investors globally said their firms were very interested in tokenised assets, up from 57% a year earlier. McKinsey also estimates that total tokenised market capitalisation could reach approximately US$2 trillion by 2030, excluding cryptocurrencies and stablecoins.
As tokenisation moves further into mainstream capital markets, the focus is increasingly shifting from whether financial assets can be brought on-chain to how they can be accessed through financial channels that meet institutional expectations around governance, onboarding and compliance.
The launch of xStocks through Alpha Ladder WealthX marks a further expansion of Alpha Ladder’s RWA offering, broadening access to tokenised global equities for institutional and accredited investors across APAC.
Alpha Ladder, MetaComp and Payward will continue to explore further tokenisation opportunities in the region, including additional products, counterparties and use cases, drawing on their respective capabilities across capital markets, digital asset infrastructure and institutional distribution.
About Alpha Ladder Finance (Alpha Ladder)
Alpha Ladder Finance Pte Ltd (Alpha Ladder) is Singapore’s leading Real-World Asset (RWA) exchange, brokerage, and custody platform, licensed by the Monetary Authority of Singapore (MAS) as a Capital Markets Services (CMS) licensee. With its patented NFDT® (Non-Fungible Digital Twin) framework, multi-cloud MPC wallets, and a rigorous on-chain KYT engine, Alpha Ladder provides institutional-grade infrastructure for tokenisation, trading, and liquidity—bridging traditional finance with digital innovation.
For more information about Alpha Ladder, please visit https://www.alphaladderfin.com, or follow Alpha Ladder on LinkedIn @AlphaLadderFinance and X @AlphaLadderFin
About MetaComp
MetaComp Pte Ltd (“MetaComp”) is a Singapore-headquartered payments company building an interoperable financial platform for global payments. As a Major Payment Institution licensed by the Monetary Authority of Singapore, we make payments easier and more resilient, connecting fiat and stablecoin rails, so when SWIFT is not viable, stablecoins provide an alternative
Compliant and agentic by design, MetaComp’s StableX Network enables institutions and businesses to move, convert, and manage capital across fiat and stablecoin rails within one compliant Web2.5 financial architecture, handling payments and collections alongside treasury and investment* access across traditional and digital asset classes. Since its launch in November 2025, StableX Network has grown to more than 1,000 members and partners, reaching more than 100,000 users.
Proprietary FX infrastructure evaluates every transaction and selects the optimal settlement pathway by rate and speed in real time. VisionX, MetaComp’s compliance intelligence engine, screens both fiat transactions and on-chain digital asset activity in one pass to support AML/CFT compliance and transaction monitoring. MetaComp’s StableX Know Your Agent (KYA) framework extends this governance to the agents themselves, ensuring every AI agent operating on the platform is identifiable, authorised, monitored and accountable across its lifecycle.
This foundation extends into our wealth* solution, with compliance intelligence built in from the start, accessible via AI agents, app, web, or API, and built for institutions and businesses alike.
These services are delivered under MetaComp’s licence from the Monetary Authority of Singapore (MAS) as a Major Payment Institution, covering Digital Payment Token Services and Cross-border Money Transfer Services. Treasury and investment services are provided through Alpha Ladder Finance Pte. Ltd., MetaComp’s MAS-regulated affiliate, which holds a Capital Markets Services licence.
For more information about MetaComp, please visit www.mce.sg, or follow MetaComp on LinkedIn MetaCompSG and X @MetaCompHQ.
*All products and/or services in relation to securities and capital market products are offered and operated solely by Alpha Ladder Finance Pte. Ltd.
Disclaimer:
*xStocks and any securities or capital markets services relating to xStocks are offered and provided by Alpha Ladder Finance Pte. Ltd. under its applicable Capital Markets Services licence. Where applicable, payment, stablecoin conversion or other Digital Payment Token-related services used in connection with access to xStocks may be provided separately by MetaComp Pte. Ltd. under its Major Payment Institution licence, subject to applicable laws and regulatory requirements.
This press release is for general information only and has not been reviewed by the Monetary Authority of Singapore. MetaComp Pte. Ltd. holds a Major Payment Institution licence. Alpha Ladder Finance Pte. Ltd. holds a Capital Markets Services licence to deal in capital markets products and provide custodial services.
xStocks are not registered under the U.S. Securities Act and are not available in the United States or to U.S. persons. Other geographic restrictions may apply.
Payward is not licensed, authorised, regulated, supervised, or otherwise approved by the Monetary Authority of Singapore and does not hold any licence, exemption, registration, or other permission under the laws of Singapore to provide regulated financial services in Singapore. xStocks are issued by Backed Assets (JE) Limited and provide economic exposure to the relevant underlying securities. Holding an xStock does not give an investor ownership of, or legal title to, the underlying shares, or voting or other direct shareholder rights. The value of xStocks may rise or fall and investors may lose all of the amount invested.
SOURCES:
1. Dune analytics xStocks dashboard — https://dune.com/xstocks/xstocks#cex-volume
2. The RWA Landscape at a Glance (Q1 2026) – https://www.coingecko.com/learn/what-are-real-world-assets-exploring-rwa-protocols
3. EY/Coinbase 2026 survey — https://www.ey.com/en_us/financial-services/institutional-digital-assets-survey
4. McKinsey: From ripples to waves: The transformational power of tokenizing assets — https://www.mckinsey.com/industries/financial-services/our-insights/from-ripples-to-waves-the-transformational-power-of-tokenizing-assets
This post Alpha Ladder WealthX Among Asia’s First to Bring xStocks US Tokenised Equities to Institutional and Accredited Investors first appeared on BitcoinWorld.
Alpha Ladder WealthX Among Asia’s First to Bring XStocks US Tokenised Equities to Institutional a...
BitcoinWorldAlpha Ladder WealthX Among Asia’s First to Bring xStocks US Tokenised Equities to Institutional and Accredited Investors
Alpha Ladder WealthX, Asia’s leading Web2.5 wealth management platform, expands into tokenised global equities, building on the group’s Memorandum of Understanding with Payward, developer of xStocks framework and parent company of Kraken
SINGAPORE, Sept. 11, 2026 /PRNewswire/ — Alpha Ladder Finance Pte. Ltd. (Alpha Ladder), through Alpha Ladder WealthX, Asia’s leading Web2.5 wealth management platform, today launched access to Payward’s xStocks tokenised equities for institutional and accredited investors in selected markets in the region, making Alpha Ladder one of the first licensed wealth management firms in Asia to offer such access.
The launch follows the recent Memorandum of Understanding (MOU) between Alpha Ladder, MetaComp and Payward to advance tokenised capital markets across APAC. Under the collaboration, Alpha Ladder will serve as a distribution partner for xStocks offering in selected regional markets.
Through Alpha Ladder WealthX, Alpha Ladder will distribute xStocks to institutional and accredited investors in the region, subject to applicable eligibility, onboarding and compliance requirements.
The launch extends Alpha Ladder’s WealthX beyond traditional investment products into one of the fastest-growing areas of digital capital markets, giving eligible investors access to tokenised global equities through an established wealth management relationship.
xStocks brings publicly listed equities onto blockchain infrastructure through fully collateralised, 1:1-backed tokens, combining exposure to global equities with round-the-clock availability and digital-native settlement. According to Dune analytics data[1], xStocks lists over 700 assets, and have processed more than US$40 billion in combined transaction volume, with more than 200,000 unique holders globally.
The launch comes as tokenised securities gain increasing traction among institutional investors. Tokenised equities are among the fastest-growing segments of the broader Real-World Asset (RWA) market, with on-chain RWA value reaching approximately US$19.3 billion as of end-March 2026, up from approximately US$5.4 billion in January 2025, according to Coin Gecko.
Institutional interest in tokenised assets is also rising. According to the 2026 EY and Coinbase Institutional Investor Survey, 63% of institutional investors globally said their firms were very interested in tokenised assets, up from 57% a year earlier. McKinsey also estimates that total tokenised market capitalisation could reach approximately US$2 trillion by 2030, excluding cryptocurrencies and stablecoins.
As tokenisation moves further into mainstream capital markets, the focus is increasingly shifting from whether financial assets can be brought on-chain to how they can be accessed through financial channels that meet institutional expectations around governance, onboarding and compliance.
The launch of xStocks through Alpha Ladder WealthX marks a further expansion of Alpha Ladder’s RWA offering, broadening access to tokenised global equities for institutional and accredited investors across APAC.
Alpha Ladder, MetaComp and Payward will continue to explore further tokenisation opportunities in the region, including additional products, counterparties and use cases, drawing on their respective capabilities across capital markets, digital asset infrastructure and institutional distribution.
About Alpha Ladder Finance (Alpha Ladder)
Alpha Ladder Finance Pte Ltd (Alpha Ladder) is Singapore’s leading Real-World Asset (RWA) exchange, brokerage, and custody platform, licensed by the Monetary Authority of Singapore (MAS) as a Capital Markets Services (CMS) licensee. With its patented NFDT® (Non-Fungible Digital Twin) framework, multi-cloud MPC wallets, and a rigorous on-chain KYT engine, Alpha Ladder provides institutional-grade infrastructure for tokenisation, trading, and liquidity—bridging traditional finance with digital innovation.
For more information about Alpha Ladder, please visit https://www.alphaladderfin.com, or follow Alpha Ladder on LinkedIn @AlphaLadderFinance and X @AlphaLadderFin
About MetaComp
MetaComp Pte Ltd (“MetaComp”) is a Singapore-headquartered payments company building an interoperable financial platform for global payments. As a Major Payment Institution licensed by the Monetary Authority of Singapore, we make payments easier and more resilient, connecting fiat and stablecoin rails, so when SWIFT is not viable, stablecoins provide an alternative
Compliant and agentic by design, MetaComp’s StableX Network enables institutions and businesses to move, convert, and manage capital across fiat and stablecoin rails within one compliant Web2.5 financial architecture, handling payments and collections alongside treasury and investment* access across traditional and digital asset classes. Since its launch in November 2025, StableX Network has grown to more than 1,000 members and partners, reaching more than 100,000 users.
Proprietary FX infrastructure evaluates every transaction and selects the optimal settlement pathway by rate and speed in real time. VisionX, MetaComp’s compliance intelligence engine, screens both fiat transactions and on-chain digital asset activity in one pass to support AML/CFT compliance and transaction monitoring. MetaComp’s StableX Know Your Agent (KYA) framework extends this governance to the agents themselves, ensuring every AI agent operating on the platform is identifiable, authorised, monitored and accountable across its lifecycle.
This foundation extends into our wealth* solution, with compliance intelligence built in from the start, accessible via AI agents, app, web, or API, and built for institutions and businesses alike.
These services are delivered under MetaComp’s licence from the Monetary Authority of Singapore (MAS) as a Major Payment Institution, covering Digital Payment Token Services and Cross-border Money Transfer Services. Treasury and investment services are provided through Alpha Ladder Finance Pte. Ltd., MetaComp’s MAS-regulated affiliate, which holds a Capital Markets Services licence.
For more information about MetaComp, please visit www.mce.sg, or follow MetaComp on LinkedIn MetaCompSG and X @MetaCompHQ.
*All products and/or services in relation to securities and capital market products are offered and operated solely by Alpha Ladder Finance Pte. Ltd.
Disclaimer:
*xStocks and any securities or capital markets services relating to xStocks are offered and provided by Alpha Ladder Finance Pte. Ltd. under its applicable Capital Markets Services licence. Where applicable, payment, stablecoin conversion or other Digital Payment Token-related services used in connection with access to xStocks may be provided separately by MetaComp Pte. Ltd. under its Major Payment Institution licence, subject to applicable laws and regulatory requirements.
This press release is for general information only and has not been reviewed by the Monetary Authority of Singapore. MetaComp Pte. Ltd. holds a Major Payment Institution licence. Alpha Ladder Finance Pte. Ltd. holds a Capital Markets Services licence to deal in capital markets products and provide custodial services.
xStocks are not registered under the U.S. Securities Act and are not available in the United States or to U.S. persons. Other geographic restrictions may apply.
Payward is not licensed, authorised, regulated, supervised, or otherwise approved by the Monetary Authority of Singapore and does not hold any licence, exemption, registration, or other permission under the laws of Singapore to provide regulated financial services in Singapore. xStocks are issued by Backed Assets (JE) Limited and provide economic exposure to the relevant underlying securities. Holding an xStock does not give an investor ownership of, or legal title to, the underlying shares, or voting or other direct shareholder rights. The value of xStocks may rise or fall and investors may lose all of the amount invested.
SOURCES:
1. Dune analytics xStocks dashboard — https://dune.com/xstocks/xstocks#cex-volume
2. The RWA Landscape at a Glance (Q1 2026) – https://www.coingecko.com/learn/what-are-real-world-assets-exploring-rwa-protocols
3. EY/Coinbase 2026 survey — https://www.ey.com/en_us/financial-services/institutional-digital-assets-survey
4. McKinsey: From ripples to waves: The transformational power of tokenizing assets — https://www.mckinsey.com/industries/financial-services/our-insights/from-ripples-to-waves-the-transformational-power-of-tokenizing-assets
This post Alpha Ladder WealthX Among Asia’s First to Bring xStocks US Tokenised Equities to Institutional and Accredited Investors first appeared on BitcoinWorld.
Alpha Ladder WealthX, Asia’s leading Web2.5 wealth management platform, expands into tokenised global equities, building on the group’s Memorandum of Understanding with Payward, developer of xStocks framework and parent company of Kraken
SINGAPORE, Sept. 11, 2026 /PRNewswire/ — Alpha Ladder Finance Pte. Ltd. (Alpha Ladder), through Alpha Ladder WealthX, Asia’s leading Web2.5 wealth management platform, today launched access to Payward’s xStocks tokenised equities for institutional and accredited investors in selected markets in the region, making Alpha Ladder one of the first licensed wealth management firms in Asia to offer such access.
The launch follows the recent Memorandum of Understanding (MOU) between Alpha Ladder, MetaComp and Payward to advance tokenised capital markets across APAC. Under the collaboration, Alpha Ladder will serve as a distribution partner for xStocks offering in selected regional markets.
Through Alpha Ladder WealthX, Alpha Ladder will distribute xStocks to institutional and accredited investors in the region, subject to applicable eligibility, onboarding and compliance requirements.
The launch extends Alpha Ladder’s WealthX beyond traditional investment products into one of the fastest-growing areas of digital capital markets, giving eligible investors access to tokenised global equities through an established wealth management relationship.
xStocks brings publicly listed equities onto blockchain infrastructure through fully collateralised, 1:1-backed tokens, combining exposure to global equities with round-the-clock availability and digital-native settlement. According to Dune analytics data[1], xStocks lists over 700 assets, and have processed more than US$40 billion in combined transaction volume, with more than 200,000 unique holders globally.
The launch comes as tokenised securities gain increasing traction among institutional investors. Tokenised equities are among the fastest-growing segments of the broader Real-World Asset (RWA) market, with on-chain RWA value reaching approximately US$19.3 billion as of end-March 2026, up from approximately US$5.4 billion in January 2025, according to Coin Gecko.
Institutional interest in tokenised assets is also rising. According to the 2026 EY and Coinbase Institutional Investor Survey, 63% of institutional investors globally said their firms were very interested in tokenised assets, up from 57% a year earlier. McKinsey also estimates that total tokenised market capitalisation could reach approximately US$2 trillion by 2030, excluding cryptocurrencies and stablecoins.
As tokenisation moves further into mainstream capital markets, the focus is increasingly shifting from whether financial assets can be brought on-chain to how they can be accessed through financial channels that meet institutional expectations around governance, onboarding and compliance.
The launch of xStocks through Alpha Ladder WealthX marks a further expansion of Alpha Ladder’s RWA offering, broadening access to tokenised global equities for institutional and accredited investors across APAC.
Alpha Ladder, MetaComp and Payward will continue to explore further tokenisation opportunities in the region, including additional products, counterparties and use cases, drawing on their respective capabilities across capital markets, digital asset infrastructure and institutional distribution.
About Alpha Ladder Finance (Alpha Ladder)
Alpha Ladder Finance Pte Ltd (Alpha Ladder) is Singapore’s leading Real-World Asset (RWA) exchange, brokerage, and custody platform, licensed by the Monetary Authority of Singapore (MAS) as a Capital Markets Services (CMS) licensee. With its patented NFDT® (Non-Fungible Digital Twin) framework, multi-cloud MPC wallets, and a rigorous on-chain KYT engine, Alpha Ladder provides institutional-grade infrastructure for tokenisation, trading, and liquidity—bridging traditional finance with digital innovation.
For more information about Alpha Ladder, please visit https://www.alphaladderfin.com, or follow Alpha Ladder on LinkedIn @AlphaLadderFinance and X @AlphaLadderFin
About MetaComp
MetaComp Pte Ltd (“MetaComp”) is a Singapore-headquartered payments company building an interoperable financial platform for global payments. As a Major Payment Institution licensed by the Monetary Authority of Singapore, we make payments easier and more resilient, connecting fiat and stablecoin rails, so when SWIFT is not viable, stablecoins provide an alternative
Compliant and agentic by design, MetaComp’s StableX Network enables institutions and businesses to move, convert, and manage capital across fiat and stablecoin rails within one compliant Web2.5 financial architecture, handling payments and collections alongside treasury and investment* access across traditional and digital asset classes. Since its launch in November 2025, StableX Network has grown to more than 1,000 members and partners, reaching more than 100,000 users.
Proprietary FX infrastructure evaluates every transaction and selects the optimal settlement pathway by rate and speed in real time. VisionX, MetaComp’s compliance intelligence engine, screens both fiat transactions and on-chain digital asset activity in one pass to support AML/CFT compliance and transaction monitoring. MetaComp’s StableX Know Your Agent (KYA) framework extends this governance to the agents themselves, ensuring every AI agent operating on the platform is identifiable, authorised, monitored and accountable across its lifecycle.
This foundation extends into our wealth* solution, with compliance intelligence built in from the start, accessible via AI agents, app, web, or API, and built for institutions and businesses alike.
These services are delivered under MetaComp’s licence from the Monetary Authority of Singapore (MAS) as a Major Payment Institution, covering Digital Payment Token Services and Cross-border Money Transfer Services. Treasury and investment services are provided through Alpha Ladder Finance Pte. Ltd., MetaComp’s MAS-regulated affiliate, which holds a Capital Markets Services licence.
For more information about MetaComp, please visit www.mce.sg, or follow MetaComp on LinkedIn MetaCompSG and X @MetaCompHQ.
*All products and/or services in relation to securities and capital market products are offered and operated solely by Alpha Ladder Finance Pte. Ltd.
Disclaimer:
*xStocks and any securities or capital markets services relating to xStocks are offered and provided by Alpha Ladder Finance Pte. Ltd. under its applicable Capital Markets Services licence. Where applicable, payment, stablecoin conversion or other Digital Payment Token-related services used in connection with access to xStocks may be provided separately by MetaComp Pte. Ltd. under its Major Payment Institution licence, subject to applicable laws and regulatory requirements.
This press release is for general information only and has not been reviewed by the Monetary Authority of Singapore. MetaComp Pte. Ltd. holds a Major Payment Institution licence. Alpha Ladder Finance Pte. Ltd. holds a Capital Markets Services licence to deal in capital markets products and provide custodial services.
xStocks are not registered under the U.S. Securities Act and are not available in the United States or to U.S. persons. Other geographic restrictions may apply.
Payward is not licensed, authorised, regulated, supervised, or otherwise approved by the Monetary Authority of Singapore and does not hold any licence, exemption, registration, or other permission under the laws of Singapore to provide regulated financial services in Singapore. xStocks are issued by Backed Assets (JE) Limited and provide economic exposure to the relevant underlying securities. Holding an xStock does not give an investor ownership of, or legal title to, the underlying shares, or voting or other direct shareholder rights. The value of xStocks may rise or fall and investors may lose all of the amount invested.
SOURCES:
1. Dune analytics xStocks dashboard — https://dune.com/xstocks/xstocks#cex-volume
2. The RWA Landscape at a Glance (Q1 2026) – https://www.coingecko.com/learn/what-are-real-world-assets-exploring-rwa-protocols
3. EY/Coinbase 2026 survey — https://www.ey.com/en_us/financial-services/institutional-digital-assets-survey
4. McKinsey: From ripples to waves: The transformational power of tokenizing assets — https://www.mckinsey.com/industries/financial-services/our-insights/from-ripples-to-waves-the-transformational-power-of-tokenizing-assets
This post Alpha Ladder WealthX Among Asia’s First to Bring xStocks US Tokenised Equities to Institutional and Accredited Investors first appeared on BitcoinWorld.
162
·
--
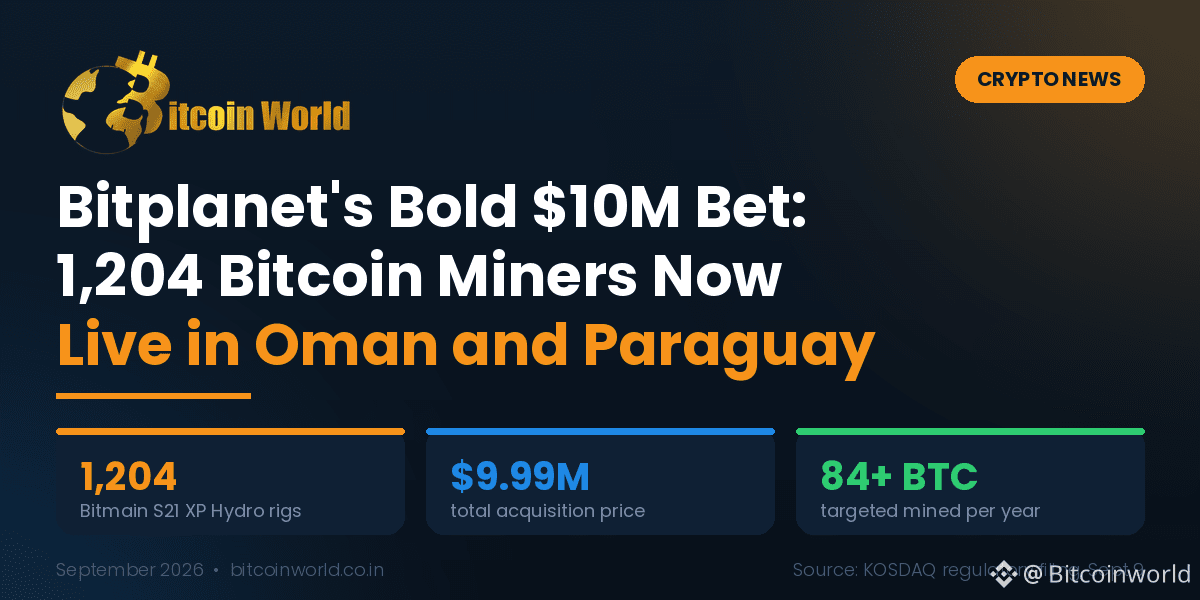
Article
BitPlanet Turns Korea’s First Bitcoin Treasury Into a Bitcoin ProducerBitcoinWorldBitPlanet Turns Korea’s First Bitcoin Treasury Into a Bitcoin Producer
Key Takeaways
BitPlanet paid $9,999,228 (about ₩13.4 billion) for 1,204 Bitmain hydro-cooled rigs, now live in Oman and Paraguay.
The 0.86 EH/s fleet could produce nearly double its 7 BTC monthly target at current difficulty; the guidance looks net of costs.
Korea’s first regulated Bitcoin treasury company is shifting from buying coins to producing them, with mined BTC booked as revenue.
Why a treasury company stopped paying spot
A corporate Bitcoin treasury grows only as fast as it can raise cash and buy at market. BitPlanet, the former SGA Co. bought out by a Sora Ventures-led consortium a year ago this week, holds 300 BTC at last count against a 10,000 BTC ambition. Wednesday’s filing adds a second engine. Mined coins will be booked as revenue, and CEO Lee Sung-hoon said outside lawyers and accountants were needed on contracts, disclosures and currency procedures for lack of domestic precedent. Other KOSDAQ names will copy that template.
The fleet, by the numbers
The 454 S21 XP Hydro (473 TH/s) and 750 S21e XP Hydro (860 TH/s) units deliver roughly 860 PH/s, about 0.09% of a network running near 930 EH/s. At current difficulty, that is nearly 13 BTC a month at full uptime. BitPlanet is guiding to 7. The gap likely reflects hosting fees, joint-venture splits and downtime: management is quoting net output.
Hashprice spent most of spring and summer between $30 and $33 per PH/s per day, a level Hashrate Index calls breakeven or worse for many operators, before bouncing about 22% in a month as Bitcoin recovered into the high $70,000s. VanEck estimates May’s miner revenue fell 26% year on year, with incumbents selling coins and diverting power to AI. BitPlanet bought hashrate while the industry was offloading it, and at 12 to 13 J/TH its rigs would be among the last switched off if margins compress. Splitting the fleet between Omani gas and Paraguayan hydro hedges energy and political risk.
Timeline
Sept 11, 2025: $50M consortium buyout of SGA completed; rebrand to BitPlanet
Oct 26, 2025: First regulated purchase, 93 BTC
Feb 26, 2026: Treasury reaches 300 BTC
June 25, 2026: Antalpha MOU; ₩15 billion equipment plan announced
Sept 9, 2026: Completion disclosed; 1,204 rigs deployed
What comes next
Eighty-four BTC a year would lift holdings nearly 30% annually without touching capital markets, meaningful but far short of 10,000. A second phase is likely if the joint ventures perform, and the Sora consortium’s other listed names will watch the accounting as closely as the coin count.
Conclusion
BitPlanet has used a routine filing to answer the question hanging over every treasury company: what happens when buying at spot stops being enough. Mining is harder than accumulating, and hosting partners now matter as much as Bitcoin’s price. If the first 84 coins arrive below market cost, a 1997-vintage Korean software vendor will have shown Asia’s listed companies a second way to own Bitcoin.
This post BitPlanet Turns Korea’s First Bitcoin Treasury Into a Bitcoin Producer first appeared on BitcoinWorld.
BitPlanet Turns Korea’s First Bitcoin Treasury Into a Bitcoin Producer
BitcoinWorldBitPlanet Turns Korea’s First Bitcoin Treasury Into a Bitcoin Producer
Key Takeaways
BitPlanet paid $9,999,228 (about ₩13.4 billion) for 1,204 Bitmain hydro-cooled rigs, now live in Oman and Paraguay.
The 0.86 EH/s fleet could produce nearly double its 7 BTC monthly target at current difficulty; the guidance looks net of costs.
Korea’s first regulated Bitcoin treasury company is shifting from buying coins to producing them, with mined BTC booked as revenue.
Why a treasury company stopped paying spot
A corporate Bitcoin treasury grows only as fast as it can raise cash and buy at market. BitPlanet, the former SGA Co. bought out by a Sora Ventures-led consortium a year ago this week, holds 300 BTC at last count against a 10,000 BTC ambition. Wednesday’s filing adds a second engine. Mined coins will be booked as revenue, and CEO Lee Sung-hoon said outside lawyers and accountants were needed on contracts, disclosures and currency procedures for lack of domestic precedent. Other KOSDAQ names will copy that template.
The fleet, by the numbers
The 454 S21 XP Hydro (473 TH/s) and 750 S21e XP Hydro (860 TH/s) units deliver roughly 860 PH/s, about 0.09% of a network running near 930 EH/s. At current difficulty, that is nearly 13 BTC a month at full uptime. BitPlanet is guiding to 7. The gap likely reflects hosting fees, joint-venture splits and downtime: management is quoting net output.
Hashprice spent most of spring and summer between $30 and $33 per PH/s per day, a level Hashrate Index calls breakeven or worse for many operators, before bouncing about 22% in a month as Bitcoin recovered into the high $70,000s. VanEck estimates May’s miner revenue fell 26% year on year, with incumbents selling coins and diverting power to AI. BitPlanet bought hashrate while the industry was offloading it, and at 12 to 13 J/TH its rigs would be among the last switched off if margins compress. Splitting the fleet between Omani gas and Paraguayan hydro hedges energy and political risk.
Timeline
Sept 11, 2025: $50M consortium buyout of SGA completed; rebrand to BitPlanet
Oct 26, 2025: First regulated purchase, 93 BTC
Feb 26, 2026: Treasury reaches 300 BTC
June 25, 2026: Antalpha MOU; ₩15 billion equipment plan announced
Sept 9, 2026: Completion disclosed; 1,204 rigs deployed
What comes next
Eighty-four BTC a year would lift holdings nearly 30% annually without touching capital markets, meaningful but far short of 10,000. A second phase is likely if the joint ventures perform, and the Sora consortium’s other listed names will watch the accounting as closely as the coin count.
Conclusion
BitPlanet has used a routine filing to answer the question hanging over every treasury company: what happens when buying at spot stops being enough. Mining is harder than accumulating, and hosting partners now matter as much as Bitcoin’s price. If the first 84 coins arrive below market cost, a 1997-vintage Korean software vendor will have shown Asia’s listed companies a second way to own Bitcoin.
This post BitPlanet Turns Korea’s First Bitcoin Treasury Into a Bitcoin Producer first appeared on BitcoinWorld.
Key Takeaways
BitPlanet paid $9,999,228 (about ₩13.4 billion) for 1,204 Bitmain hydro-cooled rigs, now live in Oman and Paraguay.
The 0.86 EH/s fleet could produce nearly double its 7 BTC monthly target at current difficulty; the guidance looks net of costs.
Korea’s first regulated Bitcoin treasury company is shifting from buying coins to producing them, with mined BTC booked as revenue.
Why a treasury company stopped paying spot
A corporate Bitcoin treasury grows only as fast as it can raise cash and buy at market. BitPlanet, the former SGA Co. bought out by a Sora Ventures-led consortium a year ago this week, holds 300 BTC at last count against a 10,000 BTC ambition. Wednesday’s filing adds a second engine. Mined coins will be booked as revenue, and CEO Lee Sung-hoon said outside lawyers and accountants were needed on contracts, disclosures and currency procedures for lack of domestic precedent. Other KOSDAQ names will copy that template.
The fleet, by the numbers
The 454 S21 XP Hydro (473 TH/s) and 750 S21e XP Hydro (860 TH/s) units deliver roughly 860 PH/s, about 0.09% of a network running near 930 EH/s. At current difficulty, that is nearly 13 BTC a month at full uptime. BitPlanet is guiding to 7. The gap likely reflects hosting fees, joint-venture splits and downtime: management is quoting net output.
Hashprice spent most of spring and summer between $30 and $33 per PH/s per day, a level Hashrate Index calls breakeven or worse for many operators, before bouncing about 22% in a month as Bitcoin recovered into the high $70,000s. VanEck estimates May’s miner revenue fell 26% year on year, with incumbents selling coins and diverting power to AI. BitPlanet bought hashrate while the industry was offloading it, and at 12 to 13 J/TH its rigs would be among the last switched off if margins compress. Splitting the fleet between Omani gas and Paraguayan hydro hedges energy and political risk.
Timeline
Sept 11, 2025: $50M consortium buyout of SGA completed; rebrand to BitPlanet
Oct 26, 2025: First regulated purchase, 93 BTC
Feb 26, 2026: Treasury reaches 300 BTC
June 25, 2026: Antalpha MOU; ₩15 billion equipment plan announced
Sept 9, 2026: Completion disclosed; 1,204 rigs deployed
What comes next
Eighty-four BTC a year would lift holdings nearly 30% annually without touching capital markets, meaningful but far short of 10,000. A second phase is likely if the joint ventures perform, and the Sora consortium’s other listed names will watch the accounting as closely as the coin count.
Conclusion
BitPlanet has used a routine filing to answer the question hanging over every treasury company: what happens when buying at spot stops being enough. Mining is harder than accumulating, and hosting partners now matter as much as Bitcoin’s price. If the first 84 coins arrive below market cost, a 1997-vintage Korean software vendor will have shown Asia’s listed companies a second way to own Bitcoin.
This post BitPlanet Turns Korea’s First Bitcoin Treasury Into a Bitcoin Producer first appeared on BitcoinWorld.
1
1
302
·
--
Article
EDGE Markets Partners With Splash Sports to Bring 24/7 Banking to the $21 Million NFL Survivor Co...BitcoinWorldEDGE Markets Partners with Splash Sports to Bring 24/7 Banking to the $21 Million NFL Survivor Contest
Powered by EDGE Connect, Splash Sports players now have access to 24/7/365 fund movement, daily deposit limits of up to $1 million as they compete for Splash Sports’ $21 million guaranteed NFL Survivor contest
NEW YORK, Sept. 9, 2026 /PRNewswire/ — EDGE Markets, a financial services company purpose-built for prediction markets, gaming, and crypto, today announced a partnership with Splash Sports, the leading skill-based social sports gaming platform, to facilitate Splash’s marquee $21 million NFL survivor contest.
The agreement brings EDGE Connect, a private closed-loop settlement network, to the Splash Sports platform. This enables eligible EDGE Boost customers to fund their Splash Sports accounts with up to $1 million a day. Beyond its marquee $21 million NFL Survivor contest, Splash Sports runs contests at a range of price points, including a $3 million guaranteed contest and entries as low as $5, giving players multiple ways to compete.
Traditional account funding methods can involve lower transaction limits, processing delays and fees, which are particularly inconvenient for players moving money on nights, weekends and around Sunday kickoffs. EDGE Boost gives eligible Splash Sports users daily deposit limits of up to $1 million, real-time fund movement and a dedicated account that separates gaming capital from everyday finances. That speed matters most in Splash Sports’ 2026 NFL Survivor contest, which carries a $21 million guaranteed prize contest, a $1,000 fee per entry and up to 150 entries per player, with a new marketplace for buying and selling entry stakes and Team Entries for groups, both of which can require players to move money quickly all season.
“Capital should move on the player’s schedule, not the banks,” said Seni Thomas, Founder and CEO of EDGE Markets. “Splash Sports players are entering more lineups, trading stakes and racing Sunday deadlines, and EDGE gets them there with up to a million dollars a day, immediately.”
Splash Sports is seeing that same demand for speed from its own players. Entries are piling up ahead of the September 13 deadline. The new Marketplace and Team Entries features mean players are moving money in and out of the contest throughout the season, not just once at sign-up.
“Our players are managing more entries and more moving pieces than ever, especially with the Marketplace and Team Entries we launched this season,” said TJ Ross, Co-Founder and Co-CEO of Splash Sports. “Our players shouldn’t have to wait on their bank to keep playing. EDGE Markets makes sure the money moves just as fast as everything else we’ve built.”
This partnership builds on momentum following EDGE Markets’ recently announced partnerships with Kalshi, Polymarket and ProphetX, making Splash Sports the latest platform to adopt EDGE Connect. EDGE Markets recently closed a $29 million Series A round led by CoinFund, with participation from Indicator Ventures, Mantis VC, Stepstone Group and Bullpen Capital, to accelerate its buildout across prediction markets and gaming. Since launching EDGE Boost, the company has processed more than $2 billion in transactions.
About EDGE MarketsEDGE Markets is a U.S. financial services company that empowers users with financial transparency, supporting emerging verticals such as betting, gaming and casinos. Its original product, EDGE Boost, is the first responsible financial platform for smart bettors. It is the first betting-only debit card account that is FDIC and/or NCUA deposit insurance up to $10,000,000 or more through Cross River Bank, Member FDIC, and Participating Institutions.1
About Splash SportsSplash Sports is the leading skill-based social sports gaming platform, enabling friends and communities to compete for real money. Founded in 2021, the company has since acquired and integrated RunYourPool and OfficeFootballPool. Splash Sports operates across 35-plus states and Canada with more than 2 million active users. The company is backed by Dream Ventures, Accomplice, Boston Seed Capital, Elysian Park Ventures and Velvet Sea Ventures.
Media ContactsJustine Sacco / justine@edgemarkets.ioEdgemarkets@greenbrier.partners Andrew Bard / splashsports@dkcnews.com
Deposit accounts are held at Cross River Bank, Member FDIC, and are insured up to $250,000 per depositor. Through our relationship with IntraFi® Network Deposits℠, funds may be eligible for additional FDIC insurance coverage by being distributed across participating network banks, up to $10,000,000 in aggregate for consumer accounts enrolled in the applicable program. FDIC insurance coverage is subject to applicable terms and conditions, including account structure, account ownership categories and regulatory requirements. The EDGE Boost Visa® Debit Card is issued by Cross River Bank, Member FDIC, pursuant to a license from Visa U.S.A. Inc., and is not available to all residents of U.S. territories. Account limits and other applicable terms are described in our Terms of Service and Cardholder Agreement and CRB Account Agreement.
This post EDGE Markets Partners with Splash Sports to Bring 24/7 Banking to the $21 Million NFL Survivor Contest first appeared on BitcoinWorld.
EDGE Markets Partners With Splash Sports to Bring 24/7 Banking to the $21 Million NFL Survivor Co...
BitcoinWorldEDGE Markets Partners with Splash Sports to Bring 24/7 Banking to the $21 Million NFL Survivor Contest
Powered by EDGE Connect, Splash Sports players now have access to 24/7/365 fund movement, daily deposit limits of up to $1 million as they compete for Splash Sports’ $21 million guaranteed NFL Survivor contest
NEW YORK, Sept. 9, 2026 /PRNewswire/ — EDGE Markets, a financial services company purpose-built for prediction markets, gaming, and crypto, today announced a partnership with Splash Sports, the leading skill-based social sports gaming platform, to facilitate Splash’s marquee $21 million NFL survivor contest.
The agreement brings EDGE Connect, a private closed-loop settlement network, to the Splash Sports platform. This enables eligible EDGE Boost customers to fund their Splash Sports accounts with up to $1 million a day. Beyond its marquee $21 million NFL Survivor contest, Splash Sports runs contests at a range of price points, including a $3 million guaranteed contest and entries as low as $5, giving players multiple ways to compete.
Traditional account funding methods can involve lower transaction limits, processing delays and fees, which are particularly inconvenient for players moving money on nights, weekends and around Sunday kickoffs. EDGE Boost gives eligible Splash Sports users daily deposit limits of up to $1 million, real-time fund movement and a dedicated account that separates gaming capital from everyday finances. That speed matters most in Splash Sports’ 2026 NFL Survivor contest, which carries a $21 million guaranteed prize contest, a $1,000 fee per entry and up to 150 entries per player, with a new marketplace for buying and selling entry stakes and Team Entries for groups, both of which can require players to move money quickly all season.
“Capital should move on the player’s schedule, not the banks,” said Seni Thomas, Founder and CEO of EDGE Markets. “Splash Sports players are entering more lineups, trading stakes and racing Sunday deadlines, and EDGE gets them there with up to a million dollars a day, immediately.”
Splash Sports is seeing that same demand for speed from its own players. Entries are piling up ahead of the September 13 deadline. The new Marketplace and Team Entries features mean players are moving money in and out of the contest throughout the season, not just once at sign-up.
“Our players are managing more entries and more moving pieces than ever, especially with the Marketplace and Team Entries we launched this season,” said TJ Ross, Co-Founder and Co-CEO of Splash Sports. “Our players shouldn’t have to wait on their bank to keep playing. EDGE Markets makes sure the money moves just as fast as everything else we’ve built.”
This partnership builds on momentum following EDGE Markets’ recently announced partnerships with Kalshi, Polymarket and ProphetX, making Splash Sports the latest platform to adopt EDGE Connect. EDGE Markets recently closed a $29 million Series A round led by CoinFund, with participation from Indicator Ventures, Mantis VC, Stepstone Group and Bullpen Capital, to accelerate its buildout across prediction markets and gaming. Since launching EDGE Boost, the company has processed more than $2 billion in transactions.
About EDGE MarketsEDGE Markets is a U.S. financial services company that empowers users with financial transparency, supporting emerging verticals such as betting, gaming and casinos. Its original product, EDGE Boost, is the first responsible financial platform for smart bettors. It is the first betting-only debit card account that is FDIC and/or NCUA deposit insurance up to $10,000,000 or more through Cross River Bank, Member FDIC, and Participating Institutions.1
About Splash SportsSplash Sports is the leading skill-based social sports gaming platform, enabling friends and communities to compete for real money. Founded in 2021, the company has since acquired and integrated RunYourPool and OfficeFootballPool. Splash Sports operates across 35-plus states and Canada with more than 2 million active users. The company is backed by Dream Ventures, Accomplice, Boston Seed Capital, Elysian Park Ventures and Velvet Sea Ventures.
Media ContactsJustine Sacco / justine@edgemarkets.ioEdgemarkets@greenbrier.partners Andrew Bard / splashsports@dkcnews.com
Deposit accounts are held at Cross River Bank, Member FDIC, and are insured up to $250,000 per depositor. Through our relationship with IntraFi® Network Deposits℠, funds may be eligible for additional FDIC insurance coverage by being distributed across participating network banks, up to $10,000,000 in aggregate for consumer accounts enrolled in the applicable program. FDIC insurance coverage is subject to applicable terms and conditions, including account structure, account ownership categories and regulatory requirements. The EDGE Boost Visa® Debit Card is issued by Cross River Bank, Member FDIC, pursuant to a license from Visa U.S.A. Inc., and is not available to all residents of U.S. territories. Account limits and other applicable terms are described in our Terms of Service and Cardholder Agreement and CRB Account Agreement.
This post EDGE Markets Partners with Splash Sports to Bring 24/7 Banking to the $21 Million NFL Survivor Contest first appeared on BitcoinWorld.
Powered by EDGE Connect, Splash Sports players now have access to 24/7/365 fund movement, daily deposit limits of up to $1 million as they compete for Splash Sports’ $21 million guaranteed NFL Survivor contest
NEW YORK, Sept. 9, 2026 /PRNewswire/ — EDGE Markets, a financial services company purpose-built for prediction markets, gaming, and crypto, today announced a partnership with Splash Sports, the leading skill-based social sports gaming platform, to facilitate Splash’s marquee $21 million NFL survivor contest.
The agreement brings EDGE Connect, a private closed-loop settlement network, to the Splash Sports platform. This enables eligible EDGE Boost customers to fund their Splash Sports accounts with up to $1 million a day. Beyond its marquee $21 million NFL Survivor contest, Splash Sports runs contests at a range of price points, including a $3 million guaranteed contest and entries as low as $5, giving players multiple ways to compete.
Traditional account funding methods can involve lower transaction limits, processing delays and fees, which are particularly inconvenient for players moving money on nights, weekends and around Sunday kickoffs. EDGE Boost gives eligible Splash Sports users daily deposit limits of up to $1 million, real-time fund movement and a dedicated account that separates gaming capital from everyday finances. That speed matters most in Splash Sports’ 2026 NFL Survivor contest, which carries a $21 million guaranteed prize contest, a $1,000 fee per entry and up to 150 entries per player, with a new marketplace for buying and selling entry stakes and Team Entries for groups, both of which can require players to move money quickly all season.
“Capital should move on the player’s schedule, not the banks,” said Seni Thomas, Founder and CEO of EDGE Markets. “Splash Sports players are entering more lineups, trading stakes and racing Sunday deadlines, and EDGE gets them there with up to a million dollars a day, immediately.”
Splash Sports is seeing that same demand for speed from its own players. Entries are piling up ahead of the September 13 deadline. The new Marketplace and Team Entries features mean players are moving money in and out of the contest throughout the season, not just once at sign-up.
“Our players are managing more entries and more moving pieces than ever, especially with the Marketplace and Team Entries we launched this season,” said TJ Ross, Co-Founder and Co-CEO of Splash Sports. “Our players shouldn’t have to wait on their bank to keep playing. EDGE Markets makes sure the money moves just as fast as everything else we’ve built.”
This partnership builds on momentum following EDGE Markets’ recently announced partnerships with Kalshi, Polymarket and ProphetX, making Splash Sports the latest platform to adopt EDGE Connect. EDGE Markets recently closed a $29 million Series A round led by CoinFund, with participation from Indicator Ventures, Mantis VC, Stepstone Group and Bullpen Capital, to accelerate its buildout across prediction markets and gaming. Since launching EDGE Boost, the company has processed more than $2 billion in transactions.
About EDGE MarketsEDGE Markets is a U.S. financial services company that empowers users with financial transparency, supporting emerging verticals such as betting, gaming and casinos. Its original product, EDGE Boost, is the first responsible financial platform for smart bettors. It is the first betting-only debit card account that is FDIC and/or NCUA deposit insurance up to $10,000,000 or more through Cross River Bank, Member FDIC, and Participating Institutions.1
About Splash SportsSplash Sports is the leading skill-based social sports gaming platform, enabling friends and communities to compete for real money. Founded in 2021, the company has since acquired and integrated RunYourPool and OfficeFootballPool. Splash Sports operates across 35-plus states and Canada with more than 2 million active users. The company is backed by Dream Ventures, Accomplice, Boston Seed Capital, Elysian Park Ventures and Velvet Sea Ventures.
Media ContactsJustine Sacco / justine@edgemarkets.ioEdgemarkets@greenbrier.partners Andrew Bard / splashsports@dkcnews.com
Deposit accounts are held at Cross River Bank, Member FDIC, and are insured up to $250,000 per depositor. Through our relationship with IntraFi® Network Deposits℠, funds may be eligible for additional FDIC insurance coverage by being distributed across participating network banks, up to $10,000,000 in aggregate for consumer accounts enrolled in the applicable program. FDIC insurance coverage is subject to applicable terms and conditions, including account structure, account ownership categories and regulatory requirements. The EDGE Boost Visa® Debit Card is issued by Cross River Bank, Member FDIC, pursuant to a license from Visa U.S.A. Inc., and is not available to all residents of U.S. territories. Account limits and other applicable terms are described in our Terms of Service and Cardholder Agreement and CRB Account Agreement.
This post EDGE Markets Partners with Splash Sports to Bring 24/7 Banking to the $21 Million NFL Survivor Contest first appeared on BitcoinWorld.
171
·
--
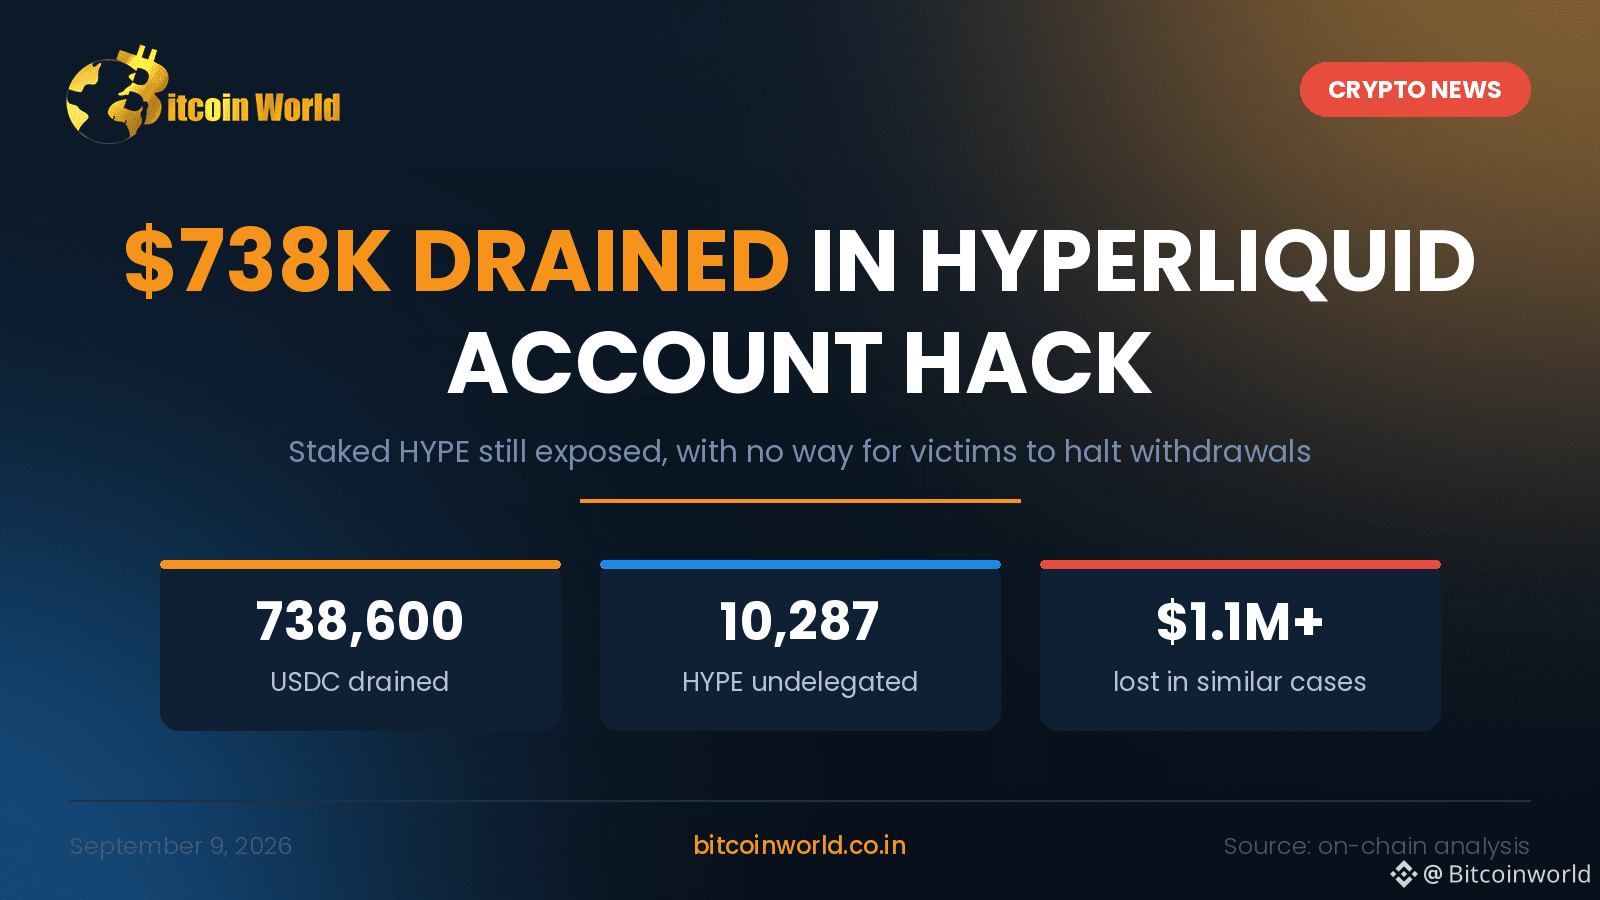
Article
Alarming Hyperliquid Hack: $738,600 USDC Drained From User AccountBitcoinWorldAlarming Hyperliquid Hack: $738,600 USDC Drained From User Account
Key Takeaways
A Hyperliquid user account was compromised on September 9, drained of roughly 738,600 USDC, with 10,287 HYPE forcibly undelegated.
Tracing shows the stolen stablecoins moved through Circle’s CCTP bridge and split across at least five hops before touching a Bitget-linked deposit address.
The staked HYPE has not entered the withdrawal queue yet, meaning the theft is only partially complete.
Two comparable cases handled recently ended the same way, pushing cumulative losses in this pattern past $1.1 million.
The Real Story Is Not the Theft. It Is the Seven Days Nobody Can Use.
Account takeovers happen weekly in crypto. What makes this one worth your attention is the part that has not happened yet.
When the attacker took control of 0x5b6d236e39a4723a8f79db93cfd1af4d228f9c60, the liquid balance went first, as it always does. The 10,287 HYPE sitting in staking is a different problem. Hyperliquid’s unstaking flow imposes a seven-day waiting period before a cWithdraw releases funds. On paper, that is a full week of warning. In practice, the victim can do absolutely nothing with it. There is no user-triggered pause, no freeze, no recovery path. The owner watches a countdown they cannot stop.
Timeline
Compromise: Unauthorized access to the account, most likely through a leaked private key or an approved signing agent.
Immediate drain: ~738,600 USDC transferred out.
Undelegation: 10,287 HYPE pulled out of delegation, positioning it for withdrawal.
Laundering: Funds routed via Circle’s CCTP bridge, then fragmented into tranches of roughly 443K, 450K, 147.5K, 147.8K and 50K across a chain of intermediary wallets.
Off-ramp: A portion lands at an address attributed to Bitget.
Now: HYPE remains in the staking balance, withdrawal not yet initiated.
What an Analyst Sees Here
The CCTP hop is deliberate. Native burn-and-mint transfers produce cleaner, harder-to-cluster flows than wrapped bridge assets, and the rapid fan-out into unequal amounts is textbook peel-chain behaviour designed to defeat automated tracing thresholds. The speed to a centralised exchange also tells you something: the attacker is betting on beating the compliance desk’s response window, not on sophisticated obfuscation.
The structural issue is that Hyperliquid inherits self-custody’s absolutism while offering an exchange-grade product. Ethereum’s smart accounts have had social recovery and guardian modules for years. A perps venue holding delegated stake has no equivalent.
What Comes Next
The proposal now on the table is an opt-in Guardian: a pre-configured party that can temporarily halt cWithdraw, transfers, agent approvals and multisig changes, but can never move funds. Holds expire automatically. Replacement requires a timelock and validator-governed review, recorded on-chain.
Expect pushback on censorship grounds, and expect it to be raised anyway once the fourth victim appears.
Conclusion
This is not a protocol exploit. Hyperliquid’s code did exactly what it was written to do. That is precisely the problem: a week-long delay that only benefits the thief is a design gap, not a security feature. Until account-level recovery becomes standard, every staked balance on a high-value venue is a one-key-away loss.
This post Alarming Hyperliquid Hack: $738,600 USDC Drained From User Account first appeared on BitcoinWorld.
Alarming Hyperliquid Hack: $738,600 USDC Drained From User Account
BitcoinWorldAlarming Hyperliquid Hack: $738,600 USDC Drained From User Account
Key Takeaways
A Hyperliquid user account was compromised on September 9, drained of roughly 738,600 USDC, with 10,287 HYPE forcibly undelegated.
Tracing shows the stolen stablecoins moved through Circle’s CCTP bridge and split across at least five hops before touching a Bitget-linked deposit address.
The staked HYPE has not entered the withdrawal queue yet, meaning the theft is only partially complete.
Two comparable cases handled recently ended the same way, pushing cumulative losses in this pattern past $1.1 million.
The Real Story Is Not the Theft. It Is the Seven Days Nobody Can Use.
Account takeovers happen weekly in crypto. What makes this one worth your attention is the part that has not happened yet.
When the attacker took control of 0x5b6d236e39a4723a8f79db93cfd1af4d228f9c60, the liquid balance went first, as it always does. The 10,287 HYPE sitting in staking is a different problem. Hyperliquid’s unstaking flow imposes a seven-day waiting period before a cWithdraw releases funds. On paper, that is a full week of warning. In practice, the victim can do absolutely nothing with it. There is no user-triggered pause, no freeze, no recovery path. The owner watches a countdown they cannot stop.
Timeline
Compromise: Unauthorized access to the account, most likely through a leaked private key or an approved signing agent.
Immediate drain: ~738,600 USDC transferred out.
Undelegation: 10,287 HYPE pulled out of delegation, positioning it for withdrawal.
Laundering: Funds routed via Circle’s CCTP bridge, then fragmented into tranches of roughly 443K, 450K, 147.5K, 147.8K and 50K across a chain of intermediary wallets.
Off-ramp: A portion lands at an address attributed to Bitget.
Now: HYPE remains in the staking balance, withdrawal not yet initiated.
What an Analyst Sees Here
The CCTP hop is deliberate. Native burn-and-mint transfers produce cleaner, harder-to-cluster flows than wrapped bridge assets, and the rapid fan-out into unequal amounts is textbook peel-chain behaviour designed to defeat automated tracing thresholds. The speed to a centralised exchange also tells you something: the attacker is betting on beating the compliance desk’s response window, not on sophisticated obfuscation.
The structural issue is that Hyperliquid inherits self-custody’s absolutism while offering an exchange-grade product. Ethereum’s smart accounts have had social recovery and guardian modules for years. A perps venue holding delegated stake has no equivalent.
What Comes Next
The proposal now on the table is an opt-in Guardian: a pre-configured party that can temporarily halt cWithdraw, transfers, agent approvals and multisig changes, but can never move funds. Holds expire automatically. Replacement requires a timelock and validator-governed review, recorded on-chain.
Expect pushback on censorship grounds, and expect it to be raised anyway once the fourth victim appears.
Conclusion
This is not a protocol exploit. Hyperliquid’s code did exactly what it was written to do. That is precisely the problem: a week-long delay that only benefits the thief is a design gap, not a security feature. Until account-level recovery becomes standard, every staked balance on a high-value venue is a one-key-away loss.
This post Alarming Hyperliquid Hack: $738,600 USDC Drained From User Account first appeared on BitcoinWorld.
Key Takeaways
A Hyperliquid user account was compromised on September 9, drained of roughly 738,600 USDC, with 10,287 HYPE forcibly undelegated.
Tracing shows the stolen stablecoins moved through Circle’s CCTP bridge and split across at least five hops before touching a Bitget-linked deposit address.
The staked HYPE has not entered the withdrawal queue yet, meaning the theft is only partially complete.
Two comparable cases handled recently ended the same way, pushing cumulative losses in this pattern past $1.1 million.
The Real Story Is Not the Theft. It Is the Seven Days Nobody Can Use.
Account takeovers happen weekly in crypto. What makes this one worth your attention is the part that has not happened yet.
When the attacker took control of 0x5b6d236e39a4723a8f79db93cfd1af4d228f9c60, the liquid balance went first, as it always does. The 10,287 HYPE sitting in staking is a different problem. Hyperliquid’s unstaking flow imposes a seven-day waiting period before a cWithdraw releases funds. On paper, that is a full week of warning. In practice, the victim can do absolutely nothing with it. There is no user-triggered pause, no freeze, no recovery path. The owner watches a countdown they cannot stop.
Timeline
Compromise: Unauthorized access to the account, most likely through a leaked private key or an approved signing agent.
Immediate drain: ~738,600 USDC transferred out.
Undelegation: 10,287 HYPE pulled out of delegation, positioning it for withdrawal.
Laundering: Funds routed via Circle’s CCTP bridge, then fragmented into tranches of roughly 443K, 450K, 147.5K, 147.8K and 50K across a chain of intermediary wallets.
Off-ramp: A portion lands at an address attributed to Bitget.
Now: HYPE remains in the staking balance, withdrawal not yet initiated.
What an Analyst Sees Here
The CCTP hop is deliberate. Native burn-and-mint transfers produce cleaner, harder-to-cluster flows than wrapped bridge assets, and the rapid fan-out into unequal amounts is textbook peel-chain behaviour designed to defeat automated tracing thresholds. The speed to a centralised exchange also tells you something: the attacker is betting on beating the compliance desk’s response window, not on sophisticated obfuscation.
The structural issue is that Hyperliquid inherits self-custody’s absolutism while offering an exchange-grade product. Ethereum’s smart accounts have had social recovery and guardian modules for years. A perps venue holding delegated stake has no equivalent.
What Comes Next
The proposal now on the table is an opt-in Guardian: a pre-configured party that can temporarily halt cWithdraw, transfers, agent approvals and multisig changes, but can never move funds. Holds expire automatically. Replacement requires a timelock and validator-governed review, recorded on-chain.
Expect pushback on censorship grounds, and expect it to be raised anyway once the fourth victim appears.
Conclusion
This is not a protocol exploit. Hyperliquid’s code did exactly what it was written to do. That is precisely the problem: a week-long delay that only benefits the thief is a design gap, not a security feature. Until account-level recovery becomes standard, every staked balance on a high-value venue is a one-key-away loss.
This post Alarming Hyperliquid Hack: $738,600 USDC Drained From User Account first appeared on BitcoinWorld.
1
502
·
--
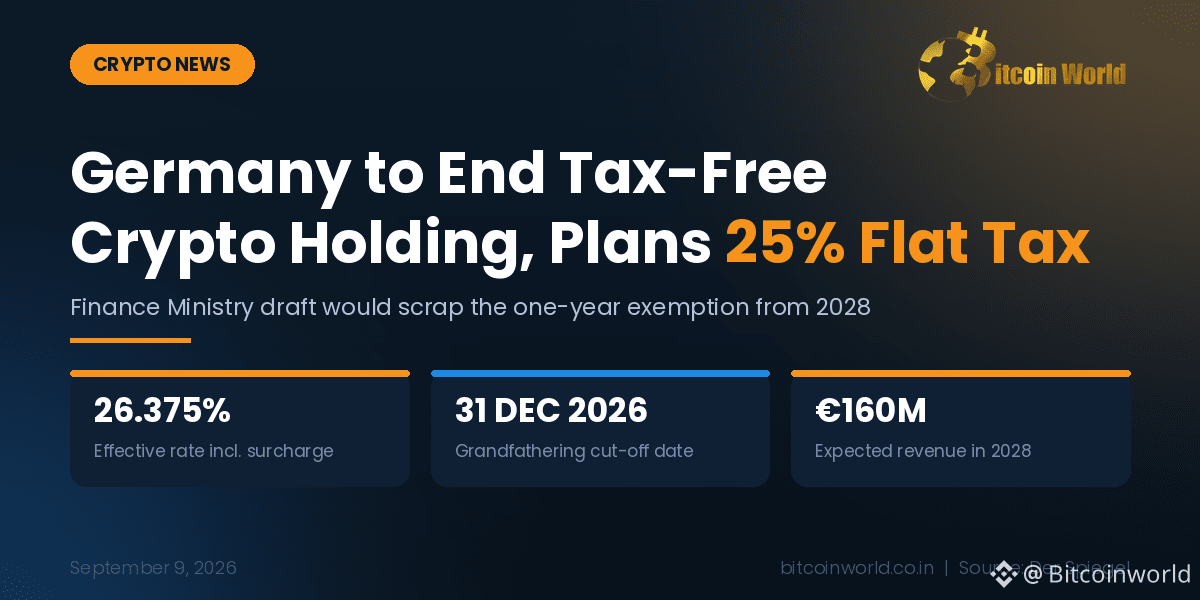
Article
Germany’s Crypto Tax-Free Rule Is Coming to an EndBitcoinWorldGermany’s Crypto Tax-Free Rule Is Coming to an End
Key Takeaways
Germany’s Finance Ministry has circulated a draft bill that would scrap the one-year tax-free holding rule and tax crypto gains as capital income from 2028.
The headline says 25%. The real number is 26.375% once the solidarity surcharge is added – closer to 28% with church tax.
The draft grandfathers anything bought on or before December 31, 2026. Buy before New Year’s Eve and the old rules still apply.
Expected revenue: €160 million in 2028, rising to about €350 million by 2031. Against a federal budget north of €555 billion.
For years, Germany had one line in its tax code that quietly made it one of the best places in the developed world to hold Bitcoin. Section 23 of the Income Tax Act treats crypto as a private asset, not a security. Hold it for more than twelve months, sell it, pay nothing. No cap, no tapering, no conditions.
That line is now on the chopping block.
What’s Actually in the Draft
Der Spiegel obtained a working draft from the Federal Ministry of Finance that would move crypto out of Section 23 and into Section 20 – the bucket that holds interest, dividends and stock gains. Once there, gains face the Abgeltungsteuer, Germany’s flat withholding tax on capital income.
The rate everyone is quoting is 25%. That’s the base. Add the 5.5% solidarity surcharge levied on the tax itself and you get 26.375%. Church tax, where applicable, pushes the effective burden toward 28% depending on the federal state.
Two things soften the blow. The €1,000 personal allowance survives. And – genuinely useful – crypto gains and losses could be offset against gains and losses from stocks and other securities. Under the current Section 23 regime, crypto losses can only be netted against other private disposals, which is a far narrower box. Anyone whose personal rate sits below 25% can also request a Günstigerprüfung, an assessment that applies the lower personal rate instead.
The cut-off matters most. As the draft stands, assets acquired on or before December 31, 2026 stay under the old rules. Hold twelve months, sell tax-free. Only crypto bought after that date falls into the new regime.
The Timeline
April 2025 – The SPD pushes to scrap the holding period during coalition negotiations, and wants the flat rate raised to 30%. CDU/CSU blocks it.
May 2025 – The proposal is dropped from the coalition agreement that brings the Merz government to power.
April 29, 2026 – Finance Minister Lars Klingbeil, now SPD chair, revives the plan under new framing, tied to a package meant to raise €2 billion and tighten enforcement against financial crime.
Early July 2026 – A budget draft includes removal of the holding period. Cabinet approves the key points paper.
July 13, 2026 – The working draft of the Annual Tax Act 2026 contains nothing on crypto. Nothing legally binding exists yet.
September 9, 2026 – Der Spiegel reports the ministerial draft bill. For the first time there are numbers, a rate, and a cut-off date. It enters interdepartmental consultation.
Ahead – Cabinet approval, three Bundestag readings, the Bundesrat, then the Federal Law Gazette. Any of those stages can change the rate, the cut-off, or kill it entirely.
The Number That Doesn’t Add Up
Here is the part worth sitting with. The ministry projects €160 million in 2028 from this measure. Germany’s federal budget runs past €555 billion.
That is roughly 0.03% of spending. Even at the 2031 figure of €350 million, it barely registers.
Germany is not doing this because it needs the money. €160 million doesn’t fix anything. It’s doing this because the exemption became politically awkward – a rule that let one asset class walk away untaxed while wage earners paid up to 45%. The SPD has framed it as parity, and on paper, parity is a fair argument. Crypto now gets treated exactly like stocks, with the same rate and the same loss-offsetting rights.
But parity cuts both ways. Germany’s holding period wasn’t an accident or an oversight. It was a genuine competitive differentiator, one of the few things that made German exchanges and German-resident traders distinct in Europe. Trading that for a rounding error is a choice, not a necessity.
Conclusion
Nothing is law yet. A ministerial draft in interdepartmental consultation is several long steps from the Federal Law Gazette, and this exact proposal has already died once, in 2025.
This post Germany’s Crypto Tax-Free Rule Is Coming to an End first appeared on BitcoinWorld.
Germany’s Crypto Tax-Free Rule Is Coming to an End
BitcoinWorldGermany’s Crypto Tax-Free Rule Is Coming to an End
Key Takeaways
Germany’s Finance Ministry has circulated a draft bill that would scrap the one-year tax-free holding rule and tax crypto gains as capital income from 2028.
The headline says 25%. The real number is 26.375% once the solidarity surcharge is added – closer to 28% with church tax.
The draft grandfathers anything bought on or before December 31, 2026. Buy before New Year’s Eve and the old rules still apply.
Expected revenue: €160 million in 2028, rising to about €350 million by 2031. Against a federal budget north of €555 billion.
For years, Germany had one line in its tax code that quietly made it one of the best places in the developed world to hold Bitcoin. Section 23 of the Income Tax Act treats crypto as a private asset, not a security. Hold it for more than twelve months, sell it, pay nothing. No cap, no tapering, no conditions.
That line is now on the chopping block.
What’s Actually in the Draft
Der Spiegel obtained a working draft from the Federal Ministry of Finance that would move crypto out of Section 23 and into Section 20 – the bucket that holds interest, dividends and stock gains. Once there, gains face the Abgeltungsteuer, Germany’s flat withholding tax on capital income.
The rate everyone is quoting is 25%. That’s the base. Add the 5.5% solidarity surcharge levied on the tax itself and you get 26.375%. Church tax, where applicable, pushes the effective burden toward 28% depending on the federal state.
Two things soften the blow. The €1,000 personal allowance survives. And – genuinely useful – crypto gains and losses could be offset against gains and losses from stocks and other securities. Under the current Section 23 regime, crypto losses can only be netted against other private disposals, which is a far narrower box. Anyone whose personal rate sits below 25% can also request a Günstigerprüfung, an assessment that applies the lower personal rate instead.
The cut-off matters most. As the draft stands, assets acquired on or before December 31, 2026 stay under the old rules. Hold twelve months, sell tax-free. Only crypto bought after that date falls into the new regime.
The Timeline
April 2025 – The SPD pushes to scrap the holding period during coalition negotiations, and wants the flat rate raised to 30%. CDU/CSU blocks it.
May 2025 – The proposal is dropped from the coalition agreement that brings the Merz government to power.
April 29, 2026 – Finance Minister Lars Klingbeil, now SPD chair, revives the plan under new framing, tied to a package meant to raise €2 billion and tighten enforcement against financial crime.
Early July 2026 – A budget draft includes removal of the holding period. Cabinet approves the key points paper.
July 13, 2026 – The working draft of the Annual Tax Act 2026 contains nothing on crypto. Nothing legally binding exists yet.
September 9, 2026 – Der Spiegel reports the ministerial draft bill. For the first time there are numbers, a rate, and a cut-off date. It enters interdepartmental consultation.
Ahead – Cabinet approval, three Bundestag readings, the Bundesrat, then the Federal Law Gazette. Any of those stages can change the rate, the cut-off, or kill it entirely.
The Number That Doesn’t Add Up
Here is the part worth sitting with. The ministry projects €160 million in 2028 from this measure. Germany’s federal budget runs past €555 billion.
That is roughly 0.03% of spending. Even at the 2031 figure of €350 million, it barely registers.
Germany is not doing this because it needs the money. €160 million doesn’t fix anything. It’s doing this because the exemption became politically awkward – a rule that let one asset class walk away untaxed while wage earners paid up to 45%. The SPD has framed it as parity, and on paper, parity is a fair argument. Crypto now gets treated exactly like stocks, with the same rate and the same loss-offsetting rights.
But parity cuts both ways. Germany’s holding period wasn’t an accident or an oversight. It was a genuine competitive differentiator, one of the few things that made German exchanges and German-resident traders distinct in Europe. Trading that for a rounding error is a choice, not a necessity.
Conclusion
Nothing is law yet. A ministerial draft in interdepartmental consultation is several long steps from the Federal Law Gazette, and this exact proposal has already died once, in 2025.
This post Germany’s Crypto Tax-Free Rule Is Coming to an End first appeared on BitcoinWorld.
Key Takeaways
Germany’s Finance Ministry has circulated a draft bill that would scrap the one-year tax-free holding rule and tax crypto gains as capital income from 2028.
The headline says 25%. The real number is 26.375% once the solidarity surcharge is added – closer to 28% with church tax.
The draft grandfathers anything bought on or before December 31, 2026. Buy before New Year’s Eve and the old rules still apply.
Expected revenue: €160 million in 2028, rising to about €350 million by 2031. Against a federal budget north of €555 billion.
For years, Germany had one line in its tax code that quietly made it one of the best places in the developed world to hold Bitcoin. Section 23 of the Income Tax Act treats crypto as a private asset, not a security. Hold it for more than twelve months, sell it, pay nothing. No cap, no tapering, no conditions.
That line is now on the chopping block.
What’s Actually in the Draft
Der Spiegel obtained a working draft from the Federal Ministry of Finance that would move crypto out of Section 23 and into Section 20 – the bucket that holds interest, dividends and stock gains. Once there, gains face the Abgeltungsteuer, Germany’s flat withholding tax on capital income.
The rate everyone is quoting is 25%. That’s the base. Add the 5.5% solidarity surcharge levied on the tax itself and you get 26.375%. Church tax, where applicable, pushes the effective burden toward 28% depending on the federal state.
Two things soften the blow. The €1,000 personal allowance survives. And – genuinely useful – crypto gains and losses could be offset against gains and losses from stocks and other securities. Under the current Section 23 regime, crypto losses can only be netted against other private disposals, which is a far narrower box. Anyone whose personal rate sits below 25% can also request a Günstigerprüfung, an assessment that applies the lower personal rate instead.
The cut-off matters most. As the draft stands, assets acquired on or before December 31, 2026 stay under the old rules. Hold twelve months, sell tax-free. Only crypto bought after that date falls into the new regime.
The Timeline
April 2025 – The SPD pushes to scrap the holding period during coalition negotiations, and wants the flat rate raised to 30%. CDU/CSU blocks it.
May 2025 – The proposal is dropped from the coalition agreement that brings the Merz government to power.
April 29, 2026 – Finance Minister Lars Klingbeil, now SPD chair, revives the plan under new framing, tied to a package meant to raise €2 billion and tighten enforcement against financial crime.
Early July 2026 – A budget draft includes removal of the holding period. Cabinet approves the key points paper.
July 13, 2026 – The working draft of the Annual Tax Act 2026 contains nothing on crypto. Nothing legally binding exists yet.
September 9, 2026 – Der Spiegel reports the ministerial draft bill. For the first time there are numbers, a rate, and a cut-off date. It enters interdepartmental consultation.
Ahead – Cabinet approval, three Bundestag readings, the Bundesrat, then the Federal Law Gazette. Any of those stages can change the rate, the cut-off, or kill it entirely.
The Number That Doesn’t Add Up
Here is the part worth sitting with. The ministry projects €160 million in 2028 from this measure. Germany’s federal budget runs past €555 billion.
That is roughly 0.03% of spending. Even at the 2031 figure of €350 million, it barely registers.
Germany is not doing this because it needs the money. €160 million doesn’t fix anything. It’s doing this because the exemption became politically awkward – a rule that let one asset class walk away untaxed while wage earners paid up to 45%. The SPD has framed it as parity, and on paper, parity is a fair argument. Crypto now gets treated exactly like stocks, with the same rate and the same loss-offsetting rights.
But parity cuts both ways. Germany’s holding period wasn’t an accident or an oversight. It was a genuine competitive differentiator, one of the few things that made German exchanges and German-resident traders distinct in Europe. Trading that for a rounding error is a choice, not a necessity.
Conclusion
Nothing is law yet. A ministerial draft in interdepartmental consultation is several long steps from the Federal Law Gazette, and this exact proposal has already died once, in 2025.
This post Germany’s Crypto Tax-Free Rule Is Coming to an End first appeared on BitcoinWorld.
82
·
--

Article
PinGo Hit By Second Cyberattack – and Nobody Ever Explained the First OneBitcoinWorldPinGo Hit by Second Cyberattack – and Nobody Ever Explained the First One
Key Takeaways
PinGo, the AI + DePIN project on the TON network, has confirmed another cyberattack. Some stolen tokens have already been sold into the market by the attacker.
The team says it consolidated and isolated its remaining on-chain assets. It has not disclosed the loss size, the attack vector, or whether user funds were touched.
PINGO’s daily volume sits near $15,000. On a book that thin, even a small dump does real damage – the dollar figure may end up mattering less than the liquidity.
The most important word in PinGo’s statement is “another.”
On September 9, 2026, the project told its community it had suffered a fresh cyberattack. It said it moved fast, pulled the remaining on-chain assets together, and locked them away. Internal response procedures are running. Details on the scale of the losses, it said, are coming soon.
That is a reasonable first hour. It is not an answer.
A Second Hack Is a Different Kind of Problem
One breach can happen to anyone. A clever attacker, a missed bug, a bad afternoon. A second breach at the same project usually means one of two things: the original entry point was never closed, or the team never worked out how the attacker got in to begin with.
Here’s what makes it worse. There is no public record of PinGo’s first incident. No PeckShield log, no SlowMist entry, no detailed post-mortem you can pull up and read. The team’s own statement is the only acknowledgement that it happened at all.
If a project can be breached without the market noticing, the next breach isn’t a surprise. It’s a sequel.
The Timeline
2024–early 2025 – PinGo launches as the first AI + DePIN project on TON, pitching a marketplace that turns idle computing power into a resource for training AI models.
September 2025 – PINGO runs a pre-listing Kickstarter on MEXC, with 120,000 PINGO and 30,000 USDT in airdrops. The token reaches retail. Listings follow on Gate, CoinEx and Bitget Wallet.
April 2026 – PinGo announces a partnership with Manadia to add a distributed compute layer, pushing further into decentralised AI infrastructure.
First attack – date not publicly confirmed. No loss figure, no cause, no independent reporting. It exists only as a reference in PinGo’s own words.
September 9, 2026 – Second attack confirmed. Assets isolated. Attacker already selling. Full details promised.
How Much Was Lost?
Nobody has said. No security firm has published a number.
What the market data tells us is arguably more useful for holders. PINGO’s market cap sits somewhere around $6 million to $7.5 million. The token trades roughly 93% below its all-time high of $0.4025. Daily volume is around $15,000–$16,000 on CoinGecko, and price feeds across trackers currently disagree – anywhere from $0.02 to $0.06 – which suggests stale or thin data.
That last point is the one that matters. When an attacker sells into a book this shallow, the dollar value of the theft becomes almost irrelevant. Even a modest dump moves the price hard. Retail holders absorb that regardless of what the team eventually recovers.
The Pattern Behind It
PinGo isn’t an outlier. It’s a symptom of how crypto security broke this year.
CertiK’s Hack3d report counted $1.31 billion stolen across 344 on-chain incidents in the first half of 2026. The two largest heists – KelpDAO at $291 million and Drift Protocol at $285 million, roughly $577 million combined – never touched a line of audited contract code. Compromised accounts now cause more than half of all DeFi attacks by incident count, overtaking smart contract exploits for the first time.
Across the industry’s entire history, about 40% of the $16.69 billion ever stolen traces back to compromised private keys, not clever code.
That reframes PinGo’s response. “We isolated the assets” only helps if the problem was where the money sat. If the entry point was a leaked deployment key or a phished developer, then moving funds to a fresh wallet fixes nothing. The vulnerability still has a laptop and a login.
Conclusion
PinGo did the right things in the first hour – move fast, contain, communicate. What it still hasn’t done is explain how this happened twice, or what happened the first time at all.
Until a proper post-mortem lands, “secure isolation” is a phrase, not a fix. And in a year where over a billion dollars walked out through stolen keys rather than broken code, the question isn’t whether the assets are somewhere safer. It’s whether the person holding them is.
This post PinGo Hit by Second Cyberattack – and Nobody Ever Explained the First One first appeared on BitcoinWorld.
PinGo Hit By Second Cyberattack – and Nobody Ever Explained the First One
BitcoinWorldPinGo Hit by Second Cyberattack – and Nobody Ever Explained the First One
Key Takeaways
PinGo, the AI + DePIN project on the TON network, has confirmed another cyberattack. Some stolen tokens have already been sold into the market by the attacker.
The team says it consolidated and isolated its remaining on-chain assets. It has not disclosed the loss size, the attack vector, or whether user funds were touched.
PINGO’s daily volume sits near $15,000. On a book that thin, even a small dump does real damage – the dollar figure may end up mattering less than the liquidity.
The most important word in PinGo’s statement is “another.”
On September 9, 2026, the project told its community it had suffered a fresh cyberattack. It said it moved fast, pulled the remaining on-chain assets together, and locked them away. Internal response procedures are running. Details on the scale of the losses, it said, are coming soon.
That is a reasonable first hour. It is not an answer.
A Second Hack Is a Different Kind of Problem
One breach can happen to anyone. A clever attacker, a missed bug, a bad afternoon. A second breach at the same project usually means one of two things: the original entry point was never closed, or the team never worked out how the attacker got in to begin with.
Here’s what makes it worse. There is no public record of PinGo’s first incident. No PeckShield log, no SlowMist entry, no detailed post-mortem you can pull up and read. The team’s own statement is the only acknowledgement that it happened at all.
If a project can be breached without the market noticing, the next breach isn’t a surprise. It’s a sequel.
The Timeline
2024–early 2025 – PinGo launches as the first AI + DePIN project on TON, pitching a marketplace that turns idle computing power into a resource for training AI models.
September 2025 – PINGO runs a pre-listing Kickstarter on MEXC, with 120,000 PINGO and 30,000 USDT in airdrops. The token reaches retail. Listings follow on Gate, CoinEx and Bitget Wallet.
April 2026 – PinGo announces a partnership with Manadia to add a distributed compute layer, pushing further into decentralised AI infrastructure.
First attack – date not publicly confirmed. No loss figure, no cause, no independent reporting. It exists only as a reference in PinGo’s own words.
September 9, 2026 – Second attack confirmed. Assets isolated. Attacker already selling. Full details promised.
How Much Was Lost?
Nobody has said. No security firm has published a number.
What the market data tells us is arguably more useful for holders. PINGO’s market cap sits somewhere around $6 million to $7.5 million. The token trades roughly 93% below its all-time high of $0.4025. Daily volume is around $15,000–$16,000 on CoinGecko, and price feeds across trackers currently disagree – anywhere from $0.02 to $0.06 – which suggests stale or thin data.
That last point is the one that matters. When an attacker sells into a book this shallow, the dollar value of the theft becomes almost irrelevant. Even a modest dump moves the price hard. Retail holders absorb that regardless of what the team eventually recovers.
The Pattern Behind It
PinGo isn’t an outlier. It’s a symptom of how crypto security broke this year.
CertiK’s Hack3d report counted $1.31 billion stolen across 344 on-chain incidents in the first half of 2026. The two largest heists – KelpDAO at $291 million and Drift Protocol at $285 million, roughly $577 million combined – never touched a line of audited contract code. Compromised accounts now cause more than half of all DeFi attacks by incident count, overtaking smart contract exploits for the first time.
Across the industry’s entire history, about 40% of the $16.69 billion ever stolen traces back to compromised private keys, not clever code.
That reframes PinGo’s response. “We isolated the assets” only helps if the problem was where the money sat. If the entry point was a leaked deployment key or a phished developer, then moving funds to a fresh wallet fixes nothing. The vulnerability still has a laptop and a login.
Conclusion
PinGo did the right things in the first hour – move fast, contain, communicate. What it still hasn’t done is explain how this happened twice, or what happened the first time at all.
Until a proper post-mortem lands, “secure isolation” is a phrase, not a fix. And in a year where over a billion dollars walked out through stolen keys rather than broken code, the question isn’t whether the assets are somewhere safer. It’s whether the person holding them is.
This post PinGo Hit by Second Cyberattack – and Nobody Ever Explained the First One first appeared on BitcoinWorld.
Key Takeaways
PinGo, the AI + DePIN project on the TON network, has confirmed another cyberattack. Some stolen tokens have already been sold into the market by the attacker.
The team says it consolidated and isolated its remaining on-chain assets. It has not disclosed the loss size, the attack vector, or whether user funds were touched.
PINGO’s daily volume sits near $15,000. On a book that thin, even a small dump does real damage – the dollar figure may end up mattering less than the liquidity.
The most important word in PinGo’s statement is “another.”
On September 9, 2026, the project told its community it had suffered a fresh cyberattack. It said it moved fast, pulled the remaining on-chain assets together, and locked them away. Internal response procedures are running. Details on the scale of the losses, it said, are coming soon.
That is a reasonable first hour. It is not an answer.
A Second Hack Is a Different Kind of Problem
One breach can happen to anyone. A clever attacker, a missed bug, a bad afternoon. A second breach at the same project usually means one of two things: the original entry point was never closed, or the team never worked out how the attacker got in to begin with.
Here’s what makes it worse. There is no public record of PinGo’s first incident. No PeckShield log, no SlowMist entry, no detailed post-mortem you can pull up and read. The team’s own statement is the only acknowledgement that it happened at all.
If a project can be breached without the market noticing, the next breach isn’t a surprise. It’s a sequel.
The Timeline
2024–early 2025 – PinGo launches as the first AI + DePIN project on TON, pitching a marketplace that turns idle computing power into a resource for training AI models.
September 2025 – PINGO runs a pre-listing Kickstarter on MEXC, with 120,000 PINGO and 30,000 USDT in airdrops. The token reaches retail. Listings follow on Gate, CoinEx and Bitget Wallet.
April 2026 – PinGo announces a partnership with Manadia to add a distributed compute layer, pushing further into decentralised AI infrastructure.
First attack – date not publicly confirmed. No loss figure, no cause, no independent reporting. It exists only as a reference in PinGo’s own words.
September 9, 2026 – Second attack confirmed. Assets isolated. Attacker already selling. Full details promised.
How Much Was Lost?
Nobody has said. No security firm has published a number.
What the market data tells us is arguably more useful for holders. PINGO’s market cap sits somewhere around $6 million to $7.5 million. The token trades roughly 93% below its all-time high of $0.4025. Daily volume is around $15,000–$16,000 on CoinGecko, and price feeds across trackers currently disagree – anywhere from $0.02 to $0.06 – which suggests stale or thin data.
That last point is the one that matters. When an attacker sells into a book this shallow, the dollar value of the theft becomes almost irrelevant. Even a modest dump moves the price hard. Retail holders absorb that regardless of what the team eventually recovers.
The Pattern Behind It
PinGo isn’t an outlier. It’s a symptom of how crypto security broke this year.
CertiK’s Hack3d report counted $1.31 billion stolen across 344 on-chain incidents in the first half of 2026. The two largest heists – KelpDAO at $291 million and Drift Protocol at $285 million, roughly $577 million combined – never touched a line of audited contract code. Compromised accounts now cause more than half of all DeFi attacks by incident count, overtaking smart contract exploits for the first time.
Across the industry’s entire history, about 40% of the $16.69 billion ever stolen traces back to compromised private keys, not clever code.
That reframes PinGo’s response. “We isolated the assets” only helps if the problem was where the money sat. If the entry point was a leaked deployment key or a phished developer, then moving funds to a fresh wallet fixes nothing. The vulnerability still has a laptop and a login.
Conclusion
PinGo did the right things in the first hour – move fast, contain, communicate. What it still hasn’t done is explain how this happened twice, or what happened the first time at all.
Until a proper post-mortem lands, “secure isolation” is a phrase, not a fix. And in a year where over a billion dollars walked out through stolen keys rather than broken code, the question isn’t whether the assets are somewhere safer. It’s whether the person holding them is.
This post PinGo Hit by Second Cyberattack – and Nobody Ever Explained the First One first appeared on BitcoinWorld.
105
·
--
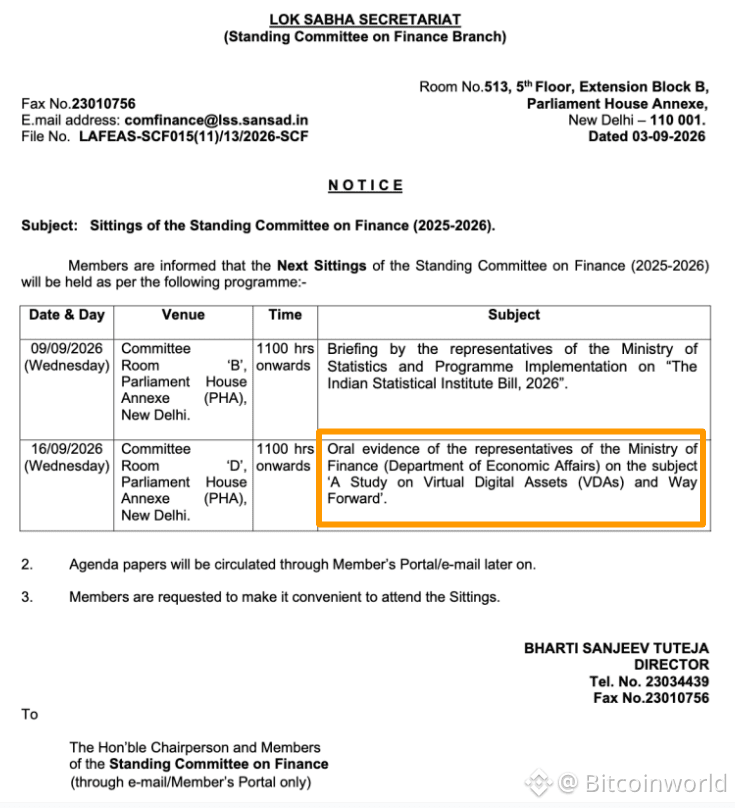
Article
Why September 16 Matters So Much to India’s Crypto CommunityBitcoinWorldWhy September 16 Matters So Much to India’s Crypto Community
Key Takeaways
The Finance Ministry’s Department of Economic Affairs (DEA) will appear before the Parliamentary Standing Committee on Finance on September 16, 2026, at 11 AM, Committee Room D, Parliament House Annexe.
About 91.5% of India’s crypto trading volume in FY2024-25 went to offshore exchanges. Only 8.5% stayed home.
No new law is coming out of this meeting. What we’re actually waiting for is a name – who regulates crypto, and what crypto legally is.
Everyone is calling September 16 a “big clarity moment.” Let’s be honest about what it really is. The DEA is going to sit in front of MPs and explain a tax system that has been running for four years – one that collected less money than expected and pushed most of the market somewhere the taxman can’t reach.
The numbers say it plainly. When 91.5% of trading happens abroad and only 8.5% stays on FIU-registered Indian exchanges, the 1% TDS didn’t fail. It worked too well as a deterrent. It was supposed to create a paper trail. Instead, people simply went where no trail gets created.
The Full Timeline
April 2018 – RBI tells banks to cut off crypto firms. Exchanges struggle to survive.
March 2020 – Supreme Court strikes down the RBI circular. Banking access returns.
July 1, 2022 – Section 115BBH (30% flat tax) and Section 194S (1% TDS) kick in. No loss set-off allowed.
March 2023 – VDA service providers brought under PMLA anti-money-laundering rules.
2024 – FIU acts against unregistered offshore platforms. Several later register and continue serving Indians.
August 14, 2024 – Standing Committee formally takes up “A Study on Virtual Digital Assets (VDAs) and Way Forward.”
Through 2025-26 – Exchanges (Binance, WazirX, ZebPay, CoinDCX, CoinSwitch, Coinbase), FIU, CBDT, MCA and IFSCA all depose. By mid-2026, 54 VDA providers are FIU-registered.
May 20, 2026 – Committee Chairman Bhartruhari Mahtab calls the outflow of thousands of crores “very alarming.”
July 2, 2026 – RBI and ICAI depose. RBI stays opposed to legal status. ICAI pushes for proper accounting and legal clarity.
August 20, 2026 – Lok Sabha Secretariat notice: the August 27 DEA sitting “stands CANCELLED.” No new date.
September 3, 2026 – Fresh notice fixes the DEA hearing for September 16.
What X Is Saying
The industry conversation is mostly happening on X, not in press releases. Worth following:
Bharat Web3 Association – the loudest voice asking for TDS to drop to 0.01% and loss set-off to be allowed.
Sumit Gupta, CoinDCX CEO – his post on India ranking #1 in grassroots adoption sums up the industry’s core argument: users are here, the rules aren’t.
The Part Nobody Wants To Own
The real problem isn’t tax. It’s turf. Until someone says clearly whether a token is a security, a commodity, or its own thing, no regulator has to take charge. SEBI, RBI and the ministry all quietly benefit from the confusion.
The committee’s own idea – an interim setup run through Self-Regulatory Organisations under a designated regulator – tells you everything. Governments suggest SROs when they want supervision without doing the hard work of writing a law. It’s a placeholder. And placeholders in Indian finance tend to stick around for years.
Conclusion
India built the enforcement machinery first and never got around to the definitions. The 91.5% figure is the receipt for that choice. September 16 won’t fix it. But it will tell us whether the government has finally accepted the bill.
This post Why September 16 Matters So Much to India’s Crypto Community first appeared on BitcoinWorld.
Why September 16 Matters So Much to India’s Crypto Community
BitcoinWorldWhy September 16 Matters So Much to India’s Crypto Community
Key Takeaways
The Finance Ministry’s Department of Economic Affairs (DEA) will appear before the Parliamentary Standing Committee on Finance on September 16, 2026, at 11 AM, Committee Room D, Parliament House Annexe.
About 91.5% of India’s crypto trading volume in FY2024-25 went to offshore exchanges. Only 8.5% stayed home.
No new law is coming out of this meeting. What we’re actually waiting for is a name – who regulates crypto, and what crypto legally is.
Everyone is calling September 16 a “big clarity moment.” Let’s be honest about what it really is. The DEA is going to sit in front of MPs and explain a tax system that has been running for four years – one that collected less money than expected and pushed most of the market somewhere the taxman can’t reach.
The numbers say it plainly. When 91.5% of trading happens abroad and only 8.5% stays on FIU-registered Indian exchanges, the 1% TDS didn’t fail. It worked too well as a deterrent. It was supposed to create a paper trail. Instead, people simply went where no trail gets created.
The Full Timeline
April 2018 – RBI tells banks to cut off crypto firms. Exchanges struggle to survive.
March 2020 – Supreme Court strikes down the RBI circular. Banking access returns.
July 1, 2022 – Section 115BBH (30% flat tax) and Section 194S (1% TDS) kick in. No loss set-off allowed.
March 2023 – VDA service providers brought under PMLA anti-money-laundering rules.
2024 – FIU acts against unregistered offshore platforms. Several later register and continue serving Indians.
August 14, 2024 – Standing Committee formally takes up “A Study on Virtual Digital Assets (VDAs) and Way Forward.”
Through 2025-26 – Exchanges (Binance, WazirX, ZebPay, CoinDCX, CoinSwitch, Coinbase), FIU, CBDT, MCA and IFSCA all depose. By mid-2026, 54 VDA providers are FIU-registered.
May 20, 2026 – Committee Chairman Bhartruhari Mahtab calls the outflow of thousands of crores “very alarming.”
July 2, 2026 – RBI and ICAI depose. RBI stays opposed to legal status. ICAI pushes for proper accounting and legal clarity.
August 20, 2026 – Lok Sabha Secretariat notice: the August 27 DEA sitting “stands CANCELLED.” No new date.
September 3, 2026 – Fresh notice fixes the DEA hearing for September 16.
What X Is Saying
The industry conversation is mostly happening on X, not in press releases. Worth following:
Bharat Web3 Association – the loudest voice asking for TDS to drop to 0.01% and loss set-off to be allowed.
Sumit Gupta, CoinDCX CEO – his post on India ranking #1 in grassroots adoption sums up the industry’s core argument: users are here, the rules aren’t.
The Part Nobody Wants To Own
The real problem isn’t tax. It’s turf. Until someone says clearly whether a token is a security, a commodity, or its own thing, no regulator has to take charge. SEBI, RBI and the ministry all quietly benefit from the confusion.
The committee’s own idea – an interim setup run through Self-Regulatory Organisations under a designated regulator – tells you everything. Governments suggest SROs when they want supervision without doing the hard work of writing a law. It’s a placeholder. And placeholders in Indian finance tend to stick around for years.
Conclusion
India built the enforcement machinery first and never got around to the definitions. The 91.5% figure is the receipt for that choice. September 16 won’t fix it. But it will tell us whether the government has finally accepted the bill.
This post Why September 16 Matters So Much to India’s Crypto Community first appeared on BitcoinWorld.
Key Takeaways
The Finance Ministry’s Department of Economic Affairs (DEA) will appear before the Parliamentary Standing Committee on Finance on September 16, 2026, at 11 AM, Committee Room D, Parliament House Annexe.
About 91.5% of India’s crypto trading volume in FY2024-25 went to offshore exchanges. Only 8.5% stayed home.
No new law is coming out of this meeting. What we’re actually waiting for is a name – who regulates crypto, and what crypto legally is.
Everyone is calling September 16 a “big clarity moment.” Let’s be honest about what it really is. The DEA is going to sit in front of MPs and explain a tax system that has been running for four years – one that collected less money than expected and pushed most of the market somewhere the taxman can’t reach.
The numbers say it plainly. When 91.5% of trading happens abroad and only 8.5% stays on FIU-registered Indian exchanges, the 1% TDS didn’t fail. It worked too well as a deterrent. It was supposed to create a paper trail. Instead, people simply went where no trail gets created.
The Full Timeline
April 2018 – RBI tells banks to cut off crypto firms. Exchanges struggle to survive.
March 2020 – Supreme Court strikes down the RBI circular. Banking access returns.
July 1, 2022 – Section 115BBH (30% flat tax) and Section 194S (1% TDS) kick in. No loss set-off allowed.
March 2023 – VDA service providers brought under PMLA anti-money-laundering rules.
2024 – FIU acts against unregistered offshore platforms. Several later register and continue serving Indians.
August 14, 2024 – Standing Committee formally takes up “A Study on Virtual Digital Assets (VDAs) and Way Forward.”
Through 2025-26 – Exchanges (Binance, WazirX, ZebPay, CoinDCX, CoinSwitch, Coinbase), FIU, CBDT, MCA and IFSCA all depose. By mid-2026, 54 VDA providers are FIU-registered.
May 20, 2026 – Committee Chairman Bhartruhari Mahtab calls the outflow of thousands of crores “very alarming.”
July 2, 2026 – RBI and ICAI depose. RBI stays opposed to legal status. ICAI pushes for proper accounting and legal clarity.
August 20, 2026 – Lok Sabha Secretariat notice: the August 27 DEA sitting “stands CANCELLED.” No new date.
September 3, 2026 – Fresh notice fixes the DEA hearing for September 16.
What X Is Saying
The industry conversation is mostly happening on X, not in press releases. Worth following:
Bharat Web3 Association – the loudest voice asking for TDS to drop to 0.01% and loss set-off to be allowed.
Sumit Gupta, CoinDCX CEO – his post on India ranking #1 in grassroots adoption sums up the industry’s core argument: users are here, the rules aren’t.
The Part Nobody Wants To Own
The real problem isn’t tax. It’s turf. Until someone says clearly whether a token is a security, a commodity, or its own thing, no regulator has to take charge. SEBI, RBI and the ministry all quietly benefit from the confusion.
The committee’s own idea – an interim setup run through Self-Regulatory Organisations under a designated regulator – tells you everything. Governments suggest SROs when they want supervision without doing the hard work of writing a law. It’s a placeholder. And placeholders in Indian finance tend to stick around for years.
Conclusion
India built the enforcement machinery first and never got around to the definitions. The 91.5% figure is the receipt for that choice. September 16 won’t fix it. But it will tell us whether the government has finally accepted the bill.
This post Why September 16 Matters So Much to India’s Crypto Community first appeared on BitcoinWorld.
104
·
--
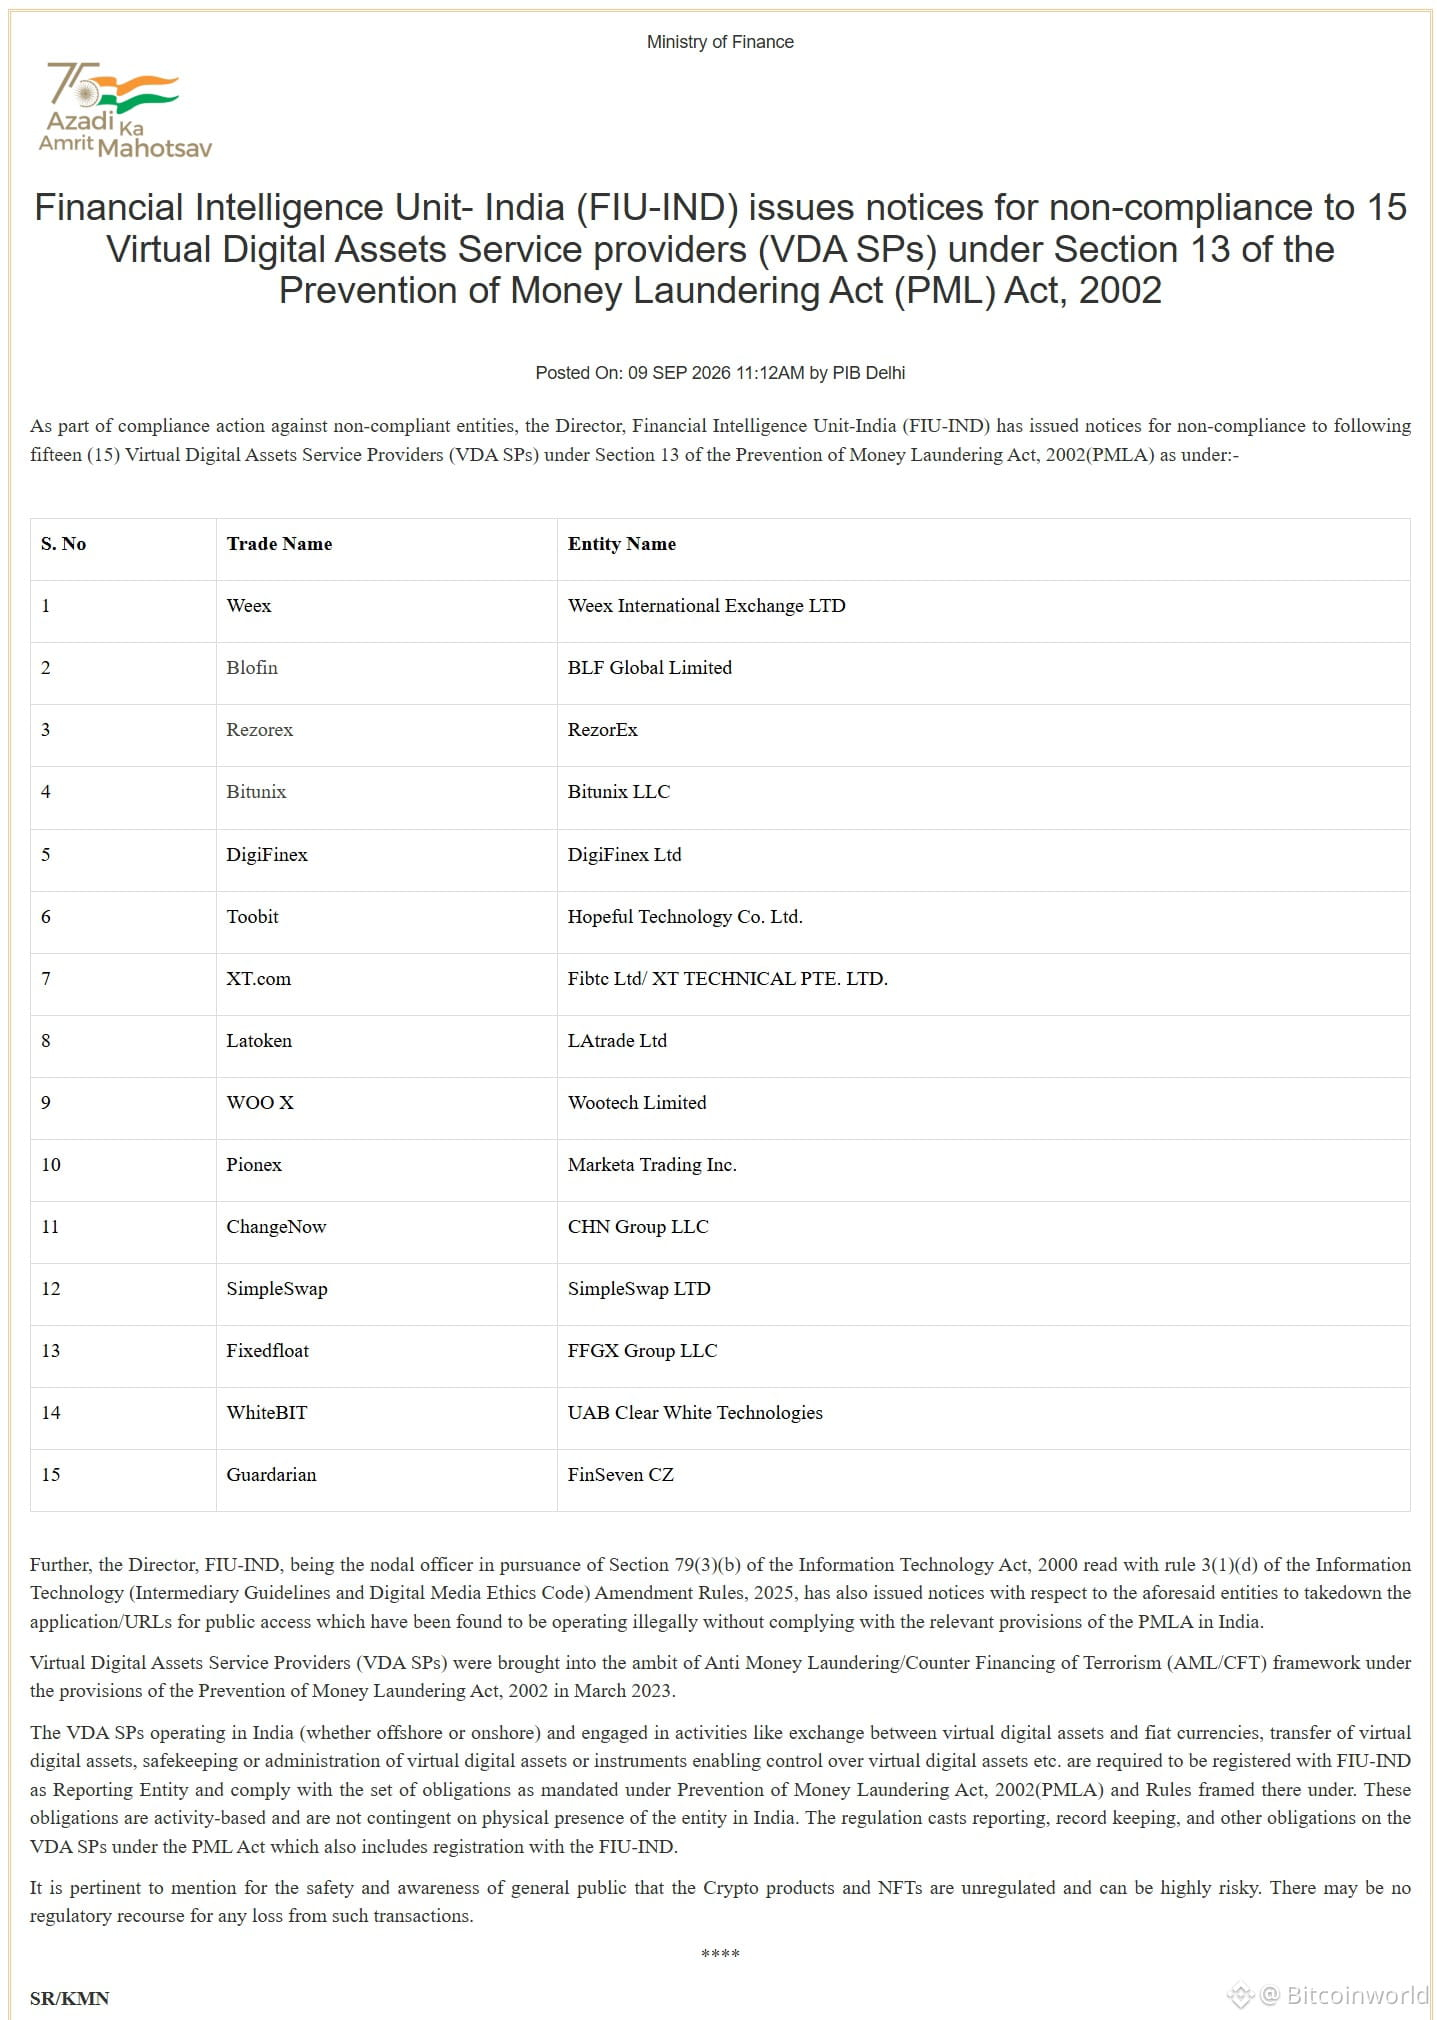
Article
FIU-IND Has Served Non-compliance Notices on 15 OffshoreBitcoinWorldFIU-IND has served non-compliance notices on 15 offshore
Key takeaways
FIU-IND has served non-compliance notices on 15 offshore VDA service providers under Section 13 of the PMLA, alongside takedown notices under Section 79(3)(b) of the IT Act.
The list is unusual: alongside derivatives venues sit instant-swap and no-account conversion tools – ChangeNOW, SimpleSwap, FixedFloat, Guardarian.
India’s compliance test is activity-based. No office, no employees, no servers in India – still a reporting entity.
Expect app-store delistings and DNS-level blocks as the enforcement follow-through, as happened in 2024.
List Of Exchanges Are:
The previous sweeps read like a who’s-who of global exchanges. This one reads like a laundering-flow diagram.
Weex, Bitunix, Blofin, Toobit, XT.com, WOO X, Pionex and DigiFinex are recognisable trading venues, many of them high-leverage perpetuals platforms popular with Indian retail traders who found domestic options too slow or too taxed. But ChangeNOW, SimpleSwap, FixedFloat and Guardarian are not exchanges in the usual sense. They are conversion rails – swap one asset for another, often without an account, sometimes without meaningful KYC, and move on. Blockchain forensics firms have repeatedly traced funds from thefts and scam operations through exactly this category of service.
Reading the list that way, FIU-IND is no longer just policing where Indians trade. It is policing where stolen and defrauded rupees exit.
How we got here
March 2023 – VDA service providers are pulled into the PMLA’s AML/CFT perimeter. Registration becomes mandatory for exchange, transfer and custody activity.
December 2023 – Show-cause notices go to nine offshore exchanges, including Binance and KuCoin.
January 2024 – Apple and Google pull the non-compliant apps in India; URLs get blocked.
2024–25 – Binance and KuCoin pay penalties and register. Compliance, it turns out, is cheaper than exclusion.
September–October 2025 – A second wave hits 25 offshore platforms.
September 2026 – This round of 15, with takedown notices issued in parallel rather than months later.
The expert read
Two things stand out. First, the takedown notice arriving at the same time as the Section 13 notice is a procedural tightening – the 2024 gap gave platforms months to warn users and migrate them. Second, the registered-entity count keeps climbing, which is the actual policy objective. India is not trying to end offshore access; it is converting offshore operators into reporting entities that file suspicious transaction reports.
What comes next
Blocking is porous. VPN usage will absorb some of this, and peer-to-peer and self-custodial routes absorb the rest. The real consequence is liquidity migration toward registered platforms and a thinner, riskier grey market for everyone who stays offshore.
Conclusion
India has settled into a pattern: no ban, no embrace, just relentless perimeter enforcement. For platforms, the calculation is now simple – register, or get delisted and watch a competitor take the users. For traders, the finance ministry’s warning stands unchanged. Unregulated means no recourse.
This post FIU-IND has served non-compliance notices on 15 offshore first appeared on BitcoinWorld.
FIU-IND Has Served Non-compliance Notices on 15 Offshore
BitcoinWorldFIU-IND has served non-compliance notices on 15 offshore
Key takeaways
FIU-IND has served non-compliance notices on 15 offshore VDA service providers under Section 13 of the PMLA, alongside takedown notices under Section 79(3)(b) of the IT Act.
The list is unusual: alongside derivatives venues sit instant-swap and no-account conversion tools – ChangeNOW, SimpleSwap, FixedFloat, Guardarian.
India’s compliance test is activity-based. No office, no employees, no servers in India – still a reporting entity.
Expect app-store delistings and DNS-level blocks as the enforcement follow-through, as happened in 2024.
List Of Exchanges Are:
The previous sweeps read like a who’s-who of global exchanges. This one reads like a laundering-flow diagram.
Weex, Bitunix, Blofin, Toobit, XT.com, WOO X, Pionex and DigiFinex are recognisable trading venues, many of them high-leverage perpetuals platforms popular with Indian retail traders who found domestic options too slow or too taxed. But ChangeNOW, SimpleSwap, FixedFloat and Guardarian are not exchanges in the usual sense. They are conversion rails – swap one asset for another, often without an account, sometimes without meaningful KYC, and move on. Blockchain forensics firms have repeatedly traced funds from thefts and scam operations through exactly this category of service.
Reading the list that way, FIU-IND is no longer just policing where Indians trade. It is policing where stolen and defrauded rupees exit.
How we got here
March 2023 – VDA service providers are pulled into the PMLA’s AML/CFT perimeter. Registration becomes mandatory for exchange, transfer and custody activity.
December 2023 – Show-cause notices go to nine offshore exchanges, including Binance and KuCoin.
January 2024 – Apple and Google pull the non-compliant apps in India; URLs get blocked.
2024–25 – Binance and KuCoin pay penalties and register. Compliance, it turns out, is cheaper than exclusion.
September–October 2025 – A second wave hits 25 offshore platforms.
September 2026 – This round of 15, with takedown notices issued in parallel rather than months later.
The expert read
Two things stand out. First, the takedown notice arriving at the same time as the Section 13 notice is a procedural tightening – the 2024 gap gave platforms months to warn users and migrate them. Second, the registered-entity count keeps climbing, which is the actual policy objective. India is not trying to end offshore access; it is converting offshore operators into reporting entities that file suspicious transaction reports.
What comes next
Blocking is porous. VPN usage will absorb some of this, and peer-to-peer and self-custodial routes absorb the rest. The real consequence is liquidity migration toward registered platforms and a thinner, riskier grey market for everyone who stays offshore.
Conclusion
India has settled into a pattern: no ban, no embrace, just relentless perimeter enforcement. For platforms, the calculation is now simple – register, or get delisted and watch a competitor take the users. For traders, the finance ministry’s warning stands unchanged. Unregulated means no recourse.
This post FIU-IND has served non-compliance notices on 15 offshore first appeared on BitcoinWorld.
Key takeaways
FIU-IND has served non-compliance notices on 15 offshore VDA service providers under Section 13 of the PMLA, alongside takedown notices under Section 79(3)(b) of the IT Act.
The list is unusual: alongside derivatives venues sit instant-swap and no-account conversion tools – ChangeNOW, SimpleSwap, FixedFloat, Guardarian.
India’s compliance test is activity-based. No office, no employees, no servers in India – still a reporting entity.
Expect app-store delistings and DNS-level blocks as the enforcement follow-through, as happened in 2024.
List Of Exchanges Are:
The previous sweeps read like a who’s-who of global exchanges. This one reads like a laundering-flow diagram.
Weex, Bitunix, Blofin, Toobit, XT.com, WOO X, Pionex and DigiFinex are recognisable trading venues, many of them high-leverage perpetuals platforms popular with Indian retail traders who found domestic options too slow or too taxed. But ChangeNOW, SimpleSwap, FixedFloat and Guardarian are not exchanges in the usual sense. They are conversion rails – swap one asset for another, often without an account, sometimes without meaningful KYC, and move on. Blockchain forensics firms have repeatedly traced funds from thefts and scam operations through exactly this category of service.
Reading the list that way, FIU-IND is no longer just policing where Indians trade. It is policing where stolen and defrauded rupees exit.
How we got here
March 2023 – VDA service providers are pulled into the PMLA’s AML/CFT perimeter. Registration becomes mandatory for exchange, transfer and custody activity.
December 2023 – Show-cause notices go to nine offshore exchanges, including Binance and KuCoin.
January 2024 – Apple and Google pull the non-compliant apps in India; URLs get blocked.
2024–25 – Binance and KuCoin pay penalties and register. Compliance, it turns out, is cheaper than exclusion.
September–October 2025 – A second wave hits 25 offshore platforms.
September 2026 – This round of 15, with takedown notices issued in parallel rather than months later.
The expert read
Two things stand out. First, the takedown notice arriving at the same time as the Section 13 notice is a procedural tightening – the 2024 gap gave platforms months to warn users and migrate them. Second, the registered-entity count keeps climbing, which is the actual policy objective. India is not trying to end offshore access; it is converting offshore operators into reporting entities that file suspicious transaction reports.
What comes next
Blocking is porous. VPN usage will absorb some of this, and peer-to-peer and self-custodial routes absorb the rest. The real consequence is liquidity migration toward registered platforms and a thinner, riskier grey market for everyone who stays offshore.
Conclusion
India has settled into a pattern: no ban, no embrace, just relentless perimeter enforcement. For platforms, the calculation is now simple – register, or get delisted and watch a competitor take the users. For traders, the finance ministry’s warning stands unchanged. Unregulated means no recourse.
This post FIU-IND has served non-compliance notices on 15 offshore first appeared on BitcoinWorld.
38
·
--
Article
Gemini’s Singapore Unit Now Holds a Full Major Payment Institution (MPI) LicenceBitcoinWorldGemini’s Singapore unit now holds a full Major Payment Institution (MPI) licence
Key Takeaways
Gemini’s Singapore unit now holds a full Major Payment Institution (MPI) licence, roughly 23 months after receiving in-principle approval.
The licence removes transaction-volume caps but pulls Gemini into a heavier supervisory regime covering AML, tech risk and reporting.
Singapore’s approval queue is slow by design — and that slowness is becoming the region’s competitive filter.
The Real Story Isn’t the Licence. It’s the Wait.
Most coverage of Gemini’s Singapore approval will read like a press release. The more interesting number is the calendar.
MAS issued in-principle approval in October 2024. Final authorisation arrived this week. Nearly two years passed between “yes, in principle” and “yes.” For an exchange with a US public listing, an established institutional book and a decade of operating history, that is a long time to sit in a regulatory waiting room – and it tells you more about Singapore’s posture than any policy speech.
Timeline
2020 – Gemini begins serving Singapore customers, initially through its US entity under an exemption.
October 2024 – MAS grants in-principle approval for an MPI licence covering digital payment tokens and cross-border transfers.
April 2025 – Customers are migrated from Gemini Trust Company into the locally incorporated Gemini Digital Payments Singapore while the application matures.
September 9, 2026 – Full MPI licence granted.
What Changes Operationally
The headline benefit is structural. MPI holders operate without the transaction-volume ceilings that constrain standard payment institutions – which matters enormously for an exchange whose Singapore business skews institutional. Volume caps are a ceiling on ambition; removing them turns Singapore from a compliance outpost into a viable booking centre.
The trade-off is supervisory weight. MAS applies broader obligations to MPIs precisely because scale creates larger risk, with continuing requirements around anti-money laundering, customer due diligence, technology risk and regulatory reporting. This is not a licence you win once. It is one you re-earn quarterly.
Why It Matters Beyond Gemini
Singapore has quietly assembled a short, curated list. Coinbase, Crypto.com, OKX, Bitstamp and Cumberland already hold MPI authorisation – and the roster is notable for who isn’t on it. MAS has been deliberate about the distinction between locally licensed firms and offshore platforms that merely happen to be reachable from a Singapore IP address.
That distinction is the strategic point. Global scale confers nothing locally. For years, exchanges arbitraged jurisdictional ambiguity across Asia. Singapore has made that arbitrage expensive by making the licence slow, costly and revocable.
Looking Forward
Expect the licensed cohort to consolidate rather than expand. Approvals of this weight function as moats – each one raises the credible-entry cost for the next applicant, and Hong Kong, Japan and the UAE are converging on similar architecture.
Conclusion
Gemini’s licence is a milestone, but the durable signal is Singapore’s willingness to make firms wait two years for legitimacy. In a sector built on speed, the jurisdictions setting the terms are the ones refusing to hurry.
This post Gemini’s Singapore unit now holds a full Major Payment Institution (MPI) licence first appeared on BitcoinWorld.
Gemini’s Singapore Unit Now Holds a Full Major Payment Institution (MPI) Licence
BitcoinWorldGemini’s Singapore unit now holds a full Major Payment Institution (MPI) licence
Key Takeaways
Gemini’s Singapore unit now holds a full Major Payment Institution (MPI) licence, roughly 23 months after receiving in-principle approval.
The licence removes transaction-volume caps but pulls Gemini into a heavier supervisory regime covering AML, tech risk and reporting.
Singapore’s approval queue is slow by design — and that slowness is becoming the region’s competitive filter.
The Real Story Isn’t the Licence. It’s the Wait.
Most coverage of Gemini’s Singapore approval will read like a press release. The more interesting number is the calendar.
MAS issued in-principle approval in October 2024. Final authorisation arrived this week. Nearly two years passed between “yes, in principle” and “yes.” For an exchange with a US public listing, an established institutional book and a decade of operating history, that is a long time to sit in a regulatory waiting room – and it tells you more about Singapore’s posture than any policy speech.
Timeline
2020 – Gemini begins serving Singapore customers, initially through its US entity under an exemption.
October 2024 – MAS grants in-principle approval for an MPI licence covering digital payment tokens and cross-border transfers.
April 2025 – Customers are migrated from Gemini Trust Company into the locally incorporated Gemini Digital Payments Singapore while the application matures.
September 9, 2026 – Full MPI licence granted.
What Changes Operationally
The headline benefit is structural. MPI holders operate without the transaction-volume ceilings that constrain standard payment institutions – which matters enormously for an exchange whose Singapore business skews institutional. Volume caps are a ceiling on ambition; removing them turns Singapore from a compliance outpost into a viable booking centre.
The trade-off is supervisory weight. MAS applies broader obligations to MPIs precisely because scale creates larger risk, with continuing requirements around anti-money laundering, customer due diligence, technology risk and regulatory reporting. This is not a licence you win once. It is one you re-earn quarterly.
Why It Matters Beyond Gemini
Singapore has quietly assembled a short, curated list. Coinbase, Crypto.com, OKX, Bitstamp and Cumberland already hold MPI authorisation – and the roster is notable for who isn’t on it. MAS has been deliberate about the distinction between locally licensed firms and offshore platforms that merely happen to be reachable from a Singapore IP address.
That distinction is the strategic point. Global scale confers nothing locally. For years, exchanges arbitraged jurisdictional ambiguity across Asia. Singapore has made that arbitrage expensive by making the licence slow, costly and revocable.
Looking Forward
Expect the licensed cohort to consolidate rather than expand. Approvals of this weight function as moats – each one raises the credible-entry cost for the next applicant, and Hong Kong, Japan and the UAE are converging on similar architecture.
Conclusion
Gemini’s licence is a milestone, but the durable signal is Singapore’s willingness to make firms wait two years for legitimacy. In a sector built on speed, the jurisdictions setting the terms are the ones refusing to hurry.
This post Gemini’s Singapore unit now holds a full Major Payment Institution (MPI) licence first appeared on BitcoinWorld.
Key Takeaways
Gemini’s Singapore unit now holds a full Major Payment Institution (MPI) licence, roughly 23 months after receiving in-principle approval.
The licence removes transaction-volume caps but pulls Gemini into a heavier supervisory regime covering AML, tech risk and reporting.
Singapore’s approval queue is slow by design — and that slowness is becoming the region’s competitive filter.
The Real Story Isn’t the Licence. It’s the Wait.
Most coverage of Gemini’s Singapore approval will read like a press release. The more interesting number is the calendar.
MAS issued in-principle approval in October 2024. Final authorisation arrived this week. Nearly two years passed between “yes, in principle” and “yes.” For an exchange with a US public listing, an established institutional book and a decade of operating history, that is a long time to sit in a regulatory waiting room – and it tells you more about Singapore’s posture than any policy speech.
Timeline
2020 – Gemini begins serving Singapore customers, initially through its US entity under an exemption.
October 2024 – MAS grants in-principle approval for an MPI licence covering digital payment tokens and cross-border transfers.
April 2025 – Customers are migrated from Gemini Trust Company into the locally incorporated Gemini Digital Payments Singapore while the application matures.
September 9, 2026 – Full MPI licence granted.
What Changes Operationally
The headline benefit is structural. MPI holders operate without the transaction-volume ceilings that constrain standard payment institutions – which matters enormously for an exchange whose Singapore business skews institutional. Volume caps are a ceiling on ambition; removing them turns Singapore from a compliance outpost into a viable booking centre.
The trade-off is supervisory weight. MAS applies broader obligations to MPIs precisely because scale creates larger risk, with continuing requirements around anti-money laundering, customer due diligence, technology risk and regulatory reporting. This is not a licence you win once. It is one you re-earn quarterly.
Why It Matters Beyond Gemini
Singapore has quietly assembled a short, curated list. Coinbase, Crypto.com, OKX, Bitstamp and Cumberland already hold MPI authorisation – and the roster is notable for who isn’t on it. MAS has been deliberate about the distinction between locally licensed firms and offshore platforms that merely happen to be reachable from a Singapore IP address.
That distinction is the strategic point. Global scale confers nothing locally. For years, exchanges arbitraged jurisdictional ambiguity across Asia. Singapore has made that arbitrage expensive by making the licence slow, costly and revocable.
Looking Forward
Expect the licensed cohort to consolidate rather than expand. Approvals of this weight function as moats – each one raises the credible-entry cost for the next applicant, and Hong Kong, Japan and the UAE are converging on similar architecture.
Conclusion
Gemini’s licence is a milestone, but the durable signal is Singapore’s willingness to make firms wait two years for legitimacy. In a sector built on speed, the jurisdictions setting the terms are the ones refusing to hurry.
This post Gemini’s Singapore unit now holds a full Major Payment Institution (MPI) licence first appeared on BitcoinWorld.
162
·
--

Article
Polkadot Tries Again: Why DotUSD Is a Second Chance, Not a New IdeaBitcoinWorldPolkadot Tries Again: Why dotUSD Is a Second Chance, Not a New Idea
Key takeaways
Referendum 1944 proposes dotUSD, a protocol-owned stablecoin, and is running at roughly 97.5% approval on OpenGov’s Root track.
This is Polkadot’s third attempt at native stable liquidity, following Acala’s aUSD collapse in 2022 and the stalled pUSD proposal in 2025.
The rollout is deliberately staged: USDT-backed issuance first, DOT collateral vaults and liquidations only in phase two.
Treasury commitment is $5 million, split between minting reserves and a dotUSD pair on Asset Hub.
DOT gained 42.5% on the week, but the real test is adoption after the vote, not the vote itself.
Polkadot is not launching a stablecoin because stablecoins are fashionable. It is launching one because the last attempt in its orbit failed badly enough to leave a scar – and the network has spent four years living with the consequences.
Referendum 1944, titled “dotUSD: A Native Stablecoin for Polkadot,” went on-chain Monday at 11:49 a.m. ET and sits on OpenGov’s Root track, reserved for decisions that touch the protocol itself. Support is close to unanimous: roughly 2.3 million DOT in favor against under 60,000 opposed, about 97.5% approval. DOT responded with a 16.7% single-day move and a 42.5% weekly gain, the strongest among the fifty largest tokens.
The part most coverage skips
This is Polkadot’s third pass at the problem. Acala’s aUSD collapsed in 2022 after an exploit minted billions of unbacked tokens, and the fallout effectively removed native stable liquidity from the ecosystem. In 2025, a proposal called pUSD – built on Acala’s Honzon stack – cleared 75% support but stalled amid community objections about who would build it and who would supervise risk. Gavin Wood had already laid out his conditions publicly: full DOT collateralization, governance control by Polkadot itself, and DAI-grade security assumptions.
dotUSD reads as a direct answer to those objections. The design borrows from Liquity v2 rather than Honzon, and the rollout is deliberately staged. Phase one issues dotUSD against a capped USDT-backed buffer – no oracles, no liquidation engine, no DOT price dependency. Only in phase two do DOT vaults, real-time price feeds, and liquidations arrive. The treasury commitment is modest by design: $2.5 million in USDT for minting and $2.5 million in DOT seeding a dotUSD pair on Asset Hub.
Why the sequencing matters more than the peg
Overcollateralized CDP stablecoins fail in a predictable way. Collateral drops, liquidations queue up, thin exchange liquidity turns orderly unwinding into a cascade, and the peg breaks before the mechanism can respond. By deferring DOT collateral until liquidity exists and the machinery has been tested, Polkadot avoids the exact failure mode that killed its predecessor. A stability pool absorbs liquidated positions instead of dumping collateral into open markets.
There is a reflexive economic story too, and traders clearly noticed it. Every dollar of dotUSD minted in phase two locks up more than a dollar of DOT, converting stablecoin demand into structural demand for the collateral asset. That mechanism is real, but it only activates in phase two – and only if anyone actually wants to hold dotUSD.
The harder question
Sovereignty is the strategic case: if Tether or Circle ever restricted access on Polkadot, the ecosystem currently has no fallback. That argument is sound. Adoption is the unsolved part. Native stablecoins do not win on ideology; they win on liquidity depth, integrations, and yield. Polkadot’s DeFi footprint remains small, and $5 million buys a beginning, not a market.
Conclusion
The vote will pass. The interesting period starts afterward, when dotUSD has to earn usage rather than approval – and when phase two decides whether Polkadot learned the right lesson from aUSD or merely rewrote it.
This post Polkadot Tries Again: Why dotUSD Is a Second Chance, Not a New Idea first appeared on BitcoinWorld.
Polkadot Tries Again: Why DotUSD Is a Second Chance, Not a New Idea
BitcoinWorldPolkadot Tries Again: Why dotUSD Is a Second Chance, Not a New Idea
Key takeaways
Referendum 1944 proposes dotUSD, a protocol-owned stablecoin, and is running at roughly 97.5% approval on OpenGov’s Root track.
This is Polkadot’s third attempt at native stable liquidity, following Acala’s aUSD collapse in 2022 and the stalled pUSD proposal in 2025.
The rollout is deliberately staged: USDT-backed issuance first, DOT collateral vaults and liquidations only in phase two.
Treasury commitment is $5 million, split between minting reserves and a dotUSD pair on Asset Hub.
DOT gained 42.5% on the week, but the real test is adoption after the vote, not the vote itself.
Polkadot is not launching a stablecoin because stablecoins are fashionable. It is launching one because the last attempt in its orbit failed badly enough to leave a scar – and the network has spent four years living with the consequences.
Referendum 1944, titled “dotUSD: A Native Stablecoin for Polkadot,” went on-chain Monday at 11:49 a.m. ET and sits on OpenGov’s Root track, reserved for decisions that touch the protocol itself. Support is close to unanimous: roughly 2.3 million DOT in favor against under 60,000 opposed, about 97.5% approval. DOT responded with a 16.7% single-day move and a 42.5% weekly gain, the strongest among the fifty largest tokens.
The part most coverage skips
This is Polkadot’s third pass at the problem. Acala’s aUSD collapsed in 2022 after an exploit minted billions of unbacked tokens, and the fallout effectively removed native stable liquidity from the ecosystem. In 2025, a proposal called pUSD – built on Acala’s Honzon stack – cleared 75% support but stalled amid community objections about who would build it and who would supervise risk. Gavin Wood had already laid out his conditions publicly: full DOT collateralization, governance control by Polkadot itself, and DAI-grade security assumptions.
dotUSD reads as a direct answer to those objections. The design borrows from Liquity v2 rather than Honzon, and the rollout is deliberately staged. Phase one issues dotUSD against a capped USDT-backed buffer – no oracles, no liquidation engine, no DOT price dependency. Only in phase two do DOT vaults, real-time price feeds, and liquidations arrive. The treasury commitment is modest by design: $2.5 million in USDT for minting and $2.5 million in DOT seeding a dotUSD pair on Asset Hub.
Why the sequencing matters more than the peg
Overcollateralized CDP stablecoins fail in a predictable way. Collateral drops, liquidations queue up, thin exchange liquidity turns orderly unwinding into a cascade, and the peg breaks before the mechanism can respond. By deferring DOT collateral until liquidity exists and the machinery has been tested, Polkadot avoids the exact failure mode that killed its predecessor. A stability pool absorbs liquidated positions instead of dumping collateral into open markets.
There is a reflexive economic story too, and traders clearly noticed it. Every dollar of dotUSD minted in phase two locks up more than a dollar of DOT, converting stablecoin demand into structural demand for the collateral asset. That mechanism is real, but it only activates in phase two – and only if anyone actually wants to hold dotUSD.
The harder question
Sovereignty is the strategic case: if Tether or Circle ever restricted access on Polkadot, the ecosystem currently has no fallback. That argument is sound. Adoption is the unsolved part. Native stablecoins do not win on ideology; they win on liquidity depth, integrations, and yield. Polkadot’s DeFi footprint remains small, and $5 million buys a beginning, not a market.
Conclusion
The vote will pass. The interesting period starts afterward, when dotUSD has to earn usage rather than approval – and when phase two decides whether Polkadot learned the right lesson from aUSD or merely rewrote it.
This post Polkadot Tries Again: Why dotUSD Is a Second Chance, Not a New Idea first appeared on BitcoinWorld.
Key takeaways
Referendum 1944 proposes dotUSD, a protocol-owned stablecoin, and is running at roughly 97.5% approval on OpenGov’s Root track.
This is Polkadot’s third attempt at native stable liquidity, following Acala’s aUSD collapse in 2022 and the stalled pUSD proposal in 2025.
The rollout is deliberately staged: USDT-backed issuance first, DOT collateral vaults and liquidations only in phase two.
Treasury commitment is $5 million, split between minting reserves and a dotUSD pair on Asset Hub.
DOT gained 42.5% on the week, but the real test is adoption after the vote, not the vote itself.
Polkadot is not launching a stablecoin because stablecoins are fashionable. It is launching one because the last attempt in its orbit failed badly enough to leave a scar – and the network has spent four years living with the consequences.
Referendum 1944, titled “dotUSD: A Native Stablecoin for Polkadot,” went on-chain Monday at 11:49 a.m. ET and sits on OpenGov’s Root track, reserved for decisions that touch the protocol itself. Support is close to unanimous: roughly 2.3 million DOT in favor against under 60,000 opposed, about 97.5% approval. DOT responded with a 16.7% single-day move and a 42.5% weekly gain, the strongest among the fifty largest tokens.
The part most coverage skips
This is Polkadot’s third pass at the problem. Acala’s aUSD collapsed in 2022 after an exploit minted billions of unbacked tokens, and the fallout effectively removed native stable liquidity from the ecosystem. In 2025, a proposal called pUSD – built on Acala’s Honzon stack – cleared 75% support but stalled amid community objections about who would build it and who would supervise risk. Gavin Wood had already laid out his conditions publicly: full DOT collateralization, governance control by Polkadot itself, and DAI-grade security assumptions.
dotUSD reads as a direct answer to those objections. The design borrows from Liquity v2 rather than Honzon, and the rollout is deliberately staged. Phase one issues dotUSD against a capped USDT-backed buffer – no oracles, no liquidation engine, no DOT price dependency. Only in phase two do DOT vaults, real-time price feeds, and liquidations arrive. The treasury commitment is modest by design: $2.5 million in USDT for minting and $2.5 million in DOT seeding a dotUSD pair on Asset Hub.
Why the sequencing matters more than the peg
Overcollateralized CDP stablecoins fail in a predictable way. Collateral drops, liquidations queue up, thin exchange liquidity turns orderly unwinding into a cascade, and the peg breaks before the mechanism can respond. By deferring DOT collateral until liquidity exists and the machinery has been tested, Polkadot avoids the exact failure mode that killed its predecessor. A stability pool absorbs liquidated positions instead of dumping collateral into open markets.
There is a reflexive economic story too, and traders clearly noticed it. Every dollar of dotUSD minted in phase two locks up more than a dollar of DOT, converting stablecoin demand into structural demand for the collateral asset. That mechanism is real, but it only activates in phase two – and only if anyone actually wants to hold dotUSD.
The harder question
Sovereignty is the strategic case: if Tether or Circle ever restricted access on Polkadot, the ecosystem currently has no fallback. That argument is sound. Adoption is the unsolved part. Native stablecoins do not win on ideology; they win on liquidity depth, integrations, and yield. Polkadot’s DeFi footprint remains small, and $5 million buys a beginning, not a market.
Conclusion
The vote will pass. The interesting period starts afterward, when dotUSD has to earn usage rather than approval – and when phase two decides whether Polkadot learned the right lesson from aUSD or merely rewrote it.
This post Polkadot Tries Again: Why dotUSD Is a Second Chance, Not a New Idea first appeared on BitcoinWorld.
1
529
·
--

Article
Want to Buy a Private Jet? Now You Can Pay in BitcoinBitcoinWorldWant to Buy a Private Jet? Now You Can Pay in Bitcoin
There’s a small but meaningful difference between accepting Bitcoin and pricing in Bitcoin. Almost every “we take crypto” headline of the past decade has been the first thing wearing the costume of the second. A dealership, a developer, a luxury broker announces BTC payments, then quietly routes the coins through a payment processor that converts to dollars before the wire clears. The dollar stayed the unit of account. Bitcoin was just a rail.
Grant Cardone’s private jet listing is interesting because it flips that arrangement, at least on paper. The asking price is 1,025 BTC. Not “$80 million, payable in Bitcoin.” The coin count is the number. The dollar figure is whatever the market says it is on the day someone signs. That distinction is the entire story, and it’s worth more attention than the aircraft itself.
Let’s do a math
Start with the math. Bitcoin has been trading around $78,500 at the time of wrtiting this article, which puts 1,025 coins at roughly $80.5 million. The aircraft is a 2024 Bombardier Global 7500, an ultra-long-range machine that seats up to 17 and sits at the top of the business jet food chain. When this same tail number surfaced earlier in the year, it was being described as a $75 million jet, listed on Controller with a low airframe time and light usage history.
So the BTC-denominated ask lands above where the cash conversation was sitting seven months ago. On a lightly used but no longer new airframe, in a preowned large-cabin market that has cooled considerably from its 2022 frenzy, that is an ambitious number. Global 7500 inventory has loosened. Buyers at this tier have options, brokers, and appraisers who do not care what asset class the seller is emotionally attached to.
Which tells you something: the coin count is not a discount mechanism. It’s a positioning statement.
The backstory matters more than the listing
This jet has been on and off the market before, and the circumstances were not subtle. In February, minutes after Bitcoin slipped below $70,000, Cardone posted that he had to say goodbye to “the love of my life,” describing the aircraft in listing-copy detail and pointing followers to Controller. Bitcoin had shed more than 20% in a month at that point, well off its October 2025 peak above $126,000.
Critics read that as forced selling. The counter-reading, which Cardone’s camp pushed hard, was capital reallocation: dump a depreciating, maintenance-heavy asset and redirect the capital toward a scarce one.
The second reading has some support in the record. Cardone Capital has been buying through the drawdown, crossing 2,700 BTC with Bitcoin near $59,000, funded through rental cash flow rather than debt or equity raises, with a stated goal of 3,000 BTC this year and 10,000 long term. He has also attached himself to an oddly precise year-end target of $189,425, defending the specificity on the grounds that Bitcoin never lands on round numbers.
Whatever you make of the price target, the balance sheet behavior is consistent. A man converting hard assets into BTC on a schedule pricing his last big toy in BTC is at least internally coherent.
Can someone buy Jet with Bitcoin in todays world?
Here’s where enthusiasm meets the aviation transaction stack, and the aviation transaction stack usually wins.
A jet sale of this size is not a checkout page. There’s a letter of intent, a deposit into escrow, a pre-purchase inspection at an authorized service center that can take two to four weeks and routinely surfaces six-figure discrepancies, delivery conditions, engine and airframe program transfers, and a closing coordinated through the FAA registry in Oklahoma City. On aircraft with international exposure there’s a Cape Town Convention filing and an IDERA to unwind. Title and lien searches take days. Nothing about this moves at block speed.
Now overlay Bitcoin. Escrow agents in aviation are set up to hold dollars in segregated accounts under state trust rules. Very few are equipped to custody eight figures of BTC through a 45-day close with price volatility running. Someone has to eat the delta. If BTC drops 15% during inspection, does the buyer top up the coins or does the seller absorb it? That single clause is where most crypto-denominated deals collapse, and it’s why “priced in BTC, settled in dollars at signing” is the compromise nearly everyone lands on.
Then there’s tax. In the United States, spending Bitcoin is a disposal. A buyer sending 1,025 coins acquired at a lower basis realizes capital gains on the full spread, immediately, in a year with no offsetting loss harvest unless they’ve planned for it. For an early holder, the tax bill on the transaction could exceed what a comparable financed purchase would cost in interest. On the sell side, an aircraft that has been depreciated aggressively carries recapture exposure, so the seller has his own reasons to care about how proceeds are characterized.
Add AML. Compliance officers at title companies and banks are not thrilled by an eight-figure inbound crypto transfer. Source-of-funds documentation, Travel Rule data, and chain analytics screening are all now standard for transfers of this size through any regulated venue.
None of this makes the deal impossible. It makes it slow, lawyered, and far more likely to settle in fiat than the headline suggests.
What comes next
The more consequential trend sitting behind this story isn’t jets. It’s the slow migration of high-value asset settlement toward digital rails, and the growing likelihood that stablecoins rather than Bitcoin end up doing that work. A tokenized dollar settles instantly, doesn’t move 8% during due diligence, and doesn’t trigger a taxable disposal. If aircraft, yachts, and commercial real estate start closing on-chain over the next few years, they will almost certainly close in USDC and its regulated cousins, with Bitcoin remaining the reserve asset people hold rather than the medium they spend.
That’s the quiet irony. Listings like this one are framed as proof that Bitcoin is becoming money, but the friction they expose is exactly the argument for why it probably won’t be the transactional layer. Good collateral and good currency are different jobs.
Conclusion
A 1,025 BTC price tag on a Global 7500 is a well-constructed piece of theater with a real question buried inside it. The listing costs nothing to make and delivers enormous attention. The close is where the claim gets tested, and the close involves escrow agents, tax counsel, an inspection facility, and a compliance department, none of which are ideologically motivated.
Watch for three things: whether the transaction documents denominate in BTC or dollars, whether an escrow agent takes custody of actual coins, and whether the settled price at closing matches the 1,025 figure or gets renegotiated against a dollar benchmark. If all three land on the Bitcoin side, that’s a genuine milestone worth writing about. If they don’t, this was a very effective advertisement for a fund that buys Bitcoin with rent money, and the dollar remains the language everyone still thinks in.
This post Want to Buy a Private Jet? Now You Can Pay in Bitcoin first appeared on BitcoinWorld.
Want to Buy a Private Jet? Now You Can Pay in Bitcoin
BitcoinWorldWant to Buy a Private Jet? Now You Can Pay in Bitcoin
There’s a small but meaningful difference between accepting Bitcoin and pricing in Bitcoin. Almost every “we take crypto” headline of the past decade has been the first thing wearing the costume of the second. A dealership, a developer, a luxury broker announces BTC payments, then quietly routes the coins through a payment processor that converts to dollars before the wire clears. The dollar stayed the unit of account. Bitcoin was just a rail.
Grant Cardone’s private jet listing is interesting because it flips that arrangement, at least on paper. The asking price is 1,025 BTC. Not “$80 million, payable in Bitcoin.” The coin count is the number. The dollar figure is whatever the market says it is on the day someone signs. That distinction is the entire story, and it’s worth more attention than the aircraft itself.
Let’s do a math
Start with the math. Bitcoin has been trading around $78,500 at the time of wrtiting this article, which puts 1,025 coins at roughly $80.5 million. The aircraft is a 2024 Bombardier Global 7500, an ultra-long-range machine that seats up to 17 and sits at the top of the business jet food chain. When this same tail number surfaced earlier in the year, it was being described as a $75 million jet, listed on Controller with a low airframe time and light usage history.
So the BTC-denominated ask lands above where the cash conversation was sitting seven months ago. On a lightly used but no longer new airframe, in a preowned large-cabin market that has cooled considerably from its 2022 frenzy, that is an ambitious number. Global 7500 inventory has loosened. Buyers at this tier have options, brokers, and appraisers who do not care what asset class the seller is emotionally attached to.
Which tells you something: the coin count is not a discount mechanism. It’s a positioning statement.
The backstory matters more than the listing
This jet has been on and off the market before, and the circumstances were not subtle. In February, minutes after Bitcoin slipped below $70,000, Cardone posted that he had to say goodbye to “the love of my life,” describing the aircraft in listing-copy detail and pointing followers to Controller. Bitcoin had shed more than 20% in a month at that point, well off its October 2025 peak above $126,000.
Critics read that as forced selling. The counter-reading, which Cardone’s camp pushed hard, was capital reallocation: dump a depreciating, maintenance-heavy asset and redirect the capital toward a scarce one.
The second reading has some support in the record. Cardone Capital has been buying through the drawdown, crossing 2,700 BTC with Bitcoin near $59,000, funded through rental cash flow rather than debt or equity raises, with a stated goal of 3,000 BTC this year and 10,000 long term. He has also attached himself to an oddly precise year-end target of $189,425, defending the specificity on the grounds that Bitcoin never lands on round numbers.
Whatever you make of the price target, the balance sheet behavior is consistent. A man converting hard assets into BTC on a schedule pricing his last big toy in BTC is at least internally coherent.
Can someone buy Jet with Bitcoin in todays world?
Here’s where enthusiasm meets the aviation transaction stack, and the aviation transaction stack usually wins.
A jet sale of this size is not a checkout page. There’s a letter of intent, a deposit into escrow, a pre-purchase inspection at an authorized service center that can take two to four weeks and routinely surfaces six-figure discrepancies, delivery conditions, engine and airframe program transfers, and a closing coordinated through the FAA registry in Oklahoma City. On aircraft with international exposure there’s a Cape Town Convention filing and an IDERA to unwind. Title and lien searches take days. Nothing about this moves at block speed.
Now overlay Bitcoin. Escrow agents in aviation are set up to hold dollars in segregated accounts under state trust rules. Very few are equipped to custody eight figures of BTC through a 45-day close with price volatility running. Someone has to eat the delta. If BTC drops 15% during inspection, does the buyer top up the coins or does the seller absorb it? That single clause is where most crypto-denominated deals collapse, and it’s why “priced in BTC, settled in dollars at signing” is the compromise nearly everyone lands on.
Then there’s tax. In the United States, spending Bitcoin is a disposal. A buyer sending 1,025 coins acquired at a lower basis realizes capital gains on the full spread, immediately, in a year with no offsetting loss harvest unless they’ve planned for it. For an early holder, the tax bill on the transaction could exceed what a comparable financed purchase would cost in interest. On the sell side, an aircraft that has been depreciated aggressively carries recapture exposure, so the seller has his own reasons to care about how proceeds are characterized.
Add AML. Compliance officers at title companies and banks are not thrilled by an eight-figure inbound crypto transfer. Source-of-funds documentation, Travel Rule data, and chain analytics screening are all now standard for transfers of this size through any regulated venue.
None of this makes the deal impossible. It makes it slow, lawyered, and far more likely to settle in fiat than the headline suggests.
What comes next
The more consequential trend sitting behind this story isn’t jets. It’s the slow migration of high-value asset settlement toward digital rails, and the growing likelihood that stablecoins rather than Bitcoin end up doing that work. A tokenized dollar settles instantly, doesn’t move 8% during due diligence, and doesn’t trigger a taxable disposal. If aircraft, yachts, and commercial real estate start closing on-chain over the next few years, they will almost certainly close in USDC and its regulated cousins, with Bitcoin remaining the reserve asset people hold rather than the medium they spend.
That’s the quiet irony. Listings like this one are framed as proof that Bitcoin is becoming money, but the friction they expose is exactly the argument for why it probably won’t be the transactional layer. Good collateral and good currency are different jobs.
Conclusion
A 1,025 BTC price tag on a Global 7500 is a well-constructed piece of theater with a real question buried inside it. The listing costs nothing to make and delivers enormous attention. The close is where the claim gets tested, and the close involves escrow agents, tax counsel, an inspection facility, and a compliance department, none of which are ideologically motivated.
Watch for three things: whether the transaction documents denominate in BTC or dollars, whether an escrow agent takes custody of actual coins, and whether the settled price at closing matches the 1,025 figure or gets renegotiated against a dollar benchmark. If all three land on the Bitcoin side, that’s a genuine milestone worth writing about. If they don’t, this was a very effective advertisement for a fund that buys Bitcoin with rent money, and the dollar remains the language everyone still thinks in.
This post Want to Buy a Private Jet? Now You Can Pay in Bitcoin first appeared on BitcoinWorld.
There’s a small but meaningful difference between accepting Bitcoin and pricing in Bitcoin. Almost every “we take crypto” headline of the past decade has been the first thing wearing the costume of the second. A dealership, a developer, a luxury broker announces BTC payments, then quietly routes the coins through a payment processor that converts to dollars before the wire clears. The dollar stayed the unit of account. Bitcoin was just a rail.
Grant Cardone’s private jet listing is interesting because it flips that arrangement, at least on paper. The asking price is 1,025 BTC. Not “$80 million, payable in Bitcoin.” The coin count is the number. The dollar figure is whatever the market says it is on the day someone signs. That distinction is the entire story, and it’s worth more attention than the aircraft itself.
Let’s do a math
Start with the math. Bitcoin has been trading around $78,500 at the time of wrtiting this article, which puts 1,025 coins at roughly $80.5 million. The aircraft is a 2024 Bombardier Global 7500, an ultra-long-range machine that seats up to 17 and sits at the top of the business jet food chain. When this same tail number surfaced earlier in the year, it was being described as a $75 million jet, listed on Controller with a low airframe time and light usage history.
So the BTC-denominated ask lands above where the cash conversation was sitting seven months ago. On a lightly used but no longer new airframe, in a preowned large-cabin market that has cooled considerably from its 2022 frenzy, that is an ambitious number. Global 7500 inventory has loosened. Buyers at this tier have options, brokers, and appraisers who do not care what asset class the seller is emotionally attached to.
Which tells you something: the coin count is not a discount mechanism. It’s a positioning statement.
The backstory matters more than the listing
This jet has been on and off the market before, and the circumstances were not subtle. In February, minutes after Bitcoin slipped below $70,000, Cardone posted that he had to say goodbye to “the love of my life,” describing the aircraft in listing-copy detail and pointing followers to Controller. Bitcoin had shed more than 20% in a month at that point, well off its October 2025 peak above $126,000.
Critics read that as forced selling. The counter-reading, which Cardone’s camp pushed hard, was capital reallocation: dump a depreciating, maintenance-heavy asset and redirect the capital toward a scarce one.
The second reading has some support in the record. Cardone Capital has been buying through the drawdown, crossing 2,700 BTC with Bitcoin near $59,000, funded through rental cash flow rather than debt or equity raises, with a stated goal of 3,000 BTC this year and 10,000 long term. He has also attached himself to an oddly precise year-end target of $189,425, defending the specificity on the grounds that Bitcoin never lands on round numbers.
Whatever you make of the price target, the balance sheet behavior is consistent. A man converting hard assets into BTC on a schedule pricing his last big toy in BTC is at least internally coherent.
Can someone buy Jet with Bitcoin in todays world?
Here’s where enthusiasm meets the aviation transaction stack, and the aviation transaction stack usually wins.
A jet sale of this size is not a checkout page. There’s a letter of intent, a deposit into escrow, a pre-purchase inspection at an authorized service center that can take two to four weeks and routinely surfaces six-figure discrepancies, delivery conditions, engine and airframe program transfers, and a closing coordinated through the FAA registry in Oklahoma City. On aircraft with international exposure there’s a Cape Town Convention filing and an IDERA to unwind. Title and lien searches take days. Nothing about this moves at block speed.
Now overlay Bitcoin. Escrow agents in aviation are set up to hold dollars in segregated accounts under state trust rules. Very few are equipped to custody eight figures of BTC through a 45-day close with price volatility running. Someone has to eat the delta. If BTC drops 15% during inspection, does the buyer top up the coins or does the seller absorb it? That single clause is where most crypto-denominated deals collapse, and it’s why “priced in BTC, settled in dollars at signing” is the compromise nearly everyone lands on.
Then there’s tax. In the United States, spending Bitcoin is a disposal. A buyer sending 1,025 coins acquired at a lower basis realizes capital gains on the full spread, immediately, in a year with no offsetting loss harvest unless they’ve planned for it. For an early holder, the tax bill on the transaction could exceed what a comparable financed purchase would cost in interest. On the sell side, an aircraft that has been depreciated aggressively carries recapture exposure, so the seller has his own reasons to care about how proceeds are characterized.
Add AML. Compliance officers at title companies and banks are not thrilled by an eight-figure inbound crypto transfer. Source-of-funds documentation, Travel Rule data, and chain analytics screening are all now standard for transfers of this size through any regulated venue.
None of this makes the deal impossible. It makes it slow, lawyered, and far more likely to settle in fiat than the headline suggests.
What comes next
The more consequential trend sitting behind this story isn’t jets. It’s the slow migration of high-value asset settlement toward digital rails, and the growing likelihood that stablecoins rather than Bitcoin end up doing that work. A tokenized dollar settles instantly, doesn’t move 8% during due diligence, and doesn’t trigger a taxable disposal. If aircraft, yachts, and commercial real estate start closing on-chain over the next few years, they will almost certainly close in USDC and its regulated cousins, with Bitcoin remaining the reserve asset people hold rather than the medium they spend.
That’s the quiet irony. Listings like this one are framed as proof that Bitcoin is becoming money, but the friction they expose is exactly the argument for why it probably won’t be the transactional layer. Good collateral and good currency are different jobs.
Conclusion
A 1,025 BTC price tag on a Global 7500 is a well-constructed piece of theater with a real question buried inside it. The listing costs nothing to make and delivers enormous attention. The close is where the claim gets tested, and the close involves escrow agents, tax counsel, an inspection facility, and a compliance department, none of which are ideologically motivated.
Watch for three things: whether the transaction documents denominate in BTC or dollars, whether an escrow agent takes custody of actual coins, and whether the settled price at closing matches the 1,025 figure or gets renegotiated against a dollar benchmark. If all three land on the Bitcoin side, that’s a genuine milestone worth writing about. If they don’t, this was a very effective advertisement for a fund that buys Bitcoin with rent money, and the dollar remains the language everyone still thinks in.
This post Want to Buy a Private Jet? Now You Can Pay in Bitcoin first appeared on BitcoinWorld.
252
Log in to explore more content
Join global crypto users on Binance Square
⚡️ Get latest and useful information about crypto.
💬 Trusted by the world’s largest crypto exchange.
👍 Discover real insights from verified creators.
Email / Phone number
Trending Topics
ClarityActFacesProceduralVoteSept15
24,804 views
421 Discussing
#clarityactfacesproceduralvotesept15
🚨 CLARITY Act Faces Procedural Vote September 15 🚨
The Senate chamber is quiet, but the crypto market is already watching the clock. On September 15, one procedural vote could determine whether a major U.S. crypto market-structure bill gets its chance to move forward.
The CLARITY Act is not facing final passage that day. Senators are expected to vote on a motion to proceed, a critical procedural step that requires 60 votes to clear the Senate hurdle.
That distinction matters. A successful vote would not make the bill law, but it would open the door to further Senate consideration and negotiations.
The stakes are substantial because the legislation aims to establish clearer rules around digital assets and determine how responsibilities are divided between U.S. regulators.
The latest 630-page revision also adds provisions addressing certain non-decentralized trading protocols, while several political and regulatory disagreements remain unresolved.
My take: September 15 should be viewed less as a victory-or-defeat day and more as a credibility test. Clearing the procedural barrier could strengthen confidence that U.S. crypto legislation is moving toward a clearer framework. Failure could extend uncertainty.
For crypto markets, regulatory clarity can influence institutional participation, business decisions, and how investors price U.S. exposure. But expectations can move faster than legislation itself.
The real signal is not whether crypto gets clarity overnight, but whether lawmakers can finally build enough consensus to move the process forward.
Will the September 15 vote become a turning point for U.S. crypto regulation, or another delay?
Disclaimer: This article is for educational purposes only and is not financial advice. Conduct your own research and manage risk carefully.
#CryptoRegulation #Bitcoin #GrowWithSAC $SUI $NEAR $BNB
#ClarityActFacesProceduralVoteSept15
Sienna Leo-你真棒-带我走
·3 Likes
·2.9k views
US2YearYieldRisesTo4.61%
23,884 views
484 Discussing
US10YearTreasuryYieldNears5%
12,216 views
270 Discussing