
LiliOnChain
3.3k Posts

LiliOnChain
Report
Block User
Crypto Analyst | Setups • Market Insights | Strategy over emotions. Follow for profit driven insights.
Open Trade
3.6 Months
34 Following
954 Followers
1.4K+ Liked
Posts
Portfolio
All
Quotes
Videos
Live
PINNED
·
--
GUYS LET’S HIT 1000 FOLLOWERS! ❤️
As promised, I've been dropping red packets every time we complete another 100 followers. And I haven't forgotten my biggest promise…
When we reach 1000 followers, I'll drop a BIG reward for this community!
I hope we hit that milestone soon and I want you all to be part of it. Keep supporting, sharing and growing with me. Let's make it happen together! 💗
$AKE #BinanceSquare $INIT #GIVEAWAY🎁 $AGT #TrendingTopic
Now tell me which coin do you want?
GUYS LET’S HIT 1000 FOLLOWERS! ❤️
As promised, I've been dropping red packets every time we complete another 100 followers. And I haven't forgotten my biggest promise…
When we reach 1000 followers, I'll drop a BIG reward for this community!
I hope we hit that milestone soon and I want you all to be part of it. Keep supporting, sharing and growing with me. Let's make it happen together! 💗
$AKE #BinanceSquare $INIT #GIVEAWAY🎁 $AGT #TrendingTopic
Now tell me which coin do you want?
As promised, I've been dropping red packets every time we complete another 100 followers. And I haven't forgotten my biggest promise…
When we reach 1000 followers, I'll drop a BIG reward for this community!
I hope we hit that milestone soon and I want you all to be part of it. Keep supporting, sharing and growing with me. Let's make it happen together! 💗
$AKE #BinanceSquare $INIT #GIVEAWAY🎁 $AGT #TrendingTopic
Now tell me which coin do you want?
NEAR
10%
PEPE
28%
SOL
62%
Any other coin? Comment below!
0%
29 votes • Voting closed
93
16
51
5k
PINNED
·
--
🚨 FUTURES SELLERS ARE TAKING CONTROL AGAIN.
$PONS -20.34%
$US -17.88%
$牛来 -15.76%
$4 -13.85%
$OPEN -12.05%
$BR -11.25%
$MARSCOIN -11.20%
$MOVR -10.35%
What catches my attention is the breadth it’s not just one coin getting hit. Almost the entire list is down double digits.
And after seeing some of these same names make huge moves recently, this is exactly where I start watching volume, funding and whether buyers defend support rather than blindly chasing the dump.
Big red candles create fear.
The reaction after the dump creates the setup.
#BinanceSquare #TrendingTopic
Which one are you watching?
🚨 FUTURES SELLERS ARE TAKING CONTROL AGAIN.
$PONS -20.34%
$US -17.88%
$牛来 -15.76%
$4 -13.85%
$OPEN -12.05%
$BR -11.25%
$MARSCOIN -11.20%
$MOVR -10.35%
What catches my attention is the breadth it’s not just one coin getting hit. Almost the entire list is down double digits.
And after seeing some of these same names make huge moves recently, this is exactly where I start watching volume, funding and whether buyers defend support rather than blindly chasing the dump.
Big red candles create fear.
The reaction after the dump creates the setup.
#BinanceSquare #TrendingTopic
Which one are you watching?
$PONS -20.34%
$US -17.88%
$牛来 -15.76%
$4 -13.85%
$OPEN -12.05%
$BR -11.25%
$MARSCOIN -11.20%
$MOVR -10.35%
What catches my attention is the breadth it’s not just one coin getting hit. Almost the entire list is down double digits.
And after seeing some of these same names make huge moves recently, this is exactly where I start watching volume, funding and whether buyers defend support rather than blindly chasing the dump.
Big red candles create fear.
The reaction after the dump creates the setup.
#BinanceSquare #TrendingTopic
Which one are you watching?
PONS — Biggest drop
57%
USU — Sharp selloff
13%
MARSCOIN — Pullback watch
10%
MOVR — Can it recover?
20%
88 votes • Voting closed
5
16
14.1k



·
--
Bearish
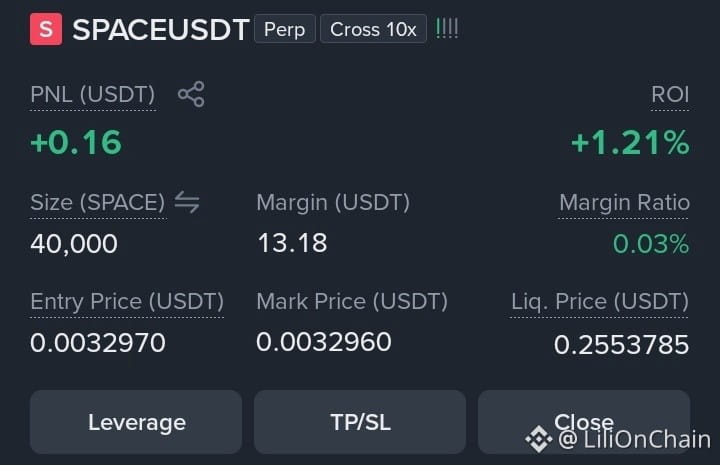
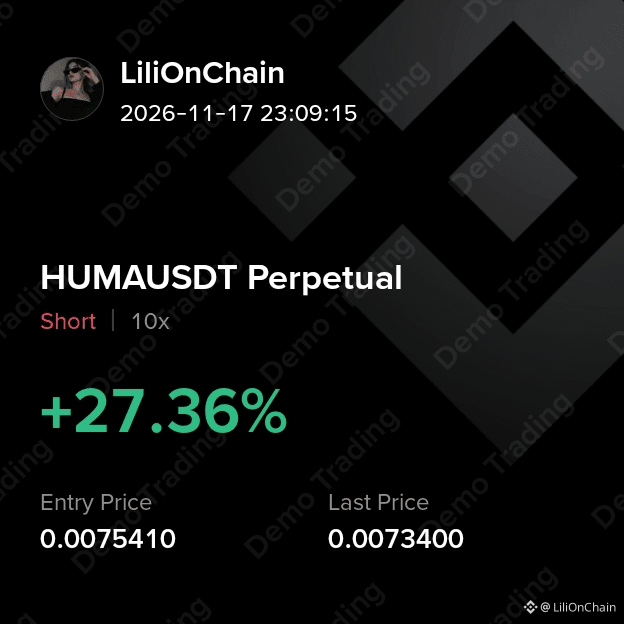
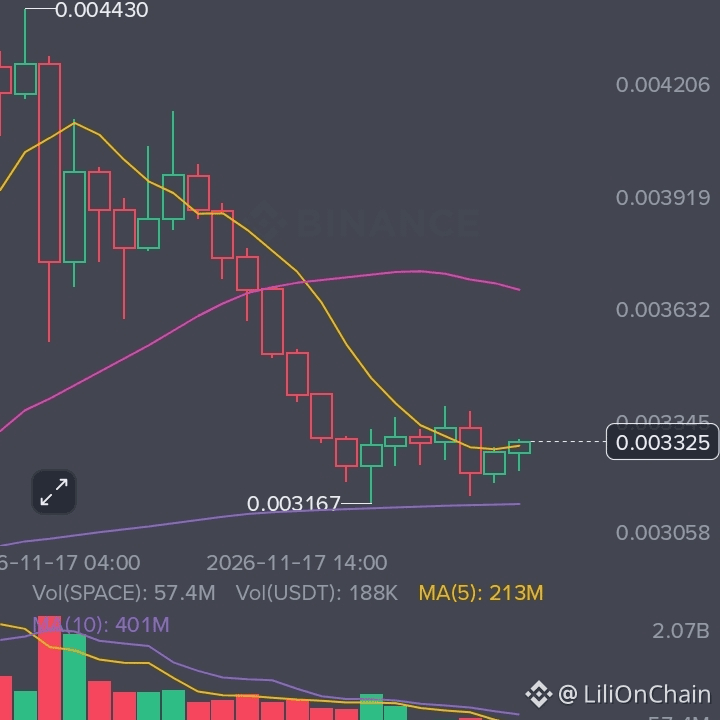
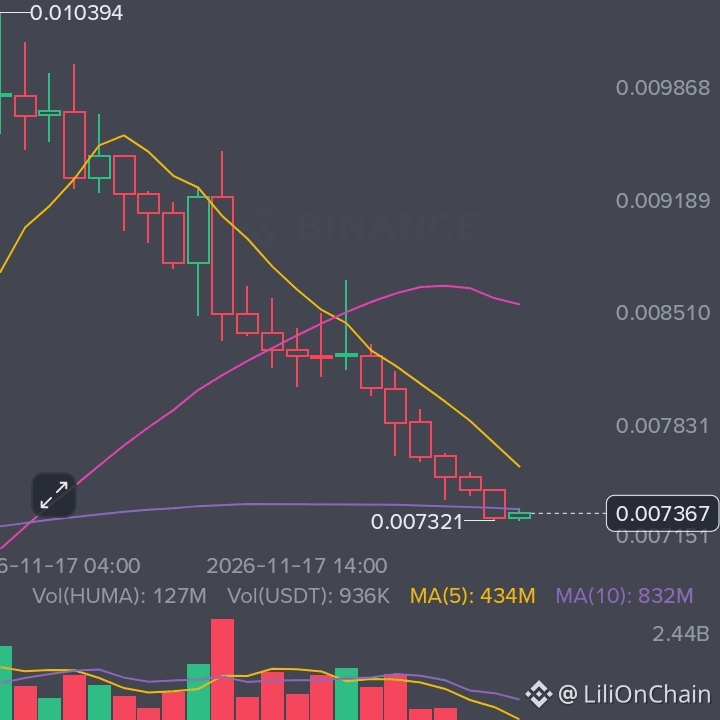
Two Coins, Two Bearish Charts! Guys both #Space and HUMA are under selling pressure. The 1H charts are showing weakness.
🔴 $SPACE SHORT now guys thank me later
Price remains below MA(25), while RSI is around 39, showing weak momentum.
TP1: $0.00325
TP2: $0.00317
SL: $0.00355
A clean breakdown below $0.003167 could open the door to further downside.
🔴 $HUMA take SHORT print money with me
Price has been making lower lows and is trading below all major moving averages. RSI has dropped near 14, indicating extremely oversold conditions.
TP1: $0.00732
TP2: $0.00715
SL: $0.00785
OPEN TRADE 👇🏻
{future}(SPACEUSDT)
{future}(HUMAUSDT)
#TradingSignals $CROSS
Two Coins, Two Bearish Charts! Guys both #Space and HUMA are under selling pressure. The 1H charts are showing weakness.
🔴 $SPACE SHORT now guys thank me later
Price remains below MA(25), while RSI is around 39, showing weak momentum.
TP1: $0.00325
TP2: $0.00317
SL: $0.00355
A clean breakdown below $0.003167 could open the door to further downside.
🔴 $HUMA take SHORT print money with me
Price has been making lower lows and is trading below all major moving averages. RSI has dropped near 14, indicating extremely oversold conditions.
TP1: $0.00732
TP2: $0.00715
SL: $0.00785
OPEN TRADE 👇🏻
#TradingSignals $CROSS
🔴 $SPACE SHORT now guys thank me later
Price remains below MA(25), while RSI is around 39, showing weak momentum.
TP1: $0.00325
TP2: $0.00317
SL: $0.00355
A clean breakdown below $0.003167 could open the door to further downside.
🔴 $HUMA take SHORT print money with me
Price has been making lower lows and is trading below all major moving averages. RSI has dropped near 14, indicating extremely oversold conditions.
TP1: $0.00732
TP2: $0.00715
SL: $0.00785
OPEN TRADE 👇🏻
#TradingSignals $CROSS
1
490
·
--

Fabi_4043
·
--
Siga e curta meu perfil 🧧🧧
$MSFTB
#BitcoinExtendsLosingStreakToSixWeeks
$MSFTB
#BitcoinExtendsLosingStreakToSixWeeks
60
·
--
go
go

白鲨观点VN
·
--
Thị trường chứng khoán Mỹ sắp chạm đáy trên diện rộng. Hãy chuẩn bị trong vòng 48 giờ!
- Phân bổ trung hạn vào cổ phiếu Mỹ:
$SNDK 630~530
$NVDAB 165~155
=> Mục tiêu tăng 50%
- Tích lũy vị thế trong vùng $BTC 74.4~72.5 => Mục tiêu dài hạn: 200k~300k
#baisha
- Phân bổ trung hạn vào cổ phiếu Mỹ:
$SNDK 630~530
$NVDAB 165~155
=> Mục tiêu tăng 50%
- Tích lũy vị thế trong vùng $BTC 74.4~72.5 => Mục tiêu dài hạn: 200k~300k
#baisha

34
·
--


CipherX 零号
·
--
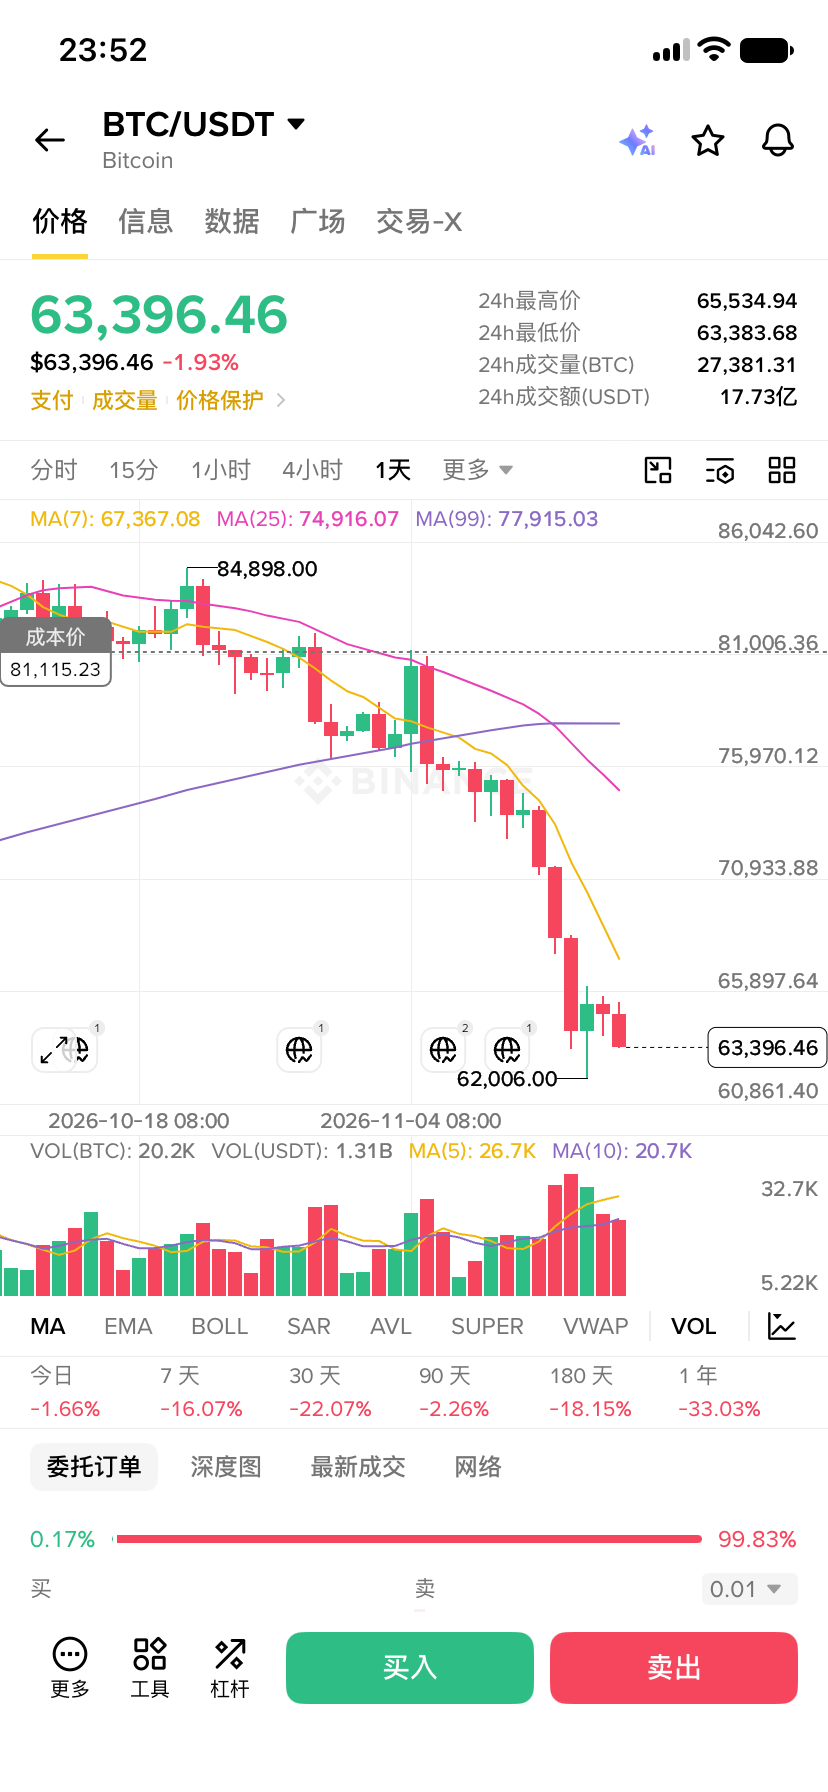
当前BTC/USDT日线图表显示价格位于63,396.46,24小时跌幅1.93%。市场处于明显的空头主导下行趋势中。
* 均线空头排列:MA(7)在67,367下方,MA(25)在74,916,MA(99)在77,915,三线呈向下发散形态,压制价格反弹。
* 支撑与阻力:前期触及低点62,006.00附近,若此防线失守,可能进一步向下测试;上方则面临多重均线密集压制。
* 市场情绪:下方买卖盘比例极度失衡(买单0.17%对卖单99.83%),且近期7天、30天跌幅分别达-16.07%和-22.07%,多头动能极其微弱。
短期维持弱势震荡偏空格局,建议保持谨慎,注意风险控制。
$BTC
$BNB
* 均线空头排列:MA(7)在67,367下方,MA(25)在74,916,MA(99)在77,915,三线呈向下发散形态,压制价格反弹。
* 支撑与阻力:前期触及低点62,006.00附近,若此防线失守,可能进一步向下测试;上方则面临多重均线密集压制。
* 市场情绪:下方买卖盘比例极度失衡(买单0.17%对卖单99.83%),且近期7天、30天跌幅分别达-16.07%和-22.07%,多头动能极其微弱。
短期维持弱势震荡偏空格局,建议保持谨慎,注意风险控制。
$BTC
$BNB
38
·
--
go
go

E L E X A
·
--
🚨 IT’S LIVE 🚨
Watching is simple… but winners take action 👀
🎁 Want FREE $USDT?
💬 Comment 888
❤️ Like
🔁 Share
➕ Follow
⏳ Don’t miss your chance — spots are limited!
Drop 888 below and join now 🚀
#Crypto #USDT #Giveaway
Watching is simple… but winners take action 👀
🎁 Want FREE $USDT?
💬 Comment 888
❤️ Like
🔁 Share
➕ Follow
⏳ Don’t miss your chance — spots are limited!
Drop 888 below and join now 🚀
#Crypto #USDT #Giveaway
48
·
--
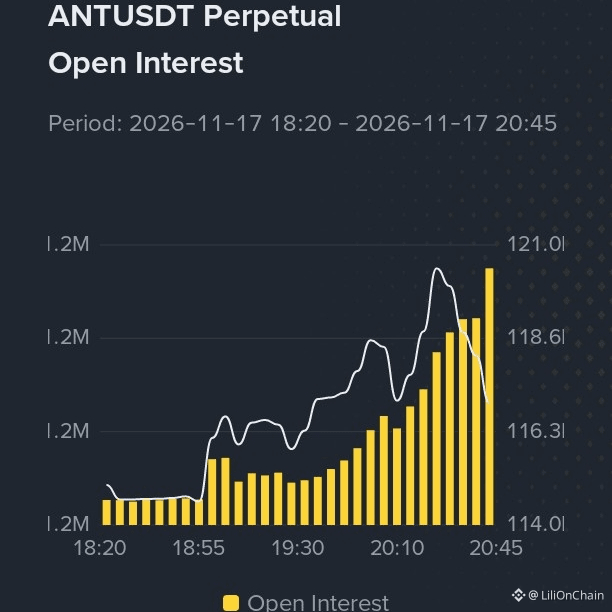
🚨 $ANT : OPEN INTEREST IS RISING… BUT WHO IS REALLY IN CONTROL?
1️⃣ OPEN INTEREST IS CLIMBING 📈
Look at the OI chart from 18:20 to 20:45.
Open interest rises throughout the session, with a particularly noticeable increase toward the end.
What does this tell us?
More futures positions are being opened or maintained. Traders are putting more exposure into this market.
But remember: rising OI doesn't automatically mean bullish activity. Every futures contract has both a long and a short side.
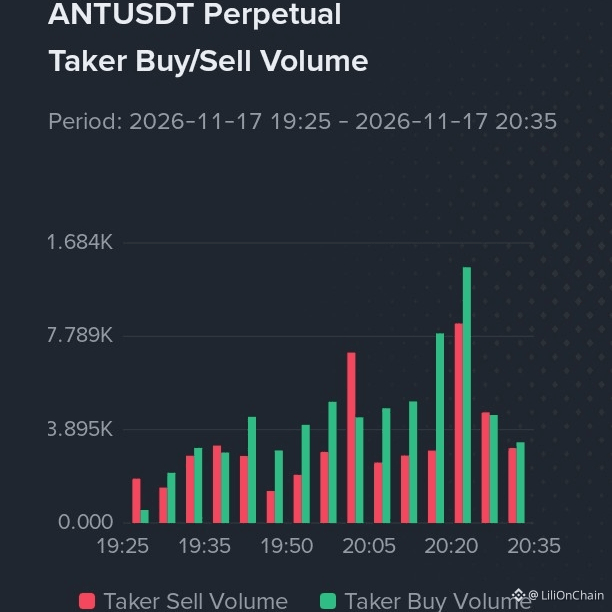
2️⃣ BUYERS ARE SHOWING UP BUT SELLERS AREN'T GONE
The taker buy/sell volume chart shows some strong buying bursts, especially around 20:15–20:25.
However, selling volume also picks up significantly during the same period. This is not a clean buyer-dominated market yet.
I want to see whether buyers can maintain that pressure instead of just producing short-lived volume spikes.
3️⃣ WHAT I'M WATCHING NEXT
🟢 Bullish scenario:
- Price starts making higher highs and higher lows.
- OI remains elevated.
- Taker buy volume consistently exceeds sell volume.
🔴 Bearish scenario:
- Price starts falling while OI continues increasing.
- Selling volume becomes dominant.
- Long positions become increasingly vulnerable to a liquidation squeeze.
I'm not calling #ANT bullish just because OI is rising. What interests me is the combination of increasing participation and aggressive two-sided trading. This could set up a larger move, but the direction still needs confirmation.
If you're trading ANT what price level are you watching?
#BinanceFutures $SKHYNIX #Openinterest #cryptotrading #MarketAnalysis $NVDA
🚨 $ANT : OPEN INTEREST IS RISING… BUT WHO IS REALLY IN CONTROL?
1️⃣ OPEN INTEREST IS CLIMBING 📈
Look at the OI chart from 18:20 to 20:45.
Open interest rises throughout the session, with a particularly noticeable increase toward the end.
What does this tell us?
More futures positions are being opened or maintained. Traders are putting more exposure into this market.
But remember: rising OI doesn't automatically mean bullish activity. Every futures contract has both a long and a short side.
2️⃣ BUYERS ARE SHOWING UP BUT SELLERS AREN'T GONE
The taker buy/sell volume chart shows some strong buying bursts, especially around 20:15–20:25.
However, selling volume also picks up significantly during the same period. This is not a clean buyer-dominated market yet.
I want to see whether buyers can maintain that pressure instead of just producing short-lived volume spikes.
3️⃣ WHAT I'M WATCHING NEXT
🟢 Bullish scenario:
- Price starts making higher highs and higher lows.
- OI remains elevated.
- Taker buy volume consistently exceeds sell volume.
🔴 Bearish scenario:
- Price starts falling while OI continues increasing.
- Selling volume becomes dominant.
- Long positions become increasingly vulnerable to a liquidation squeeze.
I'm not calling #ANT bullish just because OI is rising. What interests me is the combination of increasing participation and aggressive two-sided trading. This could set up a larger move, but the direction still needs confirmation.
If you're trading ANT what price level are you watching?
#BinanceFutures $SKHYNIX #Openinterest #cryptotrading #MarketAnalysis $NVDA
1️⃣ OPEN INTEREST IS CLIMBING 📈
Look at the OI chart from 18:20 to 20:45.
Open interest rises throughout the session, with a particularly noticeable increase toward the end.
What does this tell us?
More futures positions are being opened or maintained. Traders are putting more exposure into this market.
But remember: rising OI doesn't automatically mean bullish activity. Every futures contract has both a long and a short side.
2️⃣ BUYERS ARE SHOWING UP BUT SELLERS AREN'T GONE
The taker buy/sell volume chart shows some strong buying bursts, especially around 20:15–20:25.
However, selling volume also picks up significantly during the same period. This is not a clean buyer-dominated market yet.
I want to see whether buyers can maintain that pressure instead of just producing short-lived volume spikes.
3️⃣ WHAT I'M WATCHING NEXT
🟢 Bullish scenario:
- Price starts making higher highs and higher lows.
- OI remains elevated.
- Taker buy volume consistently exceeds sell volume.
🔴 Bearish scenario:
- Price starts falling while OI continues increasing.
- Selling volume becomes dominant.
- Long positions become increasingly vulnerable to a liquidation squeeze.
I'm not calling #ANT bullish just because OI is rising. What interests me is the combination of increasing participation and aggressive two-sided trading. This could set up a larger move, but the direction still needs confirmation.
If you're trading ANT what price level are you watching?
#BinanceFutures $SKHYNIX #Openinterest #cryptotrading #MarketAnalysis $NVDA
2
673
·
--
Bearish
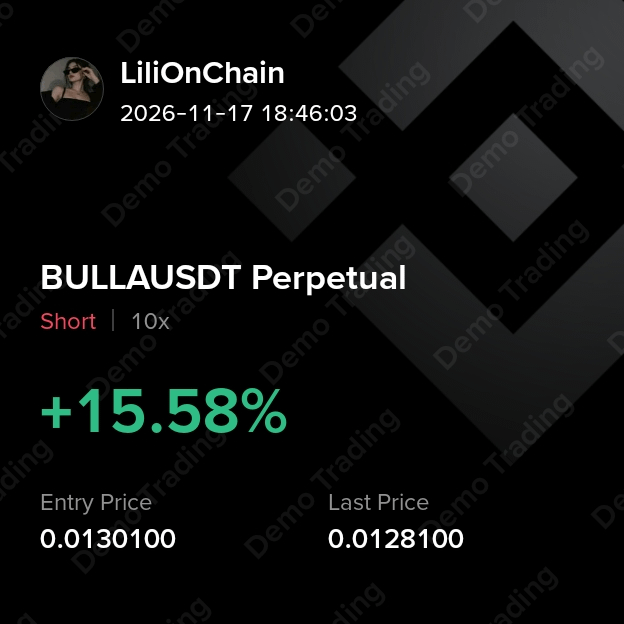
$BULLA is finally moving in the right direction! After the initial pressure, #BULLA is starting to give us the downside move we were watching for.
Here's what I'm watching next:
- The price is still struggling to recover above the short-term moving averages.
- The recent bounce looks weak.
- A break below 0.0128 could bring another selling wave.
🔴 I'm keeping my SHORT bias for now.
📍Next targets: 0.01250 / 0.01220
I'll keep tracking this one and update you if momentum changes. Sometimes a setup needs patience before it starts delivering.
{future}(BULLAUSDT)
$SPACE #profit $CROSS #BinanceSquareFamily
$BULLA is finally moving in the right direction! After the initial pressure, #BULLA is starting to give us the downside move we were watching for.
Here's what I'm watching next:
- The price is still struggling to recover above the short-term moving averages.
- The recent bounce looks weak.
- A break below 0.0128 could bring another selling wave.
🔴 I'm keeping my SHORT bias for now.
📍Next targets: 0.01250 / 0.01220
I'll keep tracking this one and update you if momentum changes. Sometimes a setup needs patience before it starts delivering.
$SPACE #profit $CROSS #BinanceSquareFamily
Here's what I'm watching next:
- The price is still struggling to recover above the short-term moving averages.
- The recent bounce looks weak.
- A break below 0.0128 could bring another selling wave.
🔴 I'm keeping my SHORT bias for now.
📍Next targets: 0.01250 / 0.01220
I'll keep tracking this one and update you if momentum changes. Sometimes a setup needs patience before it starts delivering.
$SPACE #profit $CROSS #BinanceSquareFamily
1
457
·
--
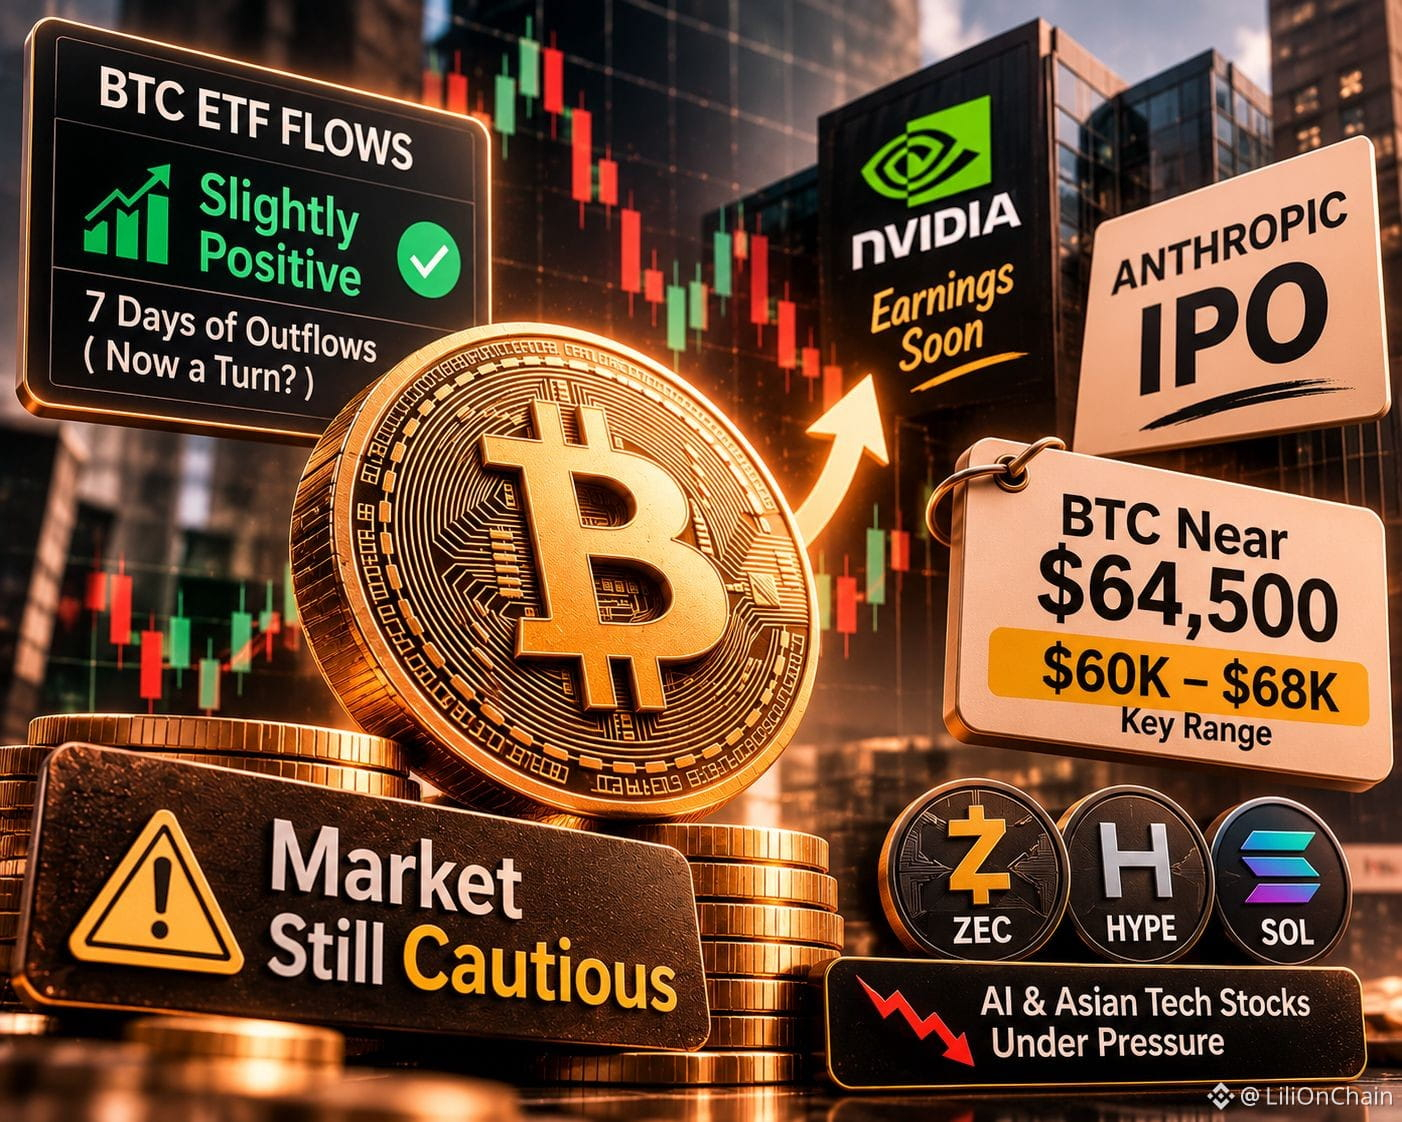
Bitcoin ETF flows finally turned green… but is that enough to change the mood?
After seven straight days of outflows, US spot Bitcoin ETFs saw a slight return to positive flows, led by BlackRock’s IBIT. BTC was trading near $64,500, but the broader sentiment still looks cautious.
Here’s what I’m watching:
🔹 $60K–$68K: The range analysts are keeping an eye on.
🔹 Nvidia earnings: A key test for the AI trade and tech sentiment.
🔹 Anthropic IPO: Another major signal of investor appetite for AI.
🔹 Altcoins: $ZEC , $HYPE and $SOL have bounced modestly, but momentum needs confirmation.
Meanwhile, weakness in AI stocks and Asian tech shares shows that risk appetite hasn’t fully recovered.
For me, one positive ETF-flow session is encouraging, not a confirmed trend reversal.
Do you think ETF demand is returning, or is this just a short pause in selling?
#BitcoinETFs #IBIT #NvidiaEarningsTonight:AIStocks’NextMove? #AnthropicIPOTestsInvestorAppetiteForAI #CryptoMarketMoves
Bitcoin ETF flows finally turned green… but is that enough to change the mood?
After seven straight days of outflows, US spot Bitcoin ETFs saw a slight return to positive flows, led by BlackRock’s IBIT. BTC was trading near $64,500, but the broader sentiment still looks cautious.
Here’s what I’m watching:
🔹 $60K–$68K: The range analysts are keeping an eye on.
🔹 Nvidia earnings: A key test for the AI trade and tech sentiment.
🔹 Anthropic IPO: Another major signal of investor appetite for AI.
🔹 Altcoins: $ZEC , $HYPE and $SOL have bounced modestly, but momentum needs confirmation.
Meanwhile, weakness in AI stocks and Asian tech shares shows that risk appetite hasn’t fully recovered.
For me, one positive ETF-flow session is encouraging, not a confirmed trend reversal.
Do you think ETF demand is returning, or is this just a short pause in selling?
#BitcoinETFs #IBIT #NvidiaEarningsTonight:AIStocks’NextMove? #AnthropicIPOTestsInvestorAppetiteForAI #CryptoMarketMoves
After seven straight days of outflows, US spot Bitcoin ETFs saw a slight return to positive flows, led by BlackRock’s IBIT. BTC was trading near $64,500, but the broader sentiment still looks cautious.
Here’s what I’m watching:
🔹 $60K–$68K: The range analysts are keeping an eye on.
🔹 Nvidia earnings: A key test for the AI trade and tech sentiment.
🔹 Anthropic IPO: Another major signal of investor appetite for AI.
🔹 Altcoins: $ZEC , $HYPE and $SOL have bounced modestly, but momentum needs confirmation.
Meanwhile, weakness in AI stocks and Asian tech shares shows that risk appetite hasn’t fully recovered.
For me, one positive ETF-flow session is encouraging, not a confirmed trend reversal.
Do you think ETF demand is returning, or is this just a short pause in selling?
#BitcoinETFs #IBIT #NvidiaEarningsTonight:AIStocks’NextMove? #AnthropicIPOTestsInvestorAppetiteForAI #CryptoMarketMoves
1
467
·
--
go
go

Merlin_X
·
--
🚨 5,000 #MEMBERS = 10 $USDT RED PACKET! 🎁🔥
❤️ FOLLOW ME
🔥 LIKE THIS POST
🔁 REPOST THIS POST
Who's ready to grab some free rewards? 👀💰
Let's make this celebration BIG!
🎁 10 USDT is waiting for one lucky moment!
LET'S GO! 🚀🔴
❤️ FOLLOW ME
🔥 LIKE THIS POST
🔁 REPOST THIS POST
Who's ready to grab some free rewards? 👀💰
Let's make this celebration BIG!
🎁 10 USDT is waiting for one lucky moment!
LET'S GO! 🚀🔴

20
·
--
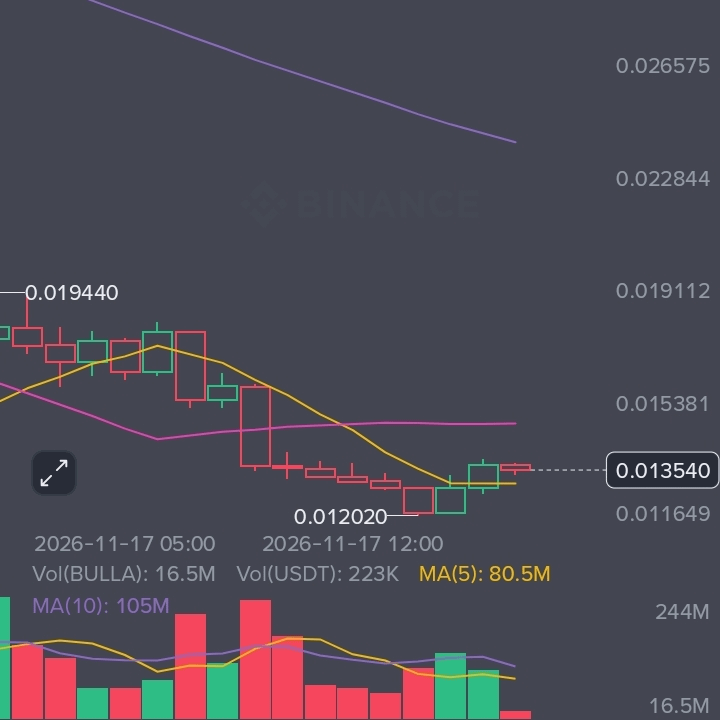
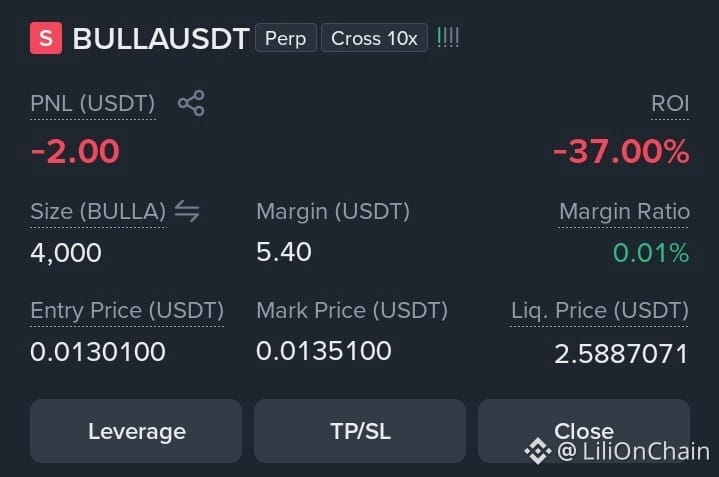
Not every trade ends green and I'm not going to hide the red ones! $BULLA SHORT didn't go as planned but I'm not done watching this chart!
Now looking at the 1H chart, #BULLA is trading around 0.01354 after bouncing from 0.01202.
My next bias: SHORT
Here's why:
Price is still below MA(25) at 0.01508 and MA(99) at 0.02442.
The overall 1H structure remains bearish.
The recent bounce looks like a recovery attempt, not yet a confirmed reversal.
RSI is around 44.9, showing limited bullish momentum.
🔴 Next SHORT setup:
TP1: 0.0130
TP2: 0.0125
SL: 0.0147
My entry before was wrong but no trader wins every single trade. What matters is managing risk, learning from mistakes, and coming back with a better plan.
OPEN TRADE 👇🏻
{future}(BULLAUSDT)
$HUMA #trading $BLESS
Not every trade ends green and I'm not going to hide the red ones! $BULLA SHORT didn't go as planned but I'm not done watching this chart!
Now looking at the 1H chart, #BULLA is trading around 0.01354 after bouncing from 0.01202.
My next bias: SHORT
Here's why:
Price is still below MA(25) at 0.01508 and MA(99) at 0.02442.
The overall 1H structure remains bearish.
The recent bounce looks like a recovery attempt, not yet a confirmed reversal.
RSI is around 44.9, showing limited bullish momentum.
🔴 Next SHORT setup:
TP1: 0.0130
TP2: 0.0125
SL: 0.0147
My entry before was wrong but no trader wins every single trade. What matters is managing risk, learning from mistakes, and coming back with a better plan.
OPEN TRADE 👇🏻
$HUMA #trading $BLESS
Now looking at the 1H chart, #BULLA is trading around 0.01354 after bouncing from 0.01202.
My next bias: SHORT
Here's why:
Price is still below MA(25) at 0.01508 and MA(99) at 0.02442.
The overall 1H structure remains bearish.
The recent bounce looks like a recovery attempt, not yet a confirmed reversal.
RSI is around 44.9, showing limited bullish momentum.
🔴 Next SHORT setup:
TP1: 0.0130
TP2: 0.0125
SL: 0.0147
My entry before was wrong but no trader wins every single trade. What matters is managing risk, learning from mistakes, and coming back with a better plan.
OPEN TRADE 👇🏻
$HUMA #trading $BLESS
4
1k

·
--
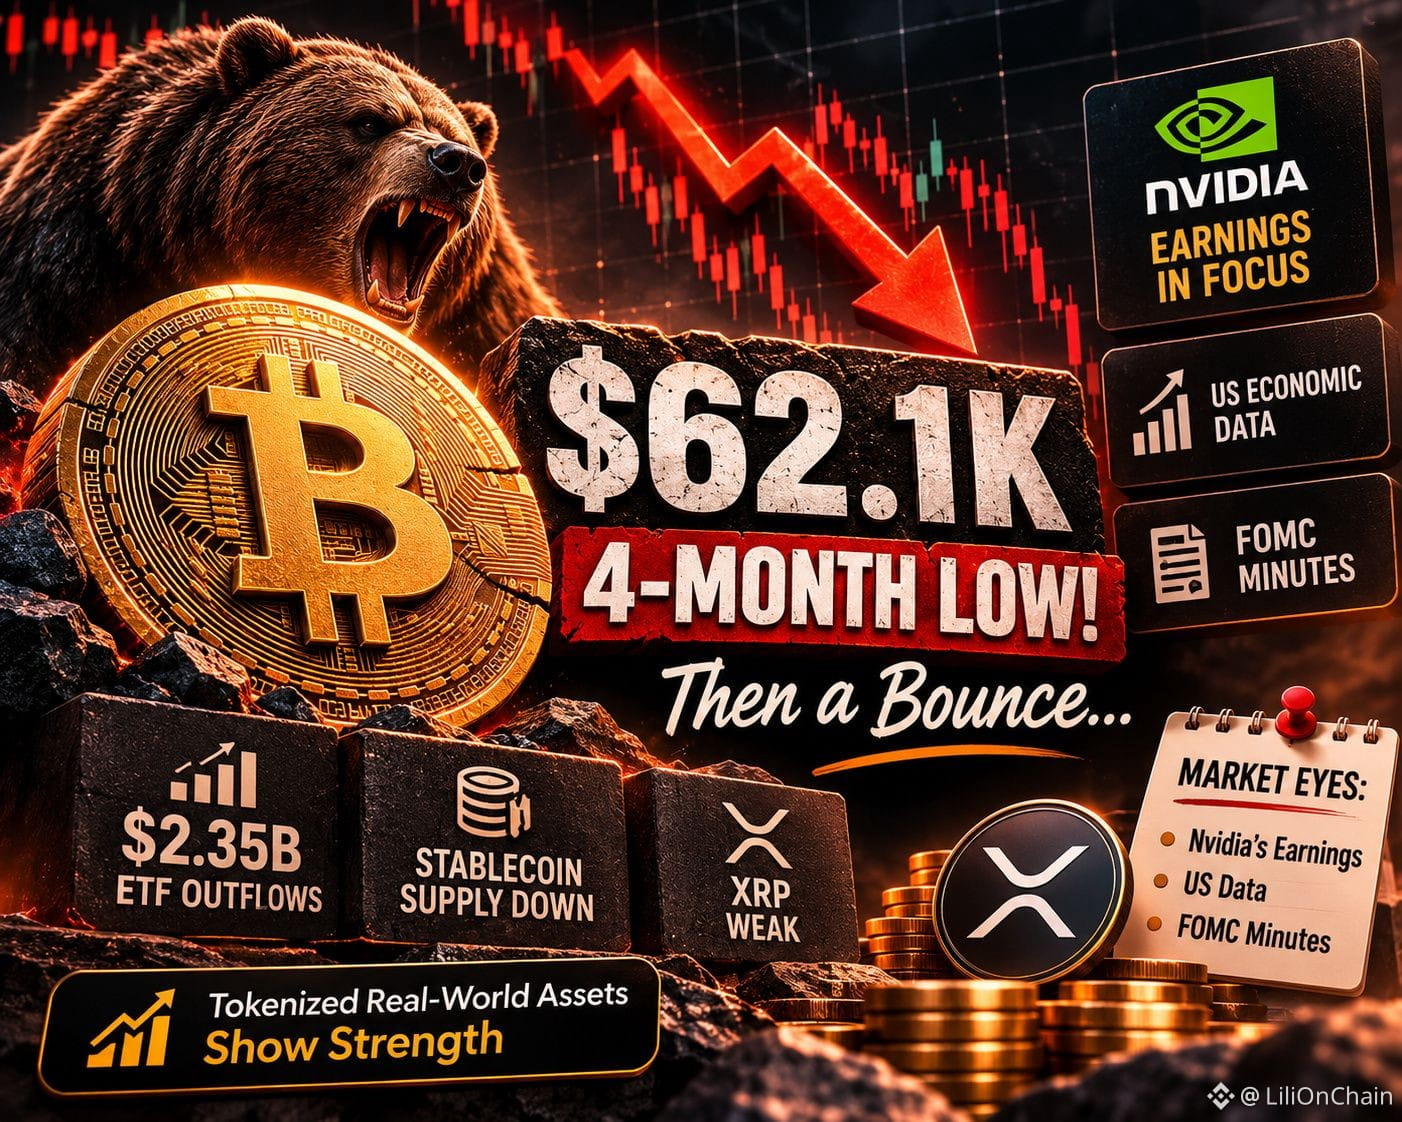
$BTC briefly touched around $62.1K, its lowest level in four months, before recovering near $64.3K. But this sell-off looks bigger than crypto alone.
AI, semiconductor and crypto stocks are all under pressure, suggesting investors are raising cash rather than simply rotating into Bitcoin.
A few things I’m watching:
🔴 Around $2.35B in recent spot BTC ETF outflows
🔴 Shrinking stablecoin supply
🔴 Continued weakness in $XRP
🟢 Tokenized real-world assets showing better resilience
Now the focus shifts to Nvidia’s earnings, upcoming US economic data and FOMC minutes. These could shape risk sentiment across markets.
For now, I’m not treating one BTC bounce as a confirmed reversal. Pre-market moves can change quickly.
Do you think BTC can reclaim higher levels, or is another leg down still possible?
#CryptoMarketMoves #ETFvsBTC #fomc #BitcoinExtendsLosingStreakToSixWeeks $NVDAB #HuangReportedlyConsidersReturnToNvidia
$BTC briefly touched around $62.1K, its lowest level in four months, before recovering near $64.3K. But this sell-off looks bigger than crypto alone.
AI, semiconductor and crypto stocks are all under pressure, suggesting investors are raising cash rather than simply rotating into Bitcoin.
A few things I’m watching:
🔴 Around $2.35B in recent spot BTC ETF outflows
🔴 Shrinking stablecoin supply
🔴 Continued weakness in $XRP
🟢 Tokenized real-world assets showing better resilience
Now the focus shifts to Nvidia’s earnings, upcoming US economic data and FOMC minutes. These could shape risk sentiment across markets.
For now, I’m not treating one BTC bounce as a confirmed reversal. Pre-market moves can change quickly.
Do you think BTC can reclaim higher levels, or is another leg down still possible?
#CryptoMarketMoves #ETFvsBTC #fomc #BitcoinExtendsLosingStreakToSixWeeks $NVDAB #HuangReportedlyConsidersReturnToNvidia
AI, semiconductor and crypto stocks are all under pressure, suggesting investors are raising cash rather than simply rotating into Bitcoin.
A few things I’m watching:
🔴 Around $2.35B in recent spot BTC ETF outflows
🔴 Shrinking stablecoin supply
🔴 Continued weakness in $XRP
🟢 Tokenized real-world assets showing better resilience
Now the focus shifts to Nvidia’s earnings, upcoming US economic data and FOMC minutes. These could shape risk sentiment across markets.
For now, I’m not treating one BTC bounce as a confirmed reversal. Pre-market moves can change quickly.
Do you think BTC can reclaim higher levels, or is another leg down still possible?
#CryptoMarketMoves #ETFvsBTC #fomc #BitcoinExtendsLosingStreakToSixWeeks $NVDAB #HuangReportedlyConsidersReturnToNvidia
1
265
·
--
Verified
🚨 GOLD IS GREEN, NVIDIA & SEMICONDUCTORS ARE RED. WHERE IS THE MONEY GOING?
Here's what catches my attention:
$XAU is showing relative strength while semiconductor exposure is taking a bigger hit.
$SOXL is particularly interesting. Its decline is significantly larger than NVIDIA's, which makes sense given that SOXL is a leveraged semiconductor ETF and can amplify moves in the sector.
Another detail: SOXL and Gold are both showing substantial trading activity. These aren't markets I'd ignore right now.
I'm watching three things:
1️⃣ Can gold maintain its strength above the current area?
2️⃣ Will $NVDA find buyers around its recent trading range?
3️⃣ Can SOXL stabilize, or will semiconductor selling continue?
I wouldn't automatically interpret gold's rise as proof that investors are moving money out of tech. But the performance gap is worth monitoring.
The next move matters more than today's percentage.
If you had to choose one market to watch closely right now which would it be and why?
#NVIDIA #TradFi #BinanceFutures #MarketAnalysis #stockmarket
🚨 GOLD IS GREEN, NVIDIA & SEMICONDUCTORS ARE RED. WHERE IS THE MONEY GOING?
Here's what catches my attention:
$XAU is showing relative strength while semiconductor exposure is taking a bigger hit.
$SOXL is particularly interesting. Its decline is significantly larger than NVIDIA's, which makes sense given that SOXL is a leveraged semiconductor ETF and can amplify moves in the sector.
Another detail: SOXL and Gold are both showing substantial trading activity. These aren't markets I'd ignore right now.
I'm watching three things:
1️⃣ Can gold maintain its strength above the current area?
2️⃣ Will $NVDA find buyers around its recent trading range?
3️⃣ Can SOXL stabilize, or will semiconductor selling continue?
I wouldn't automatically interpret gold's rise as proof that investors are moving money out of tech. But the performance gap is worth monitoring.
The next move matters more than today's percentage.
If you had to choose one market to watch closely right now which would it be and why?
#NVIDIA #TradFi #BinanceFutures #MarketAnalysis #stockmarket
Here's what catches my attention:
$XAU is showing relative strength while semiconductor exposure is taking a bigger hit.
$SOXL is particularly interesting. Its decline is significantly larger than NVIDIA's, which makes sense given that SOXL is a leveraged semiconductor ETF and can amplify moves in the sector.
Another detail: SOXL and Gold are both showing substantial trading activity. These aren't markets I'd ignore right now.
I'm watching three things:
1️⃣ Can gold maintain its strength above the current area?
2️⃣ Will $NVDA find buyers around its recent trading range?
3️⃣ Can SOXL stabilize, or will semiconductor selling continue?
I wouldn't automatically interpret gold's rise as proof that investors are moving money out of tech. But the performance gap is worth monitoring.
The next move matters more than today's percentage.
If you had to choose one market to watch closely right now which would it be and why?
#NVIDIA #TradFi #BinanceFutures #MarketAnalysis #stockmarket
Gold — looking stronger
42%
NVIDIA waiting for a recovery
25%
SOXL watch for possible bounce
33%
45 votes • Voting closed
3
2
7.2k
·
--
🚨 ANTHROPIC’S IPO COULD BE THE BIGGEST TEST OF AI INVESTOR CONFIDENCE YET!
The AI boom is facing a reality check and $ANTHROPIC is stepping into the spotlight at a very interesting time.
The company behind Claude is targeting an IPO valuation of around $1.4 trillion, below earlier expectations of nearly $2 trillion.
But here's the twist:
📈 Investor interest is reportedly strong, with early IPO orders already exceeding the shares available.
⚠️ At the same time, concerns remain around massive data-center costs, high infrastructure commitments and whether AI revenue growth can justify these valuations.
📉 Tech stocks are also facing volatility, making the timing even more important.
My take: Anthropic's growth story is impressive but this IPO isn't just about one company. It's a test of how much investors are still willing to pay for the AI future.
I'm watching demand, final pricing and the first trading session closely.
Will Anthropic surge on debut or will valuation concerns take control?
#AnthropicIPOTestsInvestorAppetiteForAI $NVDAB #ClaudeAI $AAPLB #AIStocks #IPO
🚨 ANTHROPIC’S IPO COULD BE THE BIGGEST TEST OF AI INVESTOR CONFIDENCE YET!
The AI boom is facing a reality check and $ANTHROPIC is stepping into the spotlight at a very interesting time.
The company behind Claude is targeting an IPO valuation of around $1.4 trillion, below earlier expectations of nearly $2 trillion.
But here's the twist:
📈 Investor interest is reportedly strong, with early IPO orders already exceeding the shares available.
⚠️ At the same time, concerns remain around massive data-center costs, high infrastructure commitments and whether AI revenue growth can justify these valuations.
📉 Tech stocks are also facing volatility, making the timing even more important.
My take: Anthropic's growth story is impressive but this IPO isn't just about one company. It's a test of how much investors are still willing to pay for the AI future.
I'm watching demand, final pricing and the first trading session closely.
Will Anthropic surge on debut or will valuation concerns take control?
#AnthropicIPOTestsInvestorAppetiteForAI $NVDAB #ClaudeAI $AAPLB #AIStocks #IPO
The AI boom is facing a reality check and $ANTHROPIC is stepping into the spotlight at a very interesting time.
The company behind Claude is targeting an IPO valuation of around $1.4 trillion, below earlier expectations of nearly $2 trillion.
But here's the twist:
📈 Investor interest is reportedly strong, with early IPO orders already exceeding the shares available.
⚠️ At the same time, concerns remain around massive data-center costs, high infrastructure commitments and whether AI revenue growth can justify these valuations.
📉 Tech stocks are also facing volatility, making the timing even more important.
My take: Anthropic's growth story is impressive but this IPO isn't just about one company. It's a test of how much investors are still willing to pay for the AI future.
I'm watching demand, final pricing and the first trading session closely.
Will Anthropic surge on debut or will valuation concerns take control?
#AnthropicIPOTestsInvestorAppetiteForAI $NVDAB #ClaudeAI $AAPLB #AIStocks #IPO

1
341
·
--
Bearish
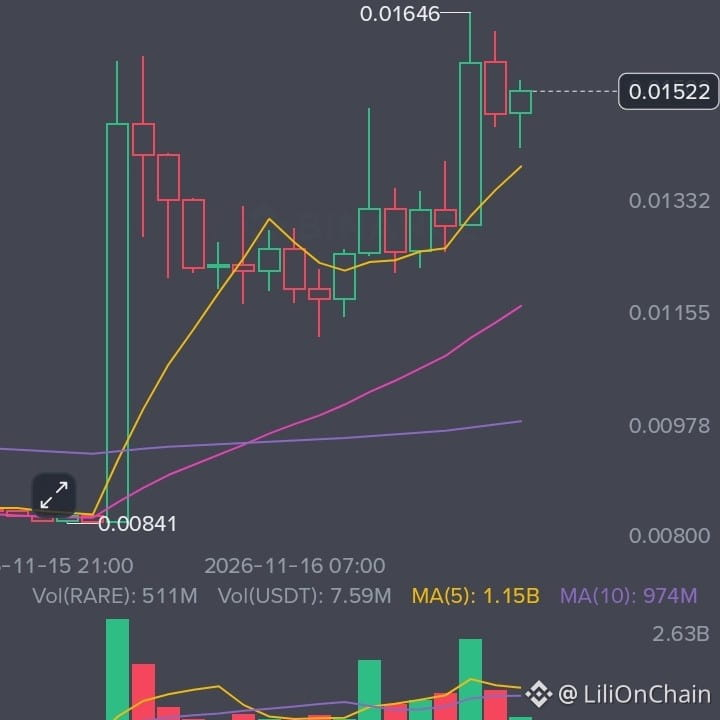
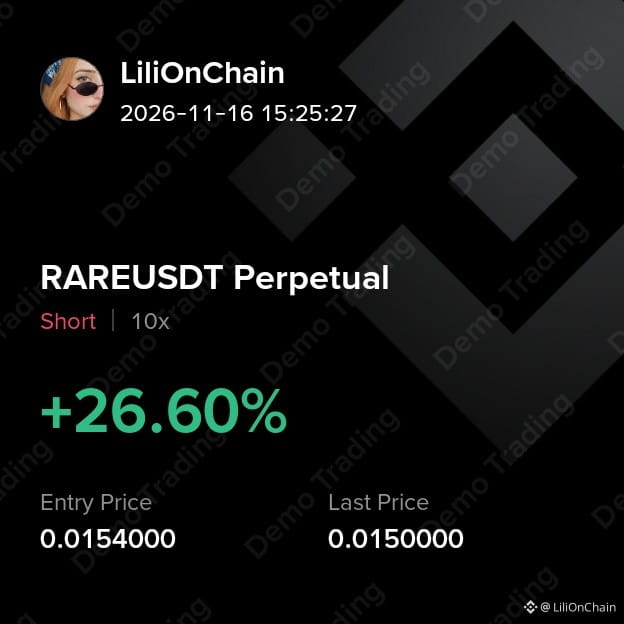
Another sharp call on $RARE ! Let's look at what the 1H chart is telling us.
#RARE has pumped over 74% in 24 hours, but the rally is showing signs of cooling near 0.01646.
Here's what I'm watching:
- RSI is around 69, approaching overbought territory.
- Price is facing resistance near 0.01646.
- Recent rejection suggests sellers are becoming active.
- A pullback could follow if buying momentum fades.
🔴 SHORT now guys thank me later
- TP1: 0.0140
- TP2: 0.0133
- SL: 0.0167
OPEN TRADE 👇🏻
{future}(RAREUSDT)
$JCT #trading $AGT
Another sharp call on $RARE ! Let's look at what the 1H chart is telling us.
#RARE has pumped over 74% in 24 hours, but the rally is showing signs of cooling near 0.01646.
Here's what I'm watching:
- RSI is around 69, approaching overbought territory.
- Price is facing resistance near 0.01646.
- Recent rejection suggests sellers are becoming active.
- A pullback could follow if buying momentum fades.
🔴 SHORT now guys thank me later
- TP1: 0.0140
- TP2: 0.0133
- SL: 0.0167
OPEN TRADE 👇🏻
$JCT #trading $AGT
#RARE has pumped over 74% in 24 hours, but the rally is showing signs of cooling near 0.01646.
Here's what I'm watching:
- RSI is around 69, approaching overbought territory.
- Price is facing resistance near 0.01646.
- Recent rejection suggests sellers are becoming active.
- A pullback could follow if buying momentum fades.
🔴 SHORT now guys thank me later
- TP1: 0.0140
- TP2: 0.0133
- SL: 0.0167
OPEN TRADE 👇🏻
$JCT #trading $AGT
1
226
Log in to explore more content
Join global crypto users on Binance Square
⚡️ Get latest and useful information about crypto.
💬 Trusted by the world’s largest crypto exchange.
👍 Discover real insights from verified creators.
Email / Phone number
Trending Topics
NvidiaBeatsEstimatesWith$130BQ4Outlook
10,741 views
154 Discussing
Nvidia Beats With $115.8 Billion in Revenue, Guides to $130 Billion and Adds $150 Billion Buyback
Binance News
·46 Likes
·40.3k views
AnthropicIPOPriceCouldExceed$80
16,772 views
140 Discussing
CanNvidia’sDataCenterGrowthContinue?
50,523 views
693 Discussing