
haseeb_khan000
46 Posts

haseeb_khan000
Report
Block User
Trader & Market Analyst Charts | Analysis | Strategies Knowledge Distributor Learn • Analyze • Grow
3 Following
0 Followers
4 Liked
Posts
$SOPH
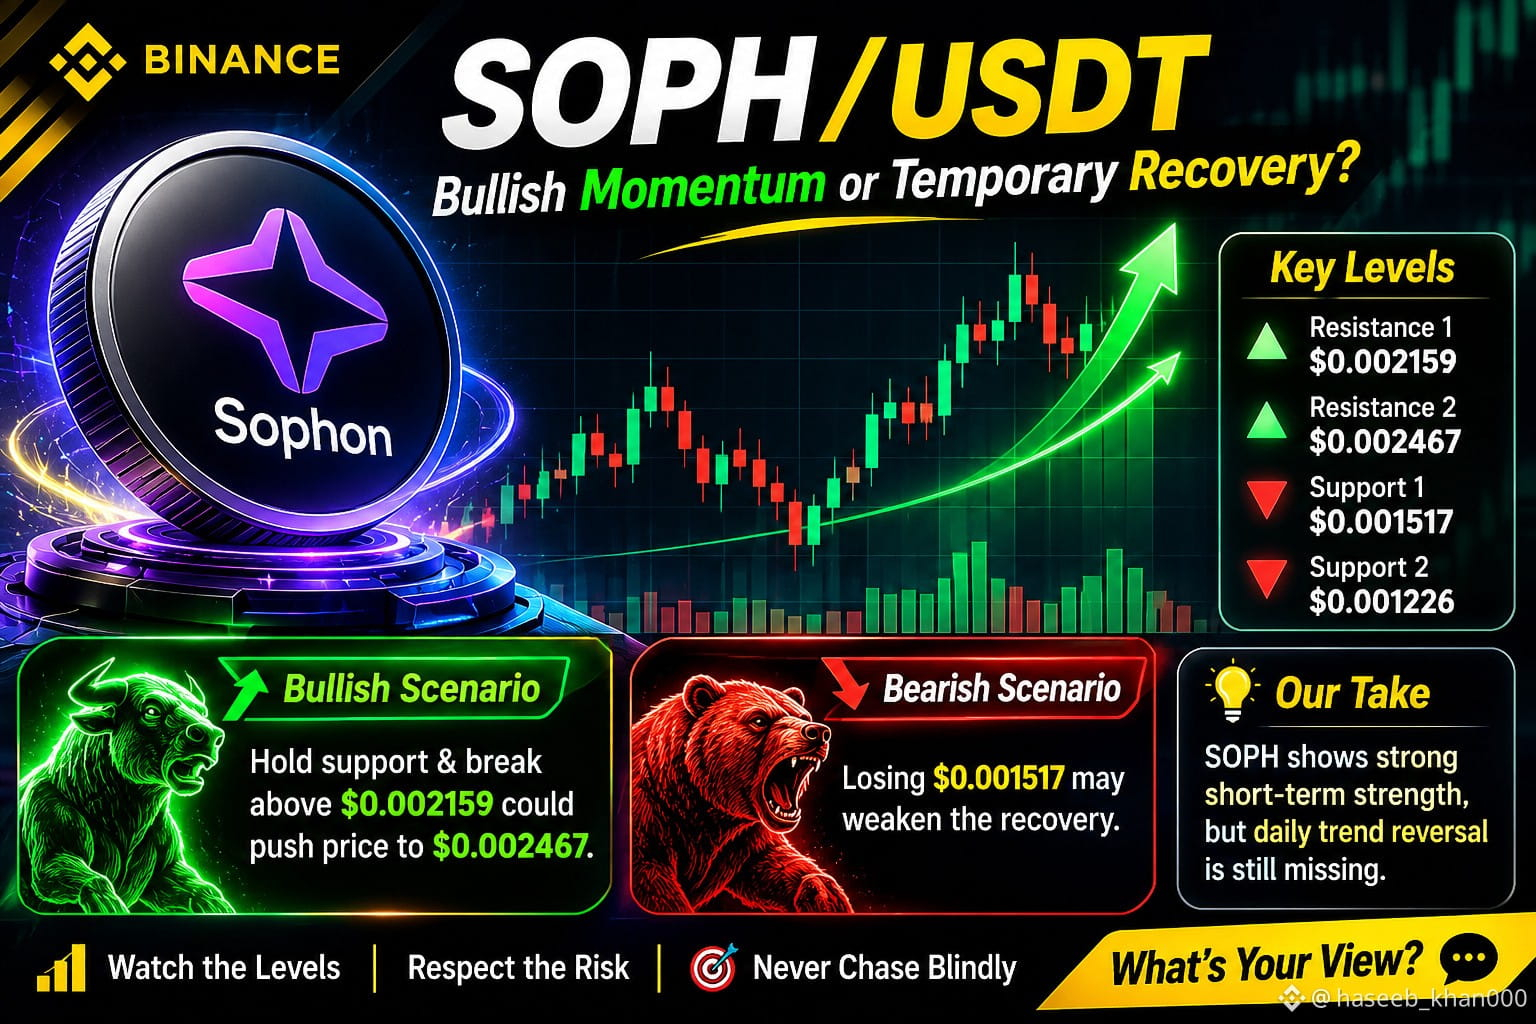
🚀 SOPH/USDT: Bullish Momentum or Temporary Recovery?
$SOPH is showing renewed buying interest, with short-term momentum improving significantly. However, the bigger trend still needs confirmation.
📊 Market Outlook
- 1H & 4H Trend: Bullish
- Daily Trend: Bearish
- Immediate Support: $0.001517
- Major Support: $0.001226
- Resistance: $0.002159
- Major Resistance: $0.002467
🐂 Bullish Scenario:
Holding support and breaking above $0.002159 with strong volume could open the way toward $0.002467.
🐻 Bearish Scenario:
Losing $0.001517 may weaken the recovery and bring lower support levels into focus.
⚡ My Perspective:
SOPH is showing encouraging short-term strength, but a confirmed daily trend reversal is still missing. Volume, price structure, and resistance confirmation deserve close attention.
Watch the levels. Respect the risk. Never chase momentum blindly.
What's your view? Is $SOPH preparing for another upward move or a potential correction?
#SOPH #SOPHUSDT #BinanceSquare #CryptoTrading
{future}(SOPHUSDT)
$SOPH
🚀 SOPH/USDT: Bullish Momentum or Temporary Recovery?
$SOPH is showing renewed buying interest, with short-term momentum improving significantly. However, the bigger trend still needs confirmation.
📊 Market Outlook
- 1H & 4H Trend: Bullish
- Daily Trend: Bearish
- Immediate Support: $0.001517
- Major Support: $0.001226
- Resistance: $0.002159
- Major Resistance: $0.002467
🐂 Bullish Scenario:
Holding support and breaking above $0.002159 with strong volume could open the way toward $0.002467.
🐻 Bearish Scenario:
Losing $0.001517 may weaken the recovery and bring lower support levels into focus.
⚡ My Perspective:
SOPH is showing encouraging short-term strength, but a confirmed daily trend reversal is still missing. Volume, price structure, and resistance confirmation deserve close attention.
Watch the levels. Respect the risk. Never chase momentum blindly.
What's your view? Is $SOPH preparing for another upward move or a potential correction?
#SOPH #SOPHUSDT #BinanceSquare #CryptoTrading
🚀 SOPH/USDT: Bullish Momentum or Temporary Recovery?
$SOPH is showing renewed buying interest, with short-term momentum improving significantly. However, the bigger trend still needs confirmation.
📊 Market Outlook
- 1H & 4H Trend: Bullish
- Daily Trend: Bearish
- Immediate Support: $0.001517
- Major Support: $0.001226
- Resistance: $0.002159
- Major Resistance: $0.002467
🐂 Bullish Scenario:
Holding support and breaking above $0.002159 with strong volume could open the way toward $0.002467.
🐻 Bearish Scenario:
Losing $0.001517 may weaken the recovery and bring lower support levels into focus.
⚡ My Perspective:
SOPH is showing encouraging short-term strength, but a confirmed daily trend reversal is still missing. Volume, price structure, and resistance confirmation deserve close attention.
Watch the levels. Respect the risk. Never chase momentum blindly.
What's your view? Is $SOPH preparing for another upward move or a potential correction?
#SOPH #SOPHUSDT #BinanceSquare #CryptoTrading
229
$SHELL
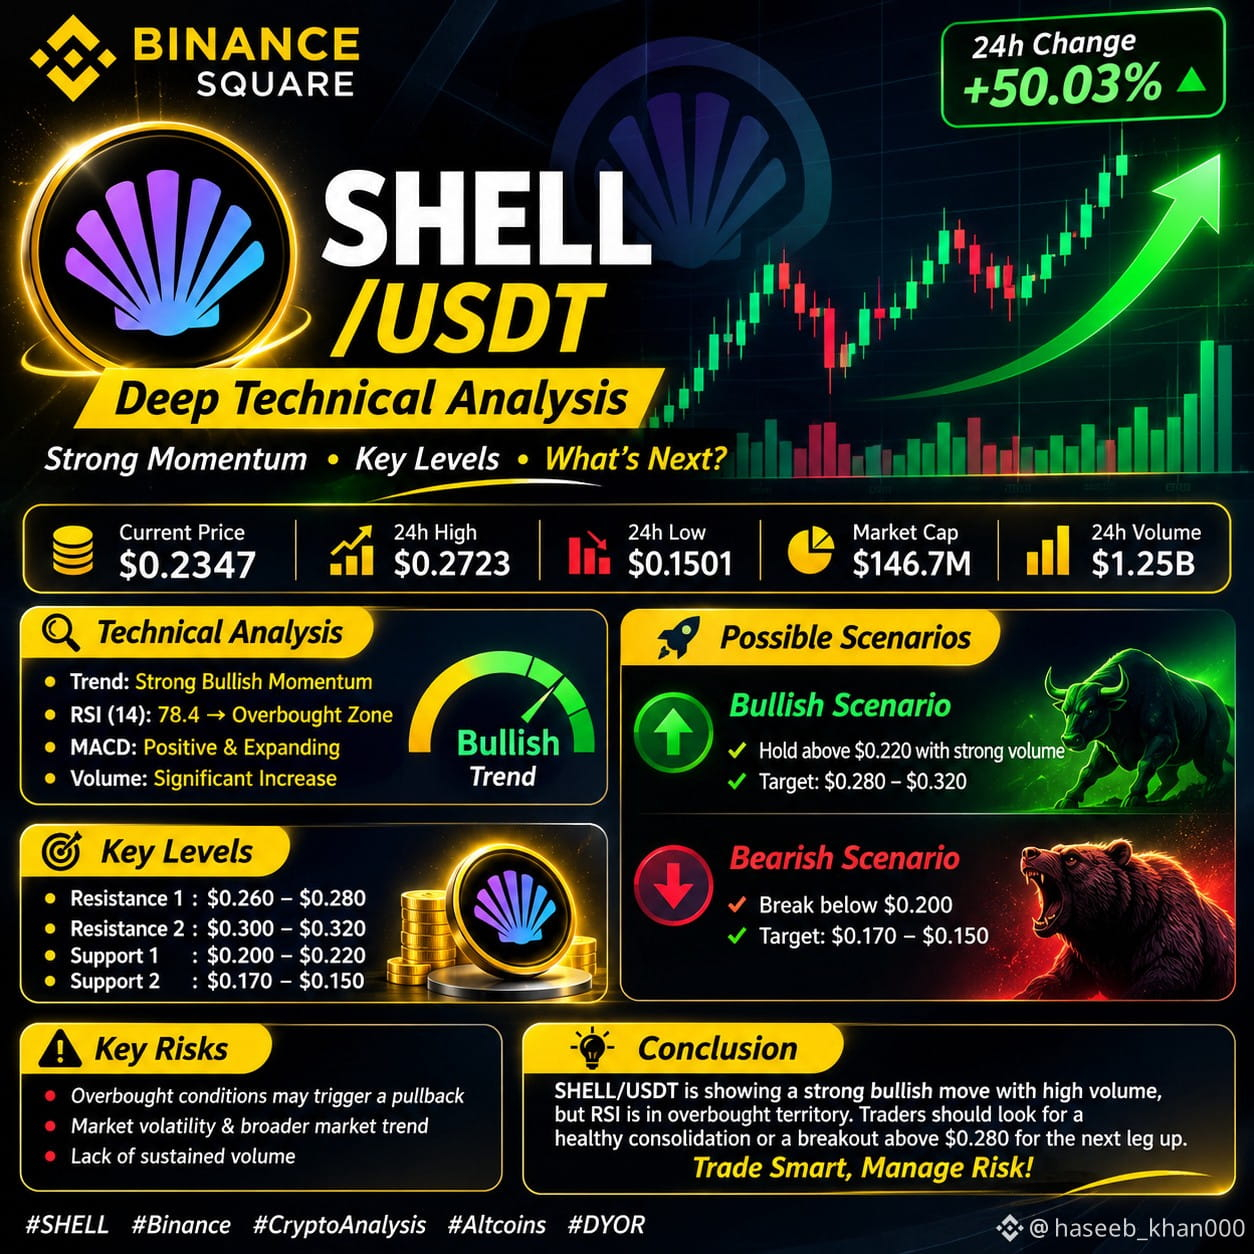
SHELL/USDT: Explosive Momentum or a Potential Reversal? 🔍
MyShell ($SHELL) | Deep Technical Market Analysis
SHELL has attracted significant market attention following an aggressive upward move accompanied by a substantial increase in trading activity. However, after such a sharp rally, the key question is whether buyers can sustain momentum or whether profit-taking will trigger a deeper correction.
📊 1. Market Structure
Recent Binance market data shows:
- Strong short-term price expansion.
- Significant increase in spot and futures trading activity.
- Elevated open interest, indicating growing derivatives participation.
- Sharp intraday fluctuations, reflecting increased volatility.
The recent rally is notable, but volume expansion alone does not confirm a sustainable uptrend.
📈 2. Key Technical Levels
Based on recent observed trading ranges:
- Immediate Support: $0.0285–$0.0300
- Resistance 1: $0.0367
- Major Resistance: $0.0516
- Major Historical Swing Low: $0.0186
These are reference zones from recent market activity, not guaranteed turning points.
🐂 3. Bullish Scenario
If SHELL maintains its near-term support zone and buying volume continues to strengthen, a recovery toward $0.0367 could become possible.
A sustained breakout above this resistance, supported by strong spot volume and a successful retest, would strengthen the bullish structure.
🐻 4. Bearish Scenario
If buyers fail to defend the $0.0285–$0.0300 area, downside pressure could increase.
A breakdown accompanied by expanding selling volume would weaken the short-term structure and could expose lower support areas.
⚠️ 5. Important Risks
- Rapid price appreciation increases correction risk.
- Elevated open interest can amplify volatility.
- Profit-taking may reverse short-term momentum.
- Token supply emissions and broader market sentiment deserve attention.
What is your view on $SHELL?
#shellusdt #MyShell #BinanceSquare #TechnicalAnalysis
{future}(SHELLUSDT)
$SHELL
SHELL/USDT: Explosive Momentum or a Potential Reversal? 🔍
MyShell ($SHELL ) | Deep Technical Market Analysis
SHELL has attracted significant market attention following an aggressive upward move accompanied by a substantial increase in trading activity. However, after such a sharp rally, the key question is whether buyers can sustain momentum or whether profit-taking will trigger a deeper correction.
📊 1. Market Structure
Recent Binance market data shows:
- Strong short-term price expansion.
- Significant increase in spot and futures trading activity.
- Elevated open interest, indicating growing derivatives participation.
- Sharp intraday fluctuations, reflecting increased volatility.
The recent rally is notable, but volume expansion alone does not confirm a sustainable uptrend.
📈 2. Key Technical Levels
Based on recent observed trading ranges:
- Immediate Support: $0.0285–$0.0300
- Resistance 1: $0.0367
- Major Resistance: $0.0516
- Major Historical Swing Low: $0.0186
These are reference zones from recent market activity, not guaranteed turning points.
🐂 3. Bullish Scenario
If SHELL maintains its near-term support zone and buying volume continues to strengthen, a recovery toward $0.0367 could become possible.
A sustained breakout above this resistance, supported by strong spot volume and a successful retest, would strengthen the bullish structure.
🐻 4. Bearish Scenario
If buyers fail to defend the $0.0285–$0.0300 area, downside pressure could increase.
A breakdown accompanied by expanding selling volume would weaken the short-term structure and could expose lower support areas.
⚠️ 5. Important Risks
- Rapid price appreciation increases correction risk.
- Elevated open interest can amplify volatility.
- Profit-taking may reverse short-term momentum.
- Token supply emissions and broader market sentiment deserve attention.
What is your view on $SHELL ?
#shellusdt #MyShell #BinanceSquare #TechnicalAnalysis
SHELL/USDT: Explosive Momentum or a Potential Reversal? 🔍
MyShell ($SHELL ) | Deep Technical Market Analysis
SHELL has attracted significant market attention following an aggressive upward move accompanied by a substantial increase in trading activity. However, after such a sharp rally, the key question is whether buyers can sustain momentum or whether profit-taking will trigger a deeper correction.
📊 1. Market Structure
Recent Binance market data shows:
- Strong short-term price expansion.
- Significant increase in spot and futures trading activity.
- Elevated open interest, indicating growing derivatives participation.
- Sharp intraday fluctuations, reflecting increased volatility.
The recent rally is notable, but volume expansion alone does not confirm a sustainable uptrend.
📈 2. Key Technical Levels
Based on recent observed trading ranges:
- Immediate Support: $0.0285–$0.0300
- Resistance 1: $0.0367
- Major Resistance: $0.0516
- Major Historical Swing Low: $0.0186
These are reference zones from recent market activity, not guaranteed turning points.
🐂 3. Bullish Scenario
If SHELL maintains its near-term support zone and buying volume continues to strengthen, a recovery toward $0.0367 could become possible.
A sustained breakout above this resistance, supported by strong spot volume and a successful retest, would strengthen the bullish structure.
🐻 4. Bearish Scenario
If buyers fail to defend the $0.0285–$0.0300 area, downside pressure could increase.
A breakdown accompanied by expanding selling volume would weaken the short-term structure and could expose lower support areas.
⚠️ 5. Important Risks
- Rapid price appreciation increases correction risk.
- Elevated open interest can amplify volatility.
- Profit-taking may reverse short-term momentum.
- Token supply emissions and broader market sentiment deserve attention.
What is your view on $SHELL ?
#shellusdt #MyShell #BinanceSquare #TechnicalAnalysis
176
$XRP
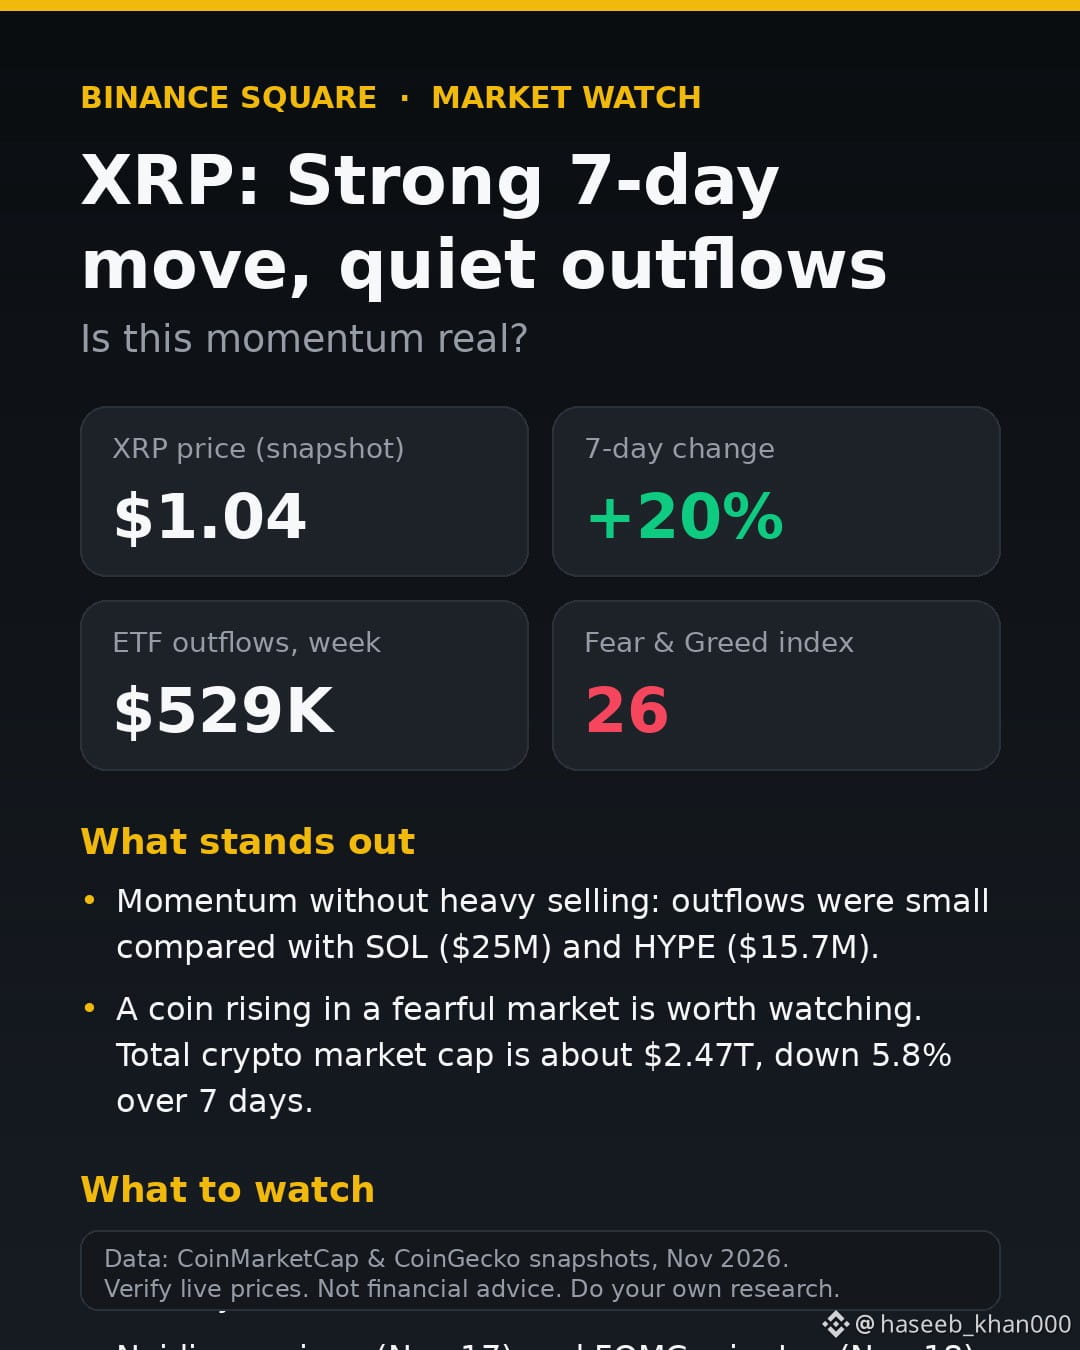
XRP: Strong 7-day move, quiet outflows. Is this momentum real?
XRP has been one of the stronger majors this week. In a CoinMarketCap snapshot I pulled, it was trading around $1.04 with about a 20% gain over seven days, while the broader market sat in fear.
What stands out:
- Momentum without heavy selling: Among the majors, XRP's ETF outflows that week were small, about $529K, compared with $25M from Solana and $15.7M from Hyperliquid.
- Weak market backdrop: Total crypto market cap was about $2.47T, down about 5.8% over seven days, and the Fear & Greed index was at 26. A coin rising against that backdrop is worth watching.
What to watch next:
- Whether the price holds above recent support, and whether volume stays healthy.
- Upcoming macro events, including Nvidia earnings on November 17 and FOMC minutes on November 18. Tech and macro sentiment have been spilling into crypto.
Short-term rallies in a fearful market can reverse quickly, so this is a momentum observation, not a call to buy.
Data: CoinMarketCap and CoinGecko snapshots, November 2026. Prices change constantly;
#xrp #binanceSquare #BİNANCE
$XRP
XRP: Strong 7-day move, quiet outflows. Is this momentum real?
XRP has been one of the stronger majors this week. In a CoinMarketCap snapshot I pulled, it was trading around $1.04 with about a 20% gain over seven days, while the broader market sat in fear.
What stands out:
- Momentum without heavy selling: Among the majors, XRP's ETF outflows that week were small, about $529K, compared with $25M from Solana and $15.7M from Hyperliquid.
- Weak market backdrop: Total crypto market cap was about $2.47T, down about 5.8% over seven days, and the Fear & Greed index was at 26. A coin rising against that backdrop is worth watching.
What to watch next:
- Whether the price holds above recent support, and whether volume stays healthy.
- Upcoming macro events, including Nvidia earnings on November 17 and FOMC minutes on November 18. Tech and macro sentiment have been spilling into crypto.
Short-term rallies in a fearful market can reverse quickly, so this is a momentum observation, not a call to buy.
Data: CoinMarketCap and CoinGecko snapshots, November 2026. Prices change constantly;
#xrp #binanceSquare #BİNANCE
XRP: Strong 7-day move, quiet outflows. Is this momentum real?
XRP has been one of the stronger majors this week. In a CoinMarketCap snapshot I pulled, it was trading around $1.04 with about a 20% gain over seven days, while the broader market sat in fear.
What stands out:
- Momentum without heavy selling: Among the majors, XRP's ETF outflows that week were small, about $529K, compared with $25M from Solana and $15.7M from Hyperliquid.
- Weak market backdrop: Total crypto market cap was about $2.47T, down about 5.8% over seven days, and the Fear & Greed index was at 26. A coin rising against that backdrop is worth watching.
What to watch next:
- Whether the price holds above recent support, and whether volume stays healthy.
- Upcoming macro events, including Nvidia earnings on November 17 and FOMC minutes on November 18. Tech and macro sentiment have been spilling into crypto.
Short-term rallies in a fearful market can reverse quickly, so this is a momentum observation, not a call to buy.
Data: CoinMarketCap and CoinGecko snapshots, November 2026. Prices change constantly;
#xrp #binanceSquare #BİNANCE
356
$HBAR
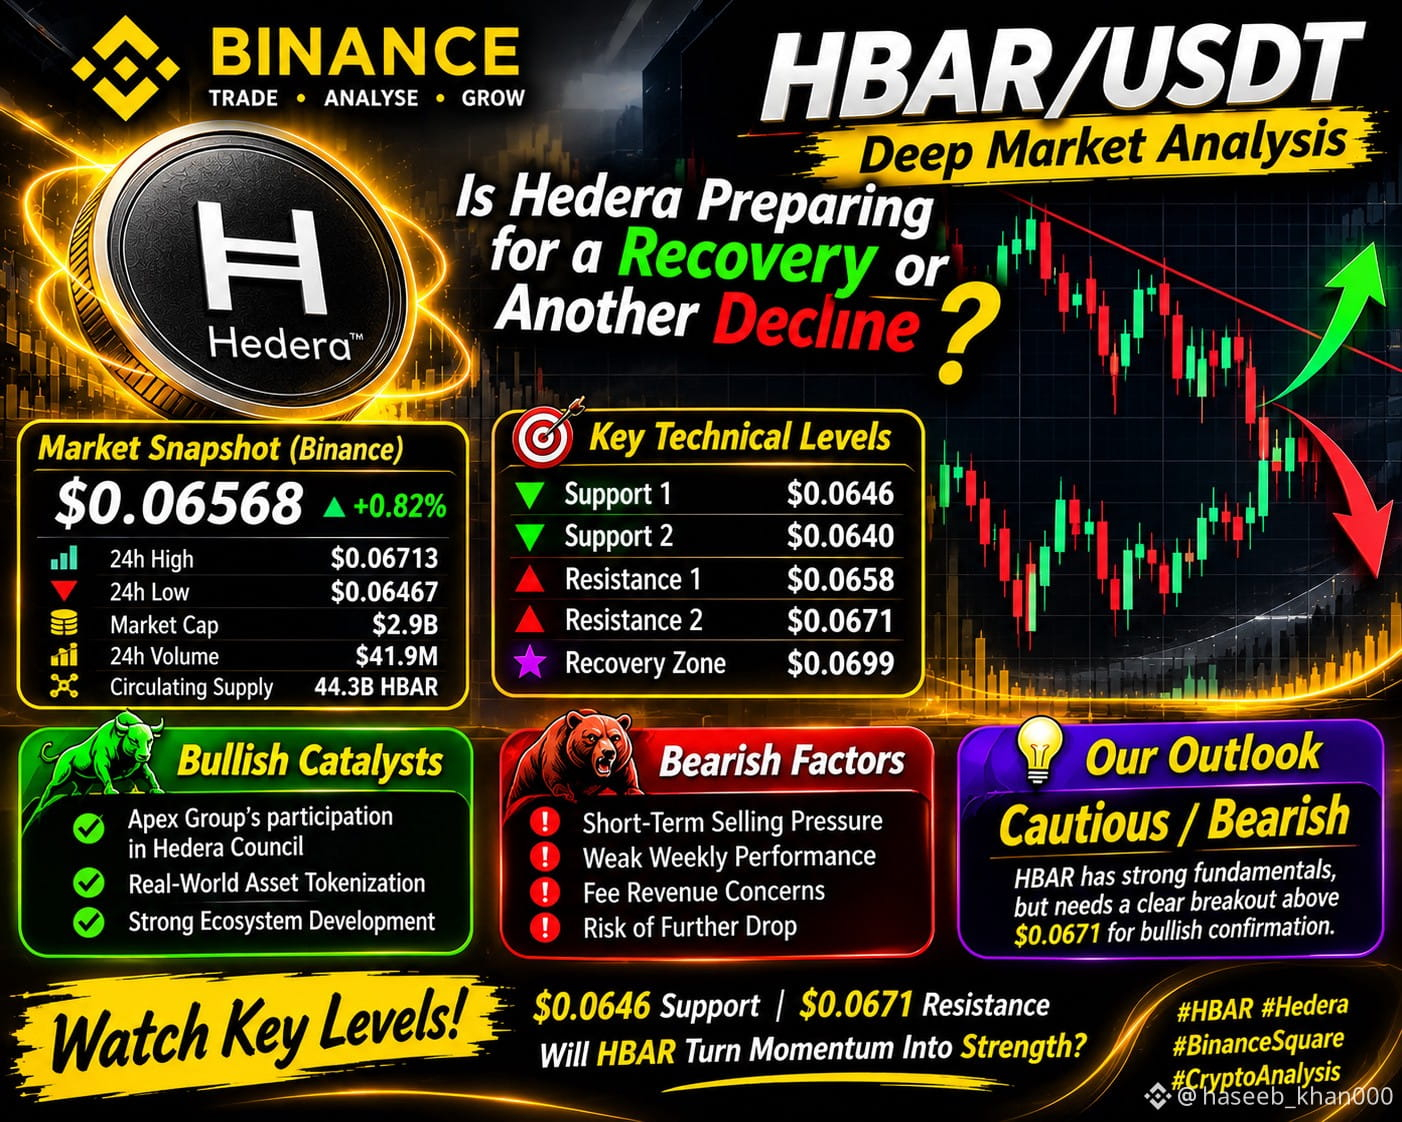
HBAR/USDT: Is Hedera Preparing for a Recovery or Another Decline?
Institutional Adoption Is Growing, But Is Market Demand Strong Enough?
Hedera is showing signs of short-term weakness despite its growing institutional ecosystem narrative.
Let's examine what the market is telling us.
📊 MARKET SNAPSHOT
- Current Price: $0.06568
- 24H Change: +0.82%
- 24H High: $0.06713
- 24H Low: $0.06467
- Market Cap: $2.9B
- 24H Volume: $41.9M
🔴 BEARISH FACTORS
- HBAR remains under broader short-term selling pressure.
- Weekly performance reflects continued market weakness.
- Price has struggled to establish a convincing recovery.
- Network fee revenue remains an important fundamental concern.
🟢 BULLISH CATALYSTS
- Apex Group's participation in the Hedera Council strengthens its institutional adoption narrative.
- Real-world asset tokenization remains a major ecosystem opportunity.
- Continued protocol development could improve long-term network utility.
📍 IMPORTANT TECHNICAL LEVELS
Support: $0.0646
Secondary Support: $0.0640
Immediate Resistance: $0.0658
Major Resistance: $0.0671
Recovery Zone: $0.0699
📈 WHAT COMES NEXT?
Bullish Scenario:
A sustained move above $0.0658, followed by a breakout above $0.0671 with stronger volume, could improve recovery sentiment.
Bearish Scenario:
A breakdown below $0.0646 could increase selling pressure and weaken the current market structure.
🔥 MY MARKET OUTLOOK
Current Bias: CAUTIOUS / BEARISH.
HBAR has promising ecosystem fundamentals, but its price action still needs stronger confirmation.
Institutional adoption is an encouraging long-term development, but sustainable market demand and technical strength are equally important.
The key question: Can HBAR turn institutional momentum into actual market strength?
Watch the support zone, trading volume and broader Bitcoin market direction.
#HBAR #Hedera #HBARUSDT #BinanceSquare #TechnicalAnalysis
{future}(HBARUSDT)
$HBAR
HBAR/USDT: Is Hedera Preparing for a Recovery or Another Decline?
Institutional Adoption Is Growing, But Is Market Demand Strong Enough?
Hedera is showing signs of short-term weakness despite its growing institutional ecosystem narrative.
Let's examine what the market is telling us.
📊 MARKET SNAPSHOT
- Current Price: $0.06568
- 24H Change: +0.82%
- 24H High: $0.06713
- 24H Low: $0.06467
- Market Cap: $2.9B
- 24H Volume: $41.9M
🔴 BEARISH FACTORS
- HBAR remains under broader short-term selling pressure.
- Weekly performance reflects continued market weakness.
- Price has struggled to establish a convincing recovery.
- Network fee revenue remains an important fundamental concern.
🟢 BULLISH CATALYSTS
- Apex Group's participation in the Hedera Council strengthens its institutional adoption narrative.
- Real-world asset tokenization remains a major ecosystem opportunity.
- Continued protocol development could improve long-term network utility.
📍 IMPORTANT TECHNICAL LEVELS
Support: $0.0646
Secondary Support: $0.0640
Immediate Resistance: $0.0658
Major Resistance: $0.0671
Recovery Zone: $0.0699
📈 WHAT COMES NEXT?
Bullish Scenario:
A sustained move above $0.0658, followed by a breakout above $0.0671 with stronger volume, could improve recovery sentiment.
Bearish Scenario:
A breakdown below $0.0646 could increase selling pressure and weaken the current market structure.
🔥 MY MARKET OUTLOOK
Current Bias: CAUTIOUS / BEARISH.
HBAR has promising ecosystem fundamentals, but its price action still needs stronger confirmation.
Institutional adoption is an encouraging long-term development, but sustainable market demand and technical strength are equally important.
The key question: Can HBAR turn institutional momentum into actual market strength?
Watch the support zone, trading volume and broader Bitcoin market direction.
#HBAR #Hedera #HBARUSDT #BinanceSquare #TechnicalAnalysis
HBAR/USDT: Is Hedera Preparing for a Recovery or Another Decline?
Institutional Adoption Is Growing, But Is Market Demand Strong Enough?
Hedera is showing signs of short-term weakness despite its growing institutional ecosystem narrative.
Let's examine what the market is telling us.
📊 MARKET SNAPSHOT
- Current Price: $0.06568
- 24H Change: +0.82%
- 24H High: $0.06713
- 24H Low: $0.06467
- Market Cap: $2.9B
- 24H Volume: $41.9M
🔴 BEARISH FACTORS
- HBAR remains under broader short-term selling pressure.
- Weekly performance reflects continued market weakness.
- Price has struggled to establish a convincing recovery.
- Network fee revenue remains an important fundamental concern.
🟢 BULLISH CATALYSTS
- Apex Group's participation in the Hedera Council strengthens its institutional adoption narrative.
- Real-world asset tokenization remains a major ecosystem opportunity.
- Continued protocol development could improve long-term network utility.
📍 IMPORTANT TECHNICAL LEVELS
Support: $0.0646
Secondary Support: $0.0640
Immediate Resistance: $0.0658
Major Resistance: $0.0671
Recovery Zone: $0.0699
📈 WHAT COMES NEXT?
Bullish Scenario:
A sustained move above $0.0658, followed by a breakout above $0.0671 with stronger volume, could improve recovery sentiment.
Bearish Scenario:
A breakdown below $0.0646 could increase selling pressure and weaken the current market structure.
🔥 MY MARKET OUTLOOK
Current Bias: CAUTIOUS / BEARISH.
HBAR has promising ecosystem fundamentals, but its price action still needs stronger confirmation.
Institutional adoption is an encouraging long-term development, but sustainable market demand and technical strength are equally important.
The key question: Can HBAR turn institutional momentum into actual market strength?
Watch the support zone, trading volume and broader Bitcoin market direction.
#HBAR #Hedera #HBARUSDT #BinanceSquare #TechnicalAnalysis
112
$KNTQ
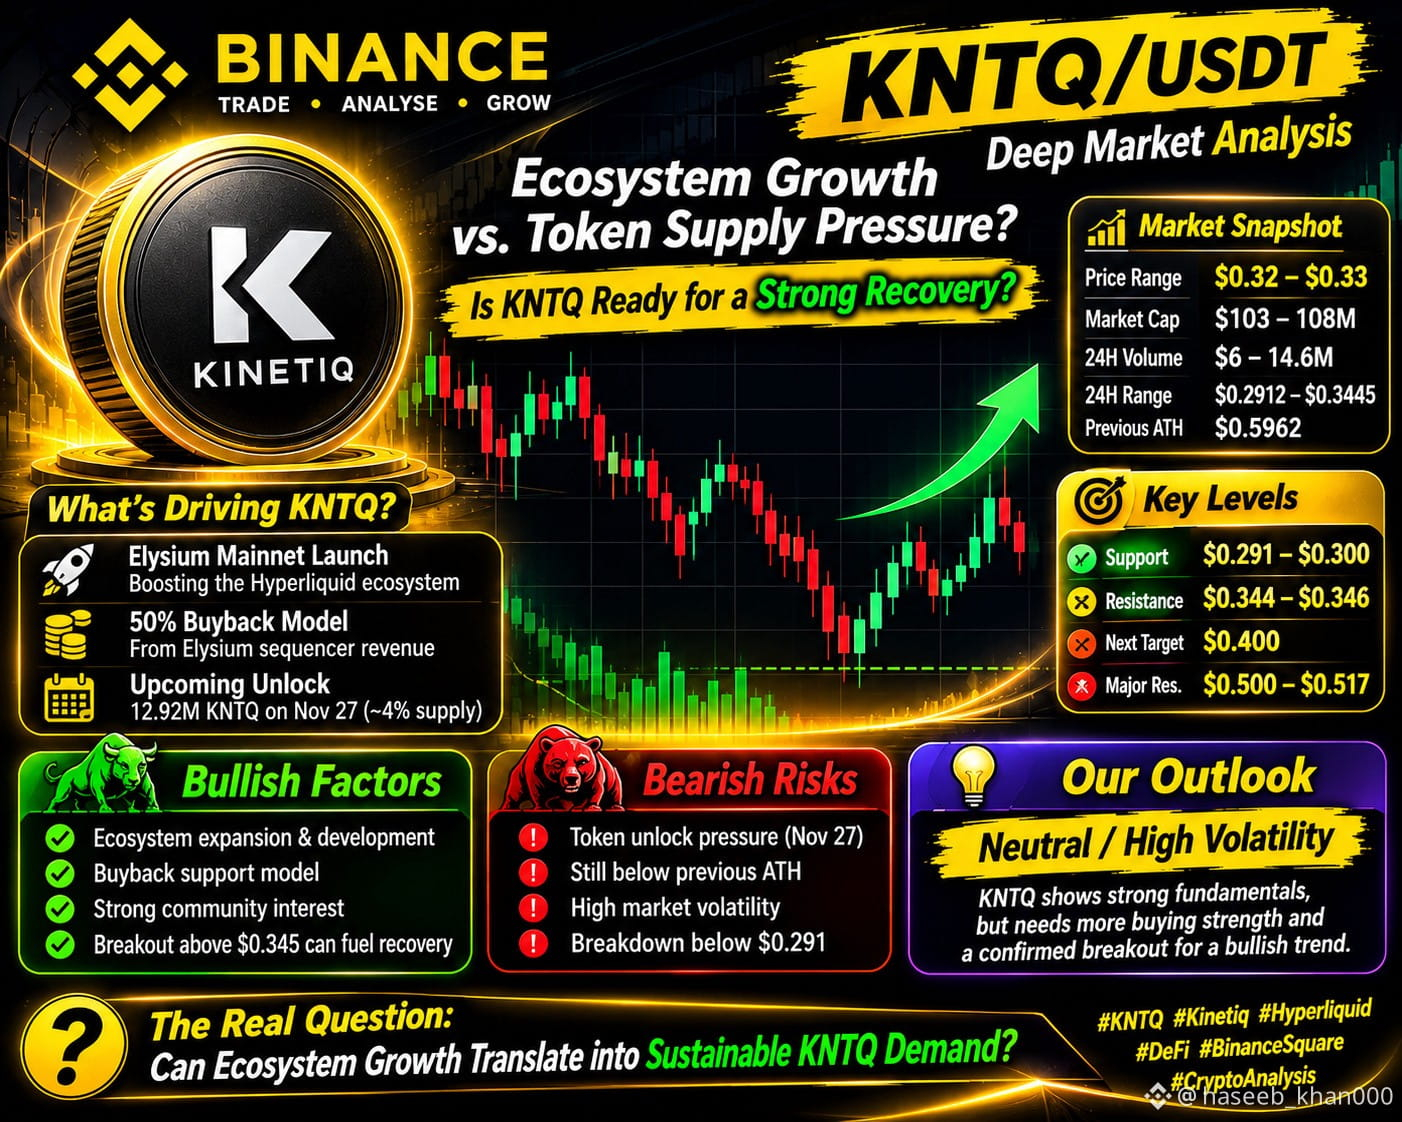
KNTQ: Ecosystem Growth vs. Token Supply Pressure 🚀
Is Kinetiq preparing for another recovery, or is volatility still the biggest challenge?
KNTQ is attracting attention following important developments across the Hyperliquid ecosystem. However, its market structure deserves careful observation.
📊 MARKET SNAPSHOT
- Reference Price: $0.32–$0.33
- Market Cap: Approximately $103–108M
- 24H Volume: Approximately $6–14.6M
- 24H Trading Range: $0.2912–$0.3445
- Previous ATH: $0.5962
📈 TECHNICAL STRUCTURE
Key support: $0.291–$0.300
Immediate resistance: $0.344–$0.346
Next resistance: $0.400
Major resistance: $0.500–$0.517
BULLISH FACTORS 🟢
- Elysium public mainnet launched on November 9.
- 50% of Elysium sequencer revenue is allocated to KNTQ buybacks.
- Protocol development could strengthen long-term ecosystem activity.
- A confirmed breakout above $0.345 with strong volume would improve the recovery outlook.
BEARISH RISKS 🔴
- KNTQ remains significantly below its previous ATH.
- Upcoming November 27 token unlock introduces additional supply risk.
- Recent price volatility makes short-term direction uncertain.
- A breakdown below $0.291 could weaken the recovery structure.
🔥 MY MARKET OUTLOOK
Current bias: NEUTRAL / HIGH VOLATILITY.
KNTQ has interesting fundamental developments, particularly the Elysium launch and revenue-funded buyback model.
However, fundamentals alone cannot confirm a bullish trend.
The market needs sustained buying participation and a convincing breakout before recovery strength can be established.
The real question: Can ecosystem growth translate into sustainable KNTQ demand?
Stay focused on market structure, volume confirmation and token supply dynamics.
#KNTQ #Kinetiq #DeFi #CryptoAnalysis #BinanceSquare
$KNTQ
KNTQ: Ecosystem Growth vs. Token Supply Pressure 🚀
Is Kinetiq preparing for another recovery, or is volatility still the biggest challenge?
KNTQ is attracting attention following important developments across the Hyperliquid ecosystem. However, its market structure deserves careful observation.
📊 MARKET SNAPSHOT
- Reference Price: $0.32–$0.33
- Market Cap: Approximately $103–108M
- 24H Volume: Approximately $6–14.6M
- 24H Trading Range: $0.2912–$0.3445
- Previous ATH: $0.5962
📈 TECHNICAL STRUCTURE
Key support: $0.291–$0.300
Immediate resistance: $0.344–$0.346
Next resistance: $0.400
Major resistance: $0.500–$0.517
BULLISH FACTORS 🟢
- Elysium public mainnet launched on November 9.
- 50% of Elysium sequencer revenue is allocated to KNTQ buybacks.
- Protocol development could strengthen long-term ecosystem activity.
- A confirmed breakout above $0.345 with strong volume would improve the recovery outlook.
BEARISH RISKS 🔴
- KNTQ remains significantly below its previous ATH.
- Upcoming November 27 token unlock introduces additional supply risk.
- Recent price volatility makes short-term direction uncertain.
- A breakdown below $0.291 could weaken the recovery structure.
🔥 MY MARKET OUTLOOK
Current bias: NEUTRAL / HIGH VOLATILITY.
KNTQ has interesting fundamental developments, particularly the Elysium launch and revenue-funded buyback model.
However, fundamentals alone cannot confirm a bullish trend.
The market needs sustained buying participation and a convincing breakout before recovery strength can be established.
The real question: Can ecosystem growth translate into sustainable KNTQ demand?
Stay focused on market structure, volume confirmation and token supply dynamics.
#KNTQ #Kinetiq #DeFi #CryptoAnalysis #BinanceSquare
KNTQ: Ecosystem Growth vs. Token Supply Pressure 🚀
Is Kinetiq preparing for another recovery, or is volatility still the biggest challenge?
KNTQ is attracting attention following important developments across the Hyperliquid ecosystem. However, its market structure deserves careful observation.
📊 MARKET SNAPSHOT
- Reference Price: $0.32–$0.33
- Market Cap: Approximately $103–108M
- 24H Volume: Approximately $6–14.6M
- 24H Trading Range: $0.2912–$0.3445
- Previous ATH: $0.5962
📈 TECHNICAL STRUCTURE
Key support: $0.291–$0.300
Immediate resistance: $0.344–$0.346
Next resistance: $0.400
Major resistance: $0.500–$0.517
BULLISH FACTORS 🟢
- Elysium public mainnet launched on November 9.
- 50% of Elysium sequencer revenue is allocated to KNTQ buybacks.
- Protocol development could strengthen long-term ecosystem activity.
- A confirmed breakout above $0.345 with strong volume would improve the recovery outlook.
BEARISH RISKS 🔴
- KNTQ remains significantly below its previous ATH.
- Upcoming November 27 token unlock introduces additional supply risk.
- Recent price volatility makes short-term direction uncertain.
- A breakdown below $0.291 could weaken the recovery structure.
🔥 MY MARKET OUTLOOK
Current bias: NEUTRAL / HIGH VOLATILITY.
KNTQ has interesting fundamental developments, particularly the Elysium launch and revenue-funded buyback model.
However, fundamentals alone cannot confirm a bullish trend.
The market needs sustained buying participation and a convincing breakout before recovery strength can be established.
The real question: Can ecosystem growth translate into sustainable KNTQ demand?
Stay focused on market structure, volume confirmation and token supply dynamics.
#KNTQ #Kinetiq #DeFi #CryptoAnalysis #BinanceSquare
54
$ZEC
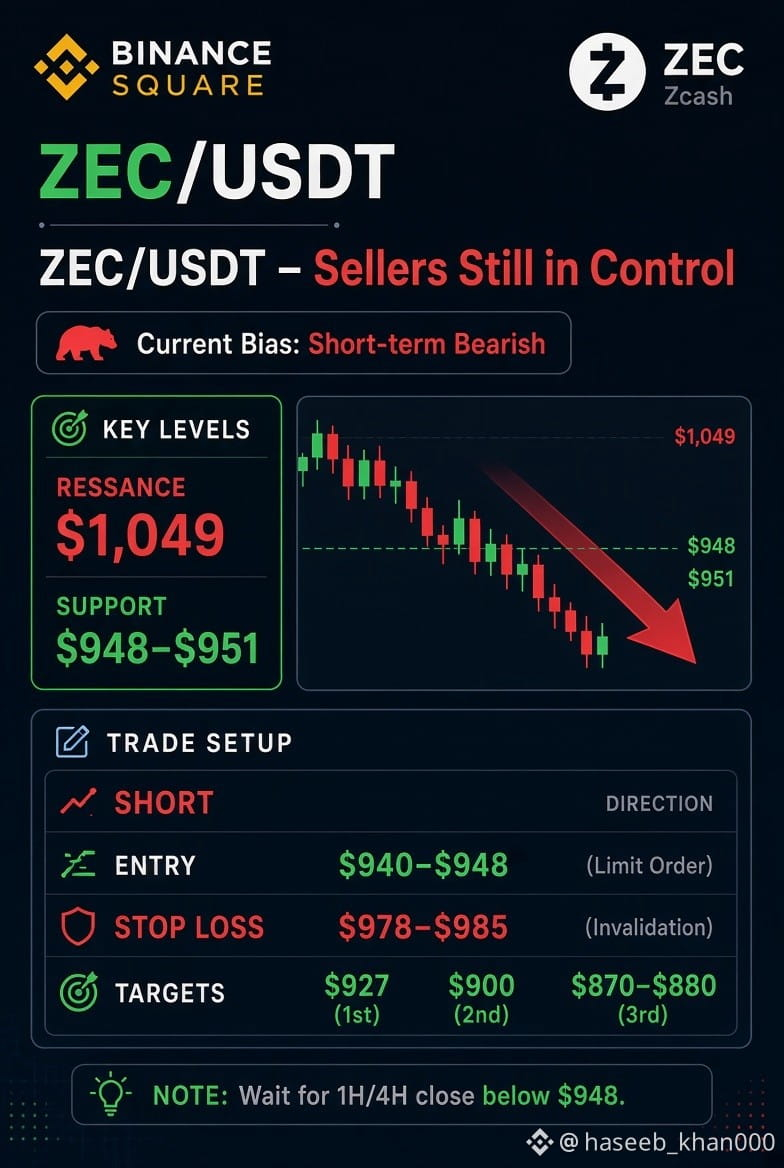
ZEC/USDT: Sellers Still in Control Near Key Support
ZEC is trading under clear short-term pressure.
The 1H and 4H charts remain bearish, with price sitting below key moving averages and sellers holding the stronger hand for now.
Key Levels to Watch
Support: $948 – $951
Resistance: $1,049
Price is testing the lower end of the recent range. A clean break below support could open the door for further downside.
Conditional Trade Idea – SHORT
Entry zone: $940 – $948
Stop Loss: $978 – $985
Targets:
TP1: $927
TP2: $900
TP3: $870 – $880
Risk-to-reward sits in a practical 1:1.5 to 1:2.5 range depending on exact entry.
What to Wait For
Do not enter early. Wait for a confirmed 1H or 4H candle close below the $948–951 zone. Prefer to see volume pick up on the breakdown. If price holds the support and reclaims $975+, the short setup is off the table.
No guarantees in this market — manage risk carefully and only trade what fits your plan.
Are you watching for the breakdown below $950, or do you think buyers will defend this level? Drop your view below.
#ZEC #ZECUSDT #CryptoTrading #BinanceSquare #TechnicalAnalysis
{future}(ZECUSDT)
$ZEC
ZEC/USDT: Sellers Still in Control Near Key Support
ZEC is trading under clear short-term pressure.
The 1H and 4H charts remain bearish, with price sitting below key moving averages and sellers holding the stronger hand for now.
Key Levels to Watch
Support: $948 – $951
Resistance: $1,049
Price is testing the lower end of the recent range. A clean break below support could open the door for further downside.
Conditional Trade Idea – SHORT
Entry zone: $940 – $948
Stop Loss: $978 – $985
Targets:
TP1: $927
TP2: $900
TP3: $870 – $880
Risk-to-reward sits in a practical 1:1.5 to 1:2.5 range depending on exact entry.
What to Wait For
Do not enter early. Wait for a confirmed 1H or 4H candle close below the $948–951 zone. Prefer to see volume pick up on the breakdown. If price holds the support and reclaims $975+, the short setup is off the table.
No guarantees in this market — manage risk carefully and only trade what fits your plan.
Are you watching for the breakdown below $950, or do you think buyers will defend this level? Drop your view below.
#ZEC #ZECUSDT #CryptoTrading #BinanceSquare #TechnicalAnalysis
ZEC/USDT: Sellers Still in Control Near Key Support
ZEC is trading under clear short-term pressure.
The 1H and 4H charts remain bearish, with price sitting below key moving averages and sellers holding the stronger hand for now.
Key Levels to Watch
Support: $948 – $951
Resistance: $1,049
Price is testing the lower end of the recent range. A clean break below support could open the door for further downside.
Conditional Trade Idea – SHORT
Entry zone: $940 – $948
Stop Loss: $978 – $985
Targets:
TP1: $927
TP2: $900
TP3: $870 – $880
Risk-to-reward sits in a practical 1:1.5 to 1:2.5 range depending on exact entry.
What to Wait For
Do not enter early. Wait for a confirmed 1H or 4H candle close below the $948–951 zone. Prefer to see volume pick up on the breakdown. If price holds the support and reclaims $975+, the short setup is off the table.
No guarantees in this market — manage risk carefully and only trade what fits your plan.
Are you watching for the breakdown below $950, or do you think buyers will defend this level? Drop your view below.
#ZEC #ZECUSDT #CryptoTrading #BinanceSquare #TechnicalAnalysis
230
$ZEC
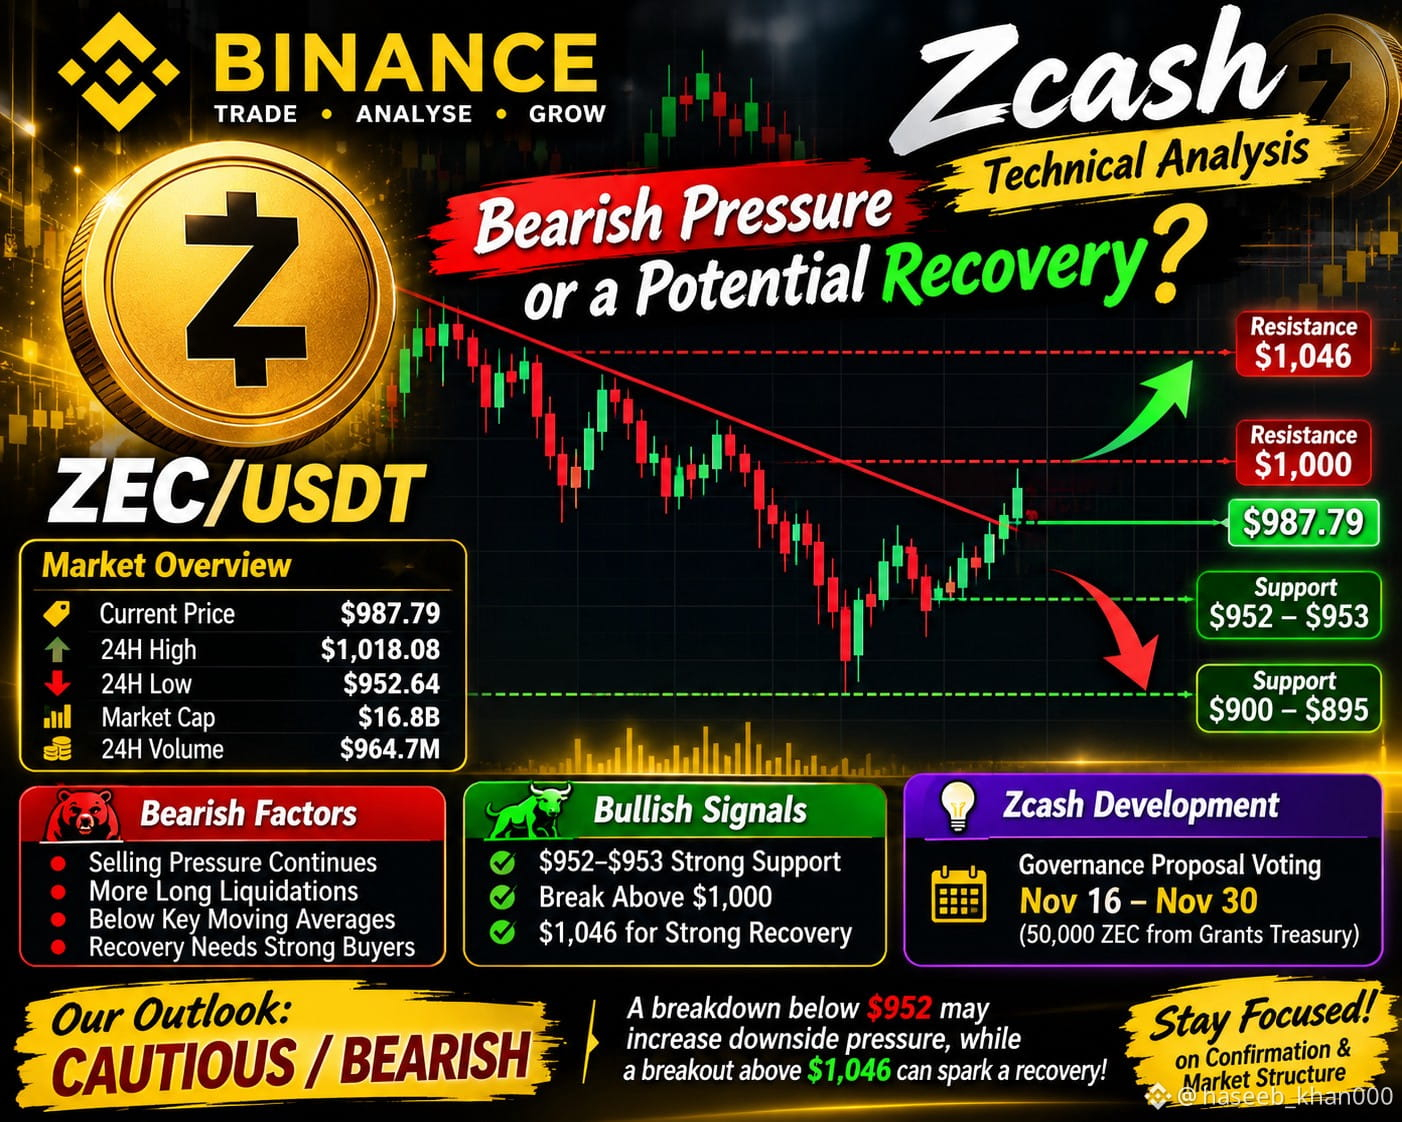
ZEC/USDT: Bearish Pressure or a Potential Recovery?
Zcash is approaching a critical market decision zone.
ZEC is showing signs of short-term weakness after a significant correction. Although the price is attempting to stabilize, buyers have not yet established convincing bullish control.
📊 Market Overview
- Reference Price: $987.79
- 24H High: $1,018.08
- 24H Low: $952.64
- Market Cap: $16.8B
- 24H Trading Volume: $964.7M
Technical Market Structure
🔴 Bearish Factors
- Price remains under short-term selling pressure.
- Recent long liquidations have increased downside volatility.
- ZEC remains below its recent moving-average structure.
- Recovery attempts need stronger buying participation.
🟢 Bullish Recovery Signals
- $952–$953 is an important support area.
- A sustained recovery above $1,000 could improve market sentiment.
- A breakout above $1,046 would provide stronger evidence of recovery.
Key Levels to Watch
- Major Support: $952–$953
- Lower Support: $900–$895
- Psychological Resistance: $1,000
- Major Resistance: $1,046
Fundamental Development
An important Zcash governance proposal is scheduled for voting between November 16 and November 30. It concerns 50,000 ZEC from the community grants treasury and could influence future ecosystem funding discussions.
My Market Outlook
Current bias: CAUTIOUS / BEARISH.
ZEC needs to defend its recent support and reclaim important resistance levels before a bullish reversal can be considered convincing.
A breakdown below $952 could increase downside pressure, while a sustained recovery above $1,046 would improve the technical picture.
The key question: Can Zcash defend its support, or will sellers take control again?
Stay focused on confirmation, market structure and volume rather than chasing short-term volatility.
#ZEC #ZECUSDT #Zcash #BinanceSquare #CryptoMarket
{future}(ZECUSDT)
$ZEC
ZEC/USDT: Bearish Pressure or a Potential Recovery?
Zcash is approaching a critical market decision zone.
ZEC is showing signs of short-term weakness after a significant correction. Although the price is attempting to stabilize, buyers have not yet established convincing bullish control.
📊 Market Overview
- Reference Price: $987.79
- 24H High: $1,018.08
- 24H Low: $952.64
- Market Cap: $16.8B
- 24H Trading Volume: $964.7M
Technical Market Structure
🔴 Bearish Factors
- Price remains under short-term selling pressure.
- Recent long liquidations have increased downside volatility.
- ZEC remains below its recent moving-average structure.
- Recovery attempts need stronger buying participation.
🟢 Bullish Recovery Signals
- $952–$953 is an important support area.
- A sustained recovery above $1,000 could improve market sentiment.
- A breakout above $1,046 would provide stronger evidence of recovery.
Key Levels to Watch
- Major Support: $952–$953
- Lower Support: $900–$895
- Psychological Resistance: $1,000
- Major Resistance: $1,046
Fundamental Development
An important Zcash governance proposal is scheduled for voting between November 16 and November 30. It concerns 50,000 ZEC from the community grants treasury and could influence future ecosystem funding discussions.
My Market Outlook
Current bias: CAUTIOUS / BEARISH.
ZEC needs to defend its recent support and reclaim important resistance levels before a bullish reversal can be considered convincing.
A breakdown below $952 could increase downside pressure, while a sustained recovery above $1,046 would improve the technical picture.
The key question: Can Zcash defend its support, or will sellers take control again?
Stay focused on confirmation, market structure and volume rather than chasing short-term volatility.
#ZEC #ZECUSDT #Zcash #BinanceSquare #CryptoMarket
ZEC/USDT: Bearish Pressure or a Potential Recovery?
Zcash is approaching a critical market decision zone.
ZEC is showing signs of short-term weakness after a significant correction. Although the price is attempting to stabilize, buyers have not yet established convincing bullish control.
📊 Market Overview
- Reference Price: $987.79
- 24H High: $1,018.08
- 24H Low: $952.64
- Market Cap: $16.8B
- 24H Trading Volume: $964.7M
Technical Market Structure
🔴 Bearish Factors
- Price remains under short-term selling pressure.
- Recent long liquidations have increased downside volatility.
- ZEC remains below its recent moving-average structure.
- Recovery attempts need stronger buying participation.
🟢 Bullish Recovery Signals
- $952–$953 is an important support area.
- A sustained recovery above $1,000 could improve market sentiment.
- A breakout above $1,046 would provide stronger evidence of recovery.
Key Levels to Watch
- Major Support: $952–$953
- Lower Support: $900–$895
- Psychological Resistance: $1,000
- Major Resistance: $1,046
Fundamental Development
An important Zcash governance proposal is scheduled for voting between November 16 and November 30. It concerns 50,000 ZEC from the community grants treasury and could influence future ecosystem funding discussions.
My Market Outlook
Current bias: CAUTIOUS / BEARISH.
ZEC needs to defend its recent support and reclaim important resistance levels before a bullish reversal can be considered convincing.
A breakdown below $952 could increase downside pressure, while a sustained recovery above $1,046 would improve the technical picture.
The key question: Can Zcash defend its support, or will sellers take control again?
Stay focused on confirmation, market structure and volume rather than chasing short-term volatility.
#ZEC #ZECUSDT #Zcash #BinanceSquare #CryptoMarket
354
$JCT
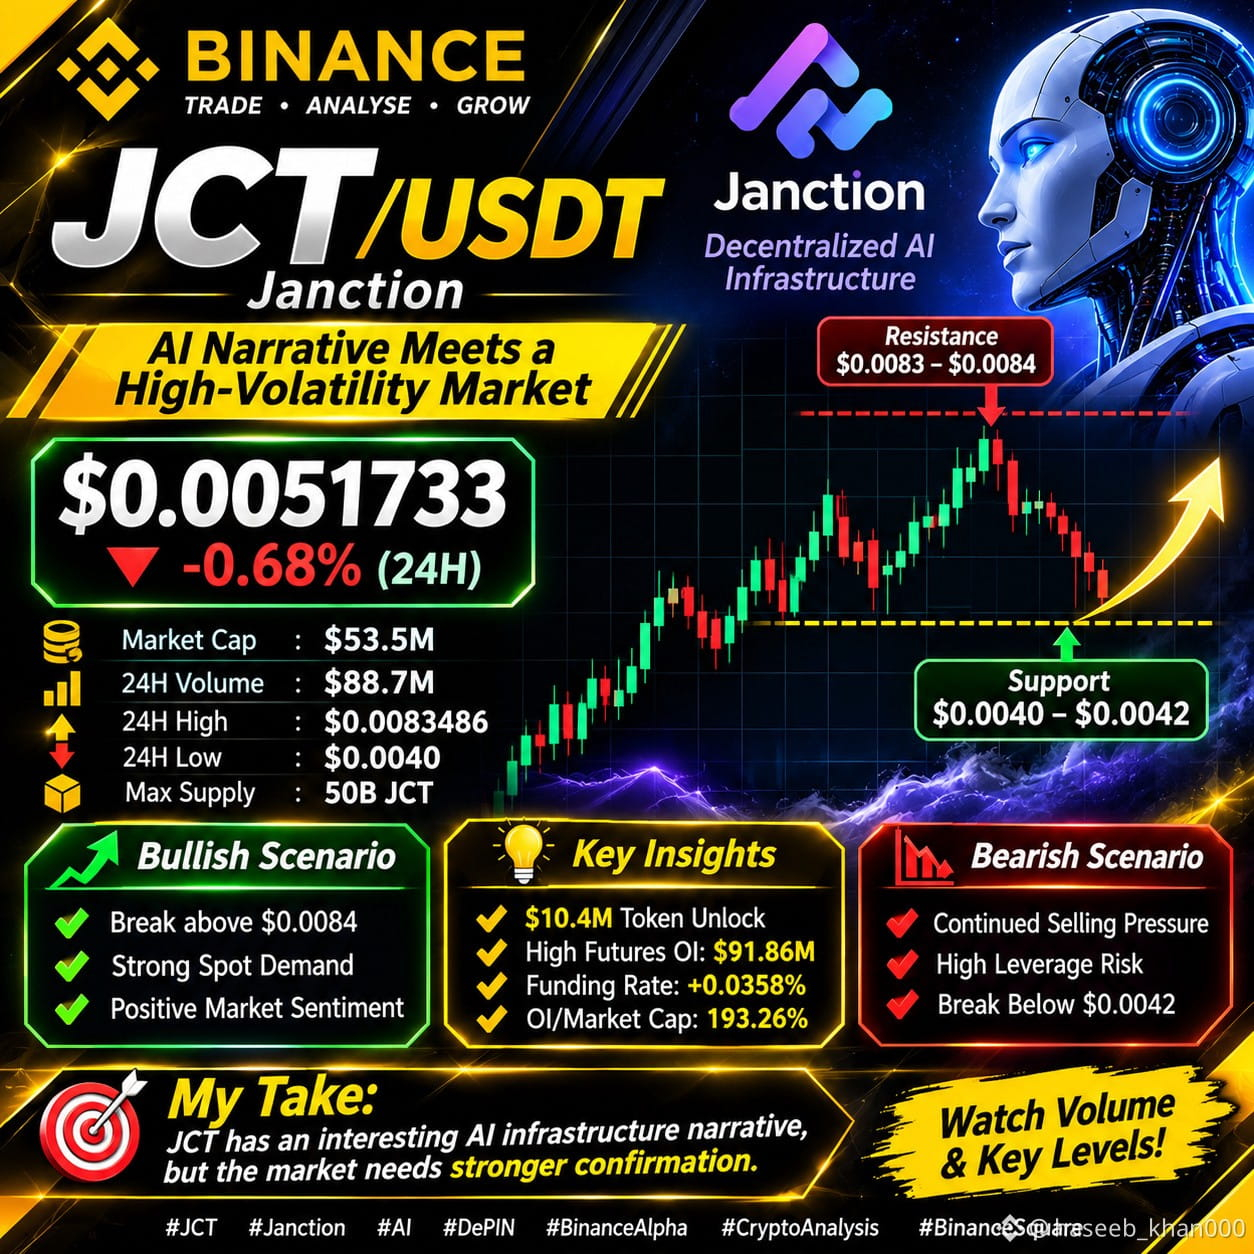
⚡ JCT: AI Narrative Meets a High-Volatility Market
Janction ($JCT) is attracting attention through its decentralized AI and GPU infrastructure narrative. But the latest market structure deserves closer examination.
📊 Market Intelligence
- Binance Alpha reference price: ~$0.00517
- Reported market capitalization: ~$53.5M
- 24H volume: ~$88.7M
- Recent trading range: ~$0.0040–$0.0084
🔍 What Matters Now?
• Elevated futures open interest signals significant speculative positioning.
• Positive funding suggests long positions are paying shorts.
• A reported $10.4M token unlock introduces additional supply-side uncertainty.
📈 Bullish Outlook: A sustained recovery with stronger spot participation could improve market sentiment.
📉 Bearish Outlook: Continued selling pressure and excessive leverage could increase downside volatility.
My Take: JCT has an interesting AI infrastructure narrative, but the market needs stronger confirmation before a sustainable bullish trend can be established.
No blind bullish calls. Watch volume, price structure and market positioning.
#JCT #Janction #AI #DePIN #Altcoins
{future}(JCTUSDT)
$JCT
⚡ JCT: AI Narrative Meets a High-Volatility Market
Janction ($JCT ) is attracting attention through its decentralized AI and GPU infrastructure narrative. But the latest market structure deserves closer examination.
📊 Market Intelligence
- Binance Alpha reference price: ~$0.00517
- Reported market capitalization: ~$53.5M
- 24H volume: ~$88.7M
- Recent trading range: ~$0.0040–$0.0084
🔍 What Matters Now?
• Elevated futures open interest signals significant speculative positioning.
• Positive funding suggests long positions are paying shorts.
• A reported $10.4M token unlock introduces additional supply-side uncertainty.
📈 Bullish Outlook: A sustained recovery with stronger spot participation could improve market sentiment.
📉 Bearish Outlook: Continued selling pressure and excessive leverage could increase downside volatility.
My Take: JCT has an interesting AI infrastructure narrative, but the market needs stronger confirmation before a sustainable bullish trend can be established.
No blind bullish calls. Watch volume, price structure and market positioning.
#JCT #Janction #AI #DePIN #Altcoins
⚡ JCT: AI Narrative Meets a High-Volatility Market
Janction ($JCT ) is attracting attention through its decentralized AI and GPU infrastructure narrative. But the latest market structure deserves closer examination.
📊 Market Intelligence
- Binance Alpha reference price: ~$0.00517
- Reported market capitalization: ~$53.5M
- 24H volume: ~$88.7M
- Recent trading range: ~$0.0040–$0.0084
🔍 What Matters Now?
• Elevated futures open interest signals significant speculative positioning.
• Positive funding suggests long positions are paying shorts.
• A reported $10.4M token unlock introduces additional supply-side uncertainty.
📈 Bullish Outlook: A sustained recovery with stronger spot participation could improve market sentiment.
📉 Bearish Outlook: Continued selling pressure and excessive leverage could increase downside volatility.
My Take: JCT has an interesting AI infrastructure narrative, but the market needs stronger confirmation before a sustainable bullish trend can be established.
No blind bullish calls. Watch volume, price structure and market positioning.
#JCT #Janction #AI #DePIN #Altcoins
291
$RKLBB
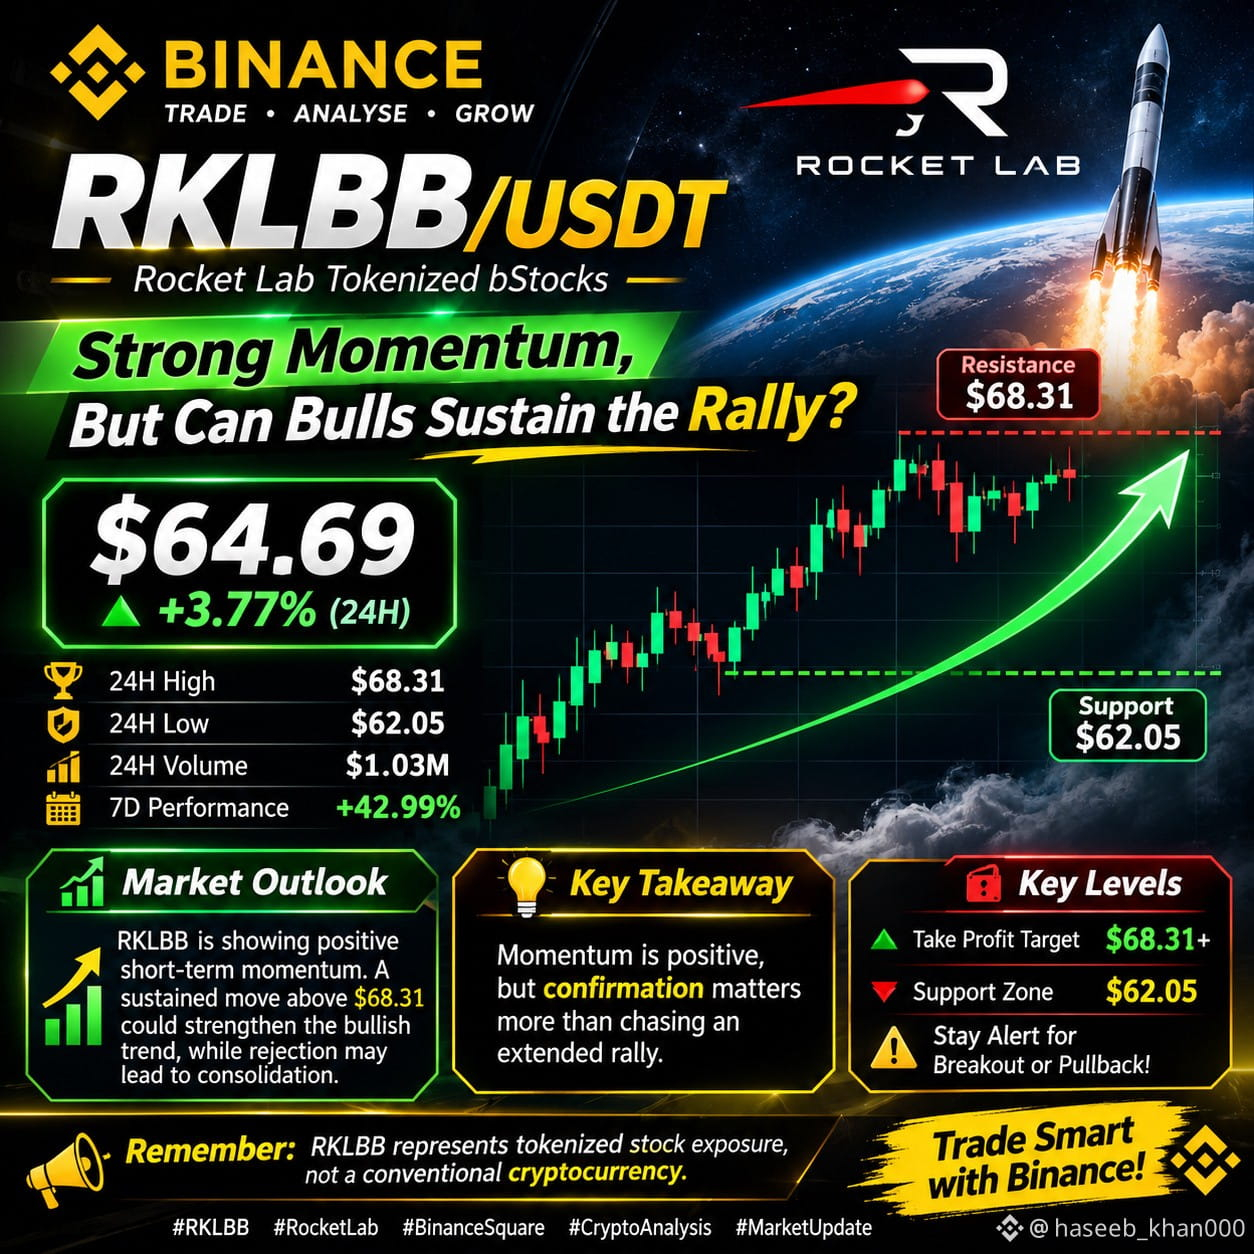
🚀 RKLBB/USDT: Strong Momentum, But Can Bulls Sustain the Rally?
RKLBB is attracting attention with approximately +3.77% daily growth and an impressive +42.99% weekly move.
📊 Market Highlights
- Current Price: ~$64.69
- 24H High: $68.31
- 24H Low: $62.05
- 24H Volume: ~$1.03M
🔍 Market Outlook
RKLBB is showing positive short-term momentum. However, the $68.31 area deserves attention as a recent resistance reference.
A sustained move beyond this level would strengthen the bullish market picture, while rejection could bring consolidation toward the recent trading range.
⚠️ My Take: Momentum is positive, but confirmation matters more than chasing an extended rally.
Remember: RKLBB represents tokenized stock exposure, not a conventional cryptocurrency.
#RKLBB #RocketLab #BinanceSquare #TokenizedStocks
{spot}(RKLBBUSDT)
$RKLBB
🚀 RKLBB/USDT: Strong Momentum, But Can Bulls Sustain the Rally?
RKLBB is attracting attention with approximately +3.77% daily growth and an impressive +42.99% weekly move.
📊 Market Highlights
- Current Price: ~$64.69
- 24H High: $68.31
- 24H Low: $62.05
- 24H Volume: ~$1.03M
🔍 Market Outlook
RKLBB is showing positive short-term momentum. However, the $68.31 area deserves attention as a recent resistance reference.
A sustained move beyond this level would strengthen the bullish market picture, while rejection could bring consolidation toward the recent trading range.
⚠️ My Take: Momentum is positive, but confirmation matters more than chasing an extended rally.
Remember: RKLBB represents tokenized stock exposure, not a conventional cryptocurrency.
#RKLBB #RocketLab #BinanceSquare #TokenizedStocks
🚀 RKLBB/USDT: Strong Momentum, But Can Bulls Sustain the Rally?
RKLBB is attracting attention with approximately +3.77% daily growth and an impressive +42.99% weekly move.
📊 Market Highlights
- Current Price: ~$64.69
- 24H High: $68.31
- 24H Low: $62.05
- 24H Volume: ~$1.03M
🔍 Market Outlook
RKLBB is showing positive short-term momentum. However, the $68.31 area deserves attention as a recent resistance reference.
A sustained move beyond this level would strengthen the bullish market picture, while rejection could bring consolidation toward the recent trading range.
⚠️ My Take: Momentum is positive, but confirmation matters more than chasing an extended rally.
Remember: RKLBB represents tokenized stock exposure, not a conventional cryptocurrency.
#RKLBB #RocketLab #BinanceSquare #TokenizedStocks
115
🚀 TOP 5 BINANCE GAINERS — NOVEMBER 11, 2026
🔥 Momentum Watch: Which Assets Are Leading Today's Market?
The latest Binance market snapshot highlights five strong performers:
📊 TOP 5 PERFORMERS (24H)
🥇 MVLLB — $12.07 | +22.54%
🥈 SOXLB — $64.68 | +19.78%
🥉 CRWVB — $56.96 | +18.02%
4️⃣ RKLBB — $63.76 | +16.80%
5️⃣ ERA — $0.0856 | +14.51%
🔍 MARKET OBSERVATIONS
$MVLLB : Leading the selected group with strong positive momentum.
$SOXLB : Semiconductor-linked exposure is showing notable strength.
#CRWVB : Strong upside performance reflects increased interest in technology-linked assets.
#RKLBB : Rocket Lab-linked exposure is recording a significant daily advance.
• #ERA : Standing out among crypto-native projects with positive market momentum.
📈 WHAT'S THE BIGGER PICTURE?
Today's performance highlights two different market themes:
1. Technology and semiconductor-linked assets are attracting attention.
2. ERA is demonstrating strength within the crypto-native market.
⚠️ IMPORTANT RISK NOTE
Most of today's leading names are tokenized stock or leveraged ETF-linked products, not conventional cryptocurrencies. Their performance can depend on underlying stocks, leverage and market structure.
A 24-hour gain does not confirm a sustainable bullish trend. Further confirmation requires volume, market structure and broader market conditions.
🎯 MY MARKET VIEW
Momentum is worth monitoring, but chasing extended price movements without confirmation can be risky.
Smart analysis is about understanding the move, not blindly following it.
What do you think — will this bullish momentum continue?
{future}(MVLLUSDT)
{spot}(SOXLBUSDT)
{spot}(CRWVBUSDT)
🚀 TOP 5 BINANCE GAINERS — NOVEMBER 11, 2026
🔥 Momentum Watch: Which Assets Are Leading Today's Market?
The latest Binance market snapshot highlights five strong performers:
📊 TOP 5 PERFORMERS (24H)
🥇 MVLLB — $12.07 | +22.54%
🥈 SOXLB — $64.68 | +19.78%
🥉 CRWVB — $56.96 | +18.02%
4️⃣ RKLBB — $63.76 | +16.80%
5️⃣ ERA — $0.0856 | +14.51%
🔍 MARKET OBSERVATIONS
$MVLLB : Leading the selected group with strong positive momentum.
$SOXLB : Semiconductor-linked exposure is showing notable strength.
#CRWVB : Strong upside performance reflects increased interest in technology-linked assets.
#RKLBB : Rocket Lab-linked exposure is recording a significant daily advance.
• #ERA : Standing out among crypto-native projects with positive market momentum.
📈 WHAT'S THE BIGGER PICTURE?
Today's performance highlights two different market themes:
1. Technology and semiconductor-linked assets are attracting attention.
2. ERA is demonstrating strength within the crypto-native market.
⚠️ IMPORTANT RISK NOTE
Most of today's leading names are tokenized stock or leveraged ETF-linked products, not conventional cryptocurrencies. Their performance can depend on underlying stocks, leverage and market structure.
A 24-hour gain does not confirm a sustainable bullish trend. Further confirmation requires volume, market structure and broader market conditions.
🎯 MY MARKET VIEW
Momentum is worth monitoring, but chasing extended price movements without confirmation can be risky.
Smart analysis is about understanding the move, not blindly following it.
What do you think — will this bullish momentum continue?
🔥 Momentum Watch: Which Assets Are Leading Today's Market?
The latest Binance market snapshot highlights five strong performers:
📊 TOP 5 PERFORMERS (24H)
🥇 MVLLB — $12.07 | +22.54%
🥈 SOXLB — $64.68 | +19.78%
🥉 CRWVB — $56.96 | +18.02%
4️⃣ RKLBB — $63.76 | +16.80%
5️⃣ ERA — $0.0856 | +14.51%
🔍 MARKET OBSERVATIONS
$MVLLB : Leading the selected group with strong positive momentum.
$SOXLB : Semiconductor-linked exposure is showing notable strength.
#CRWVB : Strong upside performance reflects increased interest in technology-linked assets.
#RKLBB : Rocket Lab-linked exposure is recording a significant daily advance.
• #ERA : Standing out among crypto-native projects with positive market momentum.
📈 WHAT'S THE BIGGER PICTURE?
Today's performance highlights two different market themes:
1. Technology and semiconductor-linked assets are attracting attention.
2. ERA is demonstrating strength within the crypto-native market.
⚠️ IMPORTANT RISK NOTE
Most of today's leading names are tokenized stock or leveraged ETF-linked products, not conventional cryptocurrencies. Their performance can depend on underlying stocks, leverage and market structure.
A 24-hour gain does not confirm a sustainable bullish trend. Further confirmation requires volume, market structure and broader market conditions.
🎯 MY MARKET VIEW
Momentum is worth monitoring, but chasing extended price movements without confirmation can be risky.
Smart analysis is about understanding the move, not blindly following it.
What do you think — will this bullish momentum continue?

1
229
$LITEB
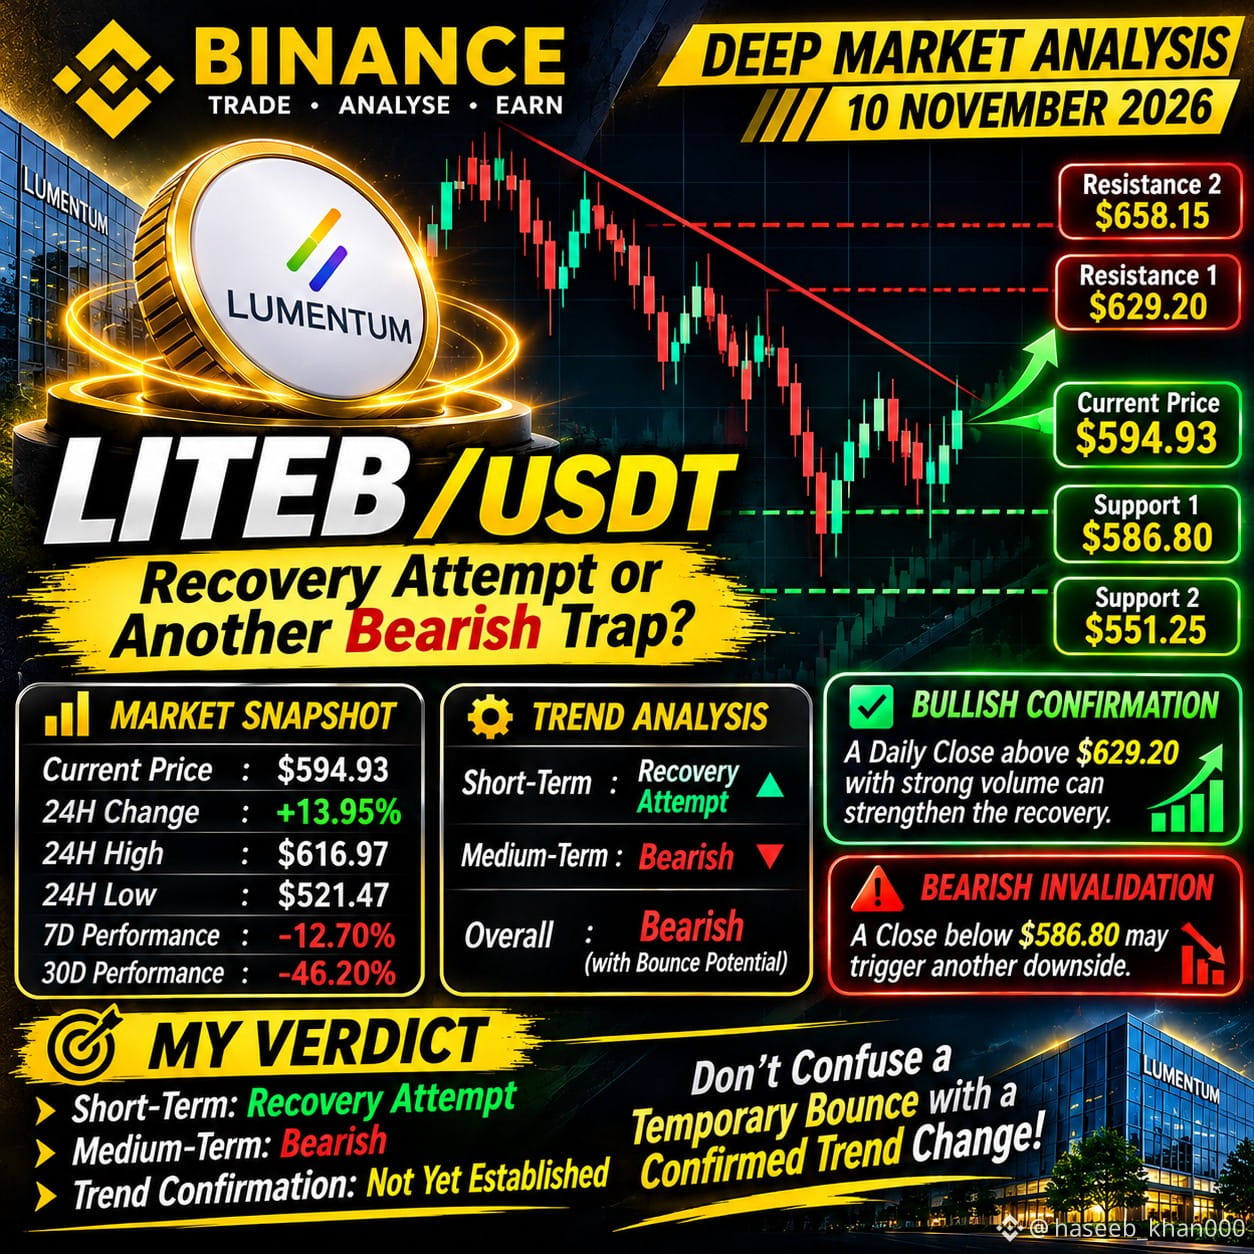
🚨 LITEB/USDT: Powerful Recovery or Another Bearish Trap?
LITEB is attracting market attention as buying activity increases. But beneath the short-term recovery, the broader technical structure remains bearish.
📊 MARKET SNAPSHOT
- Reference Price: ~$594.93
- 24H Change: +13.95%
- 24H High: $616.97
- 24H Low: $521.47
- 7D Performance: -12.70%
- 30D Performance: -46.20%
📈 TECHNICAL MARKET STRUCTURE
Short-term momentum is attempting to recover, but the underlying Lumentum share remains below major moving averages.
Daily RSI: 37.4
4H RSI: 55.3
MACD: Bearish
Overall Trend: Bearish
🎯 KEY LEVELS
- Resistance 1: $629.20
- Resistance 2: $658.15
- Support 1: $586.80
- Support 2: $551.25
🟢 BULLISH TREND CONFIRMATION
A sustained daily close above $629.20, supported by stronger trading volume and a successful retest, would provide stronger evidence of a temporary bullish reversal.
🔴 BEARISH INVALIDATION
A daily close below $586.80 would weaken the recovery structure and increase the possibility of another downside move.
🔥 MY MARKET VERDICT
SHORT-TERM: Recovery attempt.
MEDIUM-TERM: Bearish.
TREND CONFIRMATION: Not established yet.
LITEB is showing significant volatility, but a strong rebound alone does not confirm a sustainable trend reversal.
The critical question is whether buyers can reclaim resistance and maintain momentum.
Don't confuse a temporary bounce with a confirmed trend change.
#LITEB #LITEBUSDT #Binance #TokenizedStocks #Lumentum
{spot}(LITEBUSDT)
$LITEB
🚨 LITEB/USDT: Powerful Recovery or Another Bearish Trap?
LITEB is attracting market attention as buying activity increases. But beneath the short-term recovery, the broader technical structure remains bearish.
📊 MARKET SNAPSHOT
- Reference Price: ~$594.93
- 24H Change: +13.95%
- 24H High: $616.97
- 24H Low: $521.47
- 7D Performance: -12.70%
- 30D Performance: -46.20%
📈 TECHNICAL MARKET STRUCTURE
Short-term momentum is attempting to recover, but the underlying Lumentum share remains below major moving averages.
Daily RSI: 37.4
4H RSI: 55.3
MACD: Bearish
Overall Trend: Bearish
🎯 KEY LEVELS
- Resistance 1: $629.20
- Resistance 2: $658.15
- Support 1: $586.80
- Support 2: $551.25
🟢 BULLISH TREND CONFIRMATION
A sustained daily close above $629.20, supported by stronger trading volume and a successful retest, would provide stronger evidence of a temporary bullish reversal.
🔴 BEARISH INVALIDATION
A daily close below $586.80 would weaken the recovery structure and increase the possibility of another downside move.
🔥 MY MARKET VERDICT
SHORT-TERM: Recovery attempt.
MEDIUM-TERM: Bearish.
TREND CONFIRMATION: Not established yet.
LITEB is showing significant volatility, but a strong rebound alone does not confirm a sustainable trend reversal.
The critical question is whether buyers can reclaim resistance and maintain momentum.
Don't confuse a temporary bounce with a confirmed trend change.
#LITEB #LITEBUSDT #Binance #TokenizedStocks #Lumentum
🚨 LITEB/USDT: Powerful Recovery or Another Bearish Trap?
LITEB is attracting market attention as buying activity increases. But beneath the short-term recovery, the broader technical structure remains bearish.
📊 MARKET SNAPSHOT
- Reference Price: ~$594.93
- 24H Change: +13.95%
- 24H High: $616.97
- 24H Low: $521.47
- 7D Performance: -12.70%
- 30D Performance: -46.20%
📈 TECHNICAL MARKET STRUCTURE
Short-term momentum is attempting to recover, but the underlying Lumentum share remains below major moving averages.
Daily RSI: 37.4
4H RSI: 55.3
MACD: Bearish
Overall Trend: Bearish
🎯 KEY LEVELS
- Resistance 1: $629.20
- Resistance 2: $658.15
- Support 1: $586.80
- Support 2: $551.25
🟢 BULLISH TREND CONFIRMATION
A sustained daily close above $629.20, supported by stronger trading volume and a successful retest, would provide stronger evidence of a temporary bullish reversal.
🔴 BEARISH INVALIDATION
A daily close below $586.80 would weaken the recovery structure and increase the possibility of another downside move.
🔥 MY MARKET VERDICT
SHORT-TERM: Recovery attempt.
MEDIUM-TERM: Bearish.
TREND CONFIRMATION: Not established yet.
LITEB is showing significant volatility, but a strong rebound alone does not confirm a sustainable trend reversal.
The critical question is whether buyers can reclaim resistance and maintain momentum.
Don't confuse a temporary bounce with a confirmed trend change.
#LITEB #LITEBUSDT #Binance #TokenizedStocks #Lumentum
58
$AMDB
🚨 AMDB/USDT: Strong Recovery or Just a Temporary Bounce?
AMDB is attracting attention after a significant recovery, but the bigger market structure tells a more cautious story.
📊 MARKET SNAPSHOT
- Reference Price: ~$503.82
- 24H Change: +8.06%
- 24H High: $515.48
- 24H Low: $463.01
- 24H Volume: ~$2.68M
📈 TECHNICAL STRUCTURE
AMDB has demonstrated strong short-term buying activity. However, its broader 20-day trend remains bearish, while its 7-day and 30-day performance also reflect underlying weakness.
🎯 KEY MARKET LEVELS
- Resistance: $515.48
- Reference Price: $503.82
- Support: $463.01
🟢 BULLISH CONFIRMATION
A sustained 4H candle close above $515.48, supported by increasing volume and a successful retest, would provide stronger evidence of a temporary bullish trend reversal.
🔴 BEARISH INVALIDATION
Failure to break resistance, followed by weakness below the $463 support area, could indicate that the recovery is losing strength.
🔥 MY MARKET VERDICT
SHORT-TERM: Bullish recovery attempt.
MEDIUM-TERM: Bearish structure remains.
TREND CONFIRMATION: Not yet established.
AMDB is showing interesting momentum, but one strong session does not erase a longer-term downtrend.
The next important development is whether buyers can establish acceptance above resistance.
⚡ Watch the confirmation, not just the percentage gain.
#AMDB #AMDBUSDT #Binance #TokenizedStocks #AMD
{spot}(AMDBUSDT)
$AMDB
🚨 AMDB/USDT: Strong Recovery or Just a Temporary Bounce?
AMDB is attracting attention after a significant recovery, but the bigger market structure tells a more cautious story.
📊 MARKET SNAPSHOT
- Reference Price: ~$503.82
- 24H Change: +8.06%
- 24H High: $515.48
- 24H Low: $463.01
- 24H Volume: ~$2.68M
📈 TECHNICAL STRUCTURE
AMDB has demonstrated strong short-term buying activity. However, its broader 20-day trend remains bearish, while its 7-day and 30-day performance also reflect underlying weakness.
🎯 KEY MARKET LEVELS
- Resistance: $515.48
- Reference Price: $503.82
- Support: $463.01
🟢 BULLISH CONFIRMATION
A sustained 4H candle close above $515.48, supported by increasing volume and a successful retest, would provide stronger evidence of a temporary bullish trend reversal.
🔴 BEARISH INVALIDATION
Failure to break resistance, followed by weakness below the $463 support area, could indicate that the recovery is losing strength.
🔥 MY MARKET VERDICT
SHORT-TERM: Bullish recovery attempt.
MEDIUM-TERM: Bearish structure remains.
TREND CONFIRMATION: Not yet established.
AMDB is showing interesting momentum, but one strong session does not erase a longer-term downtrend.
The next important development is whether buyers can establish acceptance above resistance.
⚡ Watch the confirmation, not just the percentage gain.
#AMDB #AMDBUSDT #Binance #TokenizedStocks #AMD
🚨 AMDB/USDT: Strong Recovery or Just a Temporary Bounce?
AMDB is attracting attention after a significant recovery, but the bigger market structure tells a more cautious story.
📊 MARKET SNAPSHOT
- Reference Price: ~$503.82
- 24H Change: +8.06%
- 24H High: $515.48
- 24H Low: $463.01
- 24H Volume: ~$2.68M
📈 TECHNICAL STRUCTURE
AMDB has demonstrated strong short-term buying activity. However, its broader 20-day trend remains bearish, while its 7-day and 30-day performance also reflect underlying weakness.
🎯 KEY MARKET LEVELS
- Resistance: $515.48
- Reference Price: $503.82
- Support: $463.01
🟢 BULLISH CONFIRMATION
A sustained 4H candle close above $515.48, supported by increasing volume and a successful retest, would provide stronger evidence of a temporary bullish trend reversal.
🔴 BEARISH INVALIDATION
Failure to break resistance, followed by weakness below the $463 support area, could indicate that the recovery is losing strength.
🔥 MY MARKET VERDICT
SHORT-TERM: Bullish recovery attempt.
MEDIUM-TERM: Bearish structure remains.
TREND CONFIRMATION: Not yet established.
AMDB is showing interesting momentum, but one strong session does not erase a longer-term downtrend.
The next important development is whether buyers can establish acceptance above resistance.
⚡ Watch the confirmation, not just the percentage gain.
#AMDB #AMDBUSDT #Binance #TokenizedStocks #AMD

93
$TST
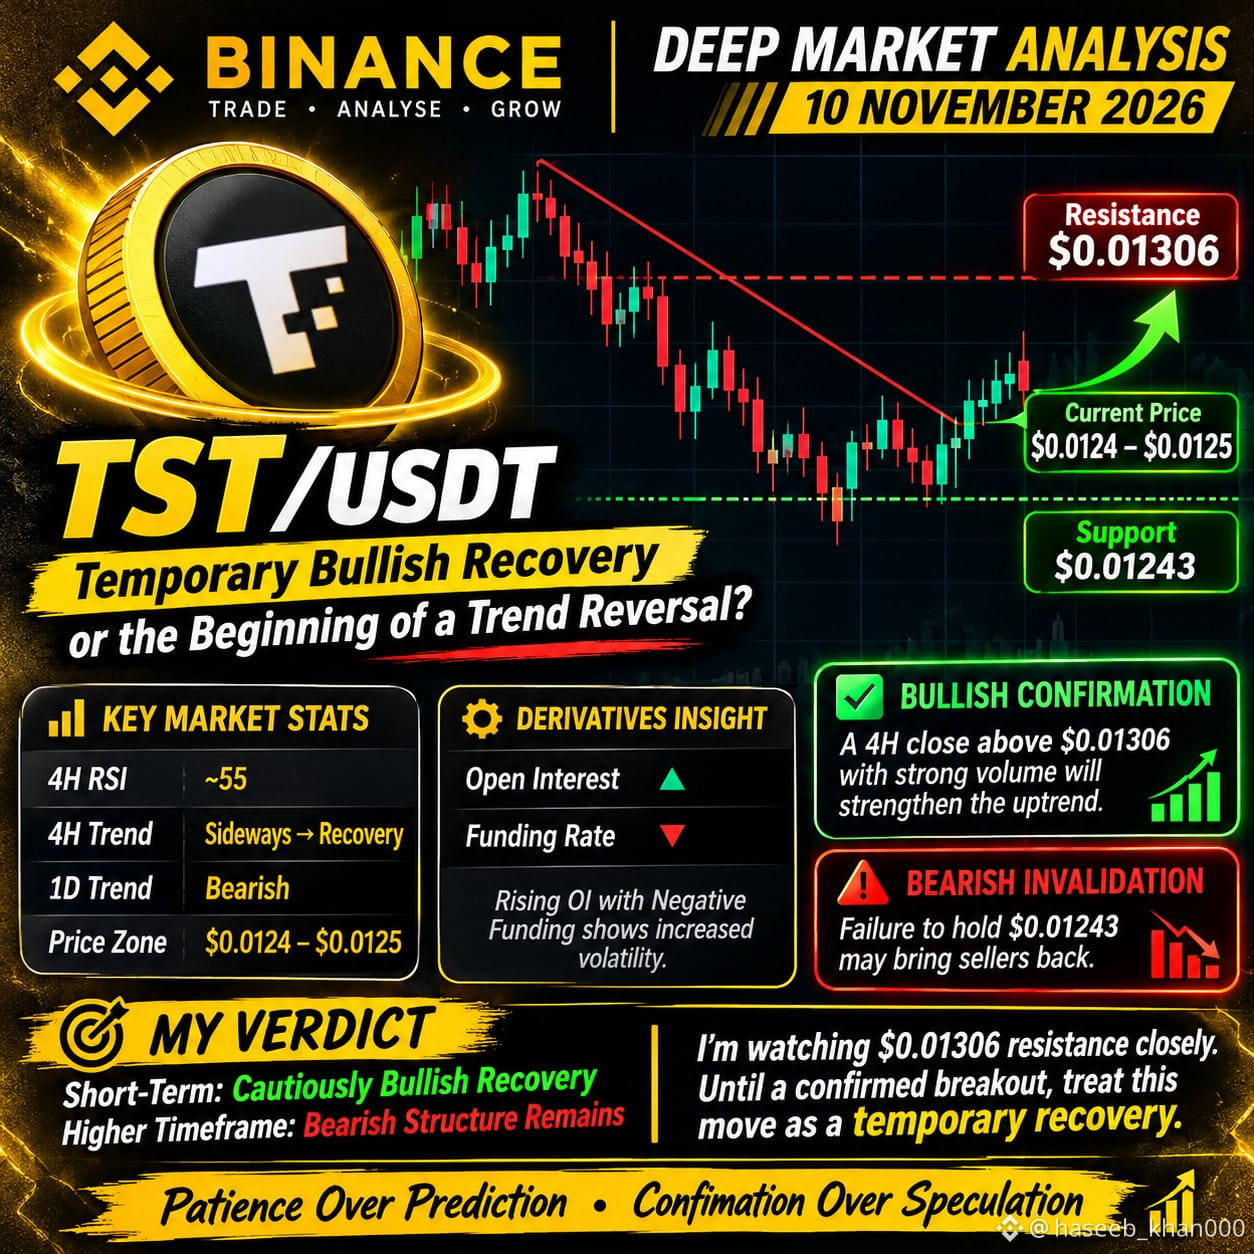
🚨 TST/USDT: Temporary Bullish Recovery or the Beginning of a Trend Reversal?
TST is showing improving short-term momentum, but the overall market structure still demands caution.
📊 MARKET STRUCTURE
- Price: ~$0.0124–$0.0125
- 4H RSI: ~55
- 4H momentum: Improving
- Daily trend: Bearish
- Short-term structure: Sideways to bullish recovery
🎯 KEY TECHNICAL LEVELS
- Support: $0.01243
- Resistance: $0.01306
📈 BULLISH CONFIRMATION
A sustained 4H candle close above $0.01306, accompanied by expanding volume, would strengthen the bullish continuation scenario.
⚠️ BEARISH INVALIDATION
Failure to hold the nearby support zone could weaken recovery momentum and bring sellers back into control.
🔍 DERIVATIVES INSIGHT
Open Interest has increased significantly, while funding remains negative. This suggests changing futures positioning and elevated volatility, not guaranteed bullish continuation.
MY MARKET VERDICT:
🟡 SHORT-TERM: Cautiously bullish recovery.
🔴 HIGHER-TIMEFRAME: Bearish structure remains intact.
I am watching the $0.01306 resistance closely. Until a convincing breakout is confirmed, this move should be treated as a temporary recovery rather than a confirmed trend reversal.
Patience over prediction. Confirmation over speculation.
#TST #TSTUSDT #Binance #BinanceSquare
{future}(TSTUSDT)
$TST
🚨 TST/USDT: Temporary Bullish Recovery or the Beginning of a Trend Reversal?
TST is showing improving short-term momentum, but the overall market structure still demands caution.
📊 MARKET STRUCTURE
- Price: ~$0.0124–$0.0125
- 4H RSI: ~55
- 4H momentum: Improving
- Daily trend: Bearish
- Short-term structure: Sideways to bullish recovery
🎯 KEY TECHNICAL LEVELS
- Support: $0.01243
- Resistance: $0.01306
📈 BULLISH CONFIRMATION
A sustained 4H candle close above $0.01306, accompanied by expanding volume, would strengthen the bullish continuation scenario.
⚠️ BEARISH INVALIDATION
Failure to hold the nearby support zone could weaken recovery momentum and bring sellers back into control.
🔍 DERIVATIVES INSIGHT
Open Interest has increased significantly, while funding remains negative. This suggests changing futures positioning and elevated volatility, not guaranteed bullish continuation.
MY MARKET VERDICT:
🟡 SHORT-TERM: Cautiously bullish recovery.
🔴 HIGHER-TIMEFRAME: Bearish structure remains intact.
I am watching the $0.01306 resistance closely. Until a convincing breakout is confirmed, this move should be treated as a temporary recovery rather than a confirmed trend reversal.
Patience over prediction. Confirmation over speculation.
#TST #TSTUSDT #Binance #BinanceSquare
🚨 TST/USDT: Temporary Bullish Recovery or the Beginning of a Trend Reversal?
TST is showing improving short-term momentum, but the overall market structure still demands caution.
📊 MARKET STRUCTURE
- Price: ~$0.0124–$0.0125
- 4H RSI: ~55
- 4H momentum: Improving
- Daily trend: Bearish
- Short-term structure: Sideways to bullish recovery
🎯 KEY TECHNICAL LEVELS
- Support: $0.01243
- Resistance: $0.01306
📈 BULLISH CONFIRMATION
A sustained 4H candle close above $0.01306, accompanied by expanding volume, would strengthen the bullish continuation scenario.
⚠️ BEARISH INVALIDATION
Failure to hold the nearby support zone could weaken recovery momentum and bring sellers back into control.
🔍 DERIVATIVES INSIGHT
Open Interest has increased significantly, while funding remains negative. This suggests changing futures positioning and elevated volatility, not guaranteed bullish continuation.
MY MARKET VERDICT:
🟡 SHORT-TERM: Cautiously bullish recovery.
🔴 HIGHER-TIMEFRAME: Bearish structure remains intact.
I am watching the $0.01306 resistance closely. Until a convincing breakout is confirmed, this move should be treated as a temporary recovery rather than a confirmed trend reversal.
Patience over prediction. Confirmation over speculation.
#TST #TSTUSDT #Binance #BinanceSquare
321
#BTCUSDT
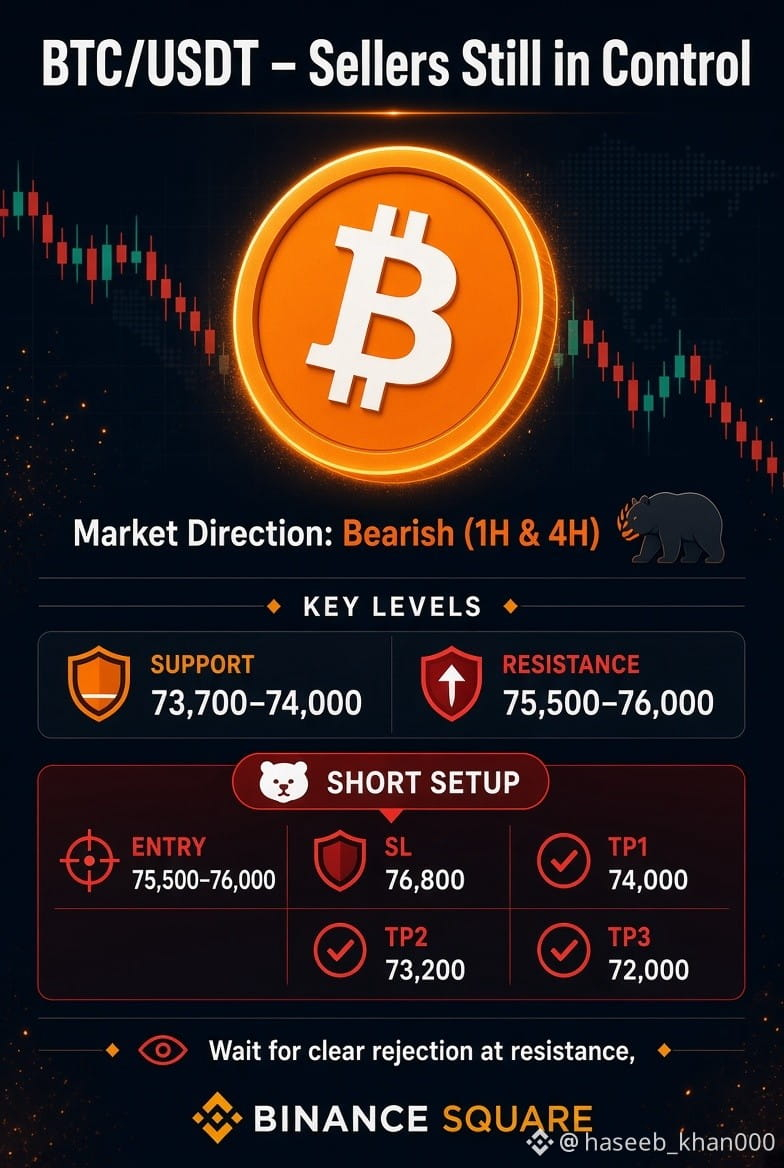
BTC/USDT Technical Analysis
Current Trend: BEARISH (short-term)
1H & 4H Direction:
Both timeframes are currently pointing lower. Price is trading below short-term EMAs, MACD remains negative on higher timeframes, and sellers maintain control. 4H shows stronger bearish pressure.
Key Levels:
Support: 73,700 – 74,000
Resistance: 75,500 – 76,000
RSI: Daily and 4H RSI are in the mid-30s (weak/bearish momentum zone). Not deeply oversold yet.
Stronger Side: Sellers currently have the upper hand on the 1H–4H structure.
Conditional Trading Setup
Direction: SHORT
Entry Zone: 75,500 – 76,000
(Look for rejection near this resistance cluster)
Stop Loss: 76,800
Take Profit Levels:
TP1: 74,000
TP2: 73,200
TP3: 72,000
Confirmation Required:
Clear rejection candle (wick rejection or bearish engulfing) on 1H or 4H at the 75,500–76,000 zone
Price fails to close above 76,000
Preferable if 4H RSI stays below 45
Risk-to-Reward: Approximately 1:1.8 to 1:2.4 (depending on exact entry)
Important Notes:
This is a conditional setup only. Do not enter if Bitcoin breaks and holds above 76,000–76,200 with strong volume. If price consolidates sideways without clear rejection, the better decision is to WAIT.
#BTC #Binance #BinanceSquare #Analsis
{future}(BTCUSDT)
#BTCUSDT
BTC/USDT Technical Analysis
Current Trend: BEARISH (short-term)
1H & 4H Direction:
Both timeframes are currently pointing lower. Price is trading below short-term EMAs, MACD remains negative on higher timeframes, and sellers maintain control. 4H shows stronger bearish pressure.
Key Levels:
Support: 73,700 – 74,000
Resistance: 75,500 – 76,000
RSI: Daily and 4H RSI are in the mid-30s (weak/bearish momentum zone). Not deeply oversold yet.
Stronger Side: Sellers currently have the upper hand on the 1H–4H structure.
Conditional Trading Setup
Direction: SHORT
Entry Zone: 75,500 – 76,000
(Look for rejection near this resistance cluster)
Stop Loss: 76,800
Take Profit Levels:
TP1: 74,000
TP2: 73,200
TP3: 72,000
Confirmation Required:
Clear rejection candle (wick rejection or bearish engulfing) on 1H or 4H at the 75,500–76,000 zone
Price fails to close above 76,000
Preferable if 4H RSI stays below 45
Risk-to-Reward: Approximately 1:1.8 to 1:2.4 (depending on exact entry)
Important Notes:
This is a conditional setup only. Do not enter if Bitcoin breaks and holds above 76,000–76,200 with strong volume. If price consolidates sideways without clear rejection, the better decision is to WAIT.
#BTC #Binance #BinanceSquare #Analsis
BTC/USDT Technical Analysis
Current Trend: BEARISH (short-term)
1H & 4H Direction:
Both timeframes are currently pointing lower. Price is trading below short-term EMAs, MACD remains negative on higher timeframes, and sellers maintain control. 4H shows stronger bearish pressure.
Key Levels:
Support: 73,700 – 74,000
Resistance: 75,500 – 76,000
RSI: Daily and 4H RSI are in the mid-30s (weak/bearish momentum zone). Not deeply oversold yet.
Stronger Side: Sellers currently have the upper hand on the 1H–4H structure.
Conditional Trading Setup
Direction: SHORT
Entry Zone: 75,500 – 76,000
(Look for rejection near this resistance cluster)
Stop Loss: 76,800
Take Profit Levels:
TP1: 74,000
TP2: 73,200
TP3: 72,000
Confirmation Required:
Clear rejection candle (wick rejection or bearish engulfing) on 1H or 4H at the 75,500–76,000 zone
Price fails to close above 76,000
Preferable if 4H RSI stays below 45
Risk-to-Reward: Approximately 1:1.8 to 1:2.4 (depending on exact entry)
Important Notes:
This is a conditional setup only. Do not enter if Bitcoin breaks and holds above 76,000–76,200 with strong volume. If price consolidates sideways without clear rejection, the better decision is to WAIT.
#BTC #Binance #BinanceSquare #Analsis
47
·
--
Bearish
$BTC
₿ BITCOIN AT A CRITICAL TURNING POINT — IS $70K NEXT?
Bitcoin is facing renewed selling pressure as market fear rises and institutional demand weakens.
The latest price action tells an interesting story: sellers remain in control on lower timeframes, but the bigger trend has not completely broken.
🔴 THE BEARISH TRIGGER: A confirmed breakdown below $73,959.
🟢 THE RECOVERY SIGNAL: Reclaiming $75,112, followed by $76,298.
⚠️ THE BIGGER PICTURE: Liquidations, ETF outflows and macro uncertainty are keeping market sentiment under pressure.
My market view: BEARISH IN THE SHORT TERM.
Bitcoin's next move around $74K could determine whether this is a temporary correction or another deeper decline.
Watch the levels. Respect the trend. Don't ignore confirmation.
#BTC #Binance #BitcoinAnalysis #MarketUpdate
{future}(BTCUSDT)
$BTC
₿ BITCOIN AT A CRITICAL TURNING POINT — IS $70K NEXT?
Bitcoin is facing renewed selling pressure as market fear rises and institutional demand weakens.
The latest price action tells an interesting story: sellers remain in control on lower timeframes, but the bigger trend has not completely broken.
🔴 THE BEARISH TRIGGER: A confirmed breakdown below $73,959.
🟢 THE RECOVERY SIGNAL: Reclaiming $75,112, followed by $76,298.
⚠️ THE BIGGER PICTURE: Liquidations, ETF outflows and macro uncertainty are keeping market sentiment under pressure.
My market view: BEARISH IN THE SHORT TERM.
Bitcoin's next move around $74K could determine whether this is a temporary correction or another deeper decline.
Watch the levels. Respect the trend. Don't ignore confirmation.
#BTC #Binance #BitcoinAnalysis #MarketUpdate
₿ BITCOIN AT A CRITICAL TURNING POINT — IS $70K NEXT?
Bitcoin is facing renewed selling pressure as market fear rises and institutional demand weakens.
The latest price action tells an interesting story: sellers remain in control on lower timeframes, but the bigger trend has not completely broken.
🔴 THE BEARISH TRIGGER: A confirmed breakdown below $73,959.
🟢 THE RECOVERY SIGNAL: Reclaiming $75,112, followed by $76,298.
⚠️ THE BIGGER PICTURE: Liquidations, ETF outflows and macro uncertainty are keeping market sentiment under pressure.
My market view: BEARISH IN THE SHORT TERM.
Bitcoin's next move around $74K could determine whether this is a temporary correction or another deeper decline.
Watch the levels. Respect the trend. Don't ignore confirmation.
#BTC #Binance #BitcoinAnalysis #MarketUpdate

55
·
--
Bearish
$BNB
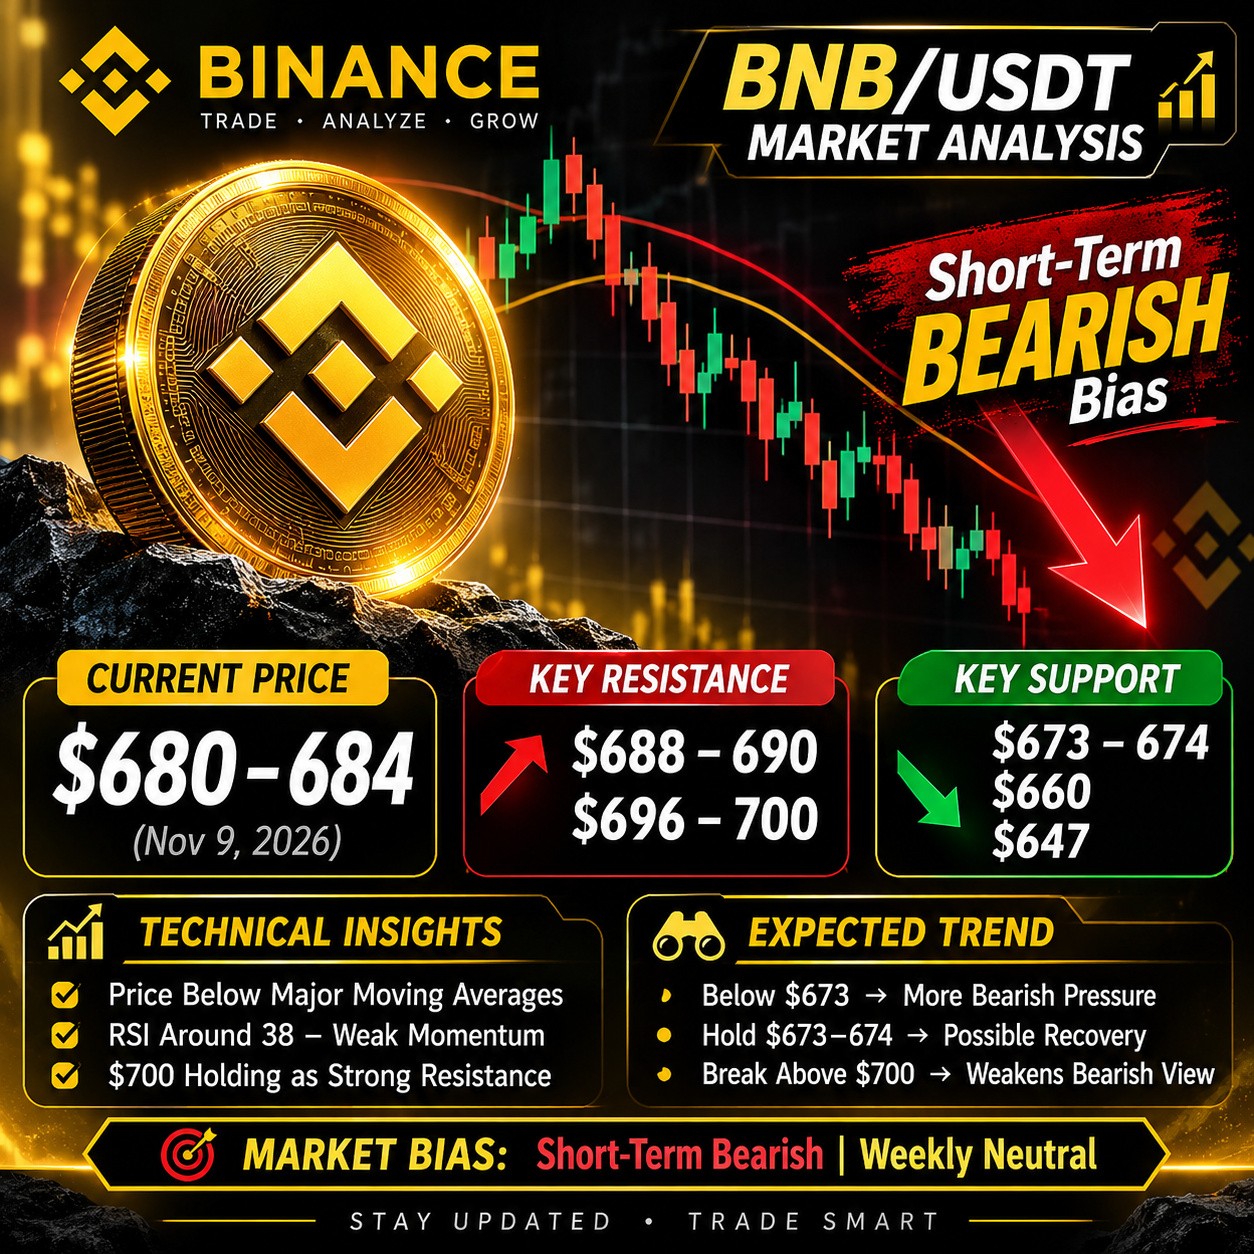
📉 BNB/USDT: Bearish Pressure Builds as $700 Resistance Holds
BNB is showing weakening momentum, with price struggling below the $700 psychological resistance.
Technical indicators suggest short-term bearish pressure, while broader market weakness continues to influence sentiment.
🔴 Key Resistance: $688–690 | $696–700
🟢 Key Support: $673–674 | $660
A breakdown below $673 could expose lower support zones, while a sustained recovery above $700 may invalidate the immediate bearish outlook.
Market Bias: Short-term Bearish | Weekly Neutral
The next decisive move will depend on support confirmation and broader BTC market direction.
#BNBUSDT #Binance #CryptoAnalysis #TechnicalAnalysis #BearishTrend
{future}(BNBUSDT)
$BNB
📉 BNB/USDT: Bearish Pressure Builds as $700 Resistance Holds
BNB is showing weakening momentum, with price struggling below the $700 psychological resistance.
Technical indicators suggest short-term bearish pressure, while broader market weakness continues to influence sentiment.
🔴 Key Resistance: $688–690 | $696–700
🟢 Key Support: $673–674 | $660
A breakdown below $673 could expose lower support zones, while a sustained recovery above $700 may invalidate the immediate bearish outlook.
Market Bias: Short-term Bearish | Weekly Neutral
The next decisive move will depend on support confirmation and broader BTC market direction.
#BNBUSDT #Binance #CryptoAnalysis #TechnicalAnalysis #BearishTrend
📉 BNB/USDT: Bearish Pressure Builds as $700 Resistance Holds
BNB is showing weakening momentum, with price struggling below the $700 psychological resistance.
Technical indicators suggest short-term bearish pressure, while broader market weakness continues to influence sentiment.
🔴 Key Resistance: $688–690 | $696–700
🟢 Key Support: $673–674 | $660
A breakdown below $673 could expose lower support zones, while a sustained recovery above $700 may invalidate the immediate bearish outlook.
Market Bias: Short-term Bearish | Weekly Neutral
The next decisive move will depend on support confirmation and broader BTC market direction.
#BNBUSDT #Binance #CryptoAnalysis #TechnicalAnalysis #BearishTrend
72
$BNB
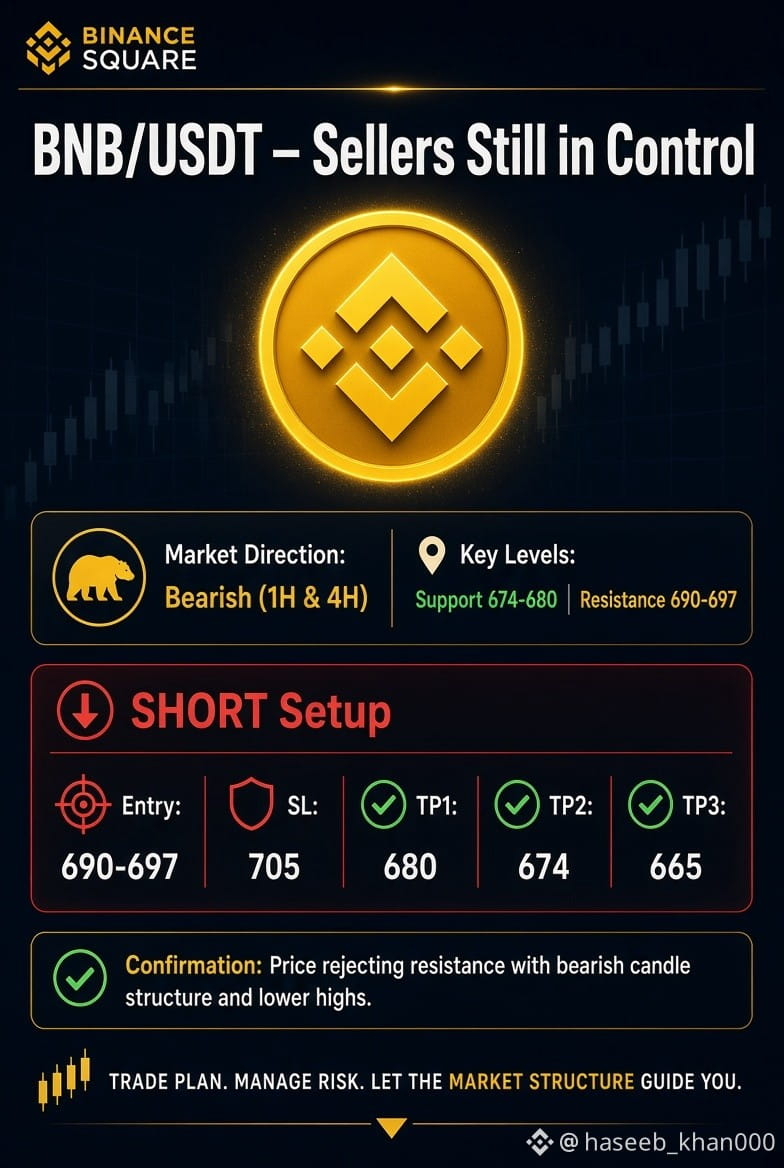
BNB/USDT – Sellers Still in Control
BNB remains under pressure on the lower timeframes.
Both the 1H and 4H charts are leaning bearish, with price trading below short-term moving averages and momentum still favoring the sellers.
Key Levels to Watch:
Support: 674 – 680
Resistance: 690 – 697
Conditional Short Setup
Entry Zone: 690 – 697
Stop Loss: 705
Targets:
TP1: 680
TP2: 674
TP3: 665
What to Wait For:
Look for a clear rejection (wick rejection or bearish candle) on the 1H or 4H timeframe inside the 690–697 zone. Price should fail to close above 697. Ideally, RSI stays below 50 on the 4H.
This is a conditional setup only. If price breaks and holds above 697–700 with strength, the short idea is invalid. No trade is forced — wait for confirmation.
{future}(BNBUSDT)
Would you take the short here, or are you waiting for a deeper pullback first? Drop your view below.
#BNB #BNBUSDT #BinanceSquare
$BNB
BNB/USDT – Sellers Still in Control
BNB remains under pressure on the lower timeframes.
Both the 1H and 4H charts are leaning bearish, with price trading below short-term moving averages and momentum still favoring the sellers.
Key Levels to Watch:
Support: 674 – 680
Resistance: 690 – 697
Conditional Short Setup
Entry Zone: 690 – 697
Stop Loss: 705
Targets:
TP1: 680
TP2: 674
TP3: 665
What to Wait For:
Look for a clear rejection (wick rejection or bearish candle) on the 1H or 4H timeframe inside the 690–697 zone. Price should fail to close above 697. Ideally, RSI stays below 50 on the 4H.
This is a conditional setup only. If price breaks and holds above 697–700 with strength, the short idea is invalid. No trade is forced — wait for confirmation.
Would you take the short here, or are you waiting for a deeper pullback first? Drop your view below.
#BNB #BNBUSDT #BinanceSquare
BNB/USDT – Sellers Still in Control
BNB remains under pressure on the lower timeframes.
Both the 1H and 4H charts are leaning bearish, with price trading below short-term moving averages and momentum still favoring the sellers.
Key Levels to Watch:
Support: 674 – 680
Resistance: 690 – 697
Conditional Short Setup
Entry Zone: 690 – 697
Stop Loss: 705
Targets:
TP1: 680
TP2: 674
TP3: 665
What to Wait For:
Look for a clear rejection (wick rejection or bearish candle) on the 1H or 4H timeframe inside the 690–697 zone. Price should fail to close above 697. Ideally, RSI stays below 50 on the 4H.
This is a conditional setup only. If price breaks and holds above 697–700 with strength, the short idea is invalid. No trade is forced — wait for confirmation.
Would you take the short here, or are you waiting for a deeper pullback first? Drop your view below.
#BNB #BNBUSDT #BinanceSquare
103
$ONE
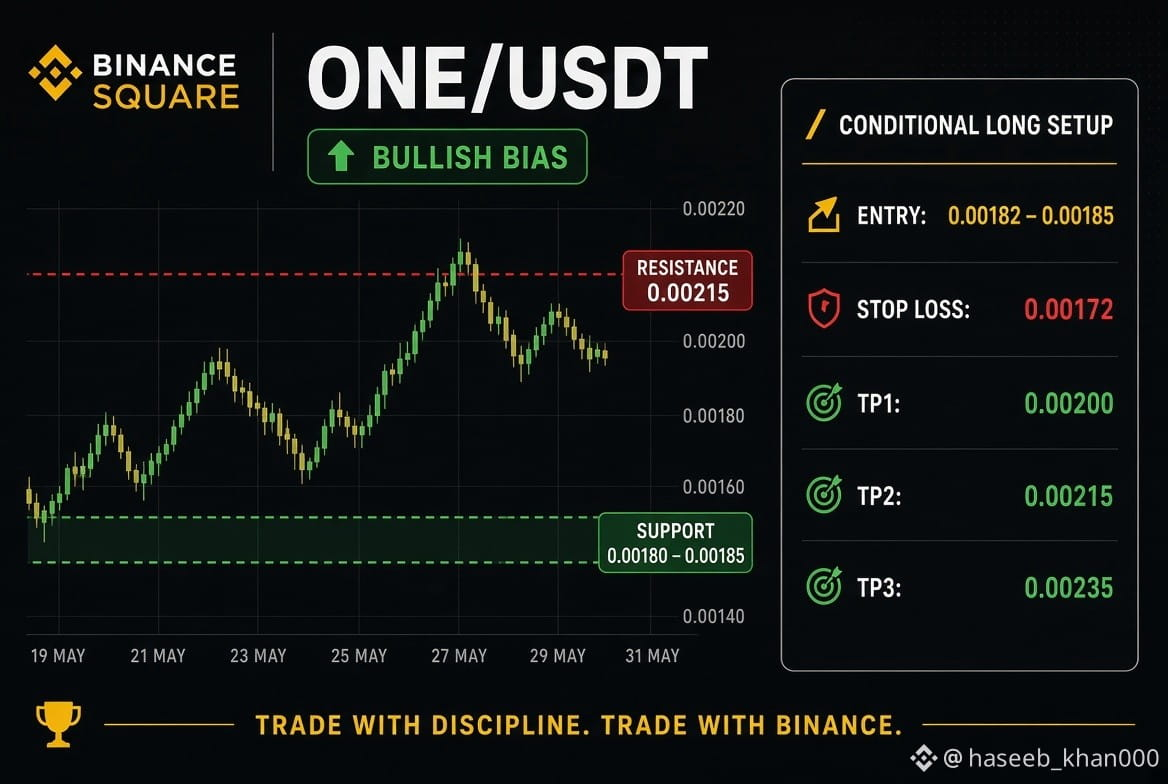
ONE/USDT – Pullback Inside Uptrend
Price is cooling after a strong rally and currently trading near 0.00188.
Higher timeframes still look constructive, but short-term sellers are in control of the pullback.
Key Levels
Support: 0.00180 – 0.00185
Resistance: 0.00215
Conditional Long Setup
Entry: 0.00182 – 0.00185
Stop Loss: 0.00172
TP1: 0.00200
TP2: 0.00215
TP3: 0.00235
What to wait for
Do not chase.
Wait for a clear rejection from the 0.00180–0.00185 support zone with rising volume on the 1H/4H.
No confirmation = no trade.
Will buyers defend this support or will sellers push lower?
Share your view below 👇
#ONE #ONEUSDT #CryptoAnalysis
{future}(ONEUSDT)
#BinanceSquare
$ONE
ONE/USDT – Pullback Inside Uptrend
Price is cooling after a strong rally and currently trading near 0.00188.
Higher timeframes still look constructive, but short-term sellers are in control of the pullback.
Key Levels
Support: 0.00180 – 0.00185
Resistance: 0.00215
Conditional Long Setup
Entry: 0.00182 – 0.00185
Stop Loss: 0.00172
TP1: 0.00200
TP2: 0.00215
TP3: 0.00235
What to wait for
Do not chase.
Wait for a clear rejection from the 0.00180–0.00185 support zone with rising volume on the 1H/4H.
No confirmation = no trade.
Will buyers defend this support or will sellers push lower?
Share your view below 👇
#ONE #ONEUSDT #CryptoAnalysis
#BinanceSquare
ONE/USDT – Pullback Inside Uptrend
Price is cooling after a strong rally and currently trading near 0.00188.
Higher timeframes still look constructive, but short-term sellers are in control of the pullback.
Key Levels
Support: 0.00180 – 0.00185
Resistance: 0.00215
Conditional Long Setup
Entry: 0.00182 – 0.00185
Stop Loss: 0.00172
TP1: 0.00200
TP2: 0.00215
TP3: 0.00235
What to wait for
Do not chase.
Wait for a clear rejection from the 0.00180–0.00185 support zone with rising volume on the 1H/4H.
No confirmation = no trade.
Will buyers defend this support or will sellers push lower?
Share your view below 👇
#ONE #ONEUSDT #CryptoAnalysis
#BinanceSquare
407
$DOGS
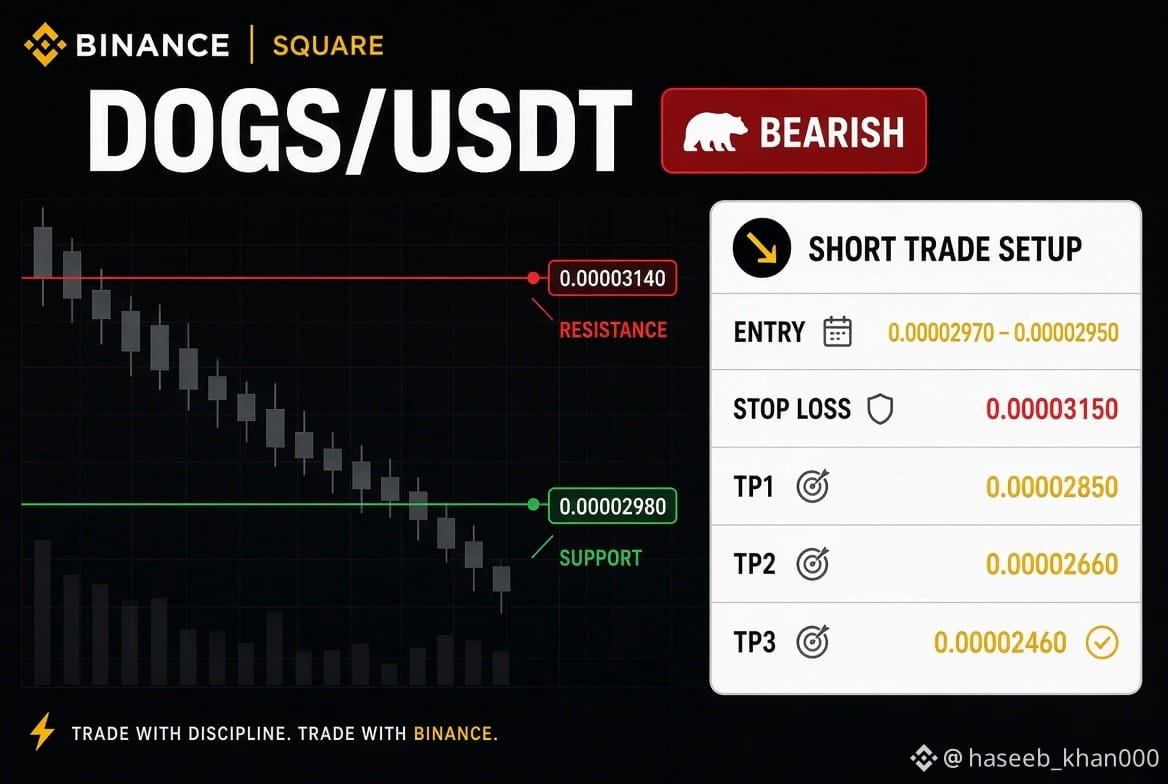
DOGS/USDT – Sellers Still in Control
Price is trading near 0.000030 with a clear bearish bias on both 1H and 4H charts.
Higher timeframes remain aligned to the downside. Sellers currently hold the stronger hand.
Key Levels
Support: 0.00002980 ✊
Resistance: 0.00003140 📈
Conditional Short Setup
Entry zone: 0.00002970 – 0.00002950
Stop Loss: 0.00003150
TP1: 0.00002850
TP2: 0.00002660
TP3: 0.00002460
What to wait for
Do not enter yet.
Wait for a clean 1H close below 0.00002980 with rising sell volume.
Avoid the trade if price shows strong rejection or reclaims resistance.
This is a conditional setup only. Manage risk carefully and never risk more than you can afford to lose.
Will DOGS break the support or bounce from here?
Drop your view in the comments 👇
#DOGS #DOGSUSDT #BinanceSquare
{future}(DOGSUSDT)
$DOGS
DOGS/USDT – Sellers Still in Control
Price is trading near 0.000030 with a clear bearish bias on both 1H and 4H charts.
Higher timeframes remain aligned to the downside. Sellers currently hold the stronger hand.
Key Levels
Support: 0.00002980 ✊
Resistance: 0.00003140 📈
Conditional Short Setup
Entry zone: 0.00002970 – 0.00002950
Stop Loss: 0.00003150
TP1: 0.00002850
TP2: 0.00002660
TP3: 0.00002460
What to wait for
Do not enter yet.
Wait for a clean 1H close below 0.00002980 with rising sell volume.
Avoid the trade if price shows strong rejection or reclaims resistance.
This is a conditional setup only. Manage risk carefully and never risk more than you can afford to lose.
Will DOGS break the support or bounce from here?
Drop your view in the comments 👇
#DOGS #DOGSUSDT #BinanceSquare
DOGS/USDT – Sellers Still in Control
Price is trading near 0.000030 with a clear bearish bias on both 1H and 4H charts.
Higher timeframes remain aligned to the downside. Sellers currently hold the stronger hand.
Key Levels
Support: 0.00002980 ✊
Resistance: 0.00003140 📈
Conditional Short Setup
Entry zone: 0.00002970 – 0.00002950
Stop Loss: 0.00003150
TP1: 0.00002850
TP2: 0.00002660
TP3: 0.00002460
What to wait for
Do not enter yet.
Wait for a clean 1H close below 0.00002980 with rising sell volume.
Avoid the trade if price shows strong rejection or reclaims resistance.
This is a conditional setup only. Manage risk carefully and never risk more than you can afford to lose.
Will DOGS break the support or bounce from here?
Drop your view in the comments 👇
#DOGS #DOGSUSDT #BinanceSquare
279
$PYTH
⚡ PYTH ($PYTH): Critical Support Under Pressure — Is a Rebound Coming?
$PYTH is trading near $0.0631, down approximately 2.3% over 24 hours. Sellers remain active as broader altcoin weakness puts pressure on the oracle sector.
📊 Market Snapshot
- Price: $0.0631
- 24H Change: -2.3%
- 24H High: $0.0650
- 24H Low: $0.0630
- Market Cap: ~$497M
- 24H Volume: ~$8.9M (aggregated market data)
📉 Technical Outlook
- Support: $0.0630 / $0.0580
- Resistance: $0.0680 / $0.0700
- Losing $0.0630 could increase downside pressure.
- Reclaiming $0.0680 may improve bullish momentum.
🔥 Futures Insights: Binance USDT perpetual Open Interest stands near $6.3M, up 1.9% despite falling prices. Funding is positive at 0.005% per period, meaning longs are paying shorts. This suggests leveraged positioning remains active.
🌐 Market Catalyst: No major PYTH-specific catalyst was verified in the latest 24-hour news. Broader altcoin weakness and reduced risk appetite appear to be driving sentiment.
🎯 Short-Term Outlook: Cautiously bearish below $0.0680. A sustained hold above $0.0630 could support consolidation and a potential recovery attempt.
Final Takeaway: $PYTH remains an important oracle-sector project, but market structure must improve before a convincing bullish reversal can be confirmed.
{future}(PYTHUSDT)
#PYTH #CryptoAnalysis #BinanceSquare
$PYTH
⚡ PYTH ($PYTH ): Critical Support Under Pressure — Is a Rebound Coming?
$PYTH is trading near $0.0631, down approximately 2.3% over 24 hours. Sellers remain active as broader altcoin weakness puts pressure on the oracle sector.
📊 Market Snapshot
- Price: $0.0631
- 24H Change: -2.3%
- 24H High: $0.0650
- 24H Low: $0.0630
- Market Cap: ~$497M
- 24H Volume: ~$8.9M (aggregated market data)
📉 Technical Outlook
- Support: $0.0630 / $0.0580
- Resistance: $0.0680 / $0.0700
- Losing $0.0630 could increase downside pressure.
- Reclaiming $0.0680 may improve bullish momentum.
🔥 Futures Insights: Binance USDT perpetual Open Interest stands near $6.3M, up 1.9% despite falling prices. Funding is positive at 0.005% per period, meaning longs are paying shorts. This suggests leveraged positioning remains active.
🌐 Market Catalyst: No major PYTH-specific catalyst was verified in the latest 24-hour news. Broader altcoin weakness and reduced risk appetite appear to be driving sentiment.
🎯 Short-Term Outlook: Cautiously bearish below $0.0680. A sustained hold above $0.0630 could support consolidation and a potential recovery attempt.
Final Takeaway: $PYTH remains an important oracle-sector project, but market structure must improve before a convincing bullish reversal can be confirmed.
#PYTH #CryptoAnalysis #BinanceSquare
⚡ PYTH ($PYTH ): Critical Support Under Pressure — Is a Rebound Coming?
$PYTH is trading near $0.0631, down approximately 2.3% over 24 hours. Sellers remain active as broader altcoin weakness puts pressure on the oracle sector.
📊 Market Snapshot
- Price: $0.0631
- 24H Change: -2.3%
- 24H High: $0.0650
- 24H Low: $0.0630
- Market Cap: ~$497M
- 24H Volume: ~$8.9M (aggregated market data)
📉 Technical Outlook
- Support: $0.0630 / $0.0580
- Resistance: $0.0680 / $0.0700
- Losing $0.0630 could increase downside pressure.
- Reclaiming $0.0680 may improve bullish momentum.
🔥 Futures Insights: Binance USDT perpetual Open Interest stands near $6.3M, up 1.9% despite falling prices. Funding is positive at 0.005% per period, meaning longs are paying shorts. This suggests leveraged positioning remains active.
🌐 Market Catalyst: No major PYTH-specific catalyst was verified in the latest 24-hour news. Broader altcoin weakness and reduced risk appetite appear to be driving sentiment.
🎯 Short-Term Outlook: Cautiously bearish below $0.0680. A sustained hold above $0.0630 could support consolidation and a potential recovery attempt.
Final Takeaway: $PYTH remains an important oracle-sector project, but market structure must improve before a convincing bullish reversal can be confirmed.
#PYTH #CryptoAnalysis #BinanceSquare
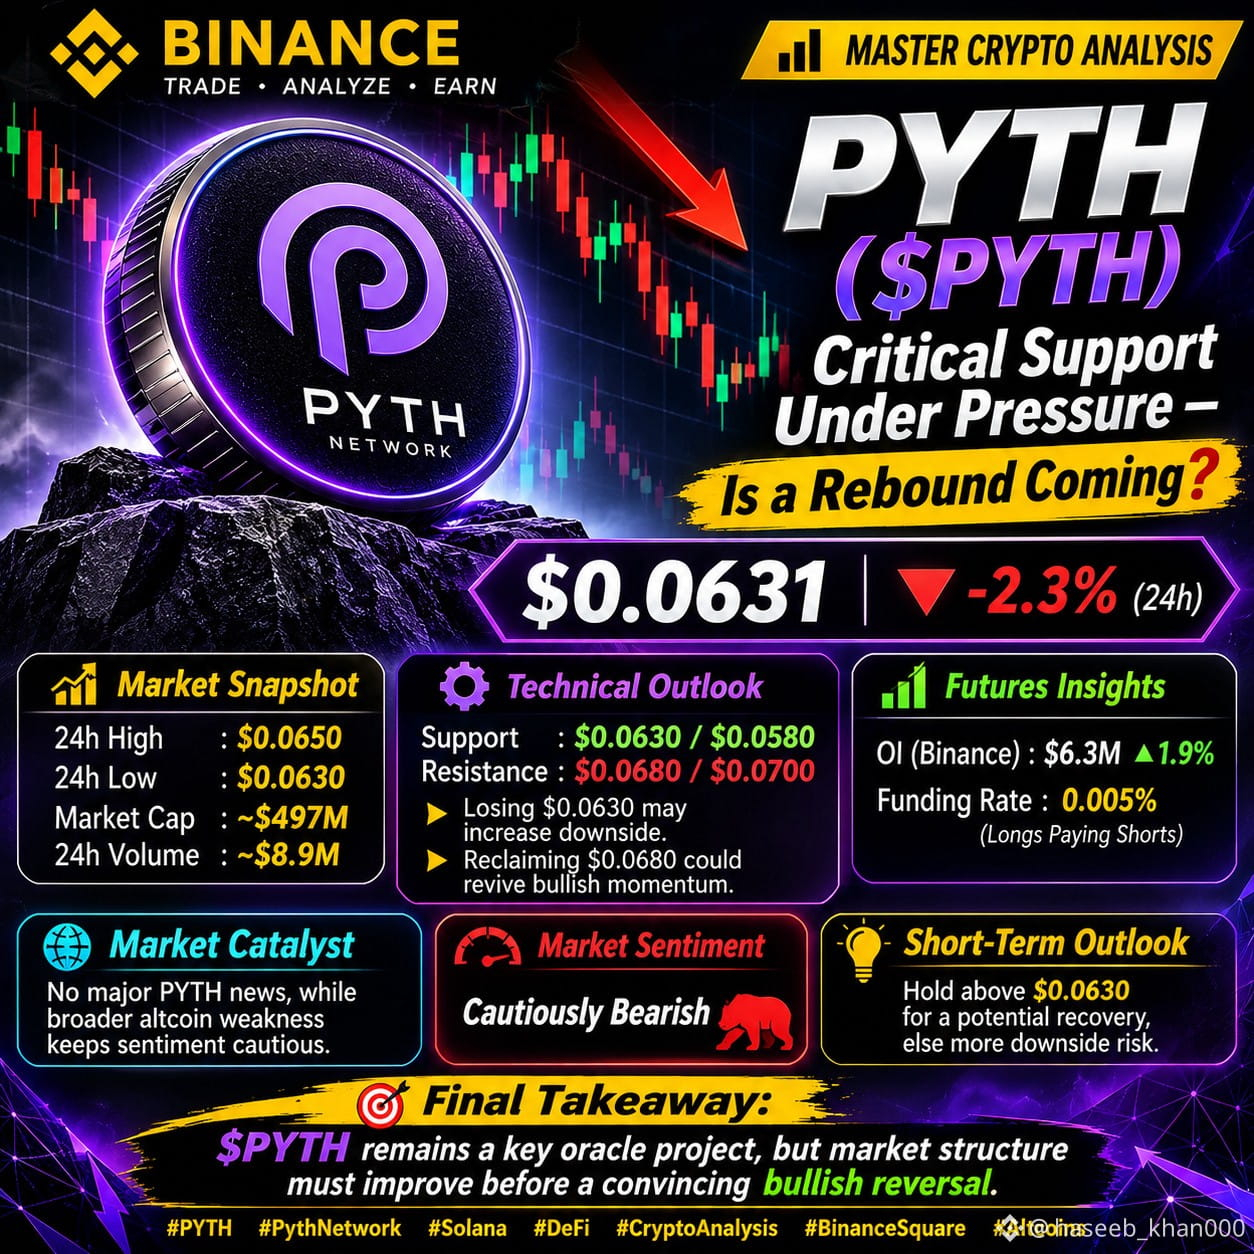
460
Log in to explore more content
Join global crypto users on Binance Square
⚡️ Get latest and useful information about crypto.
💬 Trusted by the world’s largest crypto exchange.
👍 Discover real insights from verified creators.
Email / Phone number
Trending Topics
NvidiaBeatsEstimatesWith$130BQ4Outlook
43,333 views
257 Discussing
Nvidia Beats With $115.8 Billion in Revenue, Guides to $130 Billion and Adds $150 Billion Buyback
Binance News
·71 Likes
·48.2k views
AnthropicIPOPriceCouldExceed$80
46,127 views
225 Discussing
RussiaCentralBankAddsAlfaBankToCryptoExchangeRegister
2,084 views
35 Discussing