

#bitcoinspotetfs$2.39bweeklynetinflow
bitcoinspotetfs$2.39bweeklynetinflow
Hot
Latest

·
--
Bearish
$BTC
{future}(BTCUSDT)
🚨U.S.🇺🇸 spot #Bitcoin ETFs drew about $2.39 billion in net inflows during the week ended Sep. 25.The 4-hour Supertrend remained bearish near $85,087, while ADX stood at 14.74.#BitcoinSpotETFs$2.39BWeeklyNetInflow
$BTC
🚨U.S.🇺🇸 spot #Bitcoin ETFs drew about $2.39 billion in net inflows during the week ended Sep. 25.The 4-hour Supertrend remained bearish near $85,087, while ADX stood at 14.74.#BitcoinSpotETFs$2.39BWeeklyNetInflow
🚨U.S.🇺🇸 spot #Bitcoin ETFs drew about $2.39 billion in net inflows during the week ended Sep. 25.The 4-hour Supertrend remained bearish near $85,087, while ADX stood at 14.74.#BitcoinSpotETFs$2.39BWeeklyNetInflow

20

·
--

Article
Finally to the moon!$BTC finally did what traders have been waiting for - a broke out.
After sideway swing around $76k 2 weeks ago, $BTC grinded through $84k and tagged @ $87,374, highest since late January. That's a whooping $10k+ move, up to 45% from June when it was ranging around $63k.
U.S. spot Bitcoin ETFs went from outflows on Sept 15-16 to over $2 billion of inflows on Sept 18, 21, and 22, with one day alone hitting $998M. Last week totaled $2.39B - the biggest week since October 2025.
When $83k resistance was tested, people on short were forced to panic a $770M liquidations happened within 24 hours that accounted to about 89% in shorts. September kept the promise as earlier predicted by the bulls - $87k printed successfully.
Now, the big boy's sleeping around $84k while things cool down on exchanges but one thing is probable - $90k is within reach and October will prove it. Whales aren't sleeping in their game either, less supply of $BTC on exchanges mean everything for the bulls here. The rejection at $87k is normal and the plan for the next breakout is taking shape as all eyes on $100k seemingly not a fake out but a breakout.
{future}(BTCUSDT)
Do you think $BTC is gonna Hit 100k this coming October?
Leave a comment 👇
#BTCBullish #BitcoinSpotETFs$2.39BWeeklyNetInflow
Finally to the moon!
$BTC finally did what traders have been waiting for - a broke out.
After sideway swing around $76k 2 weeks ago, $BTC grinded through $84k and tagged @ $87,374, highest since late January. That's a whooping $10k+ move, up to 45% from June when it was ranging around $63k.
U.S. spot Bitcoin ETFs went from outflows on Sept 15-16 to over $2 billion of inflows on Sept 18, 21, and 22, with one day alone hitting $998M. Last week totaled $2.39B - the biggest week since October 2025.
When $83k resistance was tested, people on short were forced to panic a $770M liquidations happened within 24 hours that accounted to about 89% in shorts. September kept the promise as earlier predicted by the bulls - $87k printed successfully.
Now, the big boy's sleeping around $84k while things cool down on exchanges but one thing is probable - $90k is within reach and October will prove it. Whales aren't sleeping in their game either, less supply of $BTC on exchanges mean everything for the bulls here. The rejection at $87k is normal and the plan for the next breakout is taking shape as all eyes on $100k seemingly not a fake out but a breakout.
Do you think $BTC is gonna Hit 100k this coming October?
Leave a comment 👇
#BTCBullish #BitcoinSpotETFs$2.39BWeeklyNetInflow
After sideway swing around $76k 2 weeks ago, $BTC grinded through $84k and tagged @ $87,374, highest since late January. That's a whooping $10k+ move, up to 45% from June when it was ranging around $63k.
U.S. spot Bitcoin ETFs went from outflows on Sept 15-16 to over $2 billion of inflows on Sept 18, 21, and 22, with one day alone hitting $998M. Last week totaled $2.39B - the biggest week since October 2025.
When $83k resistance was tested, people on short were forced to panic a $770M liquidations happened within 24 hours that accounted to about 89% in shorts. September kept the promise as earlier predicted by the bulls - $87k printed successfully.
Now, the big boy's sleeping around $84k while things cool down on exchanges but one thing is probable - $90k is within reach and October will prove it. Whales aren't sleeping in their game either, less supply of $BTC on exchanges mean everything for the bulls here. The rejection at $87k is normal and the plan for the next breakout is taking shape as all eyes on $100k seemingly not a fake out but a breakout.
Do you think $BTC is gonna Hit 100k this coming October?
Leave a comment 👇
#BTCBullish #BitcoinSpotETFs$2.39BWeeklyNetInflow
92


Article
Bitcoin Price Prediction for October: Defying History, But One $4.35B Risk Looming LargeThe cryptocurrency market is defying all historical expectations as we enter October. Traditionally known as a "red" month where digital assets face heavy seasonal slumps, this September turned completely on its head.
Bitcoin closed the month on a highly bullish note, entering October trading roughly 9% above its close on the day of the Federal Reserve’s interest rate hike. Despite macro tightening headwinds, institutional demand has successfully flipped the script.
However, as the highly anticipated "Uptober" rally tries to kick into high gear, traders are eyeing a massive $4.35 billion options expiry that could temporarily cap Bitcoin's upside momentum.
Defying the Fed and Surging Yields
Usually, a hawkish Federal Reserve and climbing U.S. Treasury yields spell disaster for non-yielding speculative assets. Yet, Bitcoin has shown remarkable resilience.
The primary driver behind this sudden strength is an unprecedented wave of institutional accumulation. Spot Bitcoin ETFs recorded a massive $2.39 billion in weekly inflows right at the tail end of September, marking the highest single-week inflow in nearly a year. This heavy institutional buying wall has effectively absorbed selling pressure and protected Bitcoin's upward price trajectory.
The $4.35 Billion Friction Point
Despite the bullish structural setup, the immediate path upward faces a significant derivatives hurdle. A massive $4.35 billion options contract expiry is looming over the market.
When open interest reaches these extreme levels, it creates a powerful "max pain" gravitational pull on the spot price. Institutional market makers are forced to aggressively hedge their open positions, which often leads to heavy consolidation and short-term volatility.
For the "Uptober" rally to fully unlock its potential, buyers must definitively reclaim the $87,497 yearly opening baseline. Clearing this level will signal that the derivatives friction has passed and that the macro uptrend is ready to resume.
October Price Targets: The Three Scenarios
Based on current liquidity flows and technical structures, market analysts are eyeing three distinct paths for the remainder of the month:
The Bullish Case ($105,000 – $120,000): If Bitcoin successfully breaks through overhead resistance at $91,800 and moves past the options expiry without significant damage, a fast track toward the six-figure milestone becomes highly probable.The Base Case ($90,000 – $98,000): Steady ETF inflows are expected to balance out macroeconomic pressures, keeping Bitcoin in a controlled, upward-trending channel.The Bearish Case ($75,000 – $82,000): If macro tightening intensifies and spot prices slip beneath the crucial psychological support line of $82,744, we could see a deeper correction to flush out late leverage.
What are your thoughts, creators? Are we heading straight to $100k this Uptober, or will the options wall trigger a pullback first? Drop your analysis below!
Disclaimer: This post is for educational and informational purposes only and does not constitute financial advice.
#Write2Earn #USDTAdds845900HoldersInPast7Days #ChainlinkLaunchesCCIP2WithEnterpriseVerification #BTCFallsBelow$83000 #BitcoinSpotETFs$2.39BWeeklyNetInflow
Bitcoin Price Prediction for October: Defying History, But One $4.35B Risk Looming Large
The cryptocurrency market is defying all historical expectations as we enter October. Traditionally known as a "red" month where digital assets face heavy seasonal slumps, this September turned completely on its head.
Bitcoin closed the month on a highly bullish note, entering October trading roughly 9% above its close on the day of the Federal Reserve’s interest rate hike. Despite macro tightening headwinds, institutional demand has successfully flipped the script.
However, as the highly anticipated "Uptober" rally tries to kick into high gear, traders are eyeing a massive $4.35 billion options expiry that could temporarily cap Bitcoin's upside momentum.
Defying the Fed and Surging Yields
Usually, a hawkish Federal Reserve and climbing U.S. Treasury yields spell disaster for non-yielding speculative assets. Yet, Bitcoin has shown remarkable resilience.
The primary driver behind this sudden strength is an unprecedented wave of institutional accumulation. Spot Bitcoin ETFs recorded a massive $2.39 billion in weekly inflows right at the tail end of September, marking the highest single-week inflow in nearly a year. This heavy institutional buying wall has effectively absorbed selling pressure and protected Bitcoin's upward price trajectory.
The $4.35 Billion Friction Point
Despite the bullish structural setup, the immediate path upward faces a significant derivatives hurdle. A massive $4.35 billion options contract expiry is looming over the market.
When open interest reaches these extreme levels, it creates a powerful "max pain" gravitational pull on the spot price. Institutional market makers are forced to aggressively hedge their open positions, which often leads to heavy consolidation and short-term volatility.
For the "Uptober" rally to fully unlock its potential, buyers must definitively reclaim the $87,497 yearly opening baseline. Clearing this level will signal that the derivatives friction has passed and that the macro uptrend is ready to resume.
October Price Targets: The Three Scenarios
Based on current liquidity flows and technical structures, market analysts are eyeing three distinct paths for the remainder of the month:
The Bullish Case ($105,000 – $120,000): If Bitcoin successfully breaks through overhead resistance at $91,800 and moves past the options expiry without significant damage, a fast track toward the six-figure milestone becomes highly probable.The Base Case ($90,000 – $98,000): Steady ETF inflows are expected to balance out macroeconomic pressures, keeping Bitcoin in a controlled, upward-trending channel.The Bearish Case ($75,000 – $82,000): If macro tightening intensifies and spot prices slip beneath the crucial psychological support line of $82,744, we could see a deeper correction to flush out late leverage.
What are your thoughts, creators? Are we heading straight to $100k this Uptober, or will the options wall trigger a pullback first? Drop your analysis below!
Disclaimer: This post is for educational and informational purposes only and does not constitute financial advice.
#Write2Earn #USDTAdds845900HoldersInPast7Days #ChainlinkLaunchesCCIP2WithEnterpriseVerification #BTCFallsBelow$83000 #BitcoinSpotETFs$2.39BWeeklyNetInflow
Bitcoin closed the month on a highly bullish note, entering October trading roughly 9% above its close on the day of the Federal Reserve’s interest rate hike. Despite macro tightening headwinds, institutional demand has successfully flipped the script.
However, as the highly anticipated "Uptober" rally tries to kick into high gear, traders are eyeing a massive $4.35 billion options expiry that could temporarily cap Bitcoin's upside momentum.
Defying the Fed and Surging Yields
Usually, a hawkish Federal Reserve and climbing U.S. Treasury yields spell disaster for non-yielding speculative assets. Yet, Bitcoin has shown remarkable resilience.
The primary driver behind this sudden strength is an unprecedented wave of institutional accumulation. Spot Bitcoin ETFs recorded a massive $2.39 billion in weekly inflows right at the tail end of September, marking the highest single-week inflow in nearly a year. This heavy institutional buying wall has effectively absorbed selling pressure and protected Bitcoin's upward price trajectory.
The $4.35 Billion Friction Point
Despite the bullish structural setup, the immediate path upward faces a significant derivatives hurdle. A massive $4.35 billion options contract expiry is looming over the market.
When open interest reaches these extreme levels, it creates a powerful "max pain" gravitational pull on the spot price. Institutional market makers are forced to aggressively hedge their open positions, which often leads to heavy consolidation and short-term volatility.
For the "Uptober" rally to fully unlock its potential, buyers must definitively reclaim the $87,497 yearly opening baseline. Clearing this level will signal that the derivatives friction has passed and that the macro uptrend is ready to resume.
October Price Targets: The Three Scenarios
Based on current liquidity flows and technical structures, market analysts are eyeing three distinct paths for the remainder of the month:
The Bullish Case ($105,000 – $120,000): If Bitcoin successfully breaks through overhead resistance at $91,800 and moves past the options expiry without significant damage, a fast track toward the six-figure milestone becomes highly probable.The Base Case ($90,000 – $98,000): Steady ETF inflows are expected to balance out macroeconomic pressures, keeping Bitcoin in a controlled, upward-trending channel.The Bearish Case ($75,000 – $82,000): If macro tightening intensifies and spot prices slip beneath the crucial psychological support line of $82,744, we could see a deeper correction to flush out late leverage.
What are your thoughts, creators? Are we heading straight to $100k this Uptober, or will the options wall trigger a pullback first? Drop your analysis below!
Disclaimer: This post is for educational and informational purposes only and does not constitute financial advice.
#Write2Earn #USDTAdds845900HoldersInPast7Days #ChainlinkLaunchesCCIP2WithEnterpriseVerification #BTCFallsBelow$83000 #BitcoinSpotETFs$2.39BWeeklyNetInflow
167


·
--

Article
BITCOIN’S NEXT MOVE MAY DEPEND ON ONE KEY ZONEBitcoin is starting the week under pressure, but the bigger story is not the pullback — it is what happens around $82K–$84K.
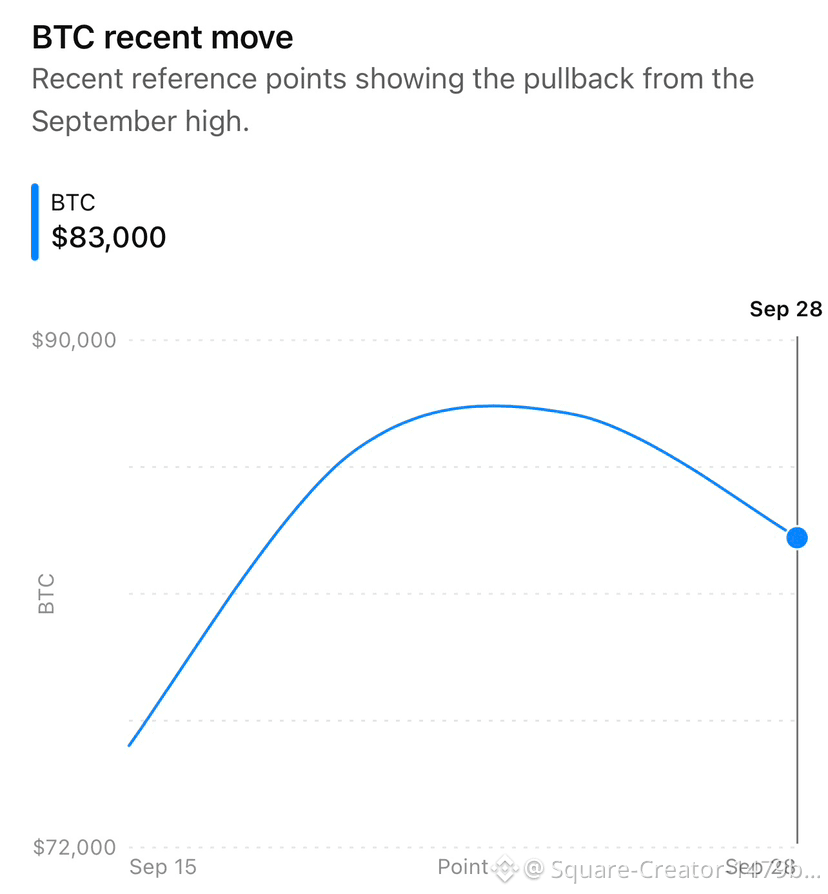
BTC recently pushed above $87,000, reaching an eight-month high, before falling back toward the $83K–$84K area. On September 28, Bitcoin was trading around $83K, with short-term selling pressure returning.
The interesting part is that institutional demand has not disappeared. U.S. spot Bitcoin ETFs recorded around $2.39 billion in net inflows during September 21–25, marking a very strong week for ETF demand.
📊 What the chart is saying
For short-term traders, $82K–$83K is an important area to watch.
If BTC holds this zone, buyers may try to push price back toward $85K, followed by the recent $87K–$87.4K resistance area.
If $82K breaks with strong selling volume, attention could shift toward the $80K area and lower support zones.
The market is also dealing with macro pressure and changing leverage, so a breakout without confirmation can quickly turn into another rejection.
Right now, Bitcoin looks less like a simple bullish-or-bearish story and more like a battle between strong ETF demand and short-term selling pressure.
The real question is: will BTC defend $82K and attempt another attack on $87K, or is this pullback only the beginning of a deeper correction?
#BitcoinSpotETFs$2.39BWeeklyNetInflow $BTC
{spot}(BTCUSDT)
BITCOIN’S NEXT MOVE MAY DEPEND ON ONE KEY ZONE
Bitcoin is starting the week under pressure, but the bigger story is not the pullback — it is what happens around $82K–$84K.
BTC recently pushed above $87,000, reaching an eight-month high, before falling back toward the $83K–$84K area. On September 28, Bitcoin was trading around $83K, with short-term selling pressure returning.
The interesting part is that institutional demand has not disappeared. U.S. spot Bitcoin ETFs recorded around $2.39 billion in net inflows during September 21–25, marking a very strong week for ETF demand.
📊 What the chart is saying
For short-term traders, $82K–$83K is an important area to watch.
If BTC holds this zone, buyers may try to push price back toward $85K, followed by the recent $87K–$87.4K resistance area.
If $82K breaks with strong selling volume, attention could shift toward the $80K area and lower support zones.
The market is also dealing with macro pressure and changing leverage, so a breakout without confirmation can quickly turn into another rejection.
Right now, Bitcoin looks less like a simple bullish-or-bearish story and more like a battle between strong ETF demand and short-term selling pressure.
The real question is: will BTC defend $82K and attempt another attack on $87K, or is this pullback only the beginning of a deeper correction?
#BitcoinSpotETFs$2.39BWeeklyNetInflow $BTC
BTC recently pushed above $87,000, reaching an eight-month high, before falling back toward the $83K–$84K area. On September 28, Bitcoin was trading around $83K, with short-term selling pressure returning.
The interesting part is that institutional demand has not disappeared. U.S. spot Bitcoin ETFs recorded around $2.39 billion in net inflows during September 21–25, marking a very strong week for ETF demand.
📊 What the chart is saying
For short-term traders, $82K–$83K is an important area to watch.
If BTC holds this zone, buyers may try to push price back toward $85K, followed by the recent $87K–$87.4K resistance area.
If $82K breaks with strong selling volume, attention could shift toward the $80K area and lower support zones.
The market is also dealing with macro pressure and changing leverage, so a breakout without confirmation can quickly turn into another rejection.
Right now, Bitcoin looks less like a simple bullish-or-bearish story and more like a battle between strong ETF demand and short-term selling pressure.
The real question is: will BTC defend $82K and attempt another attack on $87K, or is this pullback only the beginning of a deeper correction?
#BitcoinSpotETFs$2.39BWeeklyNetInflow $BTC
147

·
--
Bullish
#BitcoinSpotETFs$2.39BWeeklyNetInflow
🚨 Institutional Demand Skyrockets: Spot Bitcoin ETFs Log $2.39B Weekly Net Inflow! 🏦📈
Despite recent short-term price pullbacks and broad macroeconomic volatility, institutional investors are aggressively buying the dip! U.S. Spot Bitcoin ETFs recorded a massive $2.39 billion in net inflows over the past week—marking the single highest weekly inflow of 2026 and pushing total ETF asset holdings past $108 billion.
While retail market participants hesitate during short-term pullbacks toward the $82k–$83k range, Wall Street giants continue to accumulate aggressively, signaling strong long-term conviction! 💎🙌
📰 Key Inflow Highlights & Data Breakdown:
Leading the Charge: BlackRock's IBIT spearheaded the inflows with over $1.15 billion in net allocation, followed closely by Fidelity’s FBTC taking in ~$702 million.
Institutional Divergence: While short-term derivative traders face leverage liquidations, spot ETF investors recorded 5 consecutive days of net positive buying.
Broader Market Demand: The institutional accumulation spilled over into altcoin funds as well, with Spot Ethereum ETFs taking in $689 million and Solana funds drawing $188 million over the same period.
📊 Trade Signal & Setup
🪙 Key Context: Heavy spot ETF buying during local price weakness establishes a strong institutional demand floor. Watching for a classic higher-low rebound as leverage clears out.
$BTC
{future}(BTCUSDT)
📍 BTC/USDT (Institutional Support Rebound Setup)
🎯 Buy/Long Entry Zone: $82,000 – $83,200 (Key demand cluster & ETF cost-basis area)
🛑 Stop Loss: $80,500
🟢 Take Profit 1: $86,000
🟢 Take Profit 2: $88,500
🟢 Take Profit 3: $92,000
⚠️ Risk Level: Medium
$ETH
{future}(ETHUSDT)
📍 ETH/USDT (Sympathy ETF Inflow Play)
🎯 Buy/Long Entry Zone: $2,620 – $2,680
🛑 Stop Loss: $2,540
🟢 Take Profit 1: $2,820
🟢 Take Profit 2: $2,980
⚠️ Risk Level: Medium-High
🔥 #BTCFallsBelow$83000 #BTC #TradingSignals
#BitcoinSpotETFs$2.39BWeeklyNetInflow
🚨 Institutional Demand Skyrockets: Spot Bitcoin ETFs Log $2.39B Weekly Net Inflow! 🏦📈
Despite recent short-term price pullbacks and broad macroeconomic volatility, institutional investors are aggressively buying the dip! U.S. Spot Bitcoin ETFs recorded a massive $2.39 billion in net inflows over the past week—marking the single highest weekly inflow of 2026 and pushing total ETF asset holdings past $108 billion.
While retail market participants hesitate during short-term pullbacks toward the $82k–$83k range, Wall Street giants continue to accumulate aggressively, signaling strong long-term conviction! 💎🙌
📰 Key Inflow Highlights & Data Breakdown:
Leading the Charge: BlackRock's IBIT spearheaded the inflows with over $1.15 billion in net allocation, followed closely by Fidelity’s FBTC taking in ~$702 million.
Institutional Divergence: While short-term derivative traders face leverage liquidations, spot ETF investors recorded 5 consecutive days of net positive buying.
Broader Market Demand: The institutional accumulation spilled over into altcoin funds as well, with Spot Ethereum ETFs taking in $689 million and Solana funds drawing $188 million over the same period.
📊 Trade Signal & Setup
🪙 Key Context: Heavy spot ETF buying during local price weakness establishes a strong institutional demand floor. Watching for a classic higher-low rebound as leverage clears out.
$BTC
📍 BTC/USDT (Institutional Support Rebound Setup)
🎯 Buy/Long Entry Zone: $82,000 – $83,200 (Key demand cluster & ETF cost-basis area)
🛑 Stop Loss: $80,500
🟢 Take Profit 1: $86,000
🟢 Take Profit 2: $88,500
🟢 Take Profit 3: $92,000
⚠️ Risk Level: Medium
$ETH
📍 ETH/USDT (Sympathy ETF Inflow Play)
🎯 Buy/Long Entry Zone: $2,620 – $2,680
🛑 Stop Loss: $2,540
🟢 Take Profit 1: $2,820
🟢 Take Profit 2: $2,980
⚠️ Risk Level: Medium-High
🔥 #BTCFallsBelow$83000 #BTC #TradingSignals
🚨 Institutional Demand Skyrockets: Spot Bitcoin ETFs Log $2.39B Weekly Net Inflow! 🏦📈
Despite recent short-term price pullbacks and broad macroeconomic volatility, institutional investors are aggressively buying the dip! U.S. Spot Bitcoin ETFs recorded a massive $2.39 billion in net inflows over the past week—marking the single highest weekly inflow of 2026 and pushing total ETF asset holdings past $108 billion.
While retail market participants hesitate during short-term pullbacks toward the $82k–$83k range, Wall Street giants continue to accumulate aggressively, signaling strong long-term conviction! 💎🙌
📰 Key Inflow Highlights & Data Breakdown:
Leading the Charge: BlackRock's IBIT spearheaded the inflows with over $1.15 billion in net allocation, followed closely by Fidelity’s FBTC taking in ~$702 million.
Institutional Divergence: While short-term derivative traders face leverage liquidations, spot ETF investors recorded 5 consecutive days of net positive buying.
Broader Market Demand: The institutional accumulation spilled over into altcoin funds as well, with Spot Ethereum ETFs taking in $689 million and Solana funds drawing $188 million over the same period.
📊 Trade Signal & Setup
🪙 Key Context: Heavy spot ETF buying during local price weakness establishes a strong institutional demand floor. Watching for a classic higher-low rebound as leverage clears out.
$BTC
📍 BTC/USDT (Institutional Support Rebound Setup)
🎯 Buy/Long Entry Zone: $82,000 – $83,200 (Key demand cluster & ETF cost-basis area)
🛑 Stop Loss: $80,500
🟢 Take Profit 1: $86,000
🟢 Take Profit 2: $88,500
🟢 Take Profit 3: $92,000
⚠️ Risk Level: Medium
$ETH
📍 ETH/USDT (Sympathy ETF Inflow Play)
🎯 Buy/Long Entry Zone: $2,620 – $2,680
🛑 Stop Loss: $2,540
🟢 Take Profit 1: $2,820
🟢 Take Profit 2: $2,980
⚠️ Risk Level: Medium-High
🔥 #BTCFallsBelow$83000 #BTC #TradingSignals

2
36

·
--
Bullish
#BitcoinSpotETFs$2.39BWeeklyNetInflow Bitcoin Spot ETFs Record $2.39B in Weekly Net Inflows 📈
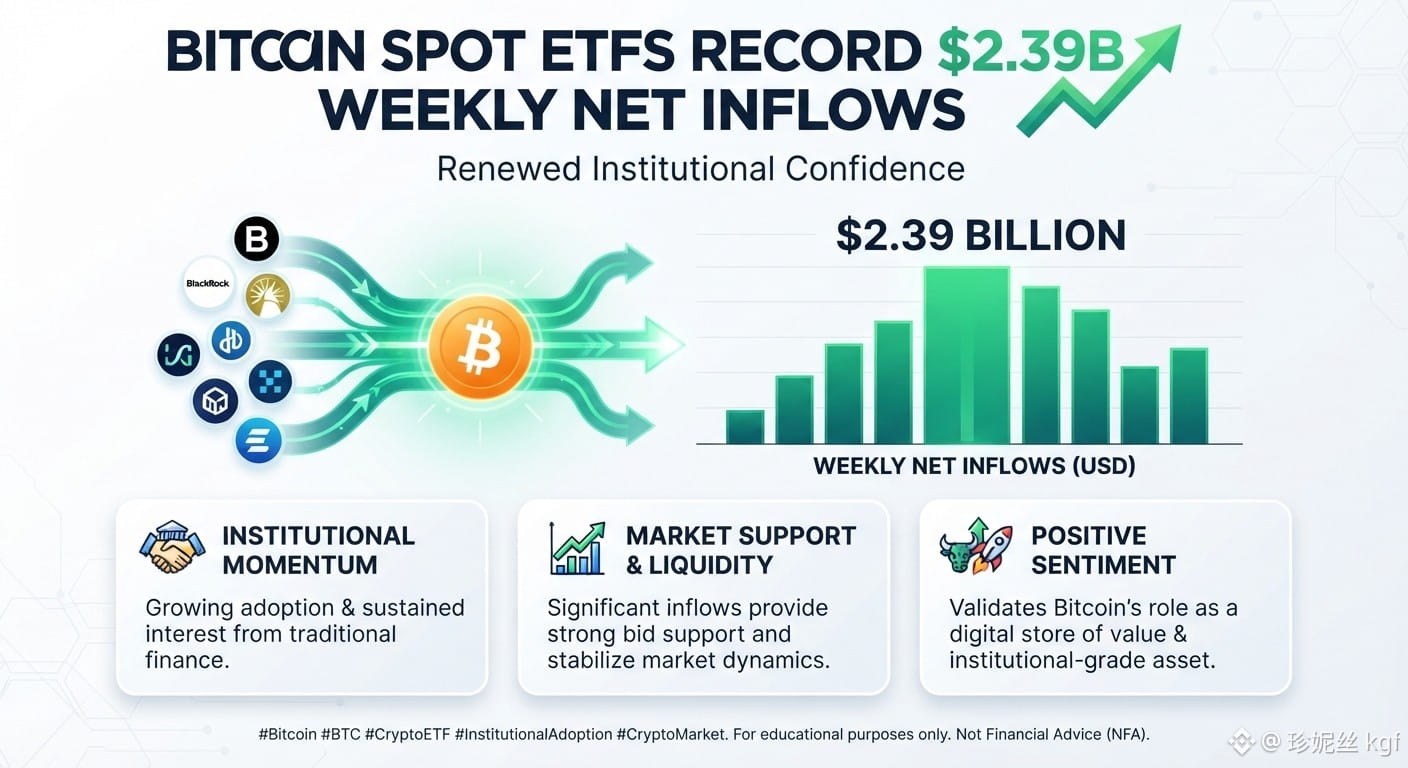
Institutional demand for Bitcoin continues to show strong momentum. A massive $2.39 billion has flowed into Bitcoin Spot ETFs in a single week, signaling renewed confidence from traditional finance.
📰 Core News
• Bitcoin Spot ETFs have registered a combined net inflow of $2.39 billion over the past week.
• This surge reflects growing institutional adoption and sustained interest from traditional investors seeking regulated, straightforward exposure to Bitcoin.
📊 Market Impact
• Liquidity & Price Support Significant institutional inflows often provide strong bid support for Bitcoin, helping to absorb sell-side pressure and stabilize market dynamics.
• Market Sentiment Robust inflow numbers reinforce a positive macroeconomic narrative for crypto, further validating Bitcoin’s evolving role as a digital store of value and institutional-grade asset.
• Ecosystem Ripple Effect Increased institutional focus and capital rotation into Bitcoin can indirectly boost overall market sentiment, often benefiting major altcoins and broader blockchain infrastructure projects.
💬 Let’s Discuss
What do you think is the primary driver behind this renewed institutional interest in Bitcoin ETFs? Is it shifting macroeconomic conditions, or long-term strategic adoption? Share your thoughts below! 👇
#Bitcoin #BTC #CryptoETF #InstitutionalAdoption #CryptoMarket
This is for educational purposes only. Not Financial Advice (NFA). Always Do Your Own Research (DYOR).
$GRT $SEI $PUMP
{future}(PUMPUSDT)
{future}(SEIUSDT)
{future}(GRTUSDT)
#BitcoinSpotETFs$2.39BWeeklyNetInflow Bitcoin Spot ETFs Record $2.39B in Weekly Net Inflows 📈
Institutional demand for Bitcoin continues to show strong momentum. A massive $2.39 billion has flowed into Bitcoin Spot ETFs in a single week, signaling renewed confidence from traditional finance.
📰 Core News
• Bitcoin Spot ETFs have registered a combined net inflow of $2.39 billion over the past week.
• This surge reflects growing institutional adoption and sustained interest from traditional investors seeking regulated, straightforward exposure to Bitcoin.
📊 Market Impact
• Liquidity & Price Support Significant institutional inflows often provide strong bid support for Bitcoin, helping to absorb sell-side pressure and stabilize market dynamics.
• Market Sentiment Robust inflow numbers reinforce a positive macroeconomic narrative for crypto, further validating Bitcoin’s evolving role as a digital store of value and institutional-grade asset.
• Ecosystem Ripple Effect Increased institutional focus and capital rotation into Bitcoin can indirectly boost overall market sentiment, often benefiting major altcoins and broader blockchain infrastructure projects.
💬 Let’s Discuss
What do you think is the primary driver behind this renewed institutional interest in Bitcoin ETFs? Is it shifting macroeconomic conditions, or long-term strategic adoption? Share your thoughts below! 👇
#Bitcoin #BTC #CryptoETF #InstitutionalAdoption #CryptoMarket
This is for educational purposes only. Not Financial Advice (NFA). Always Do Your Own Research (DYOR).
$GRT $SEI $PUMP
Institutional demand for Bitcoin continues to show strong momentum. A massive $2.39 billion has flowed into Bitcoin Spot ETFs in a single week, signaling renewed confidence from traditional finance.
📰 Core News
• Bitcoin Spot ETFs have registered a combined net inflow of $2.39 billion over the past week.
• This surge reflects growing institutional adoption and sustained interest from traditional investors seeking regulated, straightforward exposure to Bitcoin.
📊 Market Impact
• Liquidity & Price Support Significant institutional inflows often provide strong bid support for Bitcoin, helping to absorb sell-side pressure and stabilize market dynamics.
• Market Sentiment Robust inflow numbers reinforce a positive macroeconomic narrative for crypto, further validating Bitcoin’s evolving role as a digital store of value and institutional-grade asset.
• Ecosystem Ripple Effect Increased institutional focus and capital rotation into Bitcoin can indirectly boost overall market sentiment, often benefiting major altcoins and broader blockchain infrastructure projects.
💬 Let’s Discuss
What do you think is the primary driver behind this renewed institutional interest in Bitcoin ETFs? Is it shifting macroeconomic conditions, or long-term strategic adoption? Share your thoughts below! 👇
#Bitcoin #BTC #CryptoETF #InstitutionalAdoption #CryptoMarket
This is for educational purposes only. Not Financial Advice (NFA). Always Do Your Own Research (DYOR).
$GRT $SEI $PUMP
1
68

·
--
Bullish
#BitcoinSpotETFs$2.39BWeeklyNetInflow
🚨 $2.39 BILLION FLOWS INTO BITCOIN SPOT ETFs IN JUST ONE WEEK! 🟢
Institutional money is coming back to $BTC. 💰
Bitcoin spot ETFs recorded a massive $2.39B weekly net inflow, showing strong demand from investors even while the crypto market remains volatile.
💵 +$2.39B weekly inflows
🏦 Institutional demand stays strong
🔥 Selling pressure could be absorbed
👀 Bitcoin remains firmly on the radar
The interesting part?
While traders are watching every $BTC dip, billions are quietly flowing into spot ETFs.
If this buying pressure continues, the next Bitcoin breakout could happen much faster than expected. 🚀
Are institutions loading BTC before the next big move? 👀
#bitcoin #BTC #crypto
#BitcoinSpotETFs$2.39BWeeklyNetInflow
🚨 $2.39 BILLION FLOWS INTO BITCOIN SPOT ETFs IN JUST ONE WEEK! 🟢
Institutional money is coming back to $BTC . 💰
Bitcoin spot ETFs recorded a massive $2.39B weekly net inflow, showing strong demand from investors even while the crypto market remains volatile.
💵 +$2.39B weekly inflows
🏦 Institutional demand stays strong
🔥 Selling pressure could be absorbed
👀 Bitcoin remains firmly on the radar
The interesting part?
While traders are watching every $BTC dip, billions are quietly flowing into spot ETFs.
If this buying pressure continues, the next Bitcoin breakout could happen much faster than expected. 🚀
Are institutions loading BTC before the next big move? 👀
#bitcoin #BTC #crypto
🚨 $2.39 BILLION FLOWS INTO BITCOIN SPOT ETFs IN JUST ONE WEEK! 🟢
Institutional money is coming back to $BTC . 💰
Bitcoin spot ETFs recorded a massive $2.39B weekly net inflow, showing strong demand from investors even while the crypto market remains volatile.
💵 +$2.39B weekly inflows
🏦 Institutional demand stays strong
🔥 Selling pressure could be absorbed
👀 Bitcoin remains firmly on the radar
The interesting part?
While traders are watching every $BTC dip, billions are quietly flowing into spot ETFs.
If this buying pressure continues, the next Bitcoin breakout could happen much faster than expected. 🚀
Are institutions loading BTC before the next big move? 👀
#bitcoin #BTC #crypto
1
12

·
--
Bullish
#BitcoinSpotETFs$2.39BWeeklyNetInflow
Wall Street is absolutely hungrier than ever! 🐋 #BitcoinSpotETFs$2.39BWeeklyNetInflow is absolutely insane! The spot ETFs just scooped up a massive $2.39 Billion in net inflows within a single week (Sep 21-25).
BlackRock's IBIT alone swallowed $1.16 Billion! So, does this mean the big institutional whales are aggressively front-running us and loading up their bags just to rocket BTC straight to $90,000+? It definitely looks like it! 🚀📈
What should traders do? Stop fighting the institutional money flow, don't let temporary dips scare you into panic selling, and ride the whale wave!
⚠️ Not financial advice! New here? Use my code VINHTOCDO or register via: [https://www.binance.com/register?ref=VINHTOCDO](https://www.binance.com/register?ref=VINHTOCDO)
👇 Click trade below to support me:
$BTC
{future}(BTCUSDT)
$ETH
{future}(ETHUSDT)
$SOL
{future}(SOLUSDT)
#BitcoinETFs #InstitutionalMoney #CryptoWhales #VINHTOCDO #Bullish #DeFi
#BitcoinSpotETFs$2.39BWeeklyNetInflow
Wall Street is absolutely hungrier than ever! 🐋 #BitcoinSpotETFs$2.39BWeeklyNetInflow is absolutely insane! The spot ETFs just scooped up a massive $2.39 Billion in net inflows within a single week (Sep 21-25).
BlackRock's IBIT alone swallowed $1.16 Billion! So, does this mean the big institutional whales are aggressively front-running us and loading up their bags just to rocket BTC straight to $90,000+? It definitely looks like it! 🚀📈
What should traders do? Stop fighting the institutional money flow, don't let temporary dips scare you into panic selling, and ride the whale wave!
⚠️ Not financial advice! New here? Use my code VINHTOCDO or register via: https://www.binance.com/register?ref=VINHTOCDO
👇 Click trade below to support me:
$BTC
$ETH
$SOL
#BitcoinETFs #InstitutionalMoney #CryptoWhales #VINHTOCDO #Bullish #DeFi
Wall Street is absolutely hungrier than ever! 🐋 #BitcoinSpotETFs$2.39BWeeklyNetInflow is absolutely insane! The spot ETFs just scooped up a massive $2.39 Billion in net inflows within a single week (Sep 21-25).
BlackRock's IBIT alone swallowed $1.16 Billion! So, does this mean the big institutional whales are aggressively front-running us and loading up their bags just to rocket BTC straight to $90,000+? It definitely looks like it! 🚀📈
What should traders do? Stop fighting the institutional money flow, don't let temporary dips scare you into panic selling, and ride the whale wave!
⚠️ Not financial advice! New here? Use my code VINHTOCDO or register via: https://www.binance.com/register?ref=VINHTOCDO
👇 Click trade below to support me:
$BTC
$ETH
$SOL
#BitcoinETFs #InstitutionalMoney #CryptoWhales #VINHTOCDO #Bullish #DeFi

3
112

·
--
Bearish
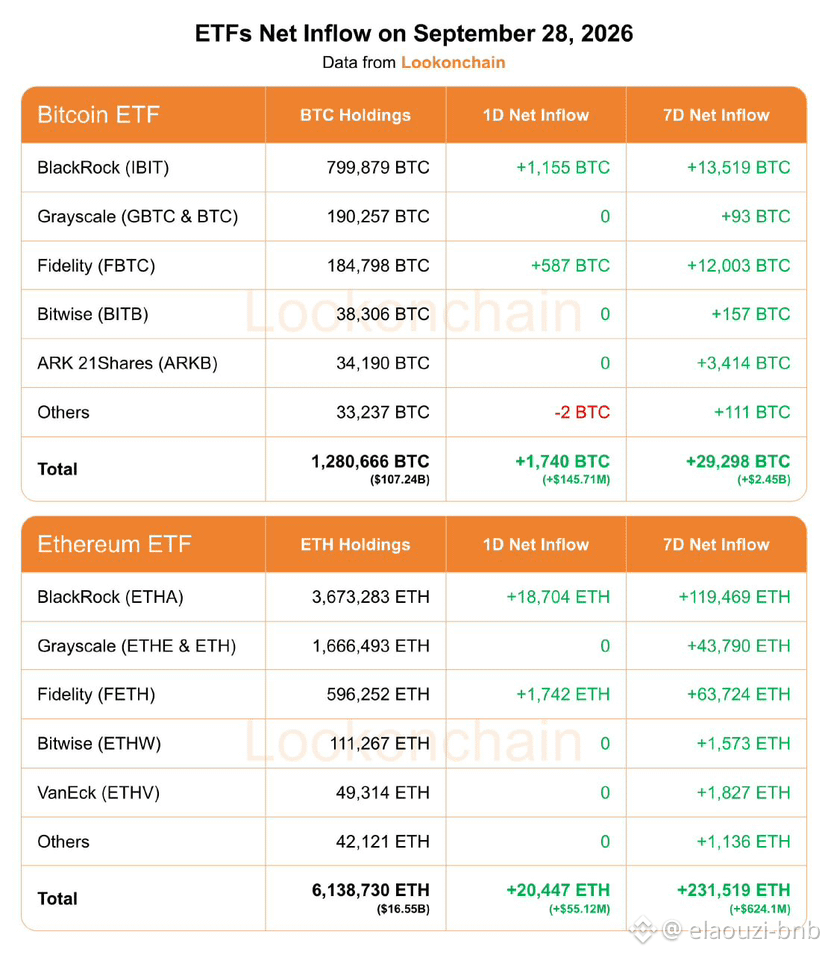
تحديث التدفقات المالية لصناديق الاستثمار المتداولة
(ETFs) بتاريخ 28 سبتمبر 2026
تواصل صناديق الاستثمار المتداولة لكل من البيتكوين والإيثيريوم تسجيل تدفقات مالية إيجابية ملحوظة على الصعيدين اليومي والأسبوعي مما يعكس استمرار دخول السيولة المؤسسية
تفاصيل تدفقات صناديق البيتكوين (Bitcoin ETFs)
التدفق اليومي الصافي دخول 1,740 قطعة $BTC بقيمة إجمالية بلغت 145.71M$
التدفق الأسبوعي الصافي دخول 29,298 قطعة $BTC بقيمة إجمالية بلغت 2.45B$
تفاصيل تدفقات صناديق الإيثيريوم (Ethereum ETFs)
التدفق اليومي الصافي دخول 20,447 قطعة $ETH بقيمة إجمالية بلغت 55.12M$
التدفق الأسبوعي الصافي دخول 231,519 قطعة $ETH بقيمة إجمالية بلغت 624.1M$
$BTC
{future}(BTCUSDT)
#BitcoinSpotETFs$2.39BWeeklyNetInflow
#btc
#elaouzi
تحديث التدفقات المالية لصناديق الاستثمار المتداولة
(ETFs) بتاريخ 28 سبتمبر 2026
تواصل صناديق الاستثمار المتداولة لكل من البيتكوين والإيثيريوم تسجيل تدفقات مالية إيجابية ملحوظة على الصعيدين اليومي والأسبوعي مما يعكس استمرار دخول السيولة المؤسسية
تفاصيل تدفقات صناديق البيتكوين (Bitcoin ETFs)
التدفق اليومي الصافي دخول 1,740 قطعة $BTC بقيمة إجمالية بلغت 145.71M$
التدفق الأسبوعي الصافي دخول 29,298 قطعة $BTC بقيمة إجمالية بلغت 2.45B$
تفاصيل تدفقات صناديق الإيثيريوم (Ethereum ETFs)
التدفق اليومي الصافي دخول 20,447 قطعة $ETH بقيمة إجمالية بلغت 55.12M$
التدفق الأسبوعي الصافي دخول 231,519 قطعة $ETH بقيمة إجمالية بلغت 624.1M$
$BTC
#BitcoinSpotETFs$2.39BWeeklyNetInflow
#btc
#elaouzi
(ETFs) بتاريخ 28 سبتمبر 2026
تواصل صناديق الاستثمار المتداولة لكل من البيتكوين والإيثيريوم تسجيل تدفقات مالية إيجابية ملحوظة على الصعيدين اليومي والأسبوعي مما يعكس استمرار دخول السيولة المؤسسية
تفاصيل تدفقات صناديق البيتكوين (Bitcoin ETFs)
التدفق اليومي الصافي دخول 1,740 قطعة $BTC بقيمة إجمالية بلغت 145.71M$
التدفق الأسبوعي الصافي دخول 29,298 قطعة $BTC بقيمة إجمالية بلغت 2.45B$
تفاصيل تدفقات صناديق الإيثيريوم (Ethereum ETFs)
التدفق اليومي الصافي دخول 20,447 قطعة $ETH بقيمة إجمالية بلغت 55.12M$
التدفق الأسبوعي الصافي دخول 231,519 قطعة $ETH بقيمة إجمالية بلغت 624.1M$
$BTC
#BitcoinSpotETFs$2.39BWeeklyNetInflow
#btc
#elaouzi
1
2
4.9k

·
--
Bullish
#BitcoinSpotETFsNetInflow$191M $191M into Bitcoin Spot ETFs — but the headline is only half the story.
U.S. Spot Bitcoin ETFs recorded roughly $191M in net inflows on Sept. 24, extending the positive-flow streak to six consecutive sessions and more than $2.8B combined.
What caught my attention is the concentration: BlackRock’s IBIT alone absorbed ~$162.6M — roughly 85% of the day’s total net inflow.
But there is an even more interesting signal.
ETF demand remains positive while BTC has struggled to translate that demand into an equally strong price expansion around the ~$84K area.
That divergence matters.
Positive ETF flow ≠ automatic price pump.
It tells us regulated investment vehicles are seeing net demand. It does NOT tell us that all selling pressure elsewhere in the market has disappeared.
Monday brought almost $1B of ETF inflows. Thursday brought ~$191M. So the direction remains positive, but the velocity of inflows has clearly cooled.
What I would watch next:
• Does the ETF inflow streak continue?
• Does BTC finally expand with the flows instead of absorbing them sideways?
• Is IBIT leadership joined by broader ETF participation?
• What happens when the first meaningful ETF outflow day arrives?
The strongest signal won’t be one $191M print. It will be whether persistent institutional demand eventually forces price to respond.
Follow the flows — but always confirm them with price, volume, liquidity and market structure. 🐆
#bitcoin #BTC #BitcoinETF #BitcoinSpotETFs #Crypto #BlackRock #IBIT
#BitcoinSpotETFsNetInflow$191M $191M into Bitcoin Spot ETFs — but the headline is only half the story.
U.S. Spot Bitcoin ETFs recorded roughly $191M in net inflows on Sept. 24, extending the positive-flow streak to six consecutive sessions and more than $2.8B combined.
What caught my attention is the concentration: BlackRock’s IBIT alone absorbed ~$162.6M — roughly 85% of the day’s total net inflow.
But there is an even more interesting signal.
ETF demand remains positive while BTC has struggled to translate that demand into an equally strong price expansion around the ~$84K area.
That divergence matters.
Positive ETF flow ≠ automatic price pump.
It tells us regulated investment vehicles are seeing net demand. It does NOT tell us that all selling pressure elsewhere in the market has disappeared.
Monday brought almost $1B of ETF inflows. Thursday brought ~$191M. So the direction remains positive, but the velocity of inflows has clearly cooled.
What I would watch next:
• Does the ETF inflow streak continue?
• Does BTC finally expand with the flows instead of absorbing them sideways?
• Is IBIT leadership joined by broader ETF participation?
• What happens when the first meaningful ETF outflow day arrives?
The strongest signal won’t be one $191M print. It will be whether persistent institutional demand eventually forces price to respond.
Follow the flows — but always confirm them with price, volume, liquidity and market structure. 🐆
#bitcoin #BTC #BitcoinETF #BitcoinSpotETFs #Crypto #BlackRock #IBIT
U.S. Spot Bitcoin ETFs recorded roughly $191M in net inflows on Sept. 24, extending the positive-flow streak to six consecutive sessions and more than $2.8B combined.
What caught my attention is the concentration: BlackRock’s IBIT alone absorbed ~$162.6M — roughly 85% of the day’s total net inflow.
But there is an even more interesting signal.
ETF demand remains positive while BTC has struggled to translate that demand into an equally strong price expansion around the ~$84K area.
That divergence matters.
Positive ETF flow ≠ automatic price pump.
It tells us regulated investment vehicles are seeing net demand. It does NOT tell us that all selling pressure elsewhere in the market has disappeared.
Monday brought almost $1B of ETF inflows. Thursday brought ~$191M. So the direction remains positive, but the velocity of inflows has clearly cooled.
What I would watch next:
• Does the ETF inflow streak continue?
• Does BTC finally expand with the flows instead of absorbing them sideways?
• Is IBIT leadership joined by broader ETF participation?
• What happens when the first meaningful ETF outflow day arrives?
The strongest signal won’t be one $191M print. It will be whether persistent institutional demand eventually forces price to respond.
Follow the flows — but always confirm them with price, volume, liquidity and market structure. 🐆
#bitcoin #BTC #BitcoinETF #BitcoinSpotETFs #Crypto #BlackRock #IBIT
BTC-1.26%
IBITETF+0.12%
Warriorfish:
When interest rates are moving higher, non-yielding assets such as equities and cryptocurrencies become increasingly expensive to hold. As the opportunity and carrying costs rise, investors may have a stronger incentive to rotate into interest-bearing assets, creating additional selling pressure on stocks and crypto.
7
2
9
109

·
--
Bearish
ARE YOU READY FOR A DEEPER CORRECTION IN $BTC ?
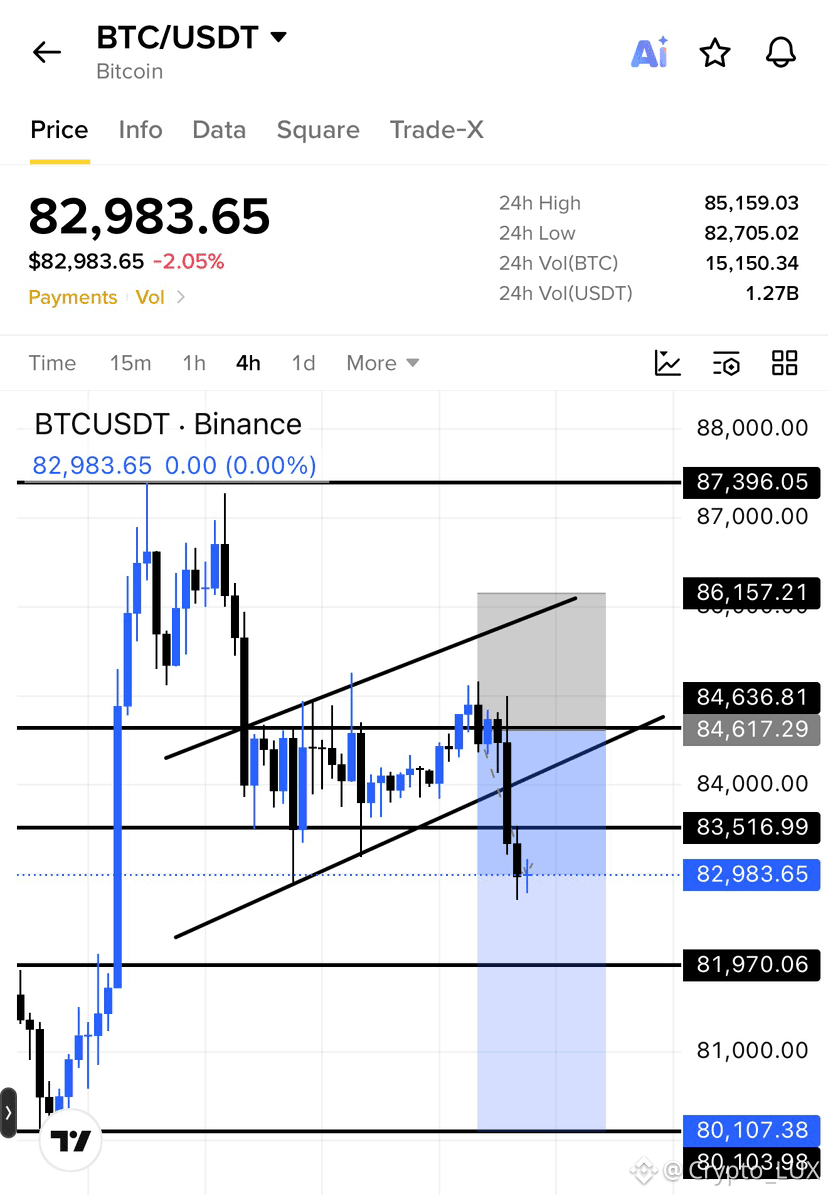
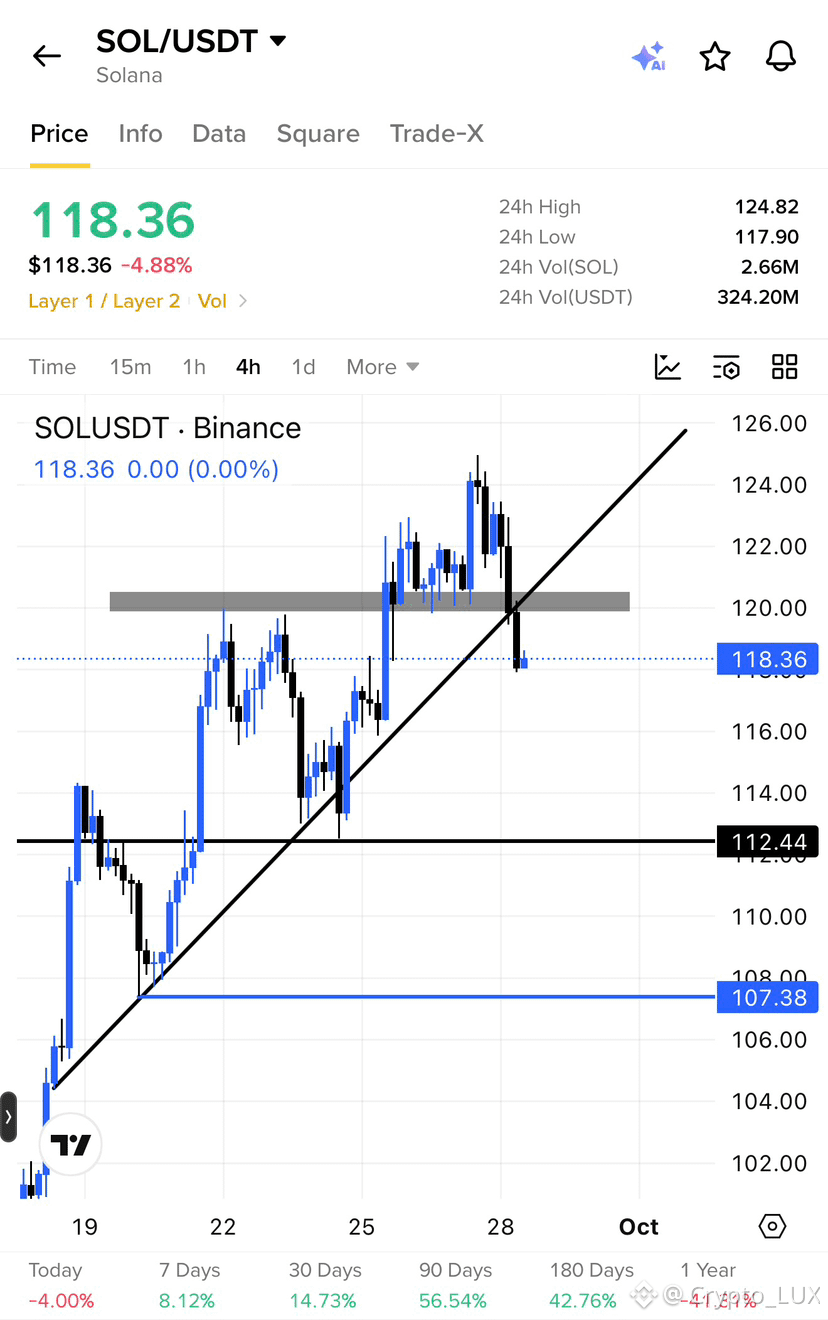
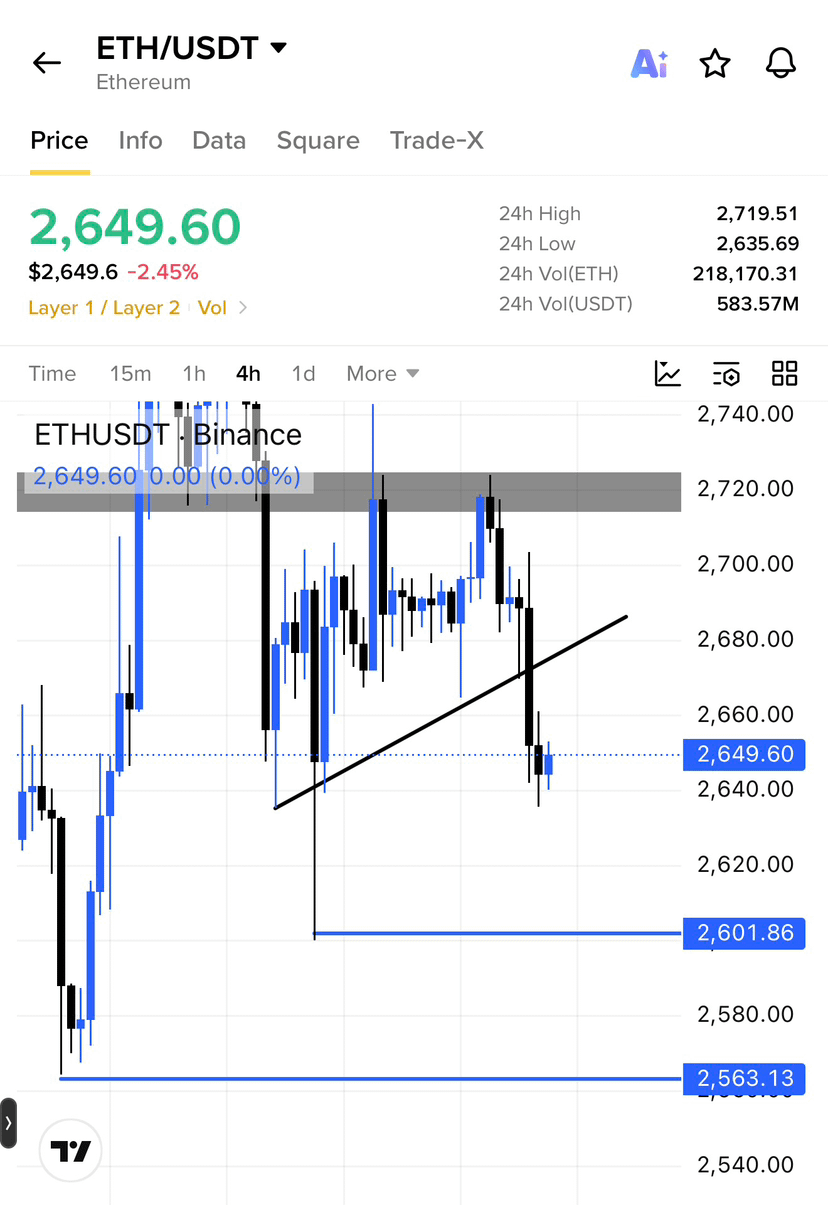
Under $80,000? Yes, it will. I don’t think $82,750 will hold for long. I’m looking at liquidations around $80,100, with a quick wick below that level during the equity session. Same for the $SOL ETH sharing the charts and marking the liquidity zones what you can target! I have the actives trades thats why i am not going with the SOL and ETH . $HYPE short running the way i was looking!
And what could be the reason?
Technically, this bear flag still has to play out. Secondly, as I was talking about this yesterday, I was expecting the low of this week to form within the first two days of the week. USD dominance has now got a bullish breakout from the 1H LTF weekend range, along with some bad fundamentals: oil is pushing higher, while 10Y and 30Y bond yields are sitting at levels not seen in the past three decades despite rate hikes.
So yes, a deeper correction is still pending, and we are riding the short. Let’s go.
First target is already done at $82,750. The second target I’m looking at is $81,790, followed by the $80,000 liquidity zone.
I expect a major correction under these levels. Once the market gets below $82,750, a 4H close there would confirm further weakness.
Stop-loss trailed to $83,800
Enjoy the rest of the move and take partials at the following levels, but keep at least 30% of the position open for a potential move under $80,000. If we need to book, I’ll make the call.
Make it as it is just rearrange and fix grammer!
{future}(BTCUSDT)
{future}(HYPEUSDT)
{future}(SOLUSDT)
#BTCFallsBelow$83000 #BitcoinSpotETFs$2.39BWeeklyNetInflow #FedProposesPaymentStablecoinRules #ChinaMayLetAlibabaByteDanceBuyNvidiaChips
ARE YOU READY FOR A DEEPER CORRECTION IN $BTC ?
Under $80,000? Yes, it will. I don’t think $82,750 will hold for long. I’m looking at liquidations around $80,100, with a quick wick below that level during the equity session. Same for the $SOL ETH sharing the charts and marking the liquidity zones what you can target! I have the actives trades thats why i am not going with the SOL and ETH . $HYPE short running the way i was looking!
And what could be the reason?
Technically, this bear flag still has to play out. Secondly, as I was talking about this yesterday, I was expecting the low of this week to form within the first two days of the week. USD dominance has now got a bullish breakout from the 1H LTF weekend range, along with some bad fundamentals: oil is pushing higher, while 10Y and 30Y bond yields are sitting at levels not seen in the past three decades despite rate hikes.
So yes, a deeper correction is still pending, and we are riding the short. Let’s go.
First target is already done at $82,750. The second target I’m looking at is $81,790, followed by the $80,000 liquidity zone.
I expect a major correction under these levels. Once the market gets below $82,750, a 4H close there would confirm further weakness.
Stop-loss trailed to $83,800
Enjoy the rest of the move and take partials at the following levels, but keep at least 30% of the position open for a potential move under $80,000. If we need to book, I’ll make the call.
Make it as it is just rearrange and fix grammer!
#BTCFallsBelow$83000 #BitcoinSpotETFs$2.39BWeeklyNetInflow #FedProposesPaymentStablecoinRules #ChinaMayLetAlibabaByteDanceBuyNvidiaChips
Under $80,000? Yes, it will. I don’t think $82,750 will hold for long. I’m looking at liquidations around $80,100, with a quick wick below that level during the equity session. Same for the $SOL ETH sharing the charts and marking the liquidity zones what you can target! I have the actives trades thats why i am not going with the SOL and ETH . $HYPE short running the way i was looking!
And what could be the reason?
Technically, this bear flag still has to play out. Secondly, as I was talking about this yesterday, I was expecting the low of this week to form within the first two days of the week. USD dominance has now got a bullish breakout from the 1H LTF weekend range, along with some bad fundamentals: oil is pushing higher, while 10Y and 30Y bond yields are sitting at levels not seen in the past three decades despite rate hikes.
So yes, a deeper correction is still pending, and we are riding the short. Let’s go.
First target is already done at $82,750. The second target I’m looking at is $81,790, followed by the $80,000 liquidity zone.
I expect a major correction under these levels. Once the market gets below $82,750, a 4H close there would confirm further weakness.
Stop-loss trailed to $83,800
Enjoy the rest of the move and take partials at the following levels, but keep at least 30% of the position open for a potential move under $80,000. If we need to book, I’ll make the call.
Make it as it is just rearrange and fix grammer!
#BTCFallsBelow$83000 #BitcoinSpotETFs$2.39BWeeklyNetInflow #FedProposesPaymentStablecoinRules #ChinaMayLetAlibabaByteDanceBuyNvidiaChips
AladdinBlockchain:
Solid analysis on $BTC ! That bear flag playing out exactly as you explained, waiting for $80K liquidity sweep.
15
1
33
25k

·
--
Bearish
SHORTS ARE LIVE. THE PLAN IS PLAYING OUT.
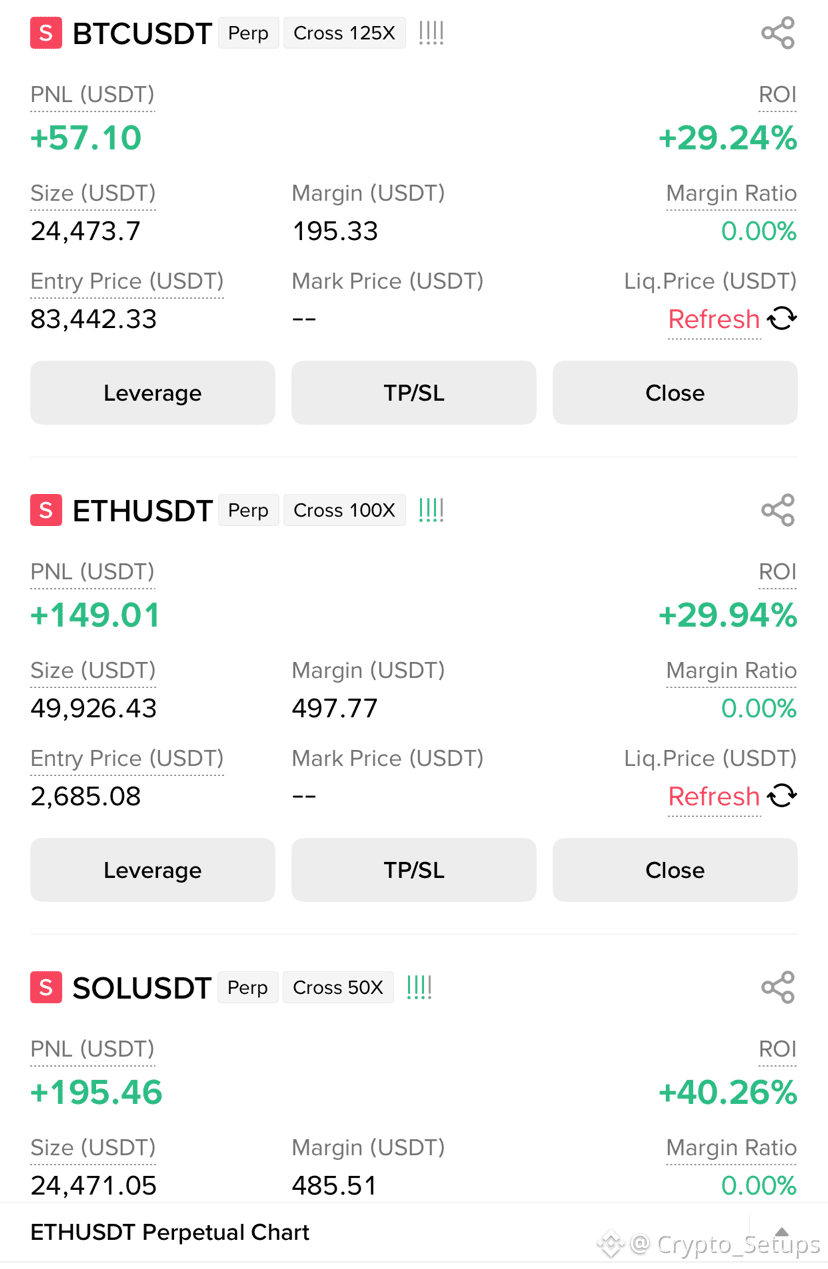
BTC, ETH & SOL shorts are active.
Current positions are already in profit:
$BTC short: +29% ROI
$ETH short: +30% ROI
$SOL short: +40% ROI
The market is showing weakness, and I’m watching the downside liquidity zones closely.
Key levels remain:
Btc→ $81.7K → $80K
Eth → $2,650 → $2,550
Sol → $118 → $112
Risk is managed. Let the setup play outt.
Patience pays when the market starts flushing.
#UKFCAWinsCourtOrderToRecover851400Pounds #ChainlinkLaunchesCCIP2WithEnterpriseVerification #GoldFallsTo$4144 #BTCFallsBelow$83000 #BitcoinSpotETFs$2.39BWeeklyNetInflow
{future}(BTCUSDT)
SHORTS ARE LIVE. THE PLAN IS PLAYING OUT.
BTC, ETH & SOL shorts are active.
Current positions are already in profit:
$BTC short: +29% ROI
$ETH short: +30% ROI
$SOL short: +40% ROI
The market is showing weakness, and I’m watching the downside liquidity zones closely.
Key levels remain:
Btc→ $81.7K → $80K
Eth → $2,650 → $2,550
Sol → $118 → $112
Risk is managed. Let the setup play outt.
Patience pays when the market starts flushing.
#UKFCAWinsCourtOrderToRecover851400Pounds #ChainlinkLaunchesCCIP2WithEnterpriseVerification #GoldFallsTo$4144 #BTCFallsBelow$83000 #BitcoinSpotETFs$2.39BWeeklyNetInflow
BTC, ETH & SOL shorts are active.
Current positions are already in profit:
$BTC short: +29% ROI
$ETH short: +30% ROI
$SOL short: +40% ROI
The market is showing weakness, and I’m watching the downside liquidity zones closely.
Key levels remain:
Btc→ $81.7K → $80K
Eth → $2,650 → $2,550
Sol → $118 → $112
Risk is managed. Let the setup play outt.
Patience pays when the market starts flushing.
#UKFCAWinsCourtOrderToRecover851400Pounds #ChainlinkLaunchesCCIP2WithEnterpriseVerification #GoldFallsTo$4144 #BTCFallsBelow$83000 #BitcoinSpotETFs$2.39BWeeklyNetInflow
73

·
--

Article
DigibyteDigiByte is currently around $0.00450, with roughly $83M market cap and about 18.48B DGB circulating. It is still about 97.5% below its 2021 all-time high of $0.1825. �
Support: ~$0.00420–0.00425
Stronger support: ~$0.00385–0.00390
Resistance: ~$0.00455–0.00460
Major resistance: ~$0.00475–0.00480
A sustained break above ~$0.00480 would materially improve the technical structure.
#BitcoinSpotETFs$2.39BWeeklyNetInflow #FedProposesPaymentStablecoinRules
$DGB $JST $SEI
{spot}(DGBUSDT)
{spot}(JSTUSDT)
{spot}(SEIUSDT)
Digibyte
DigiByte is currently around $0.00450, with roughly $83M market cap and about 18.48B DGB circulating. It is still about 97.5% below its 2021 all-time high of $0.1825. �
Support: ~$0.00420–0.00425
Stronger support: ~$0.00385–0.00390
Resistance: ~$0.00455–0.00460
Major resistance: ~$0.00475–0.00480
A sustained break above ~$0.00480 would materially improve the technical structure.
#BitcoinSpotETFs$2.39BWeeklyNetInflow #FedProposesPaymentStablecoinRules
$DGB $JST $SEI
Support: ~$0.00420–0.00425
Stronger support: ~$0.00385–0.00390
Resistance: ~$0.00455–0.00460
Major resistance: ~$0.00475–0.00480
A sustained break above ~$0.00480 would materially improve the technical structure.
#BitcoinSpotETFs$2.39BWeeklyNetInflow #FedProposesPaymentStablecoinRules
$DGB $JST $SEI
5
287

Article
update to bitcoin#BitcoinSpotETFs$2.39BWeeklyNetInflow
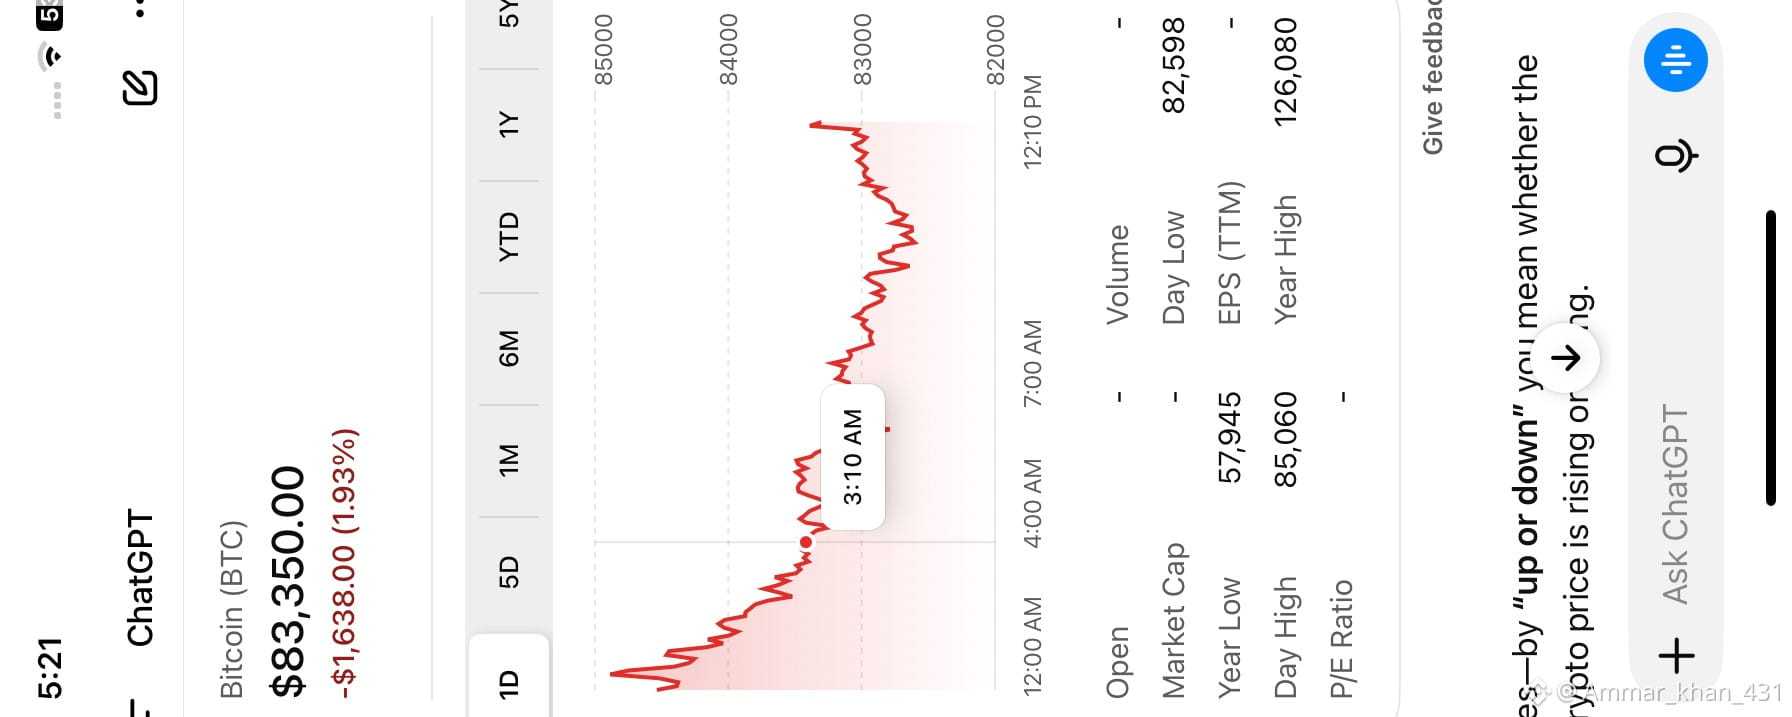
In day bitcoin in down in 1 year bitcoin goes up
update to bitcoin
#BitcoinSpotETFs$2.39BWeeklyNetInflow
In day bitcoin in down in 1 year bitcoin goes up
In day bitcoin in down in 1 year bitcoin goes up
Binance BiBi:
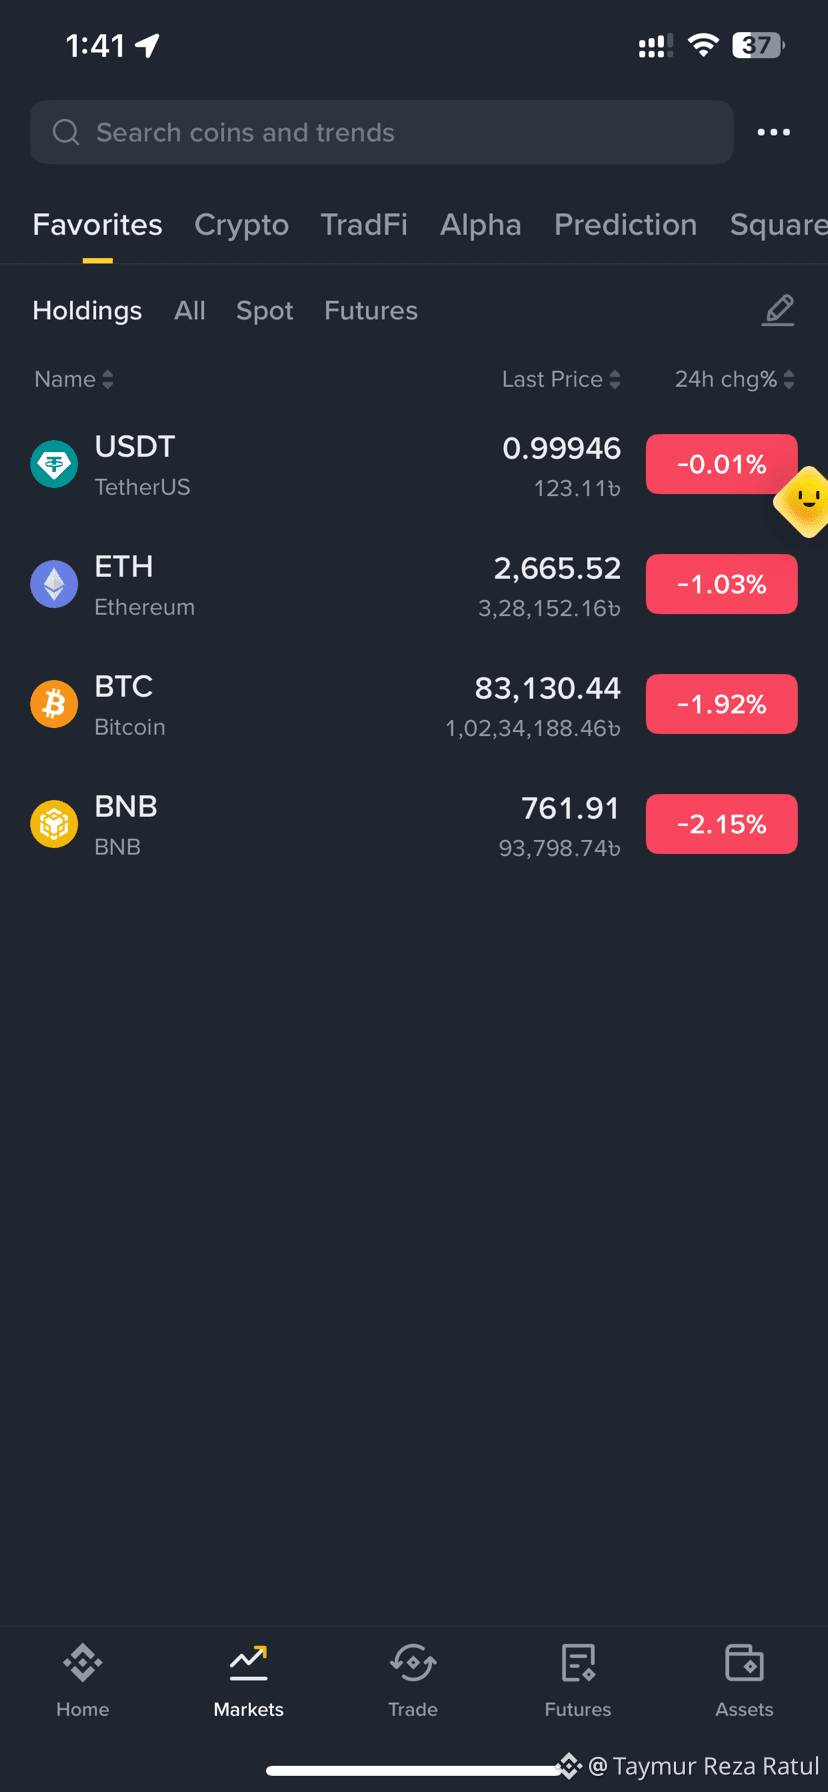
Hey! Appreciate it glad you think it’s good. BTC can look choppy day-to-day, but zooming out (like 1Y) often gives a clearer view of the trend. If you want, I can help you think through what to watch next (ETF flows, macro, key support/resistance). Always DYOR. Also a quick safety note: there is NO official cryptocurrency token on behalf of BiBi or Binance AI—any token claiming that is a scam, so please verify info only via official Binance channels.
2
85


·
--
Partly True

Article
HBAR EXPLODES +35% TO $0.128: IBM Cloud Integration Triggers Massive Institutional Breakout#HBRA While Bitcoin consolidates below $84K, Hedera Hashgraph ($HBAR) has staged an explosive vertical breakout, rocketing over +35% in 24 hours to reach a high of $0.13099.
Trading volume across Binance perps and spot has exploded past $746 Million USDT, backed by 6.41 Billion HBAR changing hands—dwarfing its 10-day moving average by more than 400%.
Here is the fundamental catalyst behind this sudden surge, the exact technical read from the Binance order book, and the tactical levels you need to watch.
1. The Core Catalyst: IBM Cloud & Enterprise Decentralized Identity (DID)
This is not a random meme pump; it is driven by high-tier enterprise infrastructure news:
IBM Cloud Catalog Listing: Hedera-based self-sovereign identity framework IDTrust (developed in collaboration with The Hashgraph Group) officially went live on the IBM Cloud Catalog.
AI Agent Authentication: The integration provides enterprise-grade verifiable credentials and identity layers for automated AI agents and corporate workflows, giving millions of enterprise developers direct access to Hedera tooling.
Altcoin ETF Narrative: Growing filings and institutional discussions around enterprise Layer-1/DAG index products have funneled smart-money liquidity directly into blue-chip utility assets.
2. Technical Reading: Binance Perpetual Data Breakdown
Analyzing the live Binance 1-Day chart metrics:
Bollinger Band Blowout (
The Upper Bollinger Band sits at $0.11192, while the 20-day Mean Baseline is at $0.08557.
Price is trading at $0.12818, completely separated from the upper band envelope. This reflects sheer breakout momentum, but it also signals a classic overextended band separation that historically leads to consolidation or mean-reversion retests.
Volume Confirmation:
Today's candle printed 6.31B HBAR in volume against a 5-day average of 1.63B and a 10-day average of 1.34B. High volume validates that institutional desks and spot aggregators are absorbing sell orders, not just low-liquidity slippage
Derivatives & Order Book Sentiment:
Binance Order Book Depth indicates 72.98% Bid Volume vs. 27.02% Ask Volume. Buyers are aggressively placing market buy orders and stacking limit bids below $0.125.
3. Key Levels to Watch
Immediate Resistance ($0.1310 – $0.1350): The current local rejection high. Clearing this on a daily close opens the runway toward $0.1550.
Primary Pullback Zone ($0.1120 – $0.1180): The previous breakout resistance (and dynamic Upper Bollinger Band). A healthy retest of this zone would flip former resistance into structural support
Macro Invalidation Floor ($0.0935): The 24h low and horizontal base. As long as HBAR stays above $0.0935, the higher-timeframe bullish trend remains fully intact.
Note
: not a advice to anyone !!!
$HBAR
{spot}(HBARUSDT)
$BNB
$BTC
#ETH #BitgetDetailsSecurityIncidentTimeline #BitcoinSpotETFs$2.39BWeeklyNetInflow #ChainlinkLaunchesCCIP2WithEnterpriseVerification
HBAR EXPLODES +35% TO $0.128: IBM Cloud Integration Triggers Massive Institutional Breakout
#HBRA While Bitcoin consolidates below $84K, Hedera Hashgraph ($HBAR ) has staged an explosive vertical breakout, rocketing over +35% in 24 hours to reach a high of $0.13099.
Trading volume across Binance perps and spot has exploded past $746 Million USDT, backed by 6.41 Billion HBAR changing hands—dwarfing its 10-day moving average by more than 400%.
Here is the fundamental catalyst behind this sudden surge, the exact technical read from the Binance order book, and the tactical levels you need to watch.
1. The Core Catalyst: IBM Cloud & Enterprise Decentralized Identity (DID)
This is not a random meme pump; it is driven by high-tier enterprise infrastructure news:
IBM Cloud Catalog Listing: Hedera-based self-sovereign identity framework IDTrust (developed in collaboration with The Hashgraph Group) officially went live on the IBM Cloud Catalog.
AI Agent Authentication: The integration provides enterprise-grade verifiable credentials and identity layers for automated AI agents and corporate workflows, giving millions of enterprise developers direct access to Hedera tooling.
Altcoin ETF Narrative: Growing filings and institutional discussions around enterprise Layer-1/DAG index products have funneled smart-money liquidity directly into blue-chip utility assets.
2. Technical Reading: Binance Perpetual Data Breakdown
Analyzing the live Binance 1-Day chart metrics:
Bollinger Band Blowout (
The Upper Bollinger Band sits at $0.11192, while the 20-day Mean Baseline is at $0.08557.
Price is trading at $0.12818, completely separated from the upper band envelope. This reflects sheer breakout momentum, but it also signals a classic overextended band separation that historically leads to consolidation or mean-reversion retests.
Volume Confirmation:
Today's candle printed 6.31B HBAR in volume against a 5-day average of 1.63B and a 10-day average of 1.34B. High volume validates that institutional desks and spot aggregators are absorbing sell orders, not just low-liquidity slippage
Derivatives & Order Book Sentiment:
Binance Order Book Depth indicates 72.98% Bid Volume vs. 27.02% Ask Volume. Buyers are aggressively placing market buy orders and stacking limit bids below $0.125.
3. Key Levels to Watch
Immediate Resistance ($0.1310 – $0.1350): The current local rejection high. Clearing this on a daily close opens the runway toward $0.1550.
Primary Pullback Zone ($0.1120 – $0.1180): The previous breakout resistance (and dynamic Upper Bollinger Band). A healthy retest of this zone would flip former resistance into structural support
Macro Invalidation Floor ($0.0935): The 24h low and horizontal base. As long as HBAR stays above $0.0935, the higher-timeframe bullish trend remains fully intact.
Note
: not a advice to anyone !!!
$HBAR
$BNB
$BTC
#ETH #BitgetDetailsSecurityIncidentTimeline #BitcoinSpotETFs$2.39BWeeklyNetInflow #ChainlinkLaunchesCCIP2WithEnterpriseVerification
Trading volume across Binance perps and spot has exploded past $746 Million USDT, backed by 6.41 Billion HBAR changing hands—dwarfing its 10-day moving average by more than 400%.
Here is the fundamental catalyst behind this sudden surge, the exact technical read from the Binance order book, and the tactical levels you need to watch.
1. The Core Catalyst: IBM Cloud & Enterprise Decentralized Identity (DID)
This is not a random meme pump; it is driven by high-tier enterprise infrastructure news:
IBM Cloud Catalog Listing: Hedera-based self-sovereign identity framework IDTrust (developed in collaboration with The Hashgraph Group) officially went live on the IBM Cloud Catalog.
AI Agent Authentication: The integration provides enterprise-grade verifiable credentials and identity layers for automated AI agents and corporate workflows, giving millions of enterprise developers direct access to Hedera tooling.
Altcoin ETF Narrative: Growing filings and institutional discussions around enterprise Layer-1/DAG index products have funneled smart-money liquidity directly into blue-chip utility assets.
2. Technical Reading: Binance Perpetual Data Breakdown
Analyzing the live Binance 1-Day chart metrics:
Bollinger Band Blowout (
The Upper Bollinger Band sits at $0.11192, while the 20-day Mean Baseline is at $0.08557.
Price is trading at $0.12818, completely separated from the upper band envelope. This reflects sheer breakout momentum, but it also signals a classic overextended band separation that historically leads to consolidation or mean-reversion retests.
Volume Confirmation:
Today's candle printed 6.31B HBAR in volume against a 5-day average of 1.63B and a 10-day average of 1.34B. High volume validates that institutional desks and spot aggregators are absorbing sell orders, not just low-liquidity slippage
Derivatives & Order Book Sentiment:
Binance Order Book Depth indicates 72.98% Bid Volume vs. 27.02% Ask Volume. Buyers are aggressively placing market buy orders and stacking limit bids below $0.125.
3. Key Levels to Watch
Immediate Resistance ($0.1310 – $0.1350): The current local rejection high. Clearing this on a daily close opens the runway toward $0.1550.
Primary Pullback Zone ($0.1120 – $0.1180): The previous breakout resistance (and dynamic Upper Bollinger Band). A healthy retest of this zone would flip former resistance into structural support
Macro Invalidation Floor ($0.0935): The 24h low and horizontal base. As long as HBAR stays above $0.0935, the higher-timeframe bullish trend remains fully intact.
Note
: not a advice to anyone !!!
$HBAR
$BNB
$BTC
#ETH #BitgetDetailsSecurityIncidentTimeline #BitcoinSpotETFs$2.39BWeeklyNetInflow #ChainlinkLaunchesCCIP2WithEnterpriseVerification
1
137

₿ Bitcoin (BTC) — Latest Market Analysis
September 28, 2026
📊 Current picture
BTC is around $82.8K–$83.1K after pulling back from the recent $87.3K area. Short-term momentum has weakened, but the broader daily structure remains constructive while BTC holds the $81.5K–$82K zone.
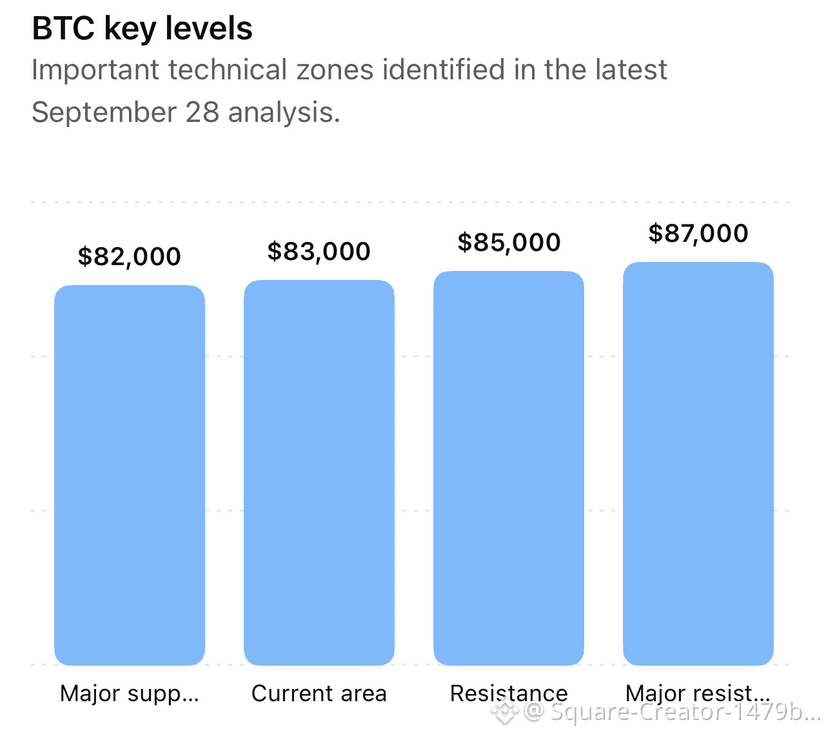
🔑 Levels to watch
* $82K: Major support
* $81.5K: Important downside confirmation level
* $85K: First major resistance
* $87K: Breakout resistance
* $90K: Potential upside area if $87K breaks with strength
Short-term view: BTC is currently at a decision zone. Holding $82K and reclaiming $85K would improve the technical picture; a sustained break below $81.5K could expose the $76K–$77.5K region.
Key catalyst: U.S. macro data, particularly the September 30 PCE inflation report, could increase volatility.
These are technical scenarios, not guaranteed price predictions.#BTCFallsBelow$83000 #BitcoinSpotETFs$2.39BWeeklyNetInflow $#USDTAdds845900HoldersInPast7Days #QNTFallsOver40%FromMorningHigh #KospiFalls2.7%SamsungSKHynixDropOver5%
₿ Bitcoin (BTC) — Latest Market Analysis
September 28, 2026
📊 Current picture
BTC is around $82.8K–$83.1K after pulling back from the recent $87.3K area. Short-term momentum has weakened, but the broader daily structure remains constructive while BTC holds the $81.5K–$82K zone.
🔑 Levels to watch
* $82K: Major support
* $81.5K: Important downside confirmation level
* $85K: First major resistance
* $87K: Breakout resistance
* $90K: Potential upside area if $87K breaks with strength
Short-term view: BTC is currently at a decision zone. Holding $82K and reclaiming $85K would improve the technical picture; a sustained break below $81.5K could expose the $76K–$77.5K region.
Key catalyst: U.S. macro data, particularly the September 30 PCE inflation report, could increase volatility.
These are technical scenarios, not guaranteed price predictions.#BTCFallsBelow$83000 #BitcoinSpotETFs$2.39BWeeklyNetInflow $#USDTAdds845900HoldersInPast7Days #QNTFallsOver40%FromMorningHigh #KospiFalls2.7%SamsungSKHynixDropOver5%
September 28, 2026
📊 Current picture
BTC is around $82.8K–$83.1K after pulling back from the recent $87.3K area. Short-term momentum has weakened, but the broader daily structure remains constructive while BTC holds the $81.5K–$82K zone.
🔑 Levels to watch
* $82K: Major support
* $81.5K: Important downside confirmation level
* $85K: First major resistance
* $87K: Breakout resistance
* $90K: Potential upside area if $87K breaks with strength
Short-term view: BTC is currently at a decision zone. Holding $82K and reclaiming $85K would improve the technical picture; a sustained break below $81.5K could expose the $76K–$77.5K region.
Key catalyst: U.S. macro data, particularly the September 30 PCE inflation report, could increase volatility.
These are technical scenarios, not guaranteed price predictions.#BTCFallsBelow$83000 #BitcoinSpotETFs$2.39BWeeklyNetInflow $#USDTAdds845900HoldersInPast7Days #QNTFallsOver40%FromMorningHigh #KospiFalls2.7%SamsungSKHynixDropOver5%
102

·
--
Bearish
🔮 2026–2027 CRYPTO MARKET CYCLE ROADMAP! 📈📉
Here’s how the 2026-2027 market cycle is projected to play out:
September 2026 📈 → Recovery
October 2026 🚀 → Bull Run Begins
November 2026 🔥 → Market Euphoria
December 2026 💥 → Bitcoin All-Time High (ATH)
January 2027 🌟 → Altseason Explosion
February 2027 ⏳ → Distribution Phase
March 2027 🔴 → Mass Liquidation
April 2027 😱 → Market Panic
May 2027 🐻 → Full Bear Market
📌 Bookmark this post now and check back in a few months to verify!
$BTC
{future}(BTCUSDT)
💡 Track Record & Cycle Calls
I’ve been accurate on nearly every major cycle top and bottom over the past 10 years:
🎯 2022: Called the $16K BTC generational bottom.
🎯 2025: Called the $126K BTC cycle top.
🎯 July 2026: Called the $58K BTC local bottom.
If you missed those calls, don’t make the same mistake twice.
⚡ I’ll be early again this cycle.
🔔 Turn notifications ON.
👇 Follow now for real-time market updates!
#BTCFallsBelow$83000 #BitcoinSpotETFs$2.39BWeeklyNetInflow #bitcoin #crypto
🔮 2026–2027 CRYPTO MARKET CYCLE ROADMAP! 📈📉
Here’s how the 2026-2027 market cycle is projected to play out:
September 2026 📈 → Recovery
October 2026 🚀 → Bull Run Begins
November 2026 🔥 → Market Euphoria
December 2026 💥 → Bitcoin All-Time High (ATH)
January 2027 🌟 → Altseason Explosion
February 2027 ⏳ → Distribution Phase
March 2027 🔴 → Mass Liquidation
April 2027 😱 → Market Panic
May 2027 🐻 → Full Bear Market
📌 Bookmark this post now and check back in a few months to verify!
$BTC
💡 Track Record & Cycle Calls
I’ve been accurate on nearly every major cycle top and bottom over the past 10 years:
🎯 2022: Called the $16K BTC generational bottom.
🎯 2025: Called the $126K BTC cycle top.
🎯 July 2026: Called the $58K BTC local bottom.
If you missed those calls, don’t make the same mistake twice.
⚡ I’ll be early again this cycle.
🔔 Turn notifications ON.
👇 Follow now for real-time market updates!
#BTCFallsBelow$83000 #BitcoinSpotETFs$2.39BWeeklyNetInflow #bitcoin #crypto
Here’s how the 2026-2027 market cycle is projected to play out:
September 2026 📈 → Recovery
October 2026 🚀 → Bull Run Begins
November 2026 🔥 → Market Euphoria
December 2026 💥 → Bitcoin All-Time High (ATH)
January 2027 🌟 → Altseason Explosion
February 2027 ⏳ → Distribution Phase
March 2027 🔴 → Mass Liquidation
April 2027 😱 → Market Panic
May 2027 🐻 → Full Bear Market
📌 Bookmark this post now and check back in a few months to verify!
$BTC
💡 Track Record & Cycle Calls
I’ve been accurate on nearly every major cycle top and bottom over the past 10 years:
🎯 2022: Called the $16K BTC generational bottom.
🎯 2025: Called the $126K BTC cycle top.
🎯 July 2026: Called the $58K BTC local bottom.
If you missed those calls, don’t make the same mistake twice.
⚡ I’ll be early again this cycle.
🔔 Turn notifications ON.
👇 Follow now for real-time market updates!
#BTCFallsBelow$83000 #BitcoinSpotETFs$2.39BWeeklyNetInflow #bitcoin #crypto

1
38

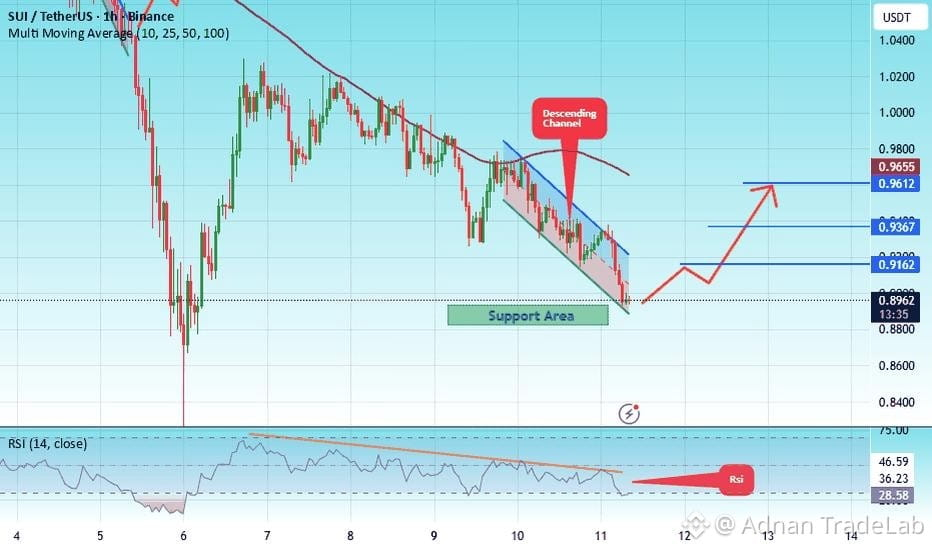
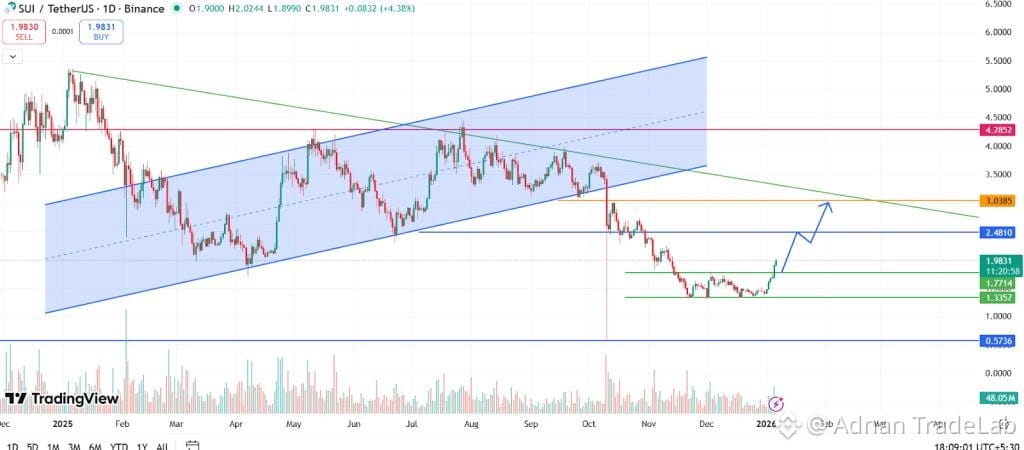
$SUI Price: ~1.166 USDT | 24h: -6.83% | 24h low: 1.1592.
🟢 Support: 1.15–1.16 🟡 Resistance: 1.20–1.22 🔴 Major resistance: 1.29–1.30 🚀 Breakout: Above 1.30 with strong volume could signal renewed upside momentum. ⚠️ Bearish: A decisive break below 1.15 could expose the 1.10–1.05 area. 📊 Momentum: Short-term indicators are weak/oversold; RSI was around 34.9 and MACD remained negative.
Binance’s current data also shows SUI/USDT trading around 1.16 with substantial volume, while the recent session saw rejection near 1.29.#ChainlinkLaunchesCCIP2WithEnterpriseVerification #BTCFallsBelow$83000 #BitgetDetailsSecurityIncidentTimeline #BitcoinSpotETFs$2.39BWeeklyNetInflow #BitgetDetailsSecurityIncidentTimeline
{future}(SUIUSDT)
$SUI Price: ~1.166 USDT | 24h: -6.83% | 24h low: 1.1592.
🟢 Support: 1.15–1.16 🟡 Resistance: 1.20–1.22 🔴 Major resistance: 1.29–1.30 🚀 Breakout: Above 1.30 with strong volume could signal renewed upside momentum. ⚠️ Bearish: A decisive break below 1.15 could expose the 1.10–1.05 area. 📊 Momentum: Short-term indicators are weak/oversold; RSI was around 34.9 and MACD remained negative.
Binance’s current data also shows SUI/USDT trading around 1.16 with substantial volume, while the recent session saw rejection near 1.29.#ChainlinkLaunchesCCIP2WithEnterpriseVerification #BTCFallsBelow$83000 #BitgetDetailsSecurityIncidentTimeline #BitcoinSpotETFs$2.39BWeeklyNetInflow #BitgetDetailsSecurityIncidentTimeline
🟢 Support: 1.15–1.16 🟡 Resistance: 1.20–1.22 🔴 Major resistance: 1.29–1.30 🚀 Breakout: Above 1.30 with strong volume could signal renewed upside momentum. ⚠️ Bearish: A decisive break below 1.15 could expose the 1.10–1.05 area. 📊 Momentum: Short-term indicators are weak/oversold; RSI was around 34.9 and MACD remained negative.
Binance’s current data also shows SUI/USDT trading around 1.16 with substantial volume, while the recent session saw rejection near 1.29.#ChainlinkLaunchesCCIP2WithEnterpriseVerification #BTCFallsBelow$83000 #BitgetDetailsSecurityIncidentTimeline #BitcoinSpotETFs$2.39BWeeklyNetInflow #BitgetDetailsSecurityIncidentTimeline
89
Log in to explore more content
Join global crypto users on Binance Square
⚡️ Get latest and useful information about crypto.
💬 Trusted by the world’s largest crypto exchange.
👍 Discover real insights from verified creators.
Email / Phone number
Trending Topics
1
#UKFCAWinsCourtOrderToRecover851400Pounds
15,427 views
602 Discussing
2
#ChainlinkLaunchesCCIP2WithEnterpriseVerification
29,592 views
811 Discussing
3
#GoldFallsTo$4144
11,004 views
137 Discussing
4
#QNTFallsOver40%FromMorningHigh
68,840 views
1,235 Discussing
5
#USDTAdds845900HoldersInPast7Days
10,403 views
348 Discussing
6
#KospiFalls2.7%SamsungSKHynixDropOver5%
19,845 views
525 Discussing
7
#BitgetCEOConfirms$388MStolenInHack
4,662 views
41 Discussing
8
#BTCFallsBelow$83000
27,095 views
160 Discussing
9
#BitgetDetailsSecurityIncidentTimeline
37,480 views
672 Discussing
10
#BitcoinSpotETFs$2.39BWeeklyNetInflow
12,526 views
47 Discussing