
0xSignal BNB
357 Posts

0xSignal BNB
Report
Block User
Signal over noise. 📡Making Money 1st.
RWA x Memecoins | On-Chain Intel Before Hype.
Micro-cap scout | Data doesn't lie. | Web3 Research Analyst 🔬
Open Trade
Frequent Trader
7.5 Months
47 Following
112 Followers
623 Liked
Posts
Portfolio
All
Quotes
PINNED
·
--
Bullish
Partly True
Guys, nobody's talking about this one. 👀
While everyone's glued to ETH's price action, something quieter has been happening with LINK for a month straight.
Four weeks in a row. Positive net inflows into Chainlink's spot ETF products. Every single week, without a break.
Meanwhile LINK's price? Basically just... sitting there. Consolidating.
That's the part that caught my attention.
Usually when the price is flat, it means nobody cares. But here, real institutional money has been quietly accumulating in the background the entire time — around $145M+ cumulative, and still building into September.
That's not retail hype. ETF flows are slow, deliberate, institutional money — the kind that doesn't chase green candles, it builds positions while nobody's watching.
Add to that: Chainlink's oracle infrastructure is now part of the Coinbase/Base tokenized-stocks push — real-world equities settling on-chain need reliable price feeds, and that's literally Chainlink's job.
So you've got steady inflows + a genuine utility expansion, happening at the same time the chart looks "boring."
That combination — quiet accumulation + flat price + expanding real use case — is usually the phase nobody writes about. By the time it's obvious, it's not early anymore.
I'm not calling a breakout. I'm just pointing at what the flow data actually shows versus what the price chart shows — and right now, those two things disagree.
What would change my mind: if those inflows start reversing, or if the tokenized-stocks integration stalls without real usage behind it.
What I'm watching: whether the ETF inflow streak holds into a 5th, 6th week — and whether price eventually starts reflecting it.
Not financial advice, just numbers I found interesting. DYOR.
Anyone else tracking LINK's flow data, or is this genuinely flying under the radar? 👇
#LINK #Chainlink #CryptoETF
Guys, nobody's talking about this one. 👀
While everyone's glued to ETH's price action, something quieter has been happening with LINK for a month straight.
Four weeks in a row. Positive net inflows into Chainlink's spot ETF products. Every single week, without a break.
Meanwhile LINK's price? Basically just... sitting there. Consolidating.
That's the part that caught my attention.
Usually when the price is flat, it means nobody cares. But here, real institutional money has been quietly accumulating in the background the entire time — around $145M+ cumulative, and still building into September.
That's not retail hype. ETF flows are slow, deliberate, institutional money — the kind that doesn't chase green candles, it builds positions while nobody's watching.
Add to that: Chainlink's oracle infrastructure is now part of the Coinbase/Base tokenized-stocks push — real-world equities settling on-chain need reliable price feeds, and that's literally Chainlink's job.
So you've got steady inflows + a genuine utility expansion, happening at the same time the chart looks "boring."
That combination — quiet accumulation + flat price + expanding real use case — is usually the phase nobody writes about. By the time it's obvious, it's not early anymore.
I'm not calling a breakout. I'm just pointing at what the flow data actually shows versus what the price chart shows — and right now, those two things disagree.
What would change my mind: if those inflows start reversing, or if the tokenized-stocks integration stalls without real usage behind it.
What I'm watching: whether the ETF inflow streak holds into a 5th, 6th week — and whether price eventually starts reflecting it.
Not financial advice, just numbers I found interesting. DYOR.
Anyone else tracking LINK's flow data, or is this genuinely flying under the radar? 👇
#LINK #Chainlink #CryptoETF
While everyone's glued to ETH's price action, something quieter has been happening with LINK for a month straight.
Four weeks in a row. Positive net inflows into Chainlink's spot ETF products. Every single week, without a break.
Meanwhile LINK's price? Basically just... sitting there. Consolidating.
That's the part that caught my attention.
Usually when the price is flat, it means nobody cares. But here, real institutional money has been quietly accumulating in the background the entire time — around $145M+ cumulative, and still building into September.
That's not retail hype. ETF flows are slow, deliberate, institutional money — the kind that doesn't chase green candles, it builds positions while nobody's watching.
Add to that: Chainlink's oracle infrastructure is now part of the Coinbase/Base tokenized-stocks push — real-world equities settling on-chain need reliable price feeds, and that's literally Chainlink's job.
So you've got steady inflows + a genuine utility expansion, happening at the same time the chart looks "boring."
That combination — quiet accumulation + flat price + expanding real use case — is usually the phase nobody writes about. By the time it's obvious, it's not early anymore.
I'm not calling a breakout. I'm just pointing at what the flow data actually shows versus what the price chart shows — and right now, those two things disagree.
What would change my mind: if those inflows start reversing, or if the tokenized-stocks integration stalls without real usage behind it.
What I'm watching: whether the ETF inflow streak holds into a 5th, 6th week — and whether price eventually starts reflecting it.
Not financial advice, just numbers I found interesting. DYOR.
Anyone else tracking LINK's flow data, or is this genuinely flying under the radar? 👇
#LINK #Chainlink #CryptoETF

2
205
PINNED
·
--
Article
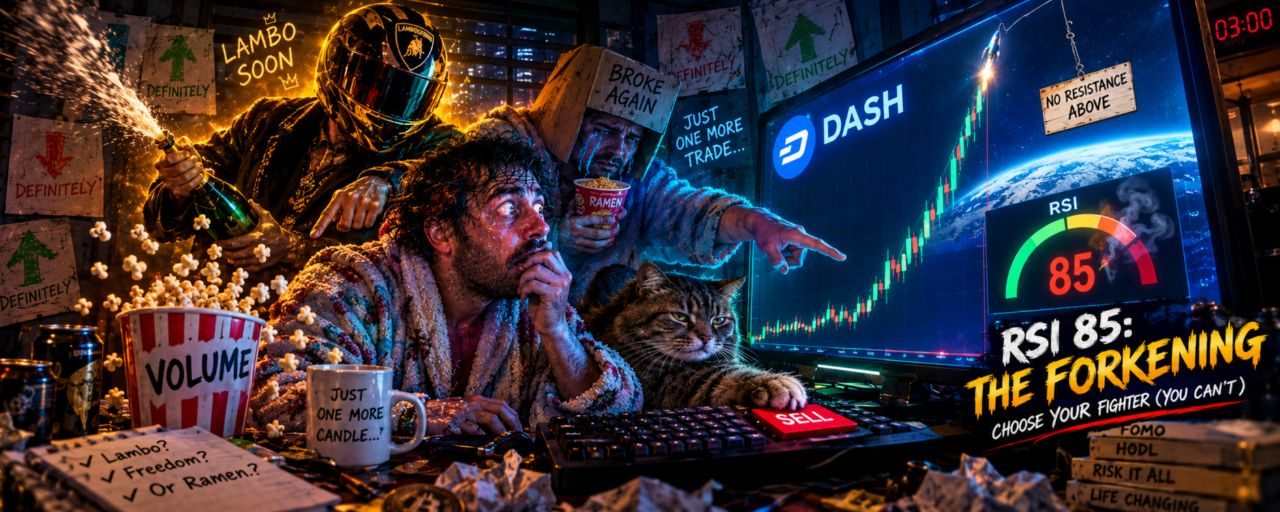
DASH Is At 85 RSI With Nothing Above It. That's Not a Green Light — It's a Fork.Everyone chasing $DASH right now is reading the breakout as confirmation. I'm reading the RSI print as a question the chart hasn't answered yet.
An RSI near 85 with no immediate resistance overhead is one of the more binary setups in crypto. It doesn't tell you the direction of the next move. It tells you the current move is stretched further than usual, and stretched moves resolve one of two ways — they extend violently because there's nothing structurally in the way, or they snap because there's nothing structurally holding them up either. Same fact, two opposite outcomes, and the fact alone doesn't pick one.
The setup
FACT: DASH's RSI is printing near 85, per coverage — a level well into overbought territory by standard technical thresholds.
FACT: No immediate resistance level is currently identified above the current price.
INTERPRETATION: The absence of resistance means there's no obvious price ceiling forcing a pullback on technical grounds alone. That's the bull case for extension. But it also means there's no established support structure recently tested on the way up — the move has outrun the levels that would normally validate it. That's the bear case for a fast reversion.
There is no confirmed HYPOTHESIS on which way this resolves. Anyone telling you RSI at 85 is definitionally about to reverse, or definitionally about to keep running, is stating a rule of thumb as if it were a law. It isn't. Overbought conditions can persist for extended periods in strong trends, and they can also be the exact moment before a sharp mean reversion. The RSI level is a fact about stretch, not a forecast about direction.
Why the obvious read is incomplete
The standard reflex to a high RSI is "overbought, due for a pullback." That reflex exists because it's often right — most extreme RSI prints do eventually mean-revert. But "eventually" is doing a lot of work in that sentence. Extended RSI in an asset with genuinely fresh catalyst-driven demand can keep climbing well past what looks unsustainable, especially with no resistance forcing sellers to defend a level.
The market's possible blind spot isn't "DASH is overbought" — everyone can see that. The blind spot is treating overbought as a timing signal on its own, when it's really a volatility-and-magnitude signal. It tells you the next move is likely to be large. It doesn't tell you which way.
BEFORE → CHANGE → NOW → NEXT
BEFORE: DASH trading within a more typical range, RSI not flagged as extreme.
CHANGE: Price extension pushes RSI to ~85 with no resistance level identified above current price.
CURRENT STATE: Stretched technical condition, unresolved directionally, elevated volatility risk in either direction.
POSSIBLE NEXT: Continuation — RSI stays elevated or climbs further as the move extends with no ceiling to stop it, common when a fresh catalyst or momentum wave is still building. Or reversion — a sharp pullback as the extended move runs out of new buyers and profit-taking hits without any support level established to catch it.
The thesis, stated carefully
The evidence suggests DASH is at a genuine inflection point where the next move — in either direction — is likely to be sharp rather than gradual, given the combination of extreme RSI and the absence of overhead resistance. This is not a call that DASH will pump or dump. It's a statement that the current setup has low odds of just drifting sideways.
The bullish continuation case weakens if volume starts declining while price keeps grinding higher — a sign the move is running on thinner and thinner participation. The bearish reversion case weakens if price holds current levels for several sessions without a pullback, which would suggest the extension is being absorbed rather than chased.
What confirms which side wins
Not the RSI number itself — watch what happens to volume alongside it. Rising volume with rising price into further overbought territory favors continuation. Flat or declining volume at these levels, especially alongside any signs of stalling candles, favors a snap-back.
What I'm watching next
Not whether DASH goes up or down from here. I'm watching whether volume expands or contracts as RSI stays pinned near this level over the next few sessions — that's what separates an overbought market that's about to run further from one that's about to give it all back.
#DASH #RSIAlert #Overbought #CryptoVolatility #TechnicalAnalysis
DASH Is At 85 RSI With Nothing Above It. That's Not a Green Light — It's a Fork.
Everyone chasing $DASH right now is reading the breakout as confirmation. I'm reading the RSI print as a question the chart hasn't answered yet.
An RSI near 85 with no immediate resistance overhead is one of the more binary setups in crypto. It doesn't tell you the direction of the next move. It tells you the current move is stretched further than usual, and stretched moves resolve one of two ways — they extend violently because there's nothing structurally in the way, or they snap because there's nothing structurally holding them up either. Same fact, two opposite outcomes, and the fact alone doesn't pick one.
The setup
FACT: DASH's RSI is printing near 85, per coverage — a level well into overbought territory by standard technical thresholds.
FACT: No immediate resistance level is currently identified above the current price.
INTERPRETATION: The absence of resistance means there's no obvious price ceiling forcing a pullback on technical grounds alone. That's the bull case for extension. But it also means there's no established support structure recently tested on the way up — the move has outrun the levels that would normally validate it. That's the bear case for a fast reversion.
There is no confirmed HYPOTHESIS on which way this resolves. Anyone telling you RSI at 85 is definitionally about to reverse, or definitionally about to keep running, is stating a rule of thumb as if it were a law. It isn't. Overbought conditions can persist for extended periods in strong trends, and they can also be the exact moment before a sharp mean reversion. The RSI level is a fact about stretch, not a forecast about direction.
Why the obvious read is incomplete
The standard reflex to a high RSI is "overbought, due for a pullback." That reflex exists because it's often right — most extreme RSI prints do eventually mean-revert. But "eventually" is doing a lot of work in that sentence. Extended RSI in an asset with genuinely fresh catalyst-driven demand can keep climbing well past what looks unsustainable, especially with no resistance forcing sellers to defend a level.
The market's possible blind spot isn't "DASH is overbought" — everyone can see that. The blind spot is treating overbought as a timing signal on its own, when it's really a volatility-and-magnitude signal. It tells you the next move is likely to be large. It doesn't tell you which way.
BEFORE → CHANGE → NOW → NEXT
BEFORE: DASH trading within a more typical range, RSI not flagged as extreme.
CHANGE: Price extension pushes RSI to ~85 with no resistance level identified above current price.
CURRENT STATE: Stretched technical condition, unresolved directionally, elevated volatility risk in either direction.
POSSIBLE NEXT: Continuation — RSI stays elevated or climbs further as the move extends with no ceiling to stop it, common when a fresh catalyst or momentum wave is still building. Or reversion — a sharp pullback as the extended move runs out of new buyers and profit-taking hits without any support level established to catch it.
The thesis, stated carefully
The evidence suggests DASH is at a genuine inflection point where the next move — in either direction — is likely to be sharp rather than gradual, given the combination of extreme RSI and the absence of overhead resistance. This is not a call that DASH will pump or dump. It's a statement that the current setup has low odds of just drifting sideways.
The bullish continuation case weakens if volume starts declining while price keeps grinding higher — a sign the move is running on thinner and thinner participation. The bearish reversion case weakens if price holds current levels for several sessions without a pullback, which would suggest the extension is being absorbed rather than chased.
What confirms which side wins
Not the RSI number itself — watch what happens to volume alongside it. Rising volume with rising price into further overbought territory favors continuation. Flat or declining volume at these levels, especially alongside any signs of stalling candles, favors a snap-back.
What I'm watching next
Not whether DASH goes up or down from here. I'm watching whether volume expands or contracts as RSI stays pinned near this level over the next few sessions — that's what separates an overbought market that's about to run further from one that's about to give it all back.
#DASH #RSIAlert #Overbought #CryptoVolatility #TechnicalAnalysis
An RSI near 85 with no immediate resistance overhead is one of the more binary setups in crypto. It doesn't tell you the direction of the next move. It tells you the current move is stretched further than usual, and stretched moves resolve one of two ways — they extend violently because there's nothing structurally in the way, or they snap because there's nothing structurally holding them up either. Same fact, two opposite outcomes, and the fact alone doesn't pick one.
The setup
FACT: DASH's RSI is printing near 85, per coverage — a level well into overbought territory by standard technical thresholds.
FACT: No immediate resistance level is currently identified above the current price.
INTERPRETATION: The absence of resistance means there's no obvious price ceiling forcing a pullback on technical grounds alone. That's the bull case for extension. But it also means there's no established support structure recently tested on the way up — the move has outrun the levels that would normally validate it. That's the bear case for a fast reversion.
There is no confirmed HYPOTHESIS on which way this resolves. Anyone telling you RSI at 85 is definitionally about to reverse, or definitionally about to keep running, is stating a rule of thumb as if it were a law. It isn't. Overbought conditions can persist for extended periods in strong trends, and they can also be the exact moment before a sharp mean reversion. The RSI level is a fact about stretch, not a forecast about direction.
Why the obvious read is incomplete
The standard reflex to a high RSI is "overbought, due for a pullback." That reflex exists because it's often right — most extreme RSI prints do eventually mean-revert. But "eventually" is doing a lot of work in that sentence. Extended RSI in an asset with genuinely fresh catalyst-driven demand can keep climbing well past what looks unsustainable, especially with no resistance forcing sellers to defend a level.
The market's possible blind spot isn't "DASH is overbought" — everyone can see that. The blind spot is treating overbought as a timing signal on its own, when it's really a volatility-and-magnitude signal. It tells you the next move is likely to be large. It doesn't tell you which way.
BEFORE → CHANGE → NOW → NEXT
BEFORE: DASH trading within a more typical range, RSI not flagged as extreme.
CHANGE: Price extension pushes RSI to ~85 with no resistance level identified above current price.
CURRENT STATE: Stretched technical condition, unresolved directionally, elevated volatility risk in either direction.
POSSIBLE NEXT: Continuation — RSI stays elevated or climbs further as the move extends with no ceiling to stop it, common when a fresh catalyst or momentum wave is still building. Or reversion — a sharp pullback as the extended move runs out of new buyers and profit-taking hits without any support level established to catch it.
The thesis, stated carefully
The evidence suggests DASH is at a genuine inflection point where the next move — in either direction — is likely to be sharp rather than gradual, given the combination of extreme RSI and the absence of overhead resistance. This is not a call that DASH will pump or dump. It's a statement that the current setup has low odds of just drifting sideways.
The bullish continuation case weakens if volume starts declining while price keeps grinding higher — a sign the move is running on thinner and thinner participation. The bearish reversion case weakens if price holds current levels for several sessions without a pullback, which would suggest the extension is being absorbed rather than chased.
What confirms which side wins
Not the RSI number itself — watch what happens to volume alongside it. Rising volume with rising price into further overbought territory favors continuation. Flat or declining volume at these levels, especially alongside any signs of stalling candles, favors a snap-back.
What I'm watching next
Not whether DASH goes up or down from here. I'm watching whether volume expands or contracts as RSI stays pinned near this level over the next few sessions — that's what separates an overbought market that's about to run further from one that's about to give it all back.
#DASH #RSIAlert #Overbought #CryptoVolatility #TechnicalAnalysis
2
4
1.8k
·
--
Verified
Everyone saw the $797M HYPE unlock.
Very few people asked how much of it would actually hit the market.
The September 6 unlock is worth roughly $797M on paper. But after Hyperliquid's March tranche, only about 1.75% of the unlocked HYPE was actually claimed.
If September plays out the same way, $797M of "available" supply could translate into roughly $14M of real exposure.
That's a massive gap — about 57x between the headline number and what actually got claimed last time.
Here's the part I think gets missed:
Unlocked doesn't mean sold.
Claimable doesn't mean market supply.
Most of these tokens go to core contributors, who may have very different reasons for holding.
Of course, March is one data point. I wouldn't assume the same 1.75% rate repeats.
So I'm watching two things now:
→ Actual on-chain claim rate
→ Exchange inflows
Because the $797M headline tells us what became available.
The next 30 days will tell us what actually mattered.
Everyone saw the $797M HYPE unlock.
Very few people asked how much of it would actually hit the market.
The September 6 unlock is worth roughly $797M on paper. But after Hyperliquid's March tranche, only about 1.75% of the unlocked HYPE was actually claimed.
If September plays out the same way, $797M of "available" supply could translate into roughly $14M of real exposure.
That's a massive gap — about 57x between the headline number and what actually got claimed last time.
Here's the part I think gets missed:
Unlocked doesn't mean sold.
Claimable doesn't mean market supply.
Most of these tokens go to core contributors, who may have very different reasons for holding.
Of course, March is one data point. I wouldn't assume the same 1.75% rate repeats.
So I'm watching two things now:
→ Actual on-chain claim rate
→ Exchange inflows
Because the $797M headline tells us what became available.
The next 30 days will tell us what actually mattered.
Very few people asked how much of it would actually hit the market.
The September 6 unlock is worth roughly $797M on paper. But after Hyperliquid's March tranche, only about 1.75% of the unlocked HYPE was actually claimed.
If September plays out the same way, $797M of "available" supply could translate into roughly $14M of real exposure.
That's a massive gap — about 57x between the headline number and what actually got claimed last time.
Here's the part I think gets missed:
Unlocked doesn't mean sold.
Claimable doesn't mean market supply.
Most of these tokens go to core contributors, who may have very different reasons for holding.
Of course, March is one data point. I wouldn't assume the same 1.75% rate repeats.
So I'm watching two things now:
→ Actual on-chain claim rate
→ Exchange inflows
Because the $797M headline tells us what became available.
The next 30 days will tell us what actually mattered.
1
159
·
--
Chainlink whale wallet count sitting at a multi-month high.
Infrastructure and oracle tokens tend to lead DeFi-narrative moves before the broader market catches on.
Wallets holding at least 1,000 $LINK climbed to 25,420 — the highest level in months.
No major catalyst named yet. No confirmed trigger.
Just early accumulation, quietly building while most eyes are elsewhere.
That's usually how these things start.
Chainlink whale wallet count sitting at a multi-month high.
Infrastructure and oracle tokens tend to lead DeFi-narrative moves before the broader market catches on.
Wallets holding at least 1,000 $LINK climbed to 25,420 — the highest level in months.
No major catalyst named yet. No confirmed trigger.
Just early accumulation, quietly building while most eyes are elsewhere.
That's usually how these things start.
Infrastructure and oracle tokens tend to lead DeFi-narrative moves before the broader market catches on.
Wallets holding at least 1,000 $LINK climbed to 25,420 — the highest level in months.
No major catalyst named yet. No confirmed trigger.
Just early accumulation, quietly building while most eyes are elsewhere.
That's usually how these things start.
1
303
·
--
🐋 Everyone's focused on $XRP whale outflows right now.
But something else caught my eye: whale inflows spiked at the same time.
In late August, whales pulled $231M worth of XRP off Binance in a single day — the biggest withdrawal in six months. But just days earlier, 30-day whale deposits into Binance hit 1.45B XRP, a four-month high.
Same whales. Same timeframe. Opposite moves.
So I don't think this is simple accumulation.
It looks more like large holders splitting on what to do, right before tomorrow's CLARITY Act cloture vote.
That's what makes this interesting.
Most whale-flow charts tell one clear story. This one doesn't.
I'll be watching what happens after the vote — does this split close up, or does it widen even more?
That might tell us more than the headline number ever could.
🐋 Everyone's focused on $XRP whale outflows right now.
But something else caught my eye: whale inflows spiked at the same time.
In late August, whales pulled $231M worth of XRP off Binance in a single day — the biggest withdrawal in six months. But just days earlier, 30-day whale deposits into Binance hit 1.45B XRP, a four-month high.
Same whales. Same timeframe. Opposite moves.
So I don't think this is simple accumulation.
It looks more like large holders splitting on what to do, right before tomorrow's CLARITY Act cloture vote.
That's what makes this interesting.
Most whale-flow charts tell one clear story. This one doesn't.
I'll be watching what happens after the vote — does this split close up, or does it widen even more?
That might tell us more than the headline number ever could.
But something else caught my eye: whale inflows spiked at the same time.
In late August, whales pulled $231M worth of XRP off Binance in a single day — the biggest withdrawal in six months. But just days earlier, 30-day whale deposits into Binance hit 1.45B XRP, a four-month high.
Same whales. Same timeframe. Opposite moves.
So I don't think this is simple accumulation.
It looks more like large holders splitting on what to do, right before tomorrow's CLARITY Act cloture vote.
That's what makes this interesting.
Most whale-flow charts tell one clear story. This one doesn't.
I'll be watching what happens after the vote — does this split close up, or does it widen even more?
That might tell us more than the headline number ever could.
1
1.1k
·
--
$MBL — The Micro-Cap Momentum
{spot}(MBLUSDT)
$MBL is quietly climbing while the market watches bigger gainers.
📊 Price: $0.000905
📈 24H: +21.80%
This is the kind of move that can easily get overlooked.
The important question isn't whether +21% looks impressive.
It's whether attention is starting to rotate toward lower-priced tokens.
I'm watching for sustained volume and whether buyers can defend the new zone.
If momentum holds → narrative can strengthen.
If the move gets completely retraced → today's attention may have been temporary.
The real signal isn't the green candle. It's whether the market keeps caring tomorrow.
$MBL
#MBL #MicroCap #Altcoins
$MBL — The Micro-Cap Momentum
$MBL is quietly climbing while the market watches bigger gainers.
📊 Price: $0.000905
📈 24H: +21.80%
This is the kind of move that can easily get overlooked.
The important question isn't whether +21% looks impressive.
It's whether attention is starting to rotate toward lower-priced tokens.
I'm watching for sustained volume and whether buyers can defend the new zone.
If momentum holds → narrative can strengthen.
If the move gets completely retraced → today's attention may have been temporary.
The real signal isn't the green candle. It's whether the market keeps caring tomorrow.
$MBL
#MBL #MicroCap #Altcoins
$MBL is quietly climbing while the market watches bigger gainers.
📊 Price: $0.000905
📈 24H: +21.80%
This is the kind of move that can easily get overlooked.
The important question isn't whether +21% looks impressive.
It's whether attention is starting to rotate toward lower-priced tokens.
I'm watching for sustained volume and whether buyers can defend the new zone.
If momentum holds → narrative can strengthen.
If the move gets completely retraced → today's attention may have been temporary.
The real signal isn't the green candle. It's whether the market keeps caring tomorrow.
$MBL
#MBL #MicroCap #Altcoins
2
88
·
--
Verified
Prediction markets just printed a number that should make Wall Street pay attention.
Polymarket + Kalshi hit $48.4B in combined trading volume in August, with Kalshi contributing roughly $40B.
Kalshi also crossed $400M in monthly commodity volume only seven months after launch.
Then Polymarket hired its first CFO, Warren Jenson, signaling a serious push toward financial-market scale.
The hidden angle: this may not be about replacing betting or polling. It’s about turning probability itself into tradable information.
The thesis strengthens if institutional participation and event-contract volume keep expanding.
Confirmation: sustained growth across commodities and financial events.
Invalidation: volume fades after the current expansion cycle.
Are prediction markets becoming a new financial information layer? Drop your take.
#PredictionMarkets #Polymarket #Kalshi #FinTech #Crypto
Prediction markets just printed a number that should make Wall Street pay attention.
Polymarket + Kalshi hit $48.4B in combined trading volume in August, with Kalshi contributing roughly $40B.
Kalshi also crossed $400M in monthly commodity volume only seven months after launch.
Then Polymarket hired its first CFO, Warren Jenson, signaling a serious push toward financial-market scale.
The hidden angle: this may not be about replacing betting or polling. It’s about turning probability itself into tradable information.
The thesis strengthens if institutional participation and event-contract volume keep expanding.
Confirmation: sustained growth across commodities and financial events.
Invalidation: volume fades after the current expansion cycle.
Are prediction markets becoming a new financial information layer? Drop your take.
#PredictionMarkets #Polymarket #Kalshi #FinTech #Crypto
Polymarket + Kalshi hit $48.4B in combined trading volume in August, with Kalshi contributing roughly $40B.
Kalshi also crossed $400M in monthly commodity volume only seven months after launch.
Then Polymarket hired its first CFO, Warren Jenson, signaling a serious push toward financial-market scale.
The hidden angle: this may not be about replacing betting or polling. It’s about turning probability itself into tradable information.
The thesis strengthens if institutional participation and event-contract volume keep expanding.
Confirmation: sustained growth across commodities and financial events.
Invalidation: volume fades after the current expansion cycle.
Are prediction markets becoming a new financial information layer? Drop your take.
#PredictionMarkets #Polymarket #Kalshi #FinTech #Crypto
2
58
·
--
Bullish
Verified
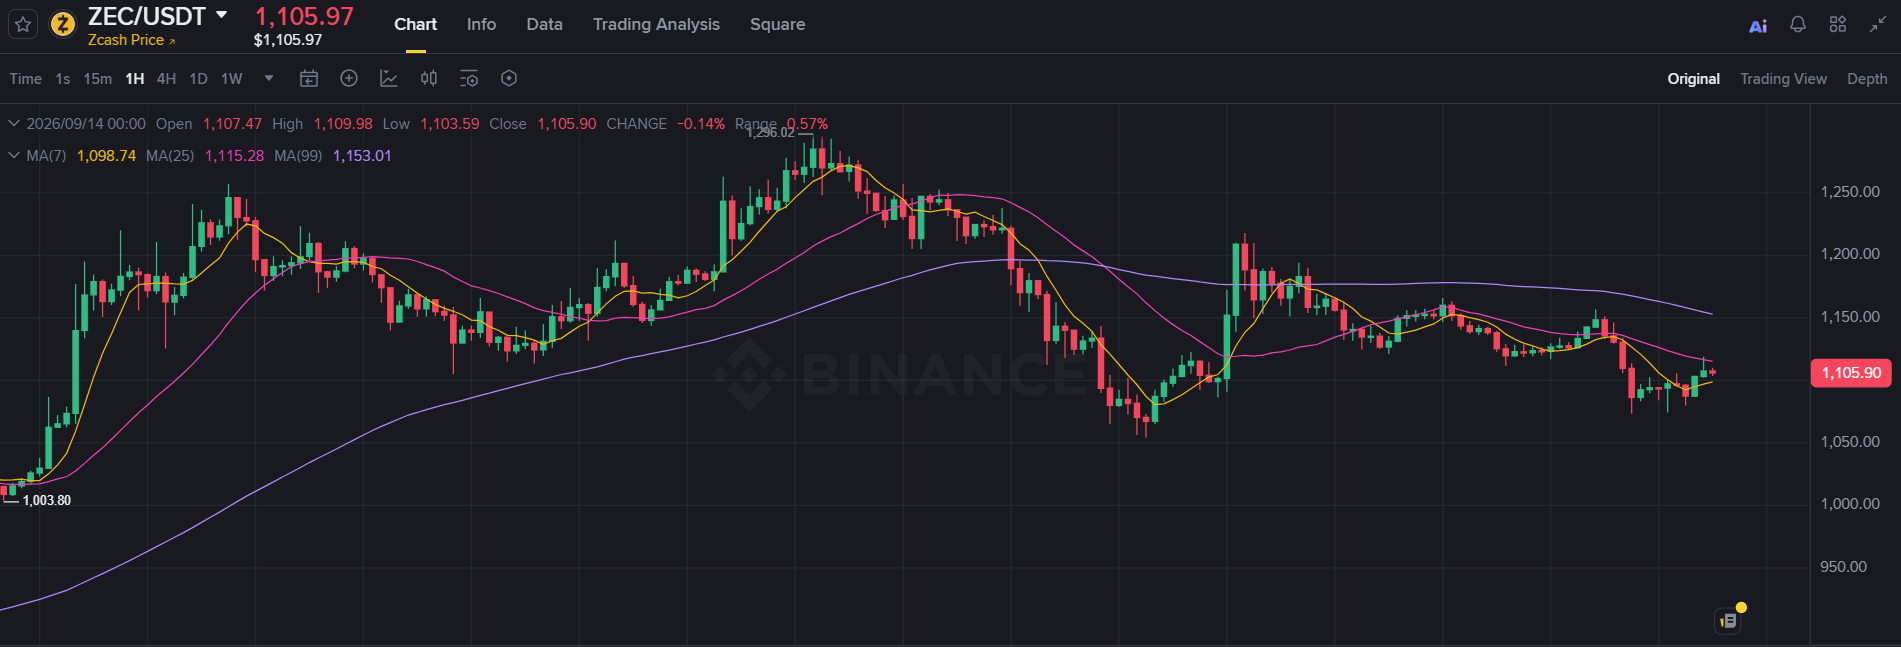
ZEC may have a bigger story than its price — and most traders are looking at the wrong signal.
Since ZCSH launched on NYSE Arca, AUM crossed $500M in less than two weeks, with $70M+ in cumulative inflows.
Then came the bigger transaction: DCG exchanged 85,705 ZEC for roughly $100M of ETF shares.
That changes the question.
Can regulated demand absorb a relatively limited ZEC supply faster than the market expects?
The thesis strengthens if ETF accumulation continues.
Confirmation: sustained spot inflows.
Invalidation: institutional flows fade.
Institutional privacy trade or early signal?
#Zcash #Crypto #PrivacyCoins #InstitutionalCrypto
ZEC may have a bigger story than its price — and most traders are looking at the wrong signal.
Since ZCSH launched on NYSE Arca, AUM crossed $500M in less than two weeks, with $70M+ in cumulative inflows.
Then came the bigger transaction: DCG exchanged 85,705 ZEC for roughly $100M of ETF shares.
That changes the question.
Can regulated demand absorb a relatively limited ZEC supply faster than the market expects?
The thesis strengthens if ETF accumulation continues.
Confirmation: sustained spot inflows.
Invalidation: institutional flows fade.
Institutional privacy trade or early signal?
#Zcash #Crypto #PrivacyCoins #InstitutionalCrypto
Since ZCSH launched on NYSE Arca, AUM crossed $500M in less than two weeks, with $70M+ in cumulative inflows.
Then came the bigger transaction: DCG exchanged 85,705 ZEC for roughly $100M of ETF shares.
That changes the question.
Can regulated demand absorb a relatively limited ZEC supply faster than the market expects?
The thesis strengthens if ETF accumulation continues.
Confirmation: sustained spot inflows.
Invalidation: institutional flows fade.
Institutional privacy trade or early signal?
#Zcash #Crypto #PrivacyCoins #InstitutionalCrypto
2
726
·
--
Verified
$WLFI is up 10.86% while fighting a $45M lawsuit in open court. That combination alone should make you pause.
What changed: a California federal court just denied WLFI's request to move Justin Sun's token-freeze case into private arbitration. It's now headed to open court, not settled behind closed doors.
Evidence: $45M in disputed tokens. ~$7.7M spent on buybacks at $0.16. Price still down roughly 75% from its 2025 high. Top 9 wallets reportedly hold ~60% of governance voting power.
Hidden angle: most people are trading the headline, not the governance structure behind it. A public trial could expose internal practices that a private arbitration never would have.
Thesis strengthens if the case proceeds to discovery and details go public. Thesis breaks if it's quietly settled or dismissed early.
Confirmation: court scheduling moves forward with public filings.
Invalidation: a settlement makes the case disappear from headlines.
Bullish or trap — vote in comments.
$PROM
{spot}(PROMUSDT)
$MTL
{spot}(MTLUSDT)
#WLFI #WorldLibertyFinancial #CryptoLitigation #TrumpCrypto #BinanceSquare
$WLFI is up 10.86% while fighting a $45M lawsuit in open court. That combination alone should make you pause.
What changed: a California federal court just denied WLFI's request to move Justin Sun's token-freeze case into private arbitration. It's now headed to open court, not settled behind closed doors.
Evidence: $45M in disputed tokens. ~$7.7M spent on buybacks at $0.16. Price still down roughly 75% from its 2025 high. Top 9 wallets reportedly hold ~60% of governance voting power.
Hidden angle: most people are trading the headline, not the governance structure behind it. A public trial could expose internal practices that a private arbitration never would have.
Thesis strengthens if the case proceeds to discovery and details go public. Thesis breaks if it's quietly settled or dismissed early.
Confirmation: court scheduling moves forward with public filings.
Invalidation: a settlement makes the case disappear from headlines.
Bullish or trap — vote in comments.
$PROM
$MTL
#WLFI #WorldLibertyFinancial #CryptoLitigation #TrumpCrypto #BinanceSquare
What changed: a California federal court just denied WLFI's request to move Justin Sun's token-freeze case into private arbitration. It's now headed to open court, not settled behind closed doors.
Evidence: $45M in disputed tokens. ~$7.7M spent on buybacks at $0.16. Price still down roughly 75% from its 2025 high. Top 9 wallets reportedly hold ~60% of governance voting power.
Hidden angle: most people are trading the headline, not the governance structure behind it. A public trial could expose internal practices that a private arbitration never would have.
Thesis strengthens if the case proceeds to discovery and details go public. Thesis breaks if it's quietly settled or dismissed early.
Confirmation: court scheduling moves forward with public filings.
Invalidation: a settlement makes the case disappear from headlines.
Bullish or trap — vote in comments.
$PROM
$MTL
#WLFI #WorldLibertyFinancial #CryptoLitigation #TrumpCrypto #BinanceSquare

2
292
·
--
Verified
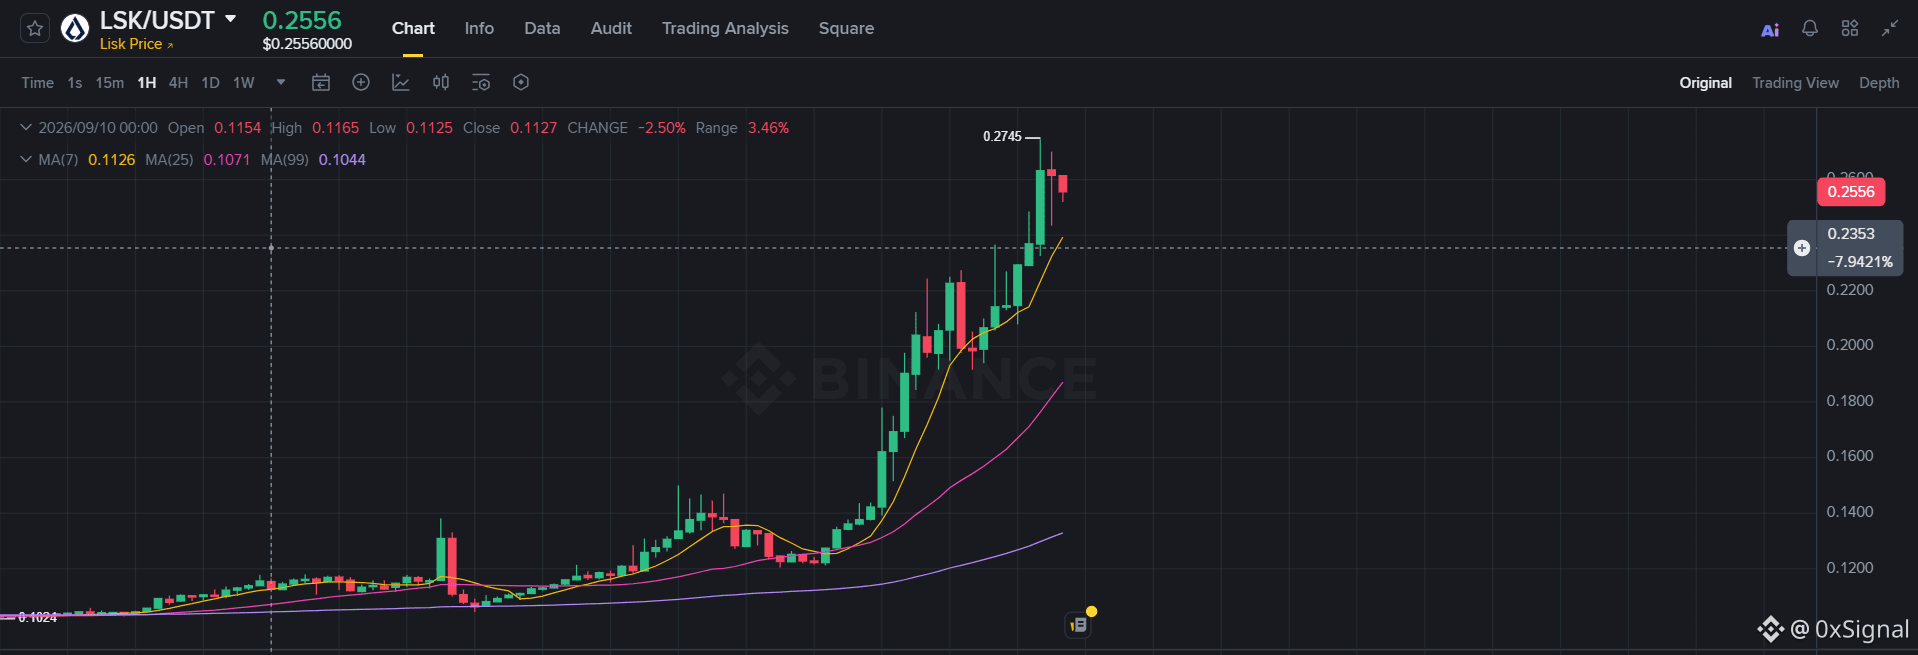
$LSK just pumped 107% in a day.
Here's the twist: the chain is actually shutting down on October 31.
They're burning 25% of the supply and turning LSK into a "loyalty token" for enterprise use.
Feels like people are trading the burn, not the future. Once that fades, thin liquidity could make this move reverse fast.
Are you buying this pump or staying away?
Save for later.
$VET
{spot}(VETUSDT)
$ZEC
{spot}(ZECUSDT)
#LSK #Lisk #CryptoBurn #AltcoinSeason #BinanceSquare
$LSK just pumped 107% in a day.
Here's the twist: the chain is actually shutting down on October 31.
They're burning 25% of the supply and turning LSK into a "loyalty token" for enterprise use.
Feels like people are trading the burn, not the future. Once that fades, thin liquidity could make this move reverse fast.
Are you buying this pump or staying away?
Save for later.
$VET
$ZEC
#LSK #Lisk #CryptoBurn #AltcoinSeason #BinanceSquare
Here's the twist: the chain is actually shutting down on October 31.
They're burning 25% of the supply and turning LSK into a "loyalty token" for enterprise use.
Feels like people are trading the burn, not the future. Once that fades, thin liquidity could make this move reverse fast.
Are you buying this pump or staying away?
Save for later.
$VET
$ZEC
#LSK #Lisk #CryptoBurn #AltcoinSeason #BinanceSquare
2
1
2
1.3k
·
--
Guys, everyone's treating this week like one giant ball of uncertainty.
I don't think that's accurate. 🧵
Let's look at the actual numbers instead of the vibes.
CLARITY Act — the crypto market-structure bill everyone's been waiting on — had an 82% chance of becoming law back in February.
Today? 13-16%.
That's not "uncertain." That's the market having already made up its mind.
Meanwhile the Fed decision on Sept 16 is doing the opposite.
Hike odds have swung 20+ points in a single week — anywhere from 53% to 70% depending on which venue you check.
That's genuinely live. Nobody's decided yet.
So here's the mix-up I'm seeing everywhere:
People are lumping "CLARITY vote" and "Fed decision" together as two unknowns in the same scary week.
They're not the same kind of unknown.
One's basically resolved in expectation. The other could still surprise.
Now stack that against what's actually driving ETH's move right now.
$255M+ in ETH shorts got liquidated Sept 11. Another $311M+ wave hit within 24 hours.
That's the price move — mostly short-covering, not fresh spot conviction.
Real money IS coming in too — ETH ETFs pulled $216M in a single day while BTC ETFs bled for a 4th straight day. That rotation is real.
But it's smaller than the leverage-driven swings we've already seen this week.
So the actual setup:
A mostly-leverage rally, sitting right under the one catalyst in this whole "scary week" that's still genuinely unresolved.
Not CLARITY. The Fed.
What would tell you I'm wrong: a hawkish surprise on the 16th gets absorbed calmly, no real give-back. That would mean the market's already looking past even the live risk — worth knowing either way.
What I'm watching: Fed odds into the 16th, and whether ETH open interest is quietly rebuilding after this week's squeeze.
Not a buy/sell call. Just — know which risk in the room is actually still a risk. DYOR.
Which one are you more focused on going into next week — the Fed, or the vote? 👇
#ETH #FOMC #CryptoRegulation #0xSignal #BinanceSquareFamily
Guys, everyone's treating this week like one giant ball of uncertainty.
I don't think that's accurate. 🧵
Let's look at the actual numbers instead of the vibes.
CLARITY Act — the crypto market-structure bill everyone's been waiting on — had an 82% chance of becoming law back in February.
Today? 13-16%.
That's not "uncertain." That's the market having already made up its mind.
Meanwhile the Fed decision on Sept 16 is doing the opposite.
Hike odds have swung 20+ points in a single week — anywhere from 53% to 70% depending on which venue you check.
That's genuinely live. Nobody's decided yet.
So here's the mix-up I'm seeing everywhere:
People are lumping "CLARITY vote" and "Fed decision" together as two unknowns in the same scary week.
They're not the same kind of unknown.
One's basically resolved in expectation. The other could still surprise.
Now stack that against what's actually driving ETH's move right now.
$255M+ in ETH shorts got liquidated Sept 11. Another $311M+ wave hit within 24 hours.
That's the price move — mostly short-covering, not fresh spot conviction.
Real money IS coming in too — ETH ETFs pulled $216M in a single day while BTC ETFs bled for a 4th straight day. That rotation is real.
But it's smaller than the leverage-driven swings we've already seen this week.
So the actual setup:
A mostly-leverage rally, sitting right under the one catalyst in this whole "scary week" that's still genuinely unresolved.
Not CLARITY. The Fed.
What would tell you I'm wrong: a hawkish surprise on the 16th gets absorbed calmly, no real give-back. That would mean the market's already looking past even the live risk — worth knowing either way.
What I'm watching: Fed odds into the 16th, and whether ETH open interest is quietly rebuilding after this week's squeeze.
Not a buy/sell call. Just — know which risk in the room is actually still a risk. DYOR.
Which one are you more focused on going into next week — the Fed, or the vote? 👇
#ETH #FOMC #CryptoRegulation #0xSignal #BinanceSquareFamily
I don't think that's accurate. 🧵
Let's look at the actual numbers instead of the vibes.
CLARITY Act — the crypto market-structure bill everyone's been waiting on — had an 82% chance of becoming law back in February.
Today? 13-16%.
That's not "uncertain." That's the market having already made up its mind.
Meanwhile the Fed decision on Sept 16 is doing the opposite.
Hike odds have swung 20+ points in a single week — anywhere from 53% to 70% depending on which venue you check.
That's genuinely live. Nobody's decided yet.
So here's the mix-up I'm seeing everywhere:
People are lumping "CLARITY vote" and "Fed decision" together as two unknowns in the same scary week.
They're not the same kind of unknown.
One's basically resolved in expectation. The other could still surprise.
Now stack that against what's actually driving ETH's move right now.
$255M+ in ETH shorts got liquidated Sept 11. Another $311M+ wave hit within 24 hours.
That's the price move — mostly short-covering, not fresh spot conviction.
Real money IS coming in too — ETH ETFs pulled $216M in a single day while BTC ETFs bled for a 4th straight day. That rotation is real.
But it's smaller than the leverage-driven swings we've already seen this week.
So the actual setup:
A mostly-leverage rally, sitting right under the one catalyst in this whole "scary week" that's still genuinely unresolved.
Not CLARITY. The Fed.
What would tell you I'm wrong: a hawkish surprise on the 16th gets absorbed calmly, no real give-back. That would mean the market's already looking past even the live risk — worth knowing either way.
What I'm watching: Fed odds into the 16th, and whether ETH open interest is quietly rebuilding after this week's squeeze.
Not a buy/sell call. Just — know which risk in the room is actually still a risk. DYOR.
Which one are you more focused on going into next week — the Fed, or the vote? 👇
#ETH #FOMC #CryptoRegulation #0xSignal #BinanceSquareFamily

2
156
·
--
Full breakdown of the $DASH thesis — the tech, the tokenomics, the risks, and what data we're watching next (shielded tx volume, active addresses, merchant count) — is in the report. What's your read: does DASH earn a seat next to ZEC/XMR, or is this a narrative rotation that fades? Drop your view below.
#DASH #0xSignal
Full breakdown of the $DASH thesis — the tech, the tokenomics, the risks, and what data we're watching next (shielded tx volume, active addresses, merchant count) — is in the report. What's your read: does DASH earn a seat next to ZEC/XMR, or is this a narrative rotation that fades? Drop your view below.
#DASH #0xSignal
#DASH #0xSignal
3
304
·
--
Three scenarios, no prediction attached:
🐂 Bull: shielded adoption grows, Android beta lands well, $DASH re-rates toward ZEC/XMR-style valuations.
⚖️ Base: hype fades once the conference cycle ends, market waits for real usage data before re-rating further.
🐻 Bear: adoption disappoints, regulation tightens, liquidity stays thin — price gives back the DashCon-era gains, back toward the $30-40 zone.
#DASH #0xSignal
Three scenarios, no prediction attached:
🐂 Bull: shielded adoption grows, Android beta lands well, $DASH re-rates toward ZEC/XMR-style valuations.
⚖️ Base: hype fades once the conference cycle ends, market waits for real usage data before re-rating further.
🐻 Bear: adoption disappoints, regulation tightens, liquidity stays thin — price gives back the DashCon-era gains, back toward the $30-40 zone.
#DASH #0xSignal
🐂 Bull: shielded adoption grows, Android beta lands well, $DASH re-rates toward ZEC/XMR-style valuations.
⚖️ Base: hype fades once the conference cycle ends, market waits for real usage data before re-rating further.
🐻 Bear: adoption disappoints, regulation tightens, liquidity stays thin — price gives back the DashCon-era gains, back toward the $30-40 zone.
#DASH #0xSignal
2
161
·
--
Partly True
Team/execution history: $DASH Core Group led by Ryan Taylor since 2017, ~40-person team. 10% treasury funding model gives it a native dev-funding mechanism most projects don't have. But Evolution took years longer than originally planned, and shielded features slipped multiple times before finally shipping in August. Track record: real, but slow.
#DASH #0xSignal
Team/execution history: $DASH Core Group led by Ryan Taylor since 2017, ~40-person team. 10% treasury funding model gives it a native dev-funding mechanism most projects don't have. But Evolution took years longer than originally planned, and shielded features slipped multiple times before finally shipping in August. Track record: real, but slow.
#DASH #0xSignal
#DASH #0xSignal
2
281
·
--
Regulatory reality check: $DASH carries an "Alleged SEC Securities" tag on major trackers, and has already been delisted from Bybit (DASH/USDT) and OKX (Jan 2026). Privacy coins broadly face tightening EU rules expected to phase in by 2027. This is a real, ongoing risk factor — not FUD.
#DASH #0xSignal
Regulatory reality check: $DASH carries an "Alleged SEC Securities" tag on major trackers, and has already been delisted from Bybit (DASH/USDT) and OKX (Jan 2026). Privacy coins broadly face tightening EU rules expected to phase in by 2027. This is a real, ongoing risk factor — not FUD.
#DASH #0xSignal
#DASH #0xSignal
3
204
·
--
@SulemaOFCrypto Bro Write about $SUI
{spot}(SUIUSDT)
@Sulaiman 零号猎人 Bro Write about $SUI

Sulaiman 零号猎人
·
--
$SUI
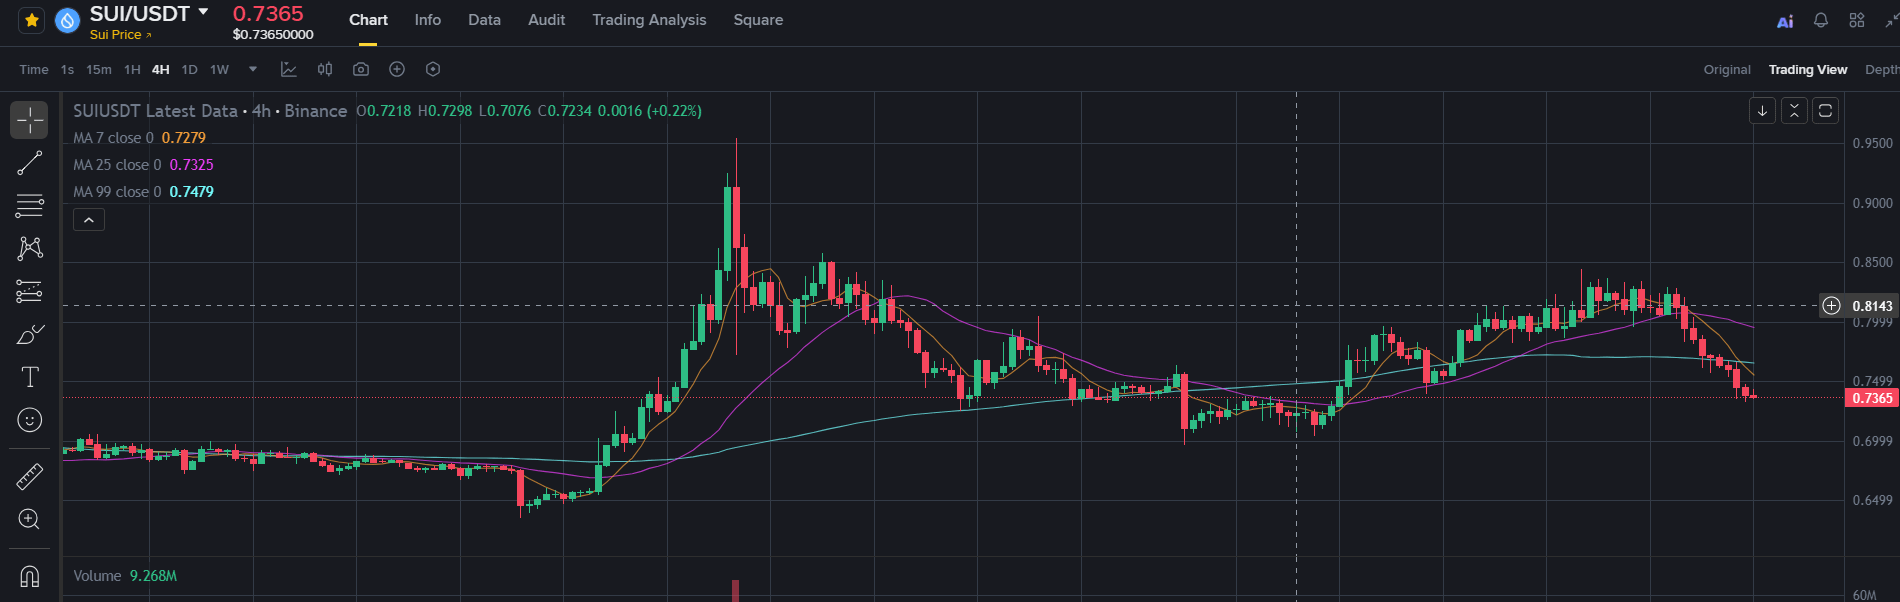
SUI has been falling for a long time, and now it finally looks like it's trying to stop.
The price rebounded off its lows and is holding steady instead of dropping further.
That doesn't mean the fall is over, but it's the first real sign buyers are stepping back in.
Watching to see if it holds. Bullish or too early?
Follow for updates.
SUI has been falling for a long time, and now it finally looks like it's trying to stop.
The price rebounded off its lows and is holding steady instead of dropping further.
That doesn't mean the fall is over, but it's the first real sign buyers are stepping back in.
Watching to see if it holds. Bullish or too early?
Follow for updates.
2
49
·
--
$RAY
$RAY
Sulaiman 零号猎人
·
--
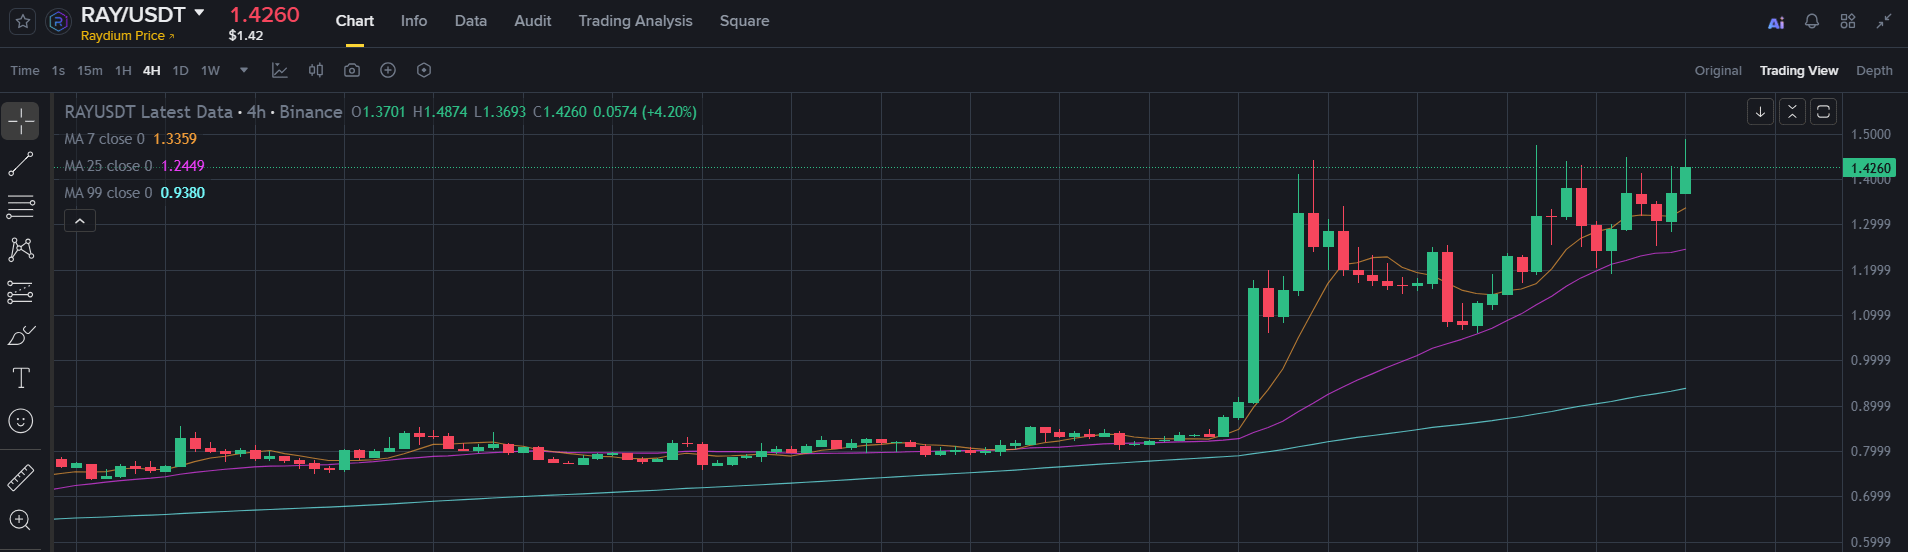
Raydium's token supply is shrinking while most alts inflate. Nobody's pricing that in.
RAY buybacks hit $640K in a single day, the largest in 19 months, pushing cumulative repurchases past 30% of circulating supply, funded entirely by protocol fees.
$640K buyback, Sept 9, 19-month high
Q2 xStocks volume: $1.63B, tripled YoY
RAY reclaimed $1 after June's $0.53 low
12% of every swap fee auto-routes to buybacks, on-chain
Hidden angle: Market treats this as a memecoin bounce. It's a fee-buyback flywheel, closer to equity buybacks than speculation.
Supply compression plus expanding fees creates asymmetric upside if volume holds through the Sept 14 Solana Summit, where SEC Chair Atkins headlines.
Buyback pace sustains post-Summit.
xStocks volume stalls, breaking the flywheel.
Undervalued deflationary mechanism, or a narrative that fades after the Summit?
#RAYBuyback #SolanaSummit2026 #xStocks #DeflationaryDeFi #RaydiumFlywheel
RAY buybacks hit $640K in a single day, the largest in 19 months, pushing cumulative repurchases past 30% of circulating supply, funded entirely by protocol fees.
$640K buyback, Sept 9, 19-month high
Q2 xStocks volume: $1.63B, tripled YoY
RAY reclaimed $1 after June's $0.53 low
12% of every swap fee auto-routes to buybacks, on-chain
Hidden angle: Market treats this as a memecoin bounce. It's a fee-buyback flywheel, closer to equity buybacks than speculation.
Supply compression plus expanding fees creates asymmetric upside if volume holds through the Sept 14 Solana Summit, where SEC Chair Atkins headlines.
Buyback pace sustains post-Summit.
xStocks volume stalls, breaking the flywheel.
Undervalued deflationary mechanism, or a narrative that fades after the Summit?
#RAYBuyback #SolanaSummit2026 #xStocks #DeflationaryDeFi #RaydiumFlywheel
1
4
·
--
Bullish
Sulaiman 零号猎人
·
--
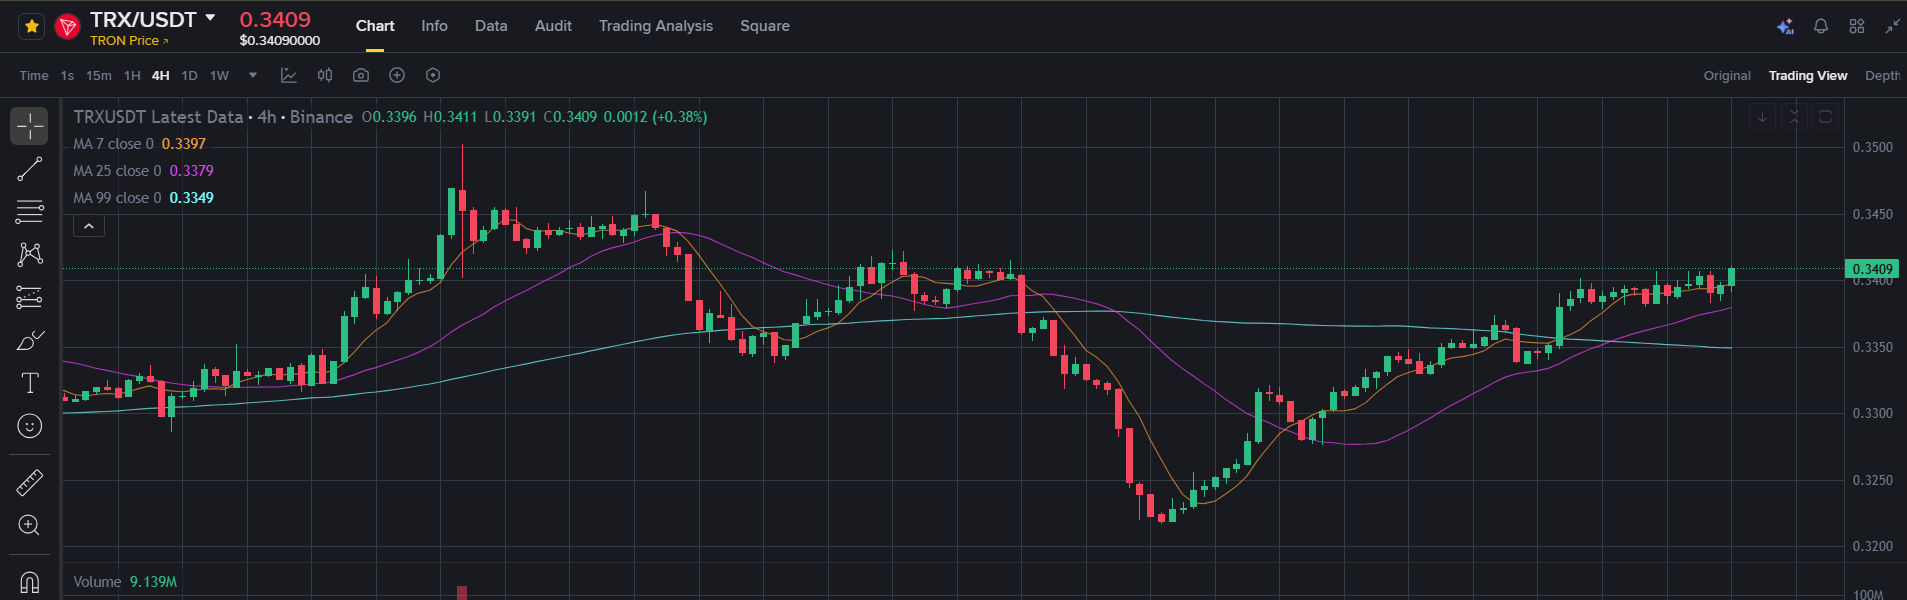
TRX just got its first-ever US ETF, and honestly, the price is barely reacting.
Canary Capital launched a staked TRX ETF on Cboe this week. That's real institutional access, first of its kind for this coin. Justin Sun called it a huge moment.
Meanwhile network usage is stronger than ever — stablecoin volume on TRON just crossed $28 billion in locked value. But price is still stuck in the same range it's been fighting for weeks.
Feels like the news hasn't caught up to the price yet, or the market just isn't convinced yet.
What do you think — is this ETF a real turning point or just noise for now?
#TRX #TRXETF #Tron
Canary Capital launched a staked TRX ETF on Cboe this week. That's real institutional access, first of its kind for this coin. Justin Sun called it a huge moment.
Meanwhile network usage is stronger than ever — stablecoin volume on TRON just crossed $28 billion in locked value. But price is still stuck in the same range it's been fighting for weeks.
Feels like the news hasn't caught up to the price yet, or the market just isn't convinced yet.
What do you think — is this ETF a real turning point or just noise for now?
#TRX #TRXETF #Tron
3
3
·
--
Sulaiman 零号猎人
·
--
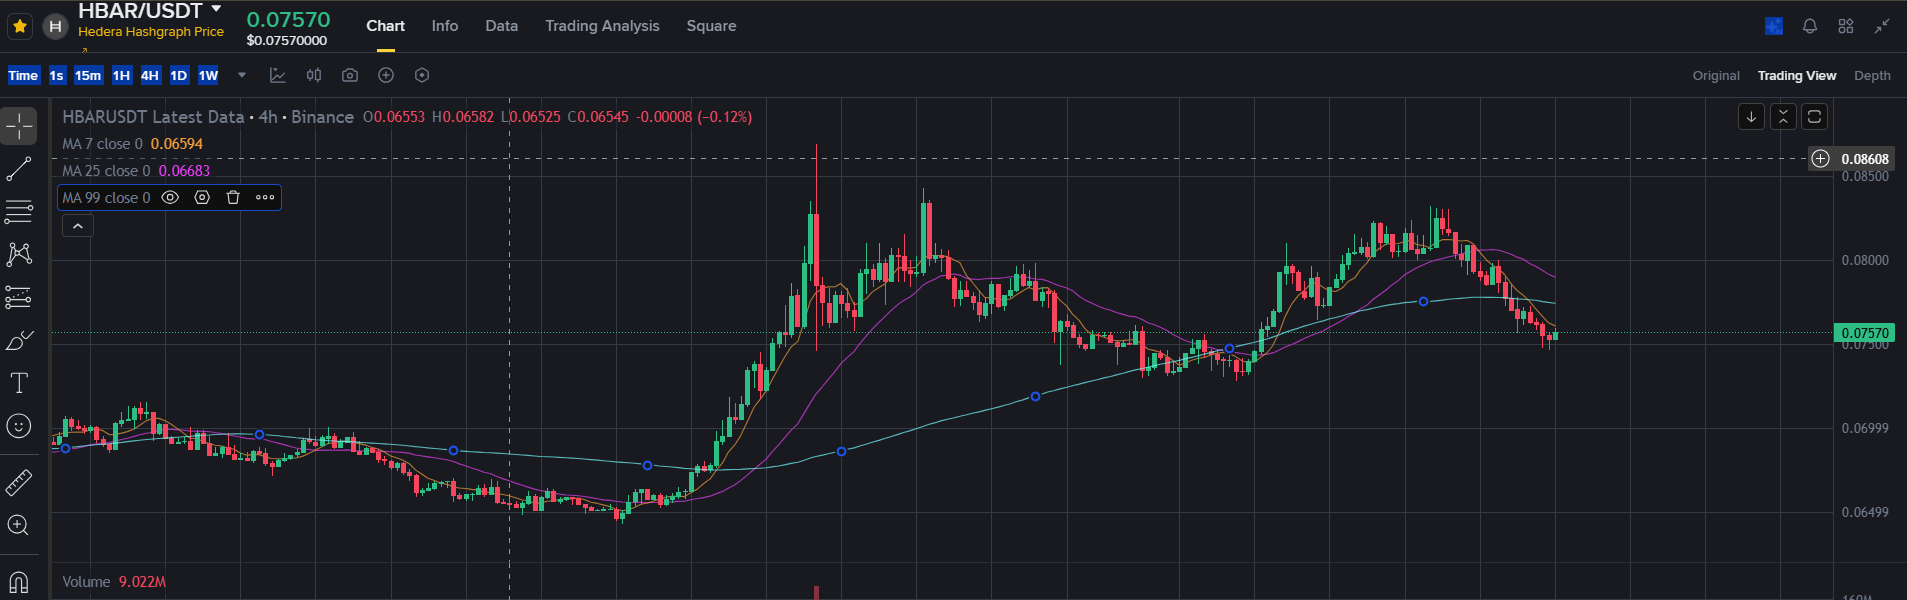
HBAR tried to break out again this month and buyers just couldn't push it through — same story as last time. Right now the coin feels stuck, caught between people wanting to buy the dip and others still taking profits, with neither side really winning.
#hbar #HBARUSDT
#hbar #HBARUSDT
1
15
·
--
Just flagging — $CL isn't a crypto token. It's Binance's WTI crude oil perpetual (launched April 2026), not a coin. But the move underneath is genuinely relevant to crypto right now.
Everyone's watching the calm on BTC today.
But the real signal is oil quietly ripping in the background.
WTI just hit $97.19, up over 15% in 30 days and its highest level since May — driven by escalating US-Iran tensions, attacks near the Strait of Hormuz, and Houthi strikes on Saudi energy infrastructure.
Here's why that matters for crypto: rising oil feeds directly into inflation expectations, right into a week where CME FedWatch already prices a 56-63% chance of a Fed rate *hike* on September 16.
Oil spiking into a hawkish Fed decision is not a background story — it's a direct input to it.
I'd watch whether WTI holds above $95 into today's CPI print. A hot number plus expensive oil is the combination that could push hike odds even higher.
Is the crypto market pricing in this oil-inflation link at all yet?
#WTI #FOMC #Inflation #CL
Just flagging — $CL isn't a crypto token. It's Binance's WTI crude oil perpetual (launched April 2026), not a coin. But the move underneath is genuinely relevant to crypto right now.
Everyone's watching the calm on BTC today.
But the real signal is oil quietly ripping in the background.
WTI just hit $97.19, up over 15% in 30 days and its highest level since May — driven by escalating US-Iran tensions, attacks near the Strait of Hormuz, and Houthi strikes on Saudi energy infrastructure.
Here's why that matters for crypto: rising oil feeds directly into inflation expectations, right into a week where CME FedWatch already prices a 56-63% chance of a Fed rate *hike* on September 16.
Oil spiking into a hawkish Fed decision is not a background story — it's a direct input to it.
I'd watch whether WTI holds above $95 into today's CPI print. A hot number plus expensive oil is the combination that could push hike odds even higher.
Is the crypto market pricing in this oil-inflation link at all yet?
#WTI #FOMC #Inflation #CL
Everyone's watching the calm on BTC today.
But the real signal is oil quietly ripping in the background.
WTI just hit $97.19, up over 15% in 30 days and its highest level since May — driven by escalating US-Iran tensions, attacks near the Strait of Hormuz, and Houthi strikes on Saudi energy infrastructure.
Here's why that matters for crypto: rising oil feeds directly into inflation expectations, right into a week where CME FedWatch already prices a 56-63% chance of a Fed rate *hike* on September 16.
Oil spiking into a hawkish Fed decision is not a background story — it's a direct input to it.
I'd watch whether WTI holds above $95 into today's CPI print. A hot number plus expensive oil is the combination that could push hike odds even higher.
Is the crypto market pricing in this oil-inflation link at all yet?
#WTI #FOMC #Inflation #CL
1
2
149
Log in to explore more content
Join global crypto users on Binance Square
⚡️ Get latest and useful information about crypto.
💬 Trusted by the world’s largest crypto exchange.
👍 Discover real insights from verified creators.
Email / Phone number
Trending Topics
AnthropicCEOCallsForAISlowdown
118,950 views
2,003 Discussing
#anthropicceocallsforaislowdown
Rivals Unite: Altman, Musk and Others Back the Slowdown CallWithin hours of Amodei’s essay, OpenAI CEO Sam Altman publicly agreed that the industry needs to “pace the frontier,” noting it had already been a major internal discussion at OpenAI. Elon Musk of xAI simply posted “Dario is right.” Reports also noted support from other leading figures including Demis Hassabis. This rare public alignment among fierce competitors underscores how seriously the top labs now view the accelerating risks. The industry appears to be shifting from pure speed toward coordinated caution.
$BR
$BTW
$REZ
Crypto Futrures Afridi
·3 Likes
·2k views
RevolutDataLeakReportedlyPostedAttackersThreatenDailyReleases
630 views
28 Discussing
BrazilCentralBankRaisesVASPCapitalRequirements
2,213 views
166 Discussing