
Sean Paul UA
41 Posts

Sean Paul UA
Report
Block User
5 Following
4 Followers
34 Liked
Posts
·
--
Saylor buy speculation is back in Square's trends. I'm watching where the funding actually goes.
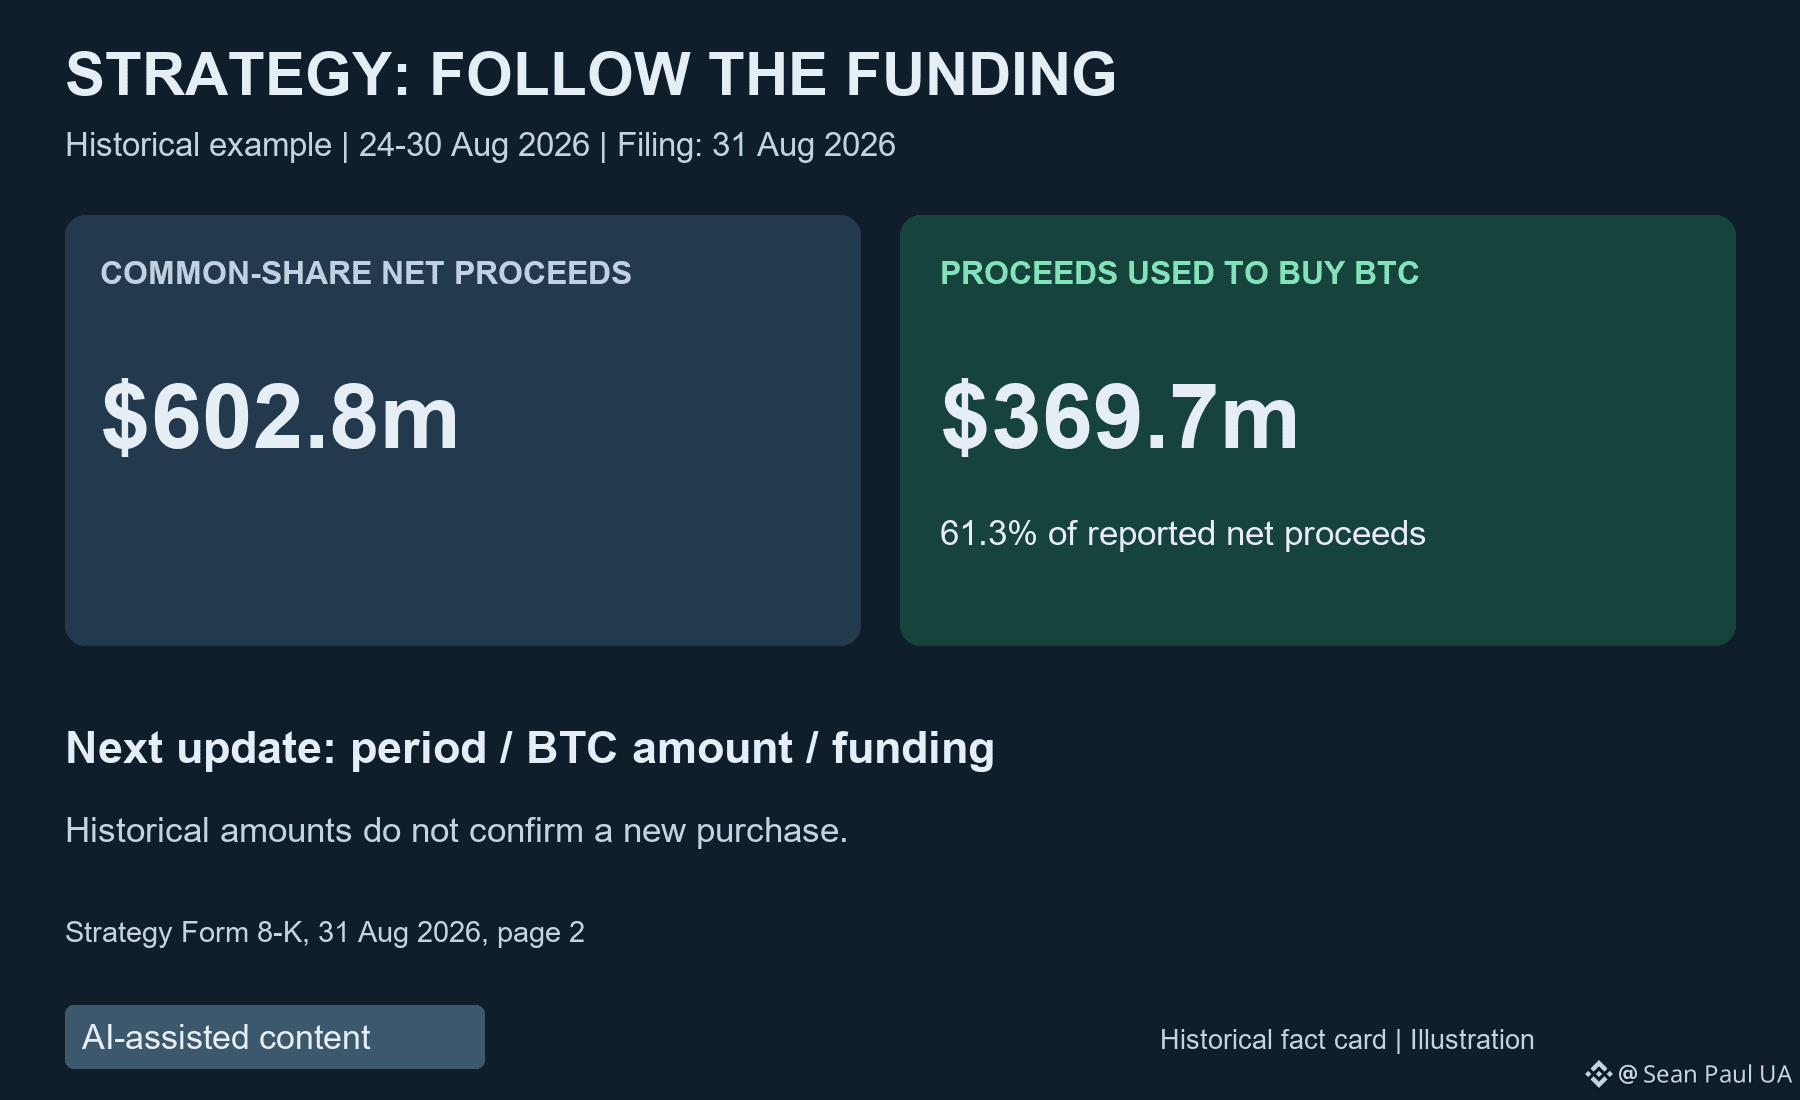
One historical example explains why: Strategy's August 31 filing reported $602.8 million of net proceeds from common-share sales for August 24-30. It said $369.7 million of those proceeds funded Bitcoin purchases - about 61.3%.
The filing also lists preferred-share repurchases, dividends and an increase in its cash liquidity account among the uses. Raising money and spending all of it on BTC are different claims.
That same report recorded 4,603 BTC purchased during August 24-30. Those are dated figures, not confirmation of a new September 20 purchase.
For the next update, my checklist is the purchase period, coins acquired and funding used. A hint alone cannot fill in those fields, and an announcement date need not be the day the buying happened.
Which detail would change your reading most: the BTC amount, the funding source or the purchase period - and why?
$BTC #Bitcoin
Saylor buy speculation is back in Square's trends. I'm watching where the funding actually goes.
One historical example explains why: Strategy's August 31 filing reported $602.8 million of net proceeds from common-share sales for August 24-30. It said $369.7 million of those proceeds funded Bitcoin purchases - about 61.3%.
The filing also lists preferred-share repurchases, dividends and an increase in its cash liquidity account among the uses. Raising money and spending all of it on BTC are different claims.
That same report recorded 4,603 BTC purchased during August 24-30. Those are dated figures, not confirmation of a new September 20 purchase.
For the next update, my checklist is the purchase period, coins acquired and funding used. A hint alone cannot fill in those fields, and an announcement date need not be the day the buying happened.
Which detail would change your reading most: the BTC amount, the funding source or the purchase period - and why?
$BTC #Bitcoin
One historical example explains why: Strategy's August 31 filing reported $602.8 million of net proceeds from common-share sales for August 24-30. It said $369.7 million of those proceeds funded Bitcoin purchases - about 61.3%.
The filing also lists preferred-share repurchases, dividends and an increase in its cash liquidity account among the uses. Raising money and spending all of it on BTC are different claims.
That same report recorded 4,603 BTC purchased during August 24-30. Those are dated figures, not confirmation of a new September 20 purchase.
For the next update, my checklist is the purchase period, coins acquired and funding used. A hint alone cannot fill in those fields, and an announcement date need not be the day the buying happened.
Which detail would change your reading most: the BTC amount, the funding source or the purchase period - and why?
$BTC #Bitcoin
8
·
--
SOL's busiest hour in my latest 24-hour snapshot was a down candle.
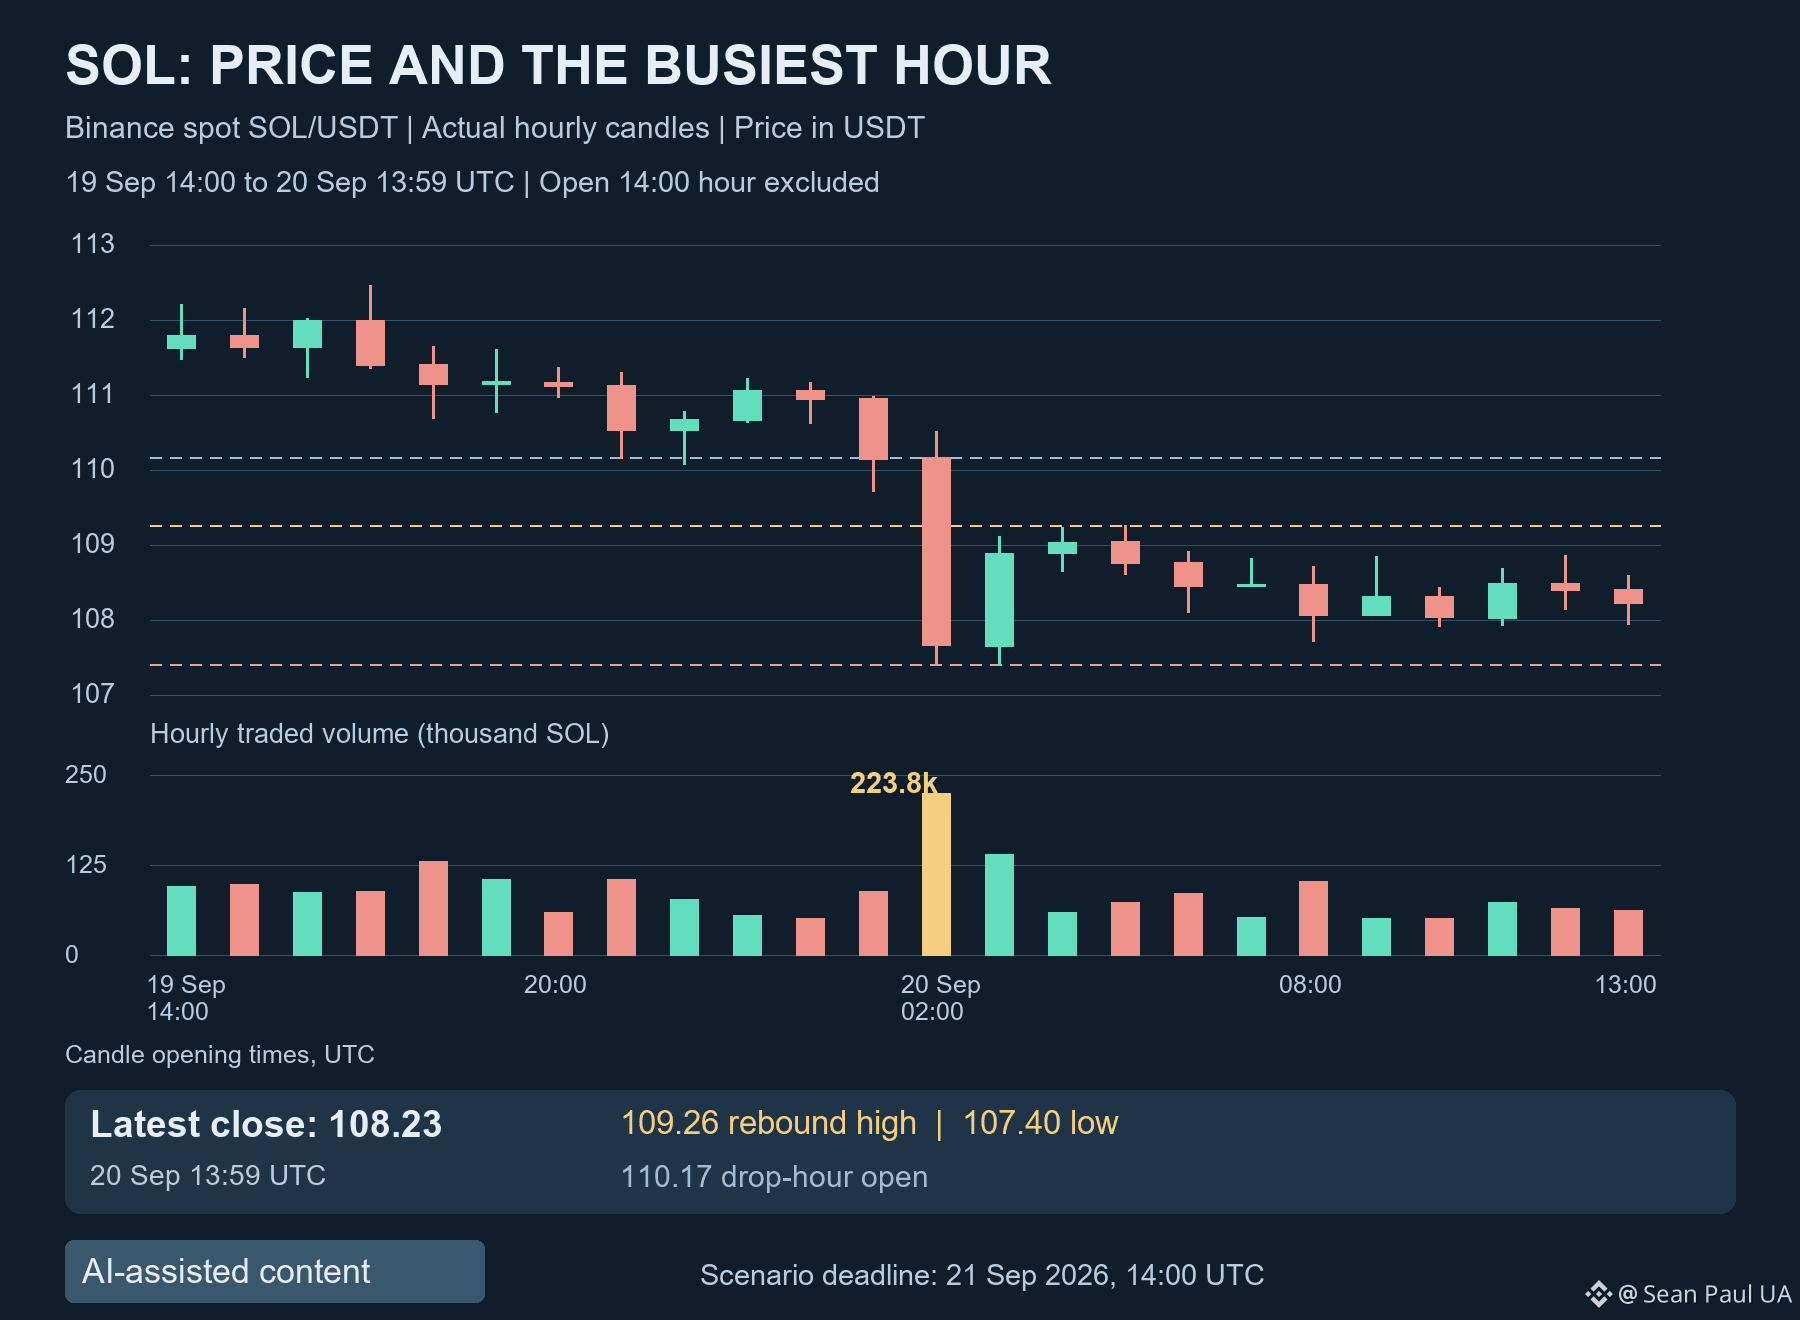
On Binance spot SOL/USDT, September 20's 02:00 UTC hour opened at 110.17 and closed at 107.67. About 223,838 SOL traded in that hour, the largest hourly volume from September 19 at 14:00 through September 20 at 13:59 UTC.
The next hour rebounded to a 108.89 close on about 139,428 SOL of volume. By the 13:59 UTC cutoff, the latest close was 108.23.
That makes the rebound's follow-through my focus. These are total traded SOL volumes on one spot pair, not net selling or proof of who bought the dip.
My map runs from publication to September 21 at 14:00 UTC.
An hourly close above 109.26, the highest rebound price after the drop hour, would put that hour's 110.17 opening price back on my recovery watchlist.
Hourly closes inside 107.40-109.26 keep price within the observed low-to-rebound range.
An hourly close below 107.40 would break today's observed floor; two touches of that low don't make it guaranteed support.
After either breakout, the first hourly close back inside 107.40-109.26 cancels that breakout reading. A wick outside alone is not my trigger.
The open 14:00 UTC candle is excluded.
Before that deadline, which would change your reading most: A) a close above 109.26, B) a close below 107.40, or C) the volume accompanying either break - and why?
$SOL #Solana
SOL's busiest hour in my latest 24-hour snapshot was a down candle.
On Binance spot SOL/USDT, September 20's 02:00 UTC hour opened at 110.17 and closed at 107.67. About 223,838 SOL traded in that hour, the largest hourly volume from September 19 at 14:00 through September 20 at 13:59 UTC.
The next hour rebounded to a 108.89 close on about 139,428 SOL of volume. By the 13:59 UTC cutoff, the latest close was 108.23.
That makes the rebound's follow-through my focus. These are total traded SOL volumes on one spot pair, not net selling or proof of who bought the dip.
My map runs from publication to September 21 at 14:00 UTC.
An hourly close above 109.26, the highest rebound price after the drop hour, would put that hour's 110.17 opening price back on my recovery watchlist.
Hourly closes inside 107.40-109.26 keep price within the observed low-to-rebound range.
An hourly close below 107.40 would break today's observed floor; two touches of that low don't make it guaranteed support.
After either breakout, the first hourly close back inside 107.40-109.26 cancels that breakout reading. A wick outside alone is not my trigger.
The open 14:00 UTC candle is excluded.
Before that deadline, which would change your reading most: A) a close above 109.26, B) a close below 107.40, or C) the volume accompanying either break - and why?
$SOL #Solana
On Binance spot SOL/USDT, September 20's 02:00 UTC hour opened at 110.17 and closed at 107.67. About 223,838 SOL traded in that hour, the largest hourly volume from September 19 at 14:00 through September 20 at 13:59 UTC.
The next hour rebounded to a 108.89 close on about 139,428 SOL of volume. By the 13:59 UTC cutoff, the latest close was 108.23.
That makes the rebound's follow-through my focus. These are total traded SOL volumes on one spot pair, not net selling or proof of who bought the dip.
My map runs from publication to September 21 at 14:00 UTC.
An hourly close above 109.26, the highest rebound price after the drop hour, would put that hour's 110.17 opening price back on my recovery watchlist.
Hourly closes inside 107.40-109.26 keep price within the observed low-to-rebound range.
An hourly close below 107.40 would break today's observed floor; two touches of that low don't make it guaranteed support.
After either breakout, the first hourly close back inside 107.40-109.26 cancels that breakout reading. A wick outside alone is not my trigger.
The open 14:00 UTC candle is excluded.
Before that deadline, which would change your reading most: A) a close above 109.26, B) a close below 107.40, or C) the volume accompanying either break - and why?
$SOL #Solana
54
·
--
ETH's 2,600 reclaim needs a fresh timestamp.
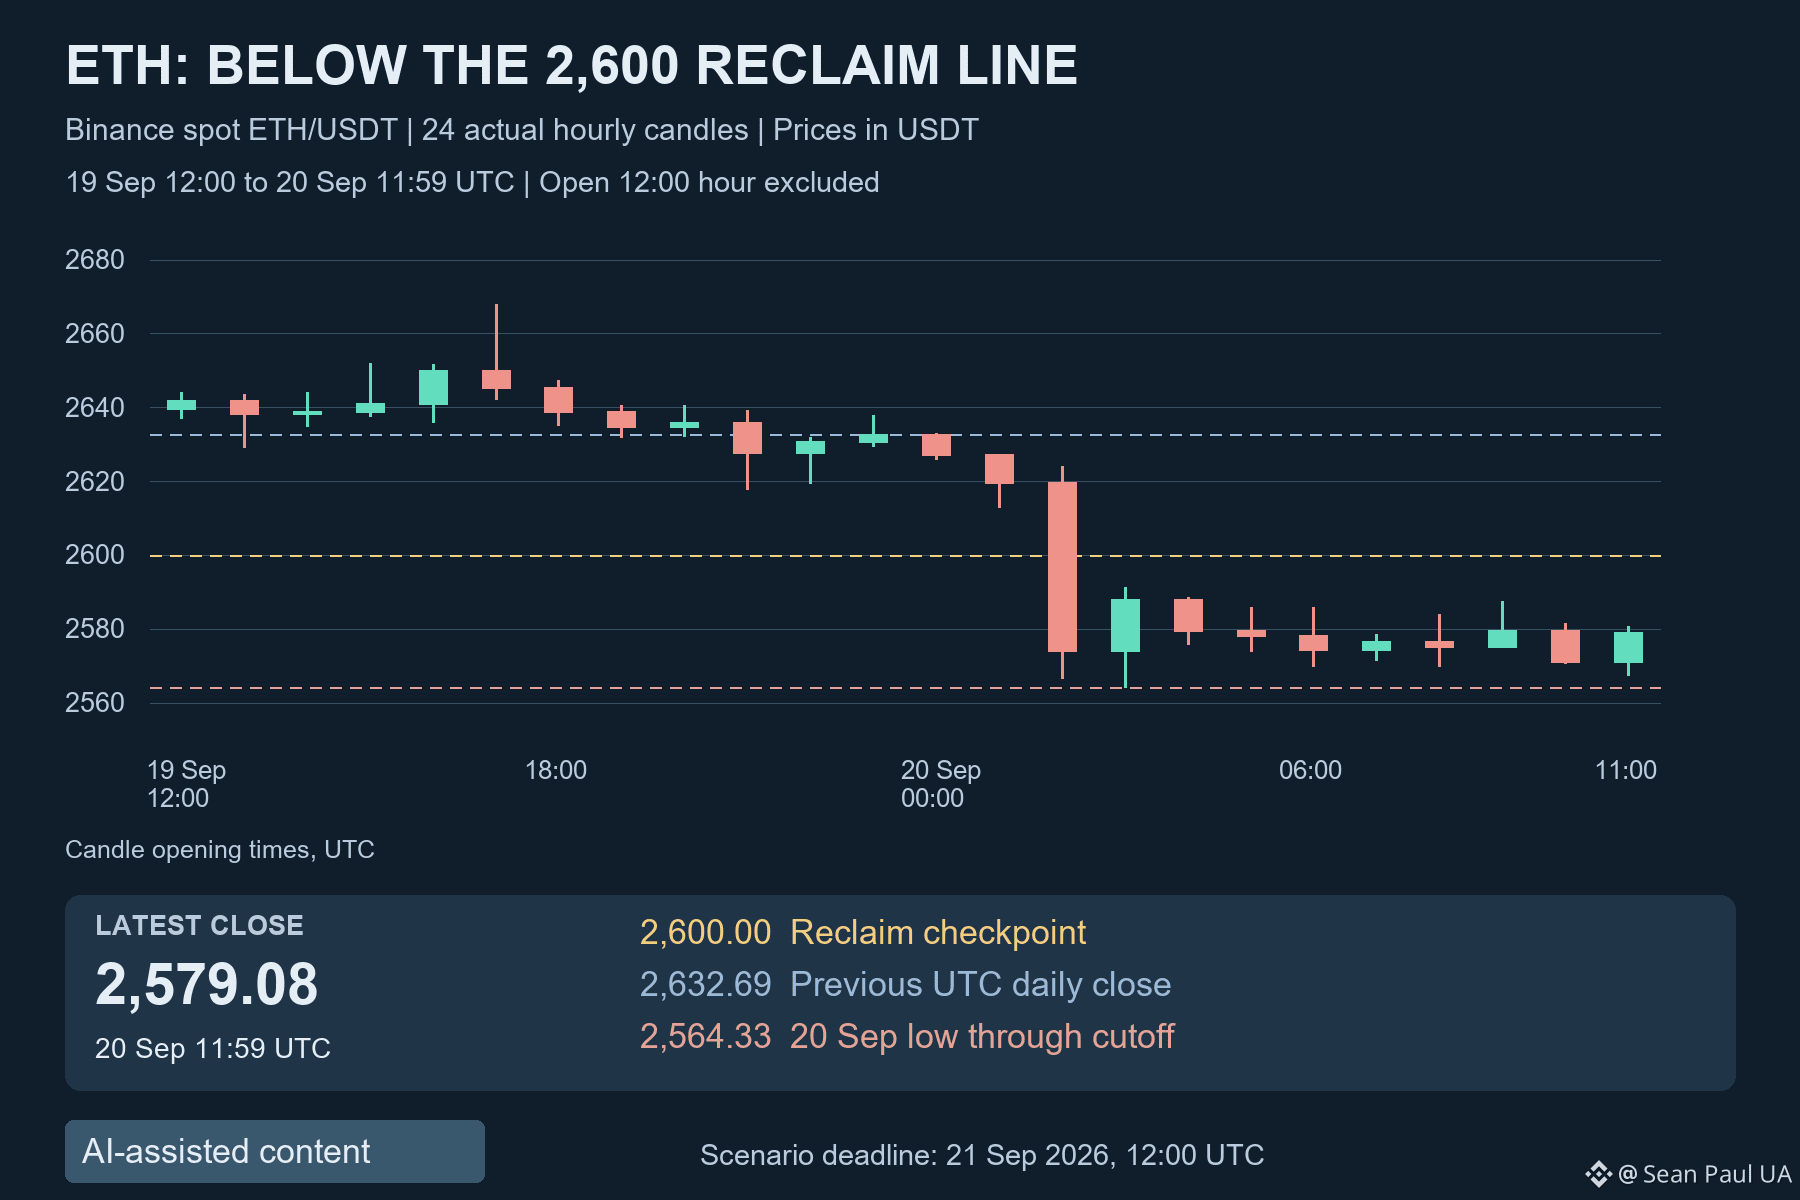
I'm seeing the reclaim topic in Trends, but the latest completed Binance spot ETH/USDT hour closed at 2,579.08 on September 20, 11:59 UTC. The ten hourly candles from 02:00 through 11:00 UTC all closed below 2,600.
That changes my question from whether 2,600 is holding to what would count as a recovery. An earlier breakout headline can remain visible after price has lost the level.
My map runs from publication to September 21 at 12:00 UTC.
Two consecutive hourly closes above 2,600 would put September 19's daily close, 2,632.69, back on my upside watchlist.
Closes between today's low of 2,564.33 and 2,600 leave ETH in a repair range, with the old threshold still overhead.
An hourly close below 2,564.33 would signal a fresh break under today's observed low, rather than a confirmed recovery.
A close back below 2,600 after that two-close reclaim cancels the upside setup. A close back above 2,564.33 after a downside break cancels that breakdown reading.
I'm using completed hourly closes, not a brief wick, for those conditions. The open 12:00 UTC candle isn't in this snapshot.
By that deadline, what evidence would convince you that 2,600 has become support again?
$ETH #Ethereum
ETH's 2,600 reclaim needs a fresh timestamp.
I'm seeing the reclaim topic in Trends, but the latest completed Binance spot ETH/USDT hour closed at 2,579.08 on September 20, 11:59 UTC. The ten hourly candles from 02:00 through 11:00 UTC all closed below 2,600.
That changes my question from whether 2,600 is holding to what would count as a recovery. An earlier breakout headline can remain visible after price has lost the level.
My map runs from publication to September 21 at 12:00 UTC.
Two consecutive hourly closes above 2,600 would put September 19's daily close, 2,632.69, back on my upside watchlist.
Closes between today's low of 2,564.33 and 2,600 leave ETH in a repair range, with the old threshold still overhead.
An hourly close below 2,564.33 would signal a fresh break under today's observed low, rather than a confirmed recovery.
A close back below 2,600 after that two-close reclaim cancels the upside setup. A close back above 2,564.33 after a downside break cancels that breakdown reading.
I'm using completed hourly closes, not a brief wick, for those conditions. The open 12:00 UTC candle isn't in this snapshot.
By that deadline, what evidence would convince you that 2,600 has become support again?
$ETH #Ethereum
I'm seeing the reclaim topic in Trends, but the latest completed Binance spot ETH/USDT hour closed at 2,579.08 on September 20, 11:59 UTC. The ten hourly candles from 02:00 through 11:00 UTC all closed below 2,600.
That changes my question from whether 2,600 is holding to what would count as a recovery. An earlier breakout headline can remain visible after price has lost the level.
My map runs from publication to September 21 at 12:00 UTC.
Two consecutive hourly closes above 2,600 would put September 19's daily close, 2,632.69, back on my upside watchlist.
Closes between today's low of 2,564.33 and 2,600 leave ETH in a repair range, with the old threshold still overhead.
An hourly close below 2,564.33 would signal a fresh break under today's observed low, rather than a confirmed recovery.
A close back below 2,600 after that two-close reclaim cancels the upside setup. A close back above 2,564.33 after a downside break cancels that breakdown reading.
I'm using completed hourly closes, not a brief wick, for those conditions. The open 12:00 UTC candle isn't in this snapshot.
By that deadline, what evidence would convince you that 2,600 has become support again?
$ETH #Ethereum
1
134
·
--
HKDAP has reached a fund transaction. I'm keeping the 24/7 milestone separate.
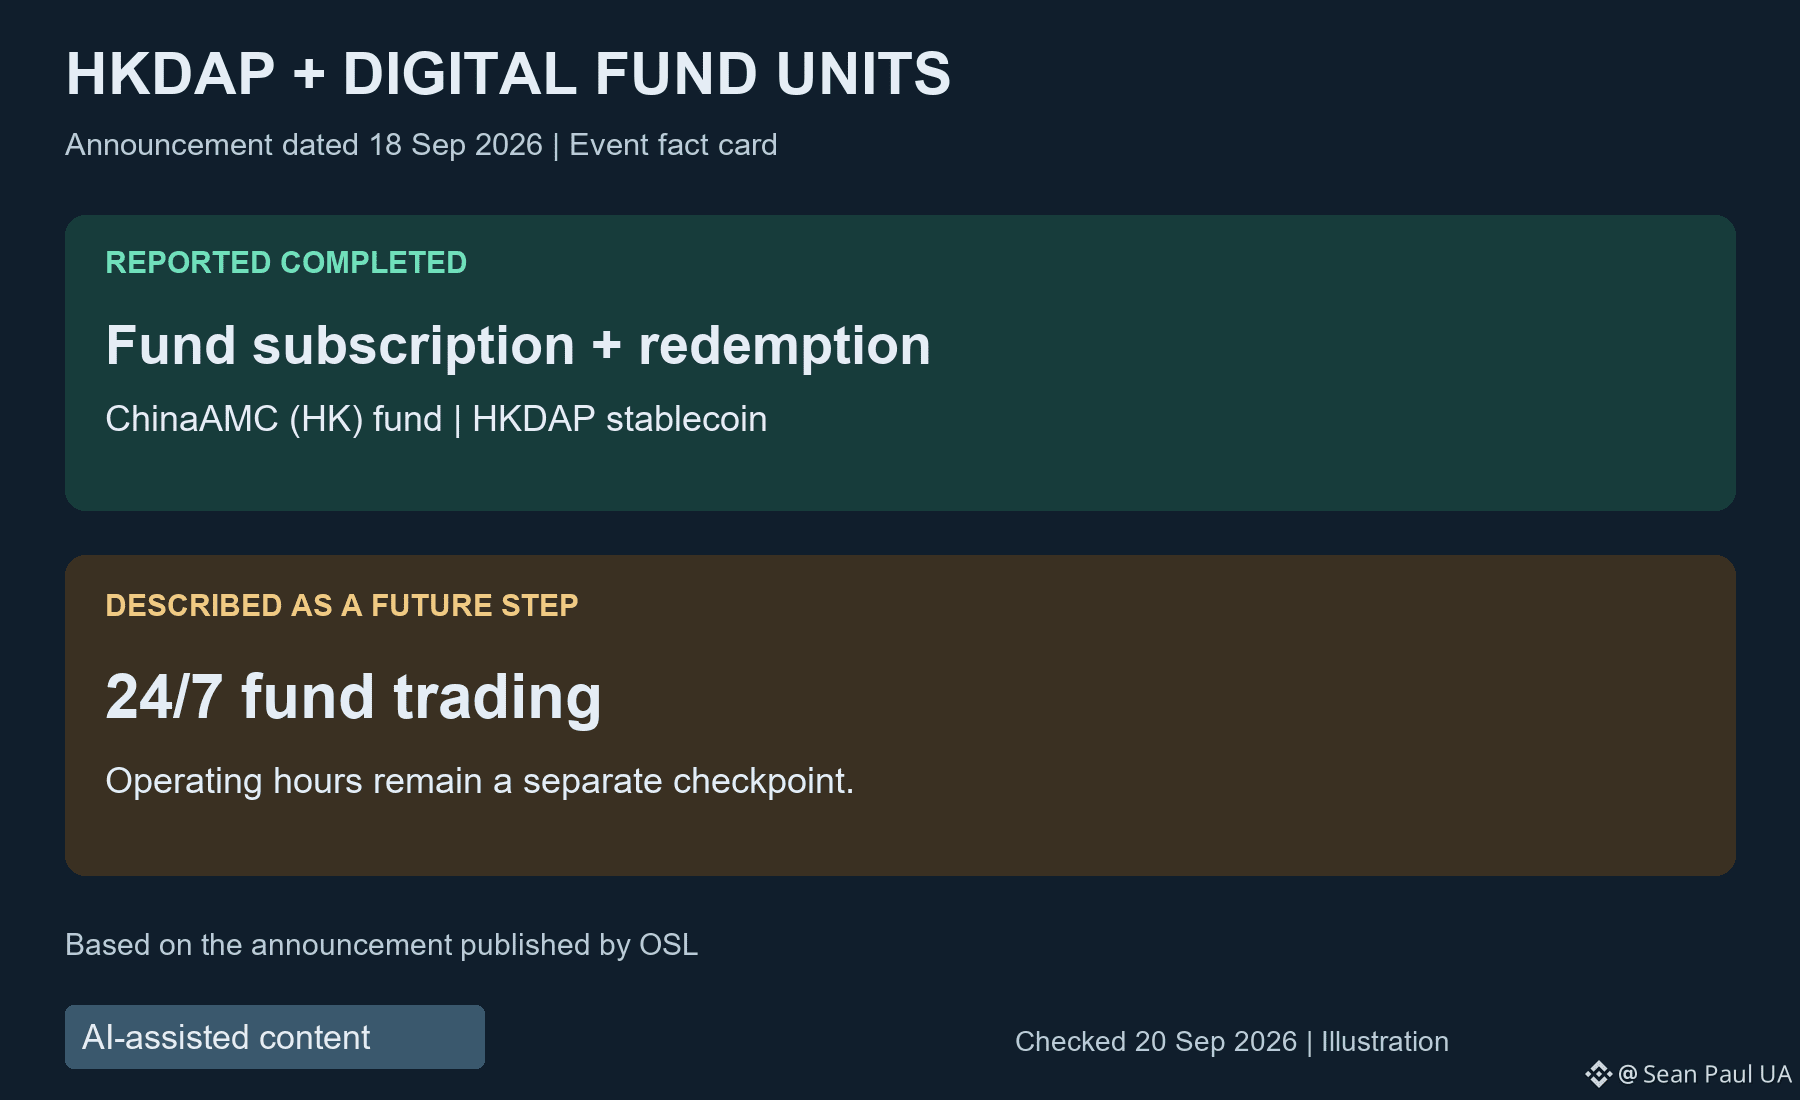
A September 18 announcement published by OSL says HKDAP, Anchorpoint's HKD stablecoin, was used to subscribe to and redeem ChinaAMC (HK) digital money market fund units.
OSL HK handled the transaction services. Standard Chartered provided custody and tokenisation services.
The detail I care about: the release describes round-the-clock fund trading as a future step. Completing this use case doesn't establish that investors already have unrestricted weekend subscriptions and redemptions.
For me, the next useful update would specify operating hours, who can access the service and when redemptions actually settle. Digital money and a fund's operating timetable need to work together.
Which would matter most for assessing this service: A) access rules, B) redemption timing, or C) weekend availability - and why?
#Stablecoins #Tokenization
HKDAP has reached a fund transaction. I'm keeping the 24/7 milestone separate.
A September 18 announcement published by OSL says HKDAP, Anchorpoint's HKD stablecoin, was used to subscribe to and redeem ChinaAMC (HK) digital money market fund units.
OSL HK handled the transaction services. Standard Chartered provided custody and tokenisation services.
The detail I care about: the release describes round-the-clock fund trading as a future step. Completing this use case doesn't establish that investors already have unrestricted weekend subscriptions and redemptions.
For me, the next useful update would specify operating hours, who can access the service and when redemptions actually settle. Digital money and a fund's operating timetable need to work together.
Which would matter most for assessing this service: A) access rules, B) redemption timing, or C) weekend availability - and why?
#Stablecoins #Tokenization
A September 18 announcement published by OSL says HKDAP, Anchorpoint's HKD stablecoin, was used to subscribe to and redeem ChinaAMC (HK) digital money market fund units.
OSL HK handled the transaction services. Standard Chartered provided custody and tokenisation services.
The detail I care about: the release describes round-the-clock fund trading as a future step. Completing this use case doesn't establish that investors already have unrestricted weekend subscriptions and redemptions.
For me, the next useful update would specify operating hours, who can access the service and when redemptions actually settle. Digital money and a fund's operating timetable need to work together.
Which would matter most for assessing this service: A) access rules, B) redemption timing, or C) weekend availability - and why?
#Stablecoins #Tokenization
64
·
--
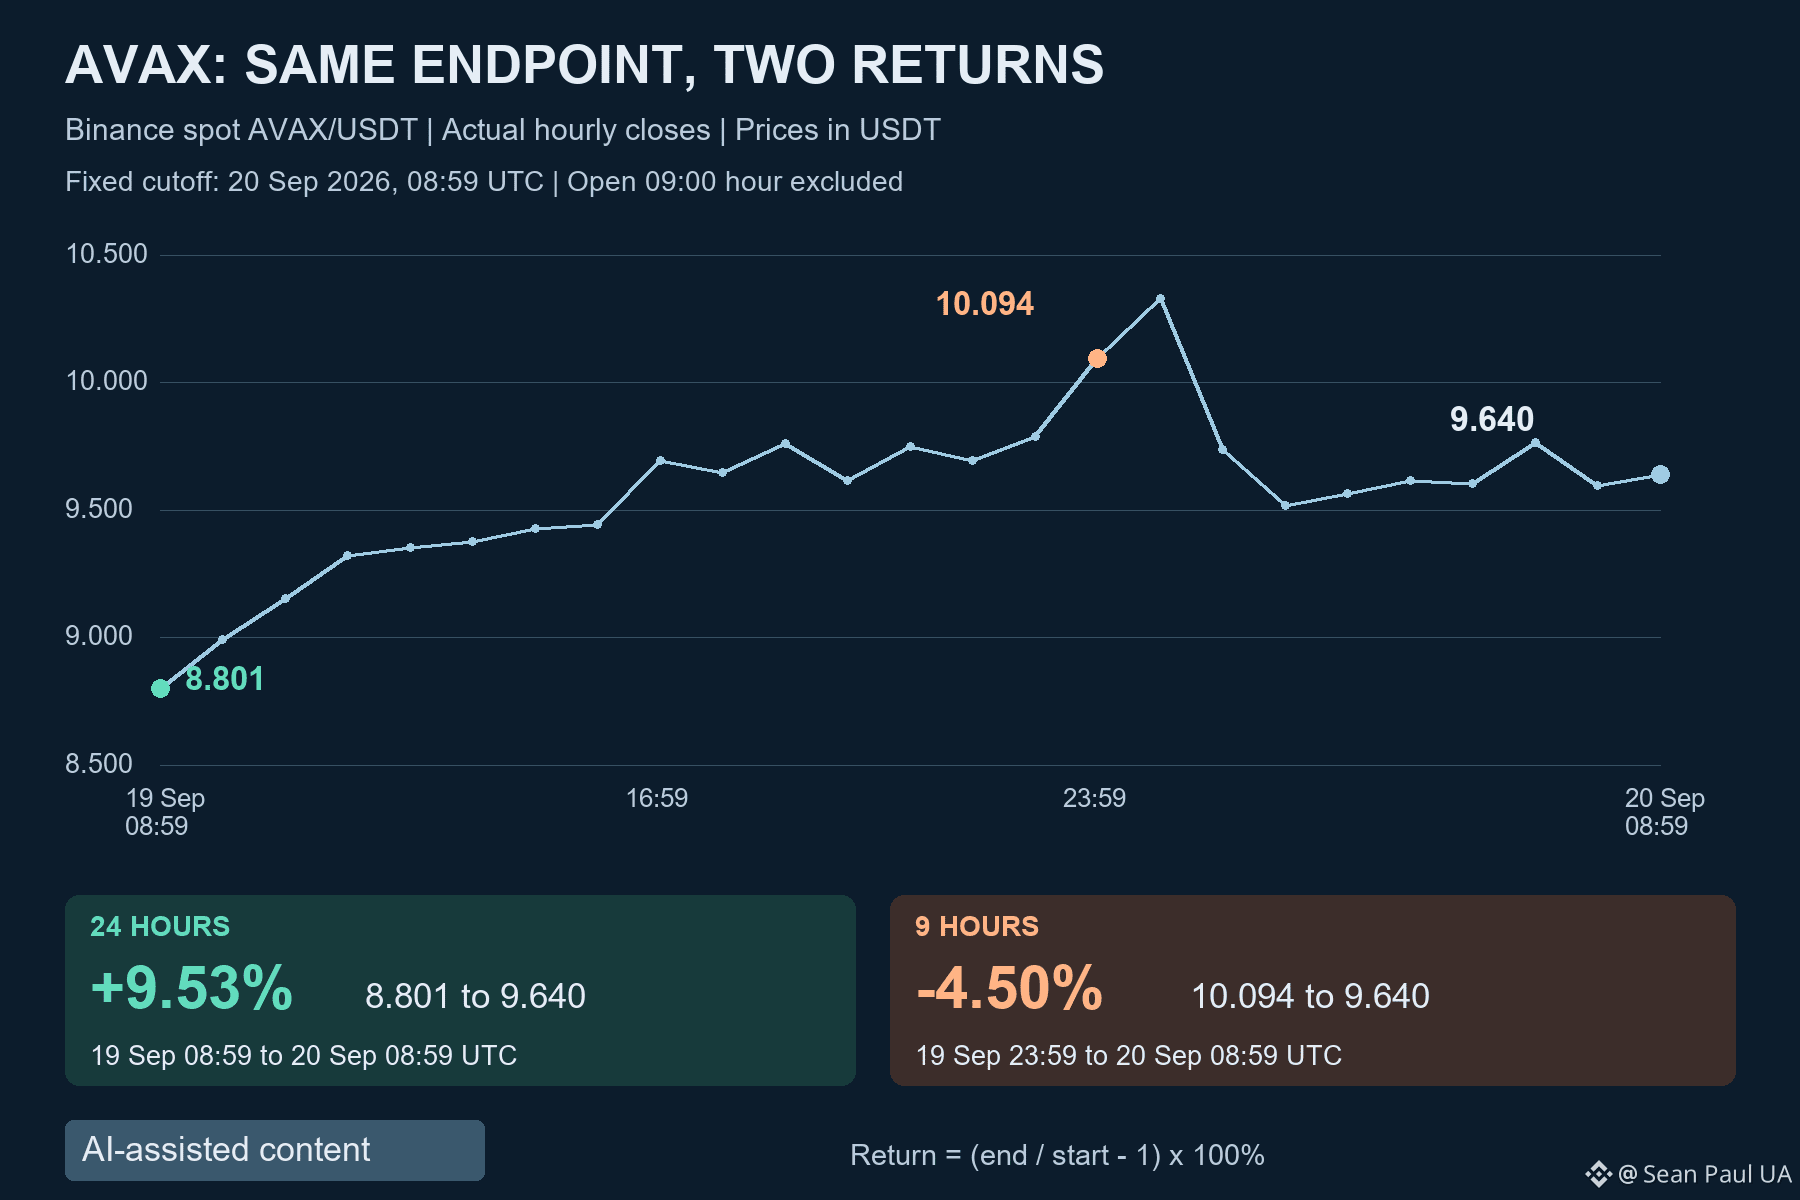
AVAX: up 9.53% over 24 hours, down 4.50% over nine. Both can be true.
I compared the same Binance spot AVAX/USDT close, 9.640 at September 20's 08:59 UTC cutoff, with two different starting points.
At September 19's 08:59 UTC close, AVAX was 8.801. From there to 9.640 is a 9.53% gain over exactly 24 hours.
At September 19's 23:59 UTC daily close, it was 10.094. From that later reference to the same 9.640 is a 4.50% decline over nine hours.
The endpoint hasn't changed. The starting price has. A green 24-hour number can coexist with a pullback from the previous daily close, because the longer window still includes the earlier rise.
That's why I want the starting time beside a percentage before calling a move strong or weak. Comparing one token over 24 hours with another since midnight can turn a timing difference into an apparent performance gap.
These are fixed comparisons between completed candles, not a live ticker reading. The open 09:00 UTC hour is excluded. Neither percentage, by itself, explains the cause of the move or establishes what comes next.
Which starting point would you use to compare two tokens' performance, and why?
$AVAX #Avalanche #MarketEducation
AVAX: up 9.53% over 24 hours, down 4.50% over nine. Both can be true.
I compared the same Binance spot AVAX/USDT close, 9.640 at September 20's 08:59 UTC cutoff, with two different starting points.
At September 19's 08:59 UTC close, AVAX was 8.801. From there to 9.640 is a 9.53% gain over exactly 24 hours.
At September 19's 23:59 UTC daily close, it was 10.094. From that later reference to the same 9.640 is a 4.50% decline over nine hours.
The endpoint hasn't changed. The starting price has. A green 24-hour number can coexist with a pullback from the previous daily close, because the longer window still includes the earlier rise.
That's why I want the starting time beside a percentage before calling a move strong or weak. Comparing one token over 24 hours with another since midnight can turn a timing difference into an apparent performance gap.
These are fixed comparisons between completed candles, not a live ticker reading. The open 09:00 UTC hour is excluded. Neither percentage, by itself, explains the cause of the move or establishes what comes next.
Which starting point would you use to compare two tokens' performance, and why?
$AVAX #Avalanche #MarketEducation
I compared the same Binance spot AVAX/USDT close, 9.640 at September 20's 08:59 UTC cutoff, with two different starting points.
At September 19's 08:59 UTC close, AVAX was 8.801. From there to 9.640 is a 9.53% gain over exactly 24 hours.
At September 19's 23:59 UTC daily close, it was 10.094. From that later reference to the same 9.640 is a 4.50% decline over nine hours.
The endpoint hasn't changed. The starting price has. A green 24-hour number can coexist with a pullback from the previous daily close, because the longer window still includes the earlier rise.
That's why I want the starting time beside a percentage before calling a move strong or weak. Comparing one token over 24 hours with another since midnight can turn a timing difference into an apparent performance gap.
These are fixed comparisons between completed candles, not a live ticker reading. The open 09:00 UTC hour is excluded. Neither percentage, by itself, explains the cause of the move or establishes what comes next.
Which starting point would you use to compare two tokens' performance, and why?
$AVAX #Avalanche #MarketEducation
105
·
--
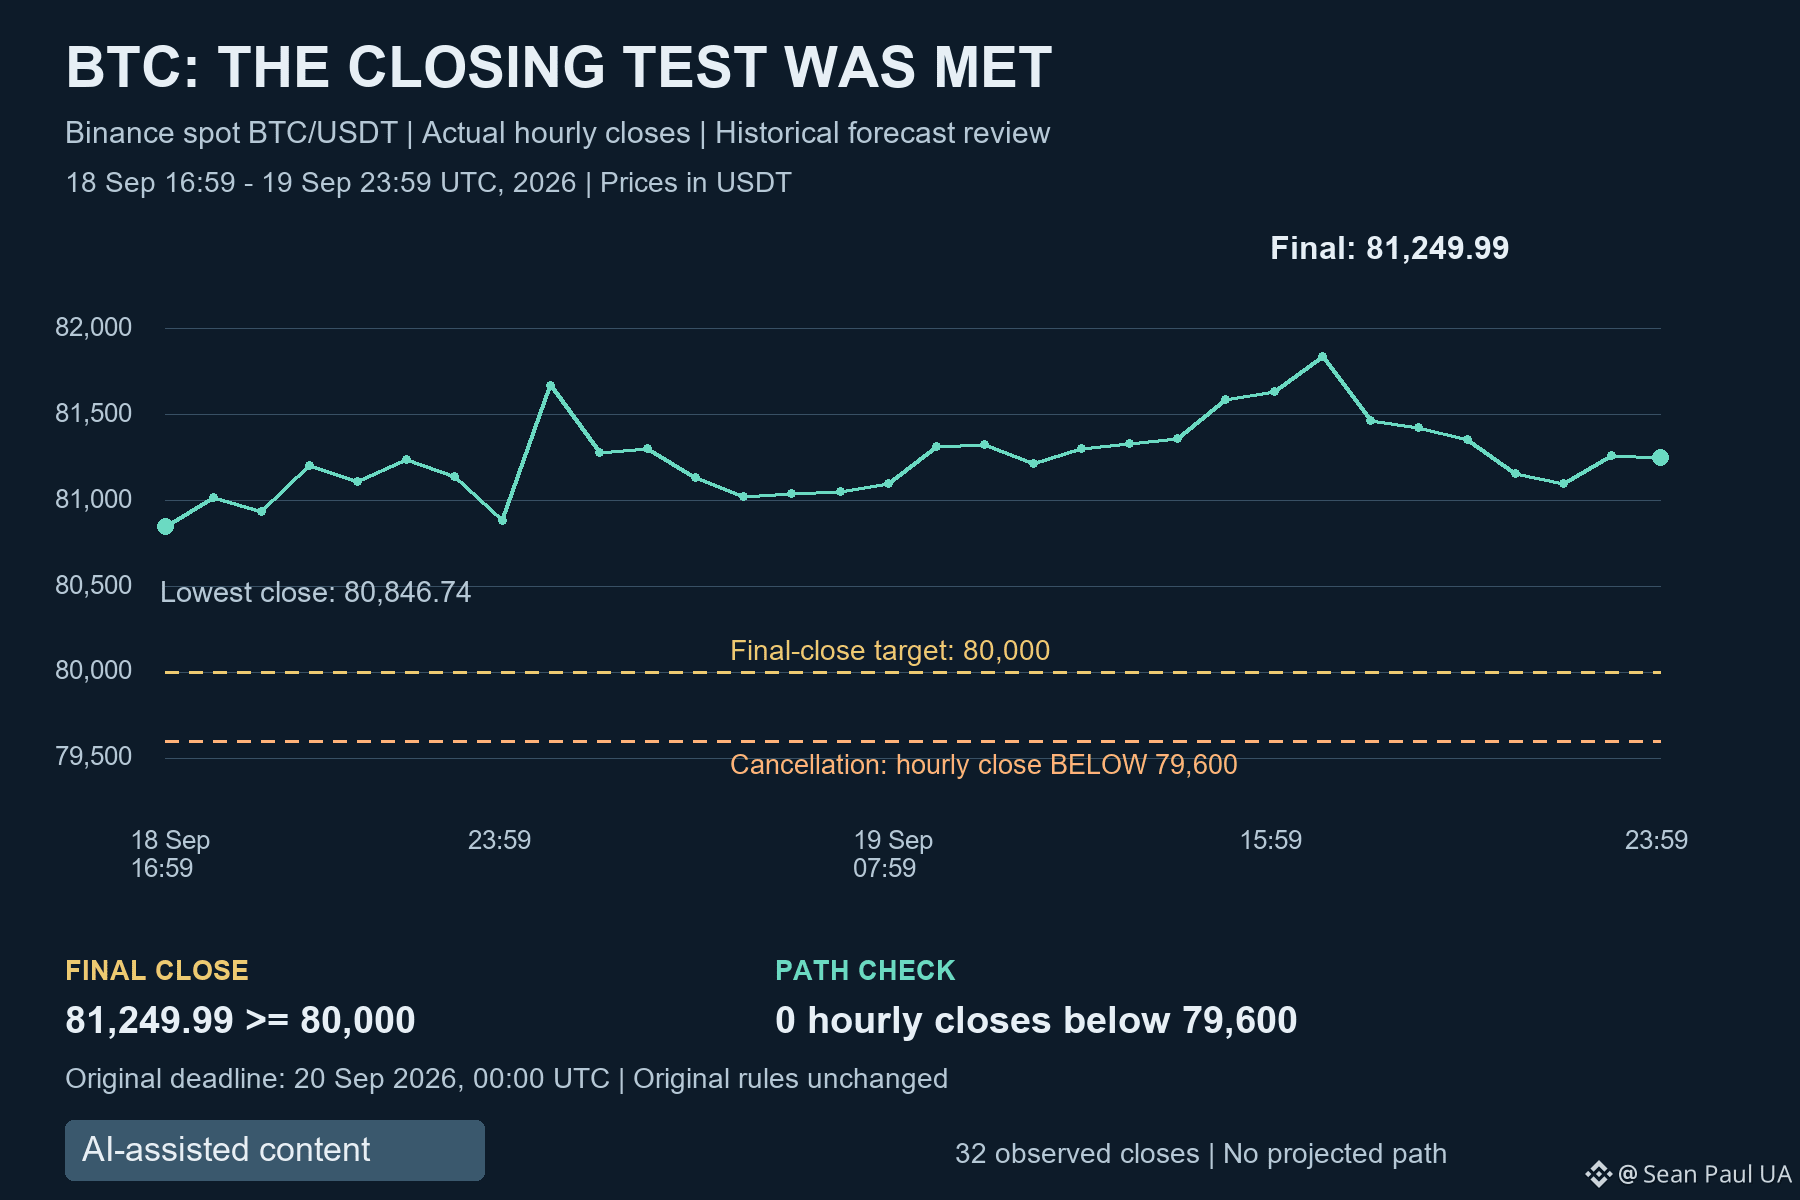
BTC kept the breakout. Here's how my weekend forecast finished.
On September 18, I favored Binance spot BTC/USDT ending September 19's UTC daily candle at or above 80,000. One hourly close below 79,600 after publication would cancel that call, even if price later recovered.
The deadline has passed: September 20 at 00:00 UTC. The final daily close was 81,249.99. Across all 32 hourly closes after publication through that deadline, the lowest was 80,846.74. None breached the cancellation level.
I'm recording the forecast as met under its original rules: the closing target held and the invalidation never occurred. Those are two separate checks; a final price above the target would not have rescued an earlier cancellation.
What I find useful is the distinction between touching 80,000 and retaining it at a specified close. The first happened before this forecast. Only the later closing test could settle the call.
This is one resolved forecast, not evidence of a reliable hit rate or a trading return. The window is closed, and these historical levels do not automatically become today's setup.
When reviewing a forecast, which tells you more: A) the final close, B) the path before the deadline, or C) both together - and why?
$BTC #Bitcoin
BTC kept the breakout. Here's how my weekend forecast finished.
On September 18, I favored Binance spot BTC/USDT ending September 19's UTC daily candle at or above 80,000. One hourly close below 79,600 after publication would cancel that call, even if price later recovered.
The deadline has passed: September 20 at 00:00 UTC. The final daily close was 81,249.99. Across all 32 hourly closes after publication through that deadline, the lowest was 80,846.74. None breached the cancellation level.
I'm recording the forecast as met under its original rules: the closing target held and the invalidation never occurred. Those are two separate checks; a final price above the target would not have rescued an earlier cancellation.
What I find useful is the distinction between touching 80,000 and retaining it at a specified close. The first happened before this forecast. Only the later closing test could settle the call.
This is one resolved forecast, not evidence of a reliable hit rate or a trading return. The window is closed, and these historical levels do not automatically become today's setup.
When reviewing a forecast, which tells you more: A) the final close, B) the path before the deadline, or C) both together - and why?
$BTC #Bitcoin
On September 18, I favored Binance spot BTC/USDT ending September 19's UTC daily candle at or above 80,000. One hourly close below 79,600 after publication would cancel that call, even if price later recovered.
The deadline has passed: September 20 at 00:00 UTC. The final daily close was 81,249.99. Across all 32 hourly closes after publication through that deadline, the lowest was 80,846.74. None breached the cancellation level.
I'm recording the forecast as met under its original rules: the closing target held and the invalidation never occurred. Those are two separate checks; a final price above the target would not have rescued an earlier cancellation.
What I find useful is the distinction between touching 80,000 and retaining it at a specified close. The first happened before this forecast. Only the later closing test could settle the call.
This is one resolved forecast, not evidence of a reliable hit rate or a trading return. The window is closed, and these historical levels do not automatically become today's setup.
When reviewing a forecast, which tells you more: A) the final close, B) the path before the deadline, or C) both together - and why?
$BTC #Bitcoin
88
·
--
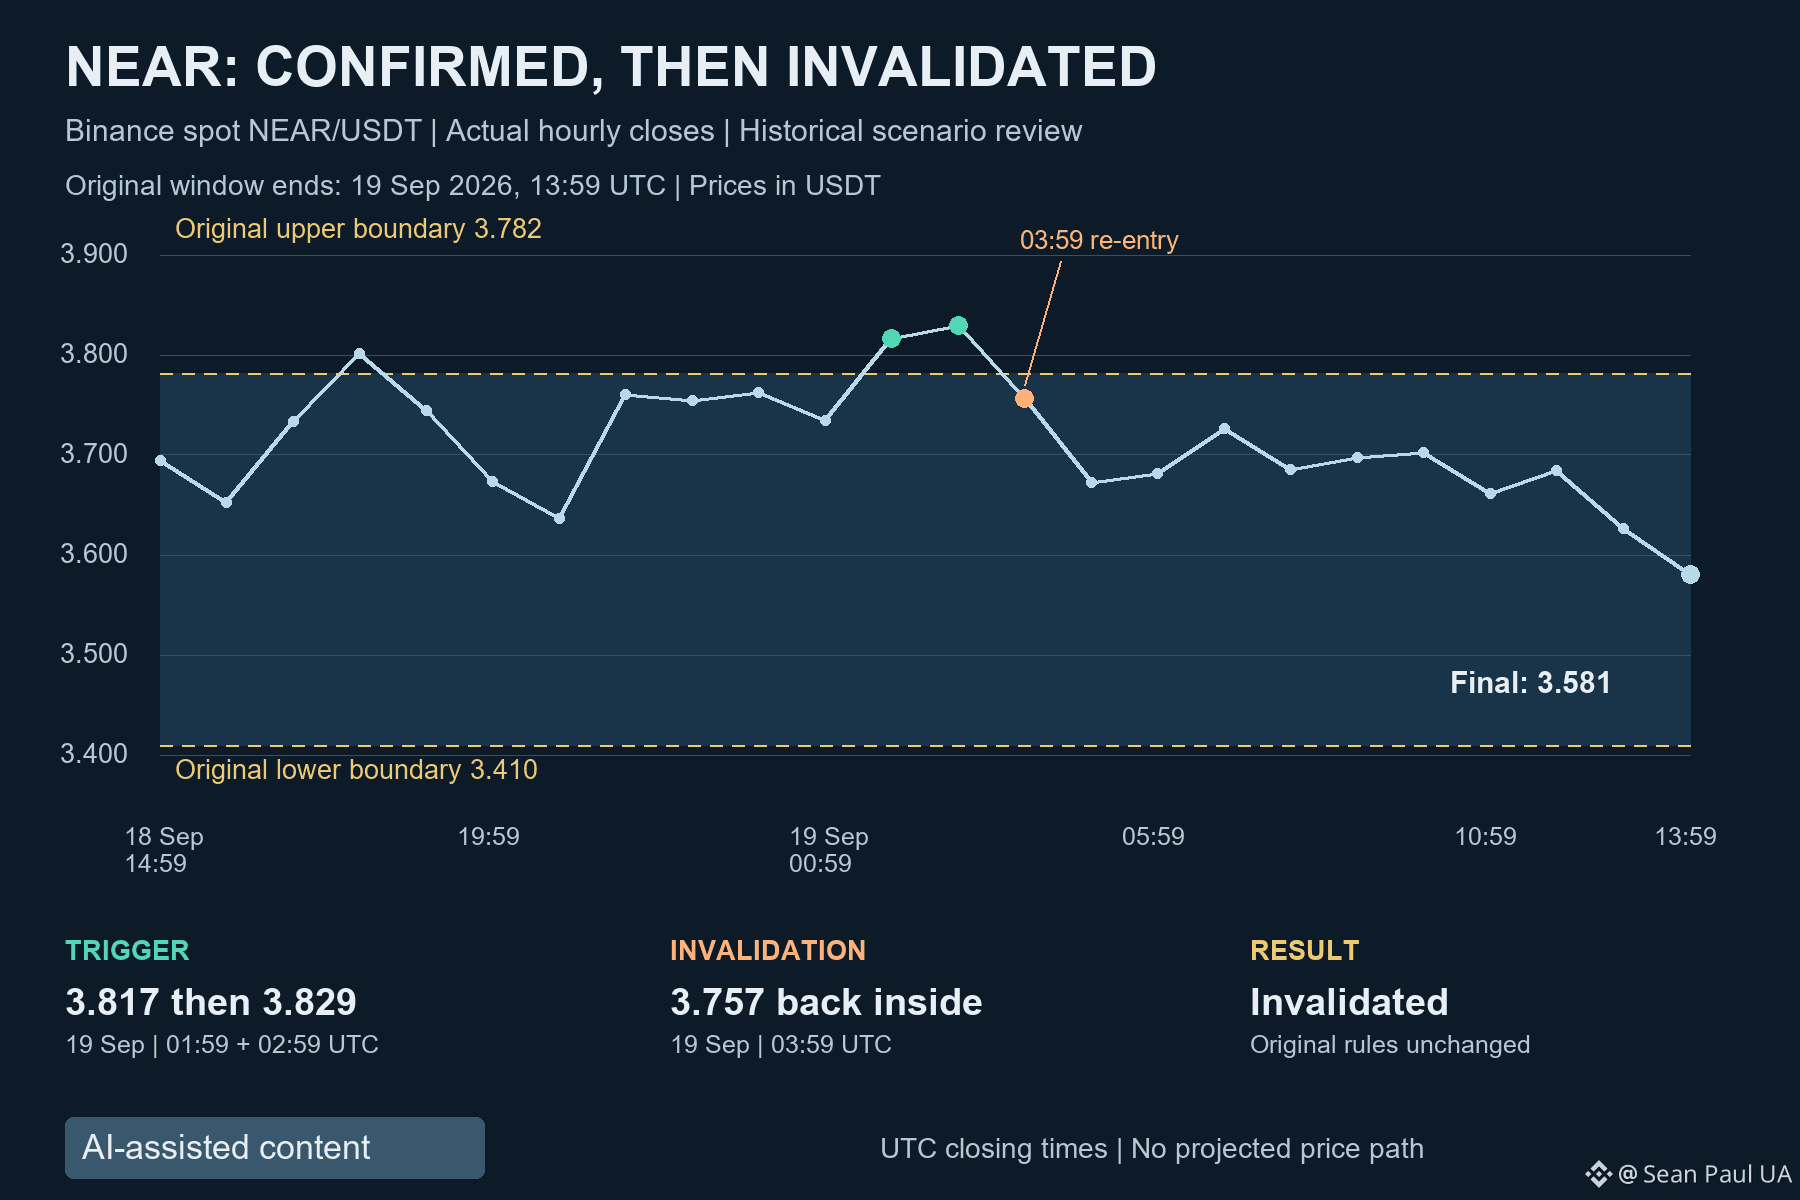
NEAR confirmed my upside trigger, then cancelled it one hour later.
Yesterday's map used 3.410-3.782 on Binance spot NEAR/USDT. I required two consecutive hourly closes outside the range, with a later close back inside invalidating the break. The window ended September 19 at 13:59 UTC.
The closes at 01:59 and 02:59 UTC today were 3.817 and 3.829. Both exceeded 3.782: the upside condition activated.
Then the 03:59 UTC candle closed at 3.757, back inside the original range. That met my cancellation rule. The final close of the window was 3.581; no downside breakout triggered under the two-close rule.
I'm recording this as an activated, invalidated upside scenario. Stopping the review at the two higher closes would leave out the part that changed the result.
Confirmation and continuation answer different questions. Two closes can satisfy a trigger without making the next close stay outside. Keeping the cancellation rule visible matters as much as marking the breakout.
This was a conditional map, not a preferred-direction forecast to count as a win. Its levels have expired; I'm leaving the original test unchanged.
What evidence would you require after a breakout is confirmed to judge whether it is holding?
$NEAR #NEARProtocol
NEAR confirmed my upside trigger, then cancelled it one hour later.
Yesterday's map used 3.410-3.782 on Binance spot NEAR/USDT. I required two consecutive hourly closes outside the range, with a later close back inside invalidating the break. The window ended September 19 at 13:59 UTC.
The closes at 01:59 and 02:59 UTC today were 3.817 and 3.829. Both exceeded 3.782: the upside condition activated.
Then the 03:59 UTC candle closed at 3.757, back inside the original range. That met my cancellation rule. The final close of the window was 3.581; no downside breakout triggered under the two-close rule.
I'm recording this as an activated, invalidated upside scenario. Stopping the review at the two higher closes would leave out the part that changed the result.
Confirmation and continuation answer different questions. Two closes can satisfy a trigger without making the next close stay outside. Keeping the cancellation rule visible matters as much as marking the breakout.
This was a conditional map, not a preferred-direction forecast to count as a win. Its levels have expired; I'm leaving the original test unchanged.
What evidence would you require after a breakout is confirmed to judge whether it is holding?
$NEAR #NEARProtocol
Yesterday's map used 3.410-3.782 on Binance spot NEAR/USDT. I required two consecutive hourly closes outside the range, with a later close back inside invalidating the break. The window ended September 19 at 13:59 UTC.
The closes at 01:59 and 02:59 UTC today were 3.817 and 3.829. Both exceeded 3.782: the upside condition activated.
Then the 03:59 UTC candle closed at 3.757, back inside the original range. That met my cancellation rule. The final close of the window was 3.581; no downside breakout triggered under the two-close rule.
I'm recording this as an activated, invalidated upside scenario. Stopping the review at the two higher closes would leave out the part that changed the result.
Confirmation and continuation answer different questions. Two closes can satisfy a trigger without making the next close stay outside. Keeping the cancellation rule visible matters as much as marking the breakout.
This was a conditional map, not a preferred-direction forecast to count as a win. Its levels have expired; I'm leaving the original test unchanged.
What evidence would you require after a breakout is confirmed to judge whether it is holding?
$NEAR #NEARProtocol
1
169
·
--
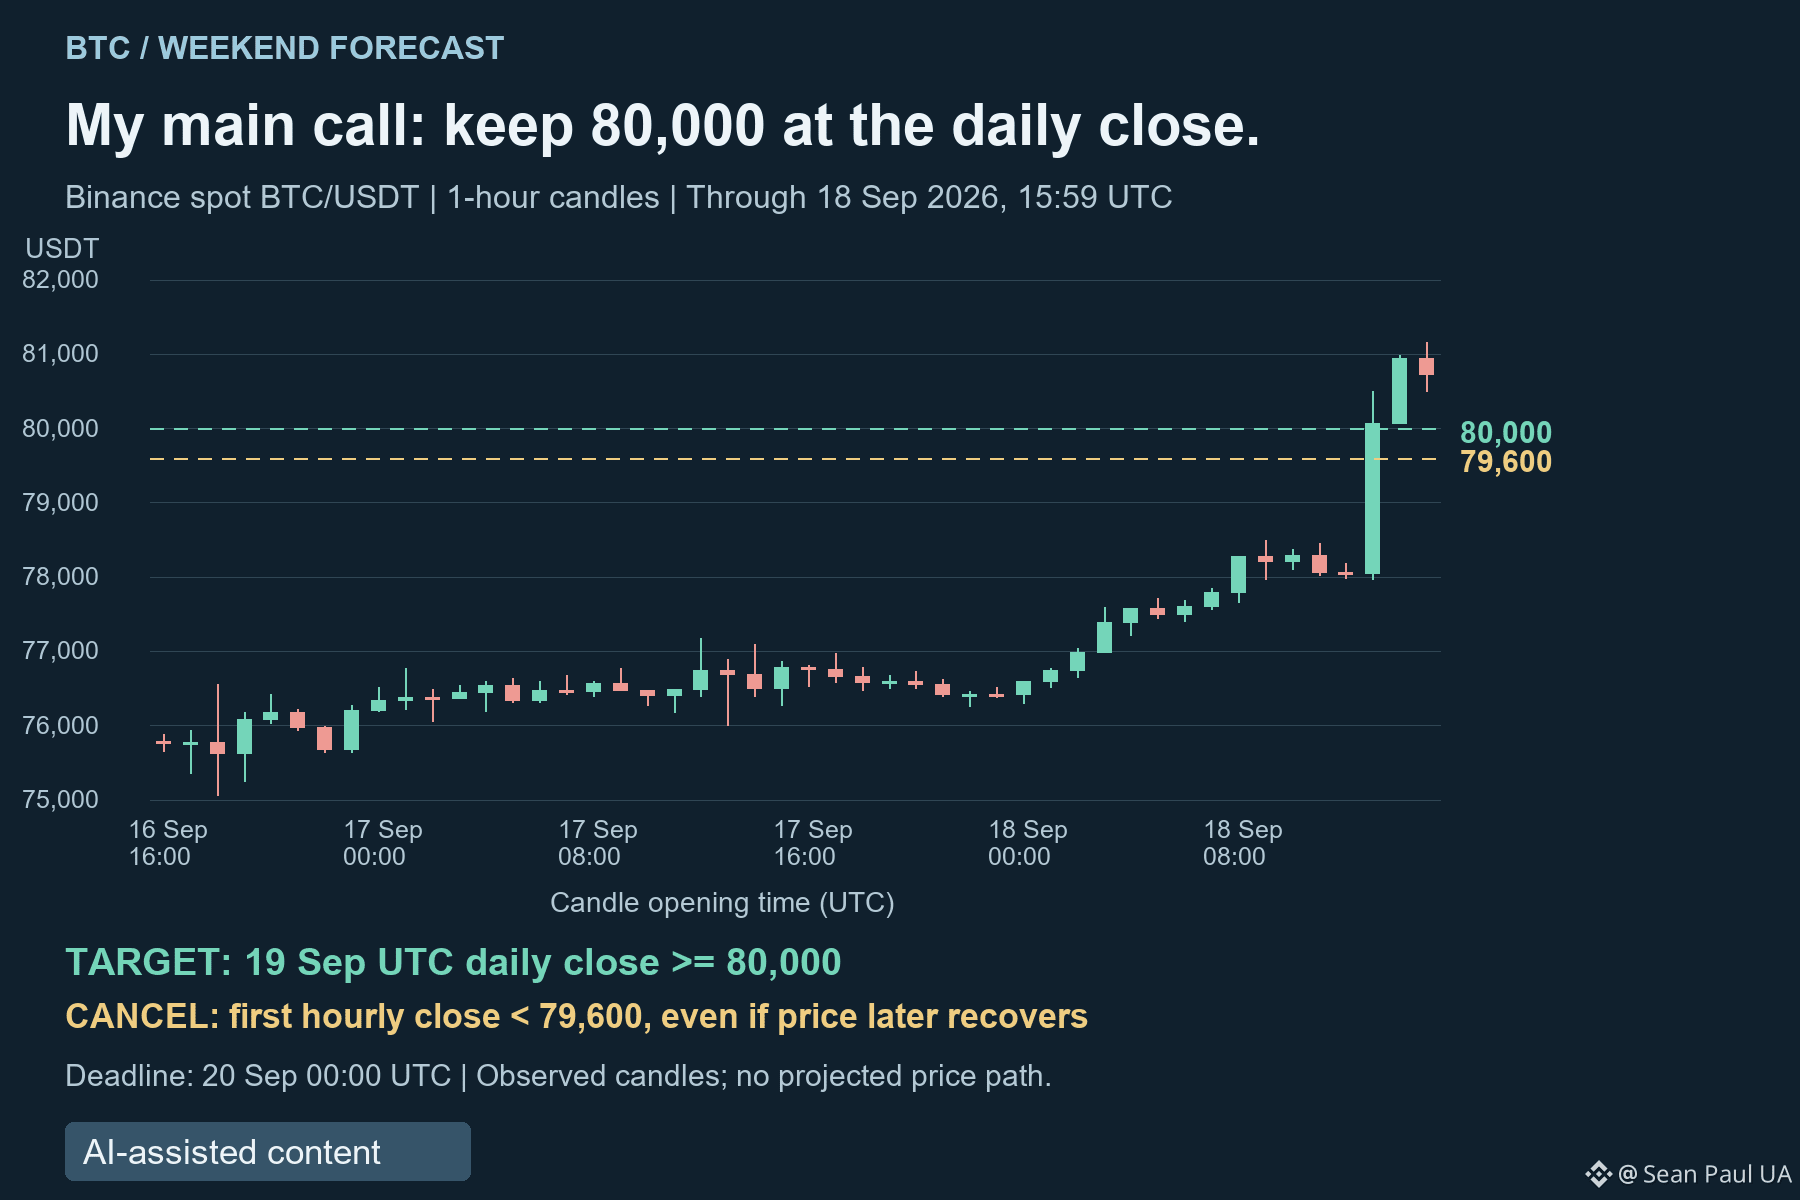
BTC has cleared 80,000. My weekend forecast is about keeping it.
On Binance spot BTC/USDT, the 13:00, 14:00 and 15:00 UTC candles today closed at 80,073.09, 80,937.83 and 80,725.60. All three finished above 80,000, and their lows rose each hour.
The earlier high in my seven-day hourly sample was 79,600 on September 14. Today's three closes also cleared that reference. That is my reason for leaning toward retention, not evidence of guaranteed demand or a claim about what caused the move.
My forecast starts at publication and ends at September 19's UTC daily close: 23:59 UTC, just before September 20 at 00:00 UTC.
My main call is that BTC finishes that daily candle at or above 80,000, with no intervening hourly close below 79,600. I favor holding the breakout area over a full reversal; sideways trade below 81,154.67 can still fit that view.
An hourly close above 81,154.67, the latest completed-hour high, would strengthen the upside alternative beyond this snapshot's peak.
An hourly close below 79,600 would put a return toward 77,972.30, the breakout hour's low, on my downside watchlist.
The first hourly close below 79,600 after publication cancels my main call, even if BTC later recovers. A wick below alone does not. If that cancellation never occurs but the final daily close is below 80,000, the forecast misses.
The open 16:00 candle is excluded. This is a new forecast; yesterday's expired map stays unchanged.
Which would challenge this view first for you: A) an hourly close below 79,600, B) failure to close above 81,154.67, or C) the final daily close below 80,000 - and why?
$BTC #Bitcoin
BTC has cleared 80,000. My weekend forecast is about keeping it.
On Binance spot BTC/USDT, the 13:00, 14:00 and 15:00 UTC candles today closed at 80,073.09, 80,937.83 and 80,725.60. All three finished above 80,000, and their lows rose each hour.
The earlier high in my seven-day hourly sample was 79,600 on September 14. Today's three closes also cleared that reference. That is my reason for leaning toward retention, not evidence of guaranteed demand or a claim about what caused the move.
My forecast starts at publication and ends at September 19's UTC daily close: 23:59 UTC, just before September 20 at 00:00 UTC.
My main call is that BTC finishes that daily candle at or above 80,000, with no intervening hourly close below 79,600. I favor holding the breakout area over a full reversal; sideways trade below 81,154.67 can still fit that view.
An hourly close above 81,154.67, the latest completed-hour high, would strengthen the upside alternative beyond this snapshot's peak.
An hourly close below 79,600 would put a return toward 77,972.30, the breakout hour's low, on my downside watchlist.
The first hourly close below 79,600 after publication cancels my main call, even if BTC later recovers. A wick below alone does not. If that cancellation never occurs but the final daily close is below 80,000, the forecast misses.
The open 16:00 candle is excluded. This is a new forecast; yesterday's expired map stays unchanged.
Which would challenge this view first for you: A) an hourly close below 79,600, B) failure to close above 81,154.67, or C) the final daily close below 80,000 - and why?
$BTC #Bitcoin
On Binance spot BTC/USDT, the 13:00, 14:00 and 15:00 UTC candles today closed at 80,073.09, 80,937.83 and 80,725.60. All three finished above 80,000, and their lows rose each hour.
The earlier high in my seven-day hourly sample was 79,600 on September 14. Today's three closes also cleared that reference. That is my reason for leaning toward retention, not evidence of guaranteed demand or a claim about what caused the move.
My forecast starts at publication and ends at September 19's UTC daily close: 23:59 UTC, just before September 20 at 00:00 UTC.
My main call is that BTC finishes that daily candle at or above 80,000, with no intervening hourly close below 79,600. I favor holding the breakout area over a full reversal; sideways trade below 81,154.67 can still fit that view.
An hourly close above 81,154.67, the latest completed-hour high, would strengthen the upside alternative beyond this snapshot's peak.
An hourly close below 79,600 would put a return toward 77,972.30, the breakout hour's low, on my downside watchlist.
The first hourly close below 79,600 after publication cancels my main call, even if BTC later recovers. A wick below alone does not. If that cancellation never occurs but the final daily close is below 80,000, the forecast misses.
The open 16:00 candle is excluded. This is a new forecast; yesterday's expired map stays unchanged.
Which would challenge this view first for you: A) an hourly close below 79,600, B) failure to close above 81,154.67, or C) the final daily close below 80,000 - and why?
$BTC #Bitcoin
1
37
·
--
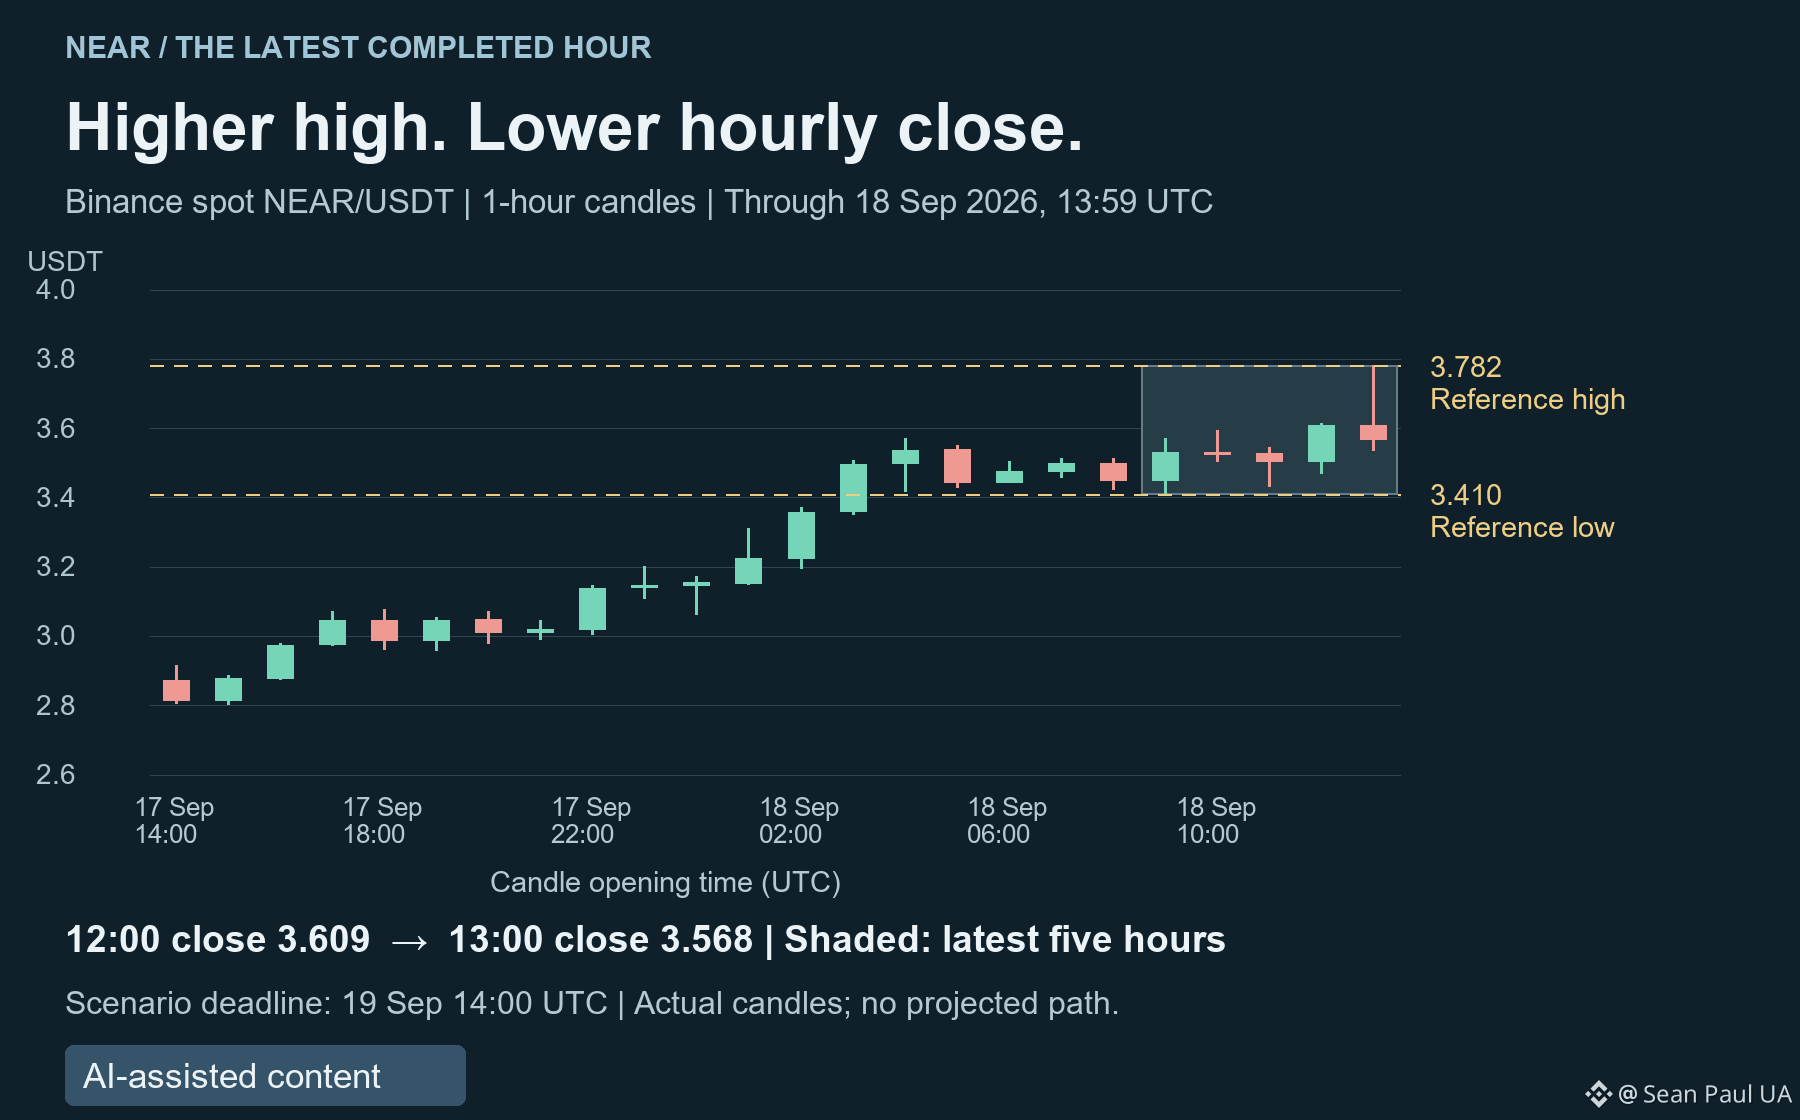
NEAR made a higher high, then finished the hour below its previous close. That's the detail I'm watching after the rally.
On Binance spot NEAR/USDT, September 18's 12:00 UTC candle topped at 3.615 and closed at 3.609. The 13:00 candle reached 3.782 but closed at 3.568, back below that earlier high.
That is a failed extension at this hourly cutoff, not proof the wider rally is over. The five completed hours from 09:00 through 13:59 UTC span 3.410-3.782. Those observed extremes give me a testable range, rather than a new target borrowed from the headline.
My map runs from publication through the hourly candle ending September 19 at 13:59 UTC.
Two consecutive hourly closes above 3.782 would confirm a fresh break beyond this observed high.
Closes between 3.410 and 3.782 keep price inside the reference range; a wick outside alone does not confirm a break.
Two consecutive hourly closes below 3.410 would confirm a break beneath the five-hour low.
A later hourly close back inside 3.410-3.782 invalidates either confirmed break. All conditions expire at that deadline.
The still-open 14:00 candle is excluded. These levels describe this snapshot, not guaranteed support or resistance.
Which would change your reading more before that deadline: a confirmed break above 3.782 or below 3.410, and why?
$NEAR #NEARProtocol
NEAR made a higher high, then finished the hour below its previous close. That's the detail I'm watching after the rally.
On Binance spot NEAR/USDT, September 18's 12:00 UTC candle topped at 3.615 and closed at 3.609. The 13:00 candle reached 3.782 but closed at 3.568, back below that earlier high.
That is a failed extension at this hourly cutoff, not proof the wider rally is over. The five completed hours from 09:00 through 13:59 UTC span 3.410-3.782. Those observed extremes give me a testable range, rather than a new target borrowed from the headline.
My map runs from publication through the hourly candle ending September 19 at 13:59 UTC.
Two consecutive hourly closes above 3.782 would confirm a fresh break beyond this observed high.
Closes between 3.410 and 3.782 keep price inside the reference range; a wick outside alone does not confirm a break.
Two consecutive hourly closes below 3.410 would confirm a break beneath the five-hour low.
A later hourly close back inside 3.410-3.782 invalidates either confirmed break. All conditions expire at that deadline.
The still-open 14:00 candle is excluded. These levels describe this snapshot, not guaranteed support or resistance.
Which would change your reading more before that deadline: a confirmed break above 3.782 or below 3.410, and why?
$NEAR #NEARProtocol
On Binance spot NEAR/USDT, September 18's 12:00 UTC candle topped at 3.615 and closed at 3.609. The 13:00 candle reached 3.782 but closed at 3.568, back below that earlier high.
That is a failed extension at this hourly cutoff, not proof the wider rally is over. The five completed hours from 09:00 through 13:59 UTC span 3.410-3.782. Those observed extremes give me a testable range, rather than a new target borrowed from the headline.
My map runs from publication through the hourly candle ending September 19 at 13:59 UTC.
Two consecutive hourly closes above 3.782 would confirm a fresh break beyond this observed high.
Closes between 3.410 and 3.782 keep price inside the reference range; a wick outside alone does not confirm a break.
Two consecutive hourly closes below 3.410 would confirm a break beneath the five-hour low.
A later hourly close back inside 3.410-3.782 invalidates either confirmed break. All conditions expire at that deadline.
The still-open 14:00 candle is excluded. These levels describe this snapshot, not guaranteed support or resistance.
Which would change your reading more before that deadline: a confirmed break above 3.782 or below 3.410, and why?
$NEAR #NEARProtocol
1
27
·
--
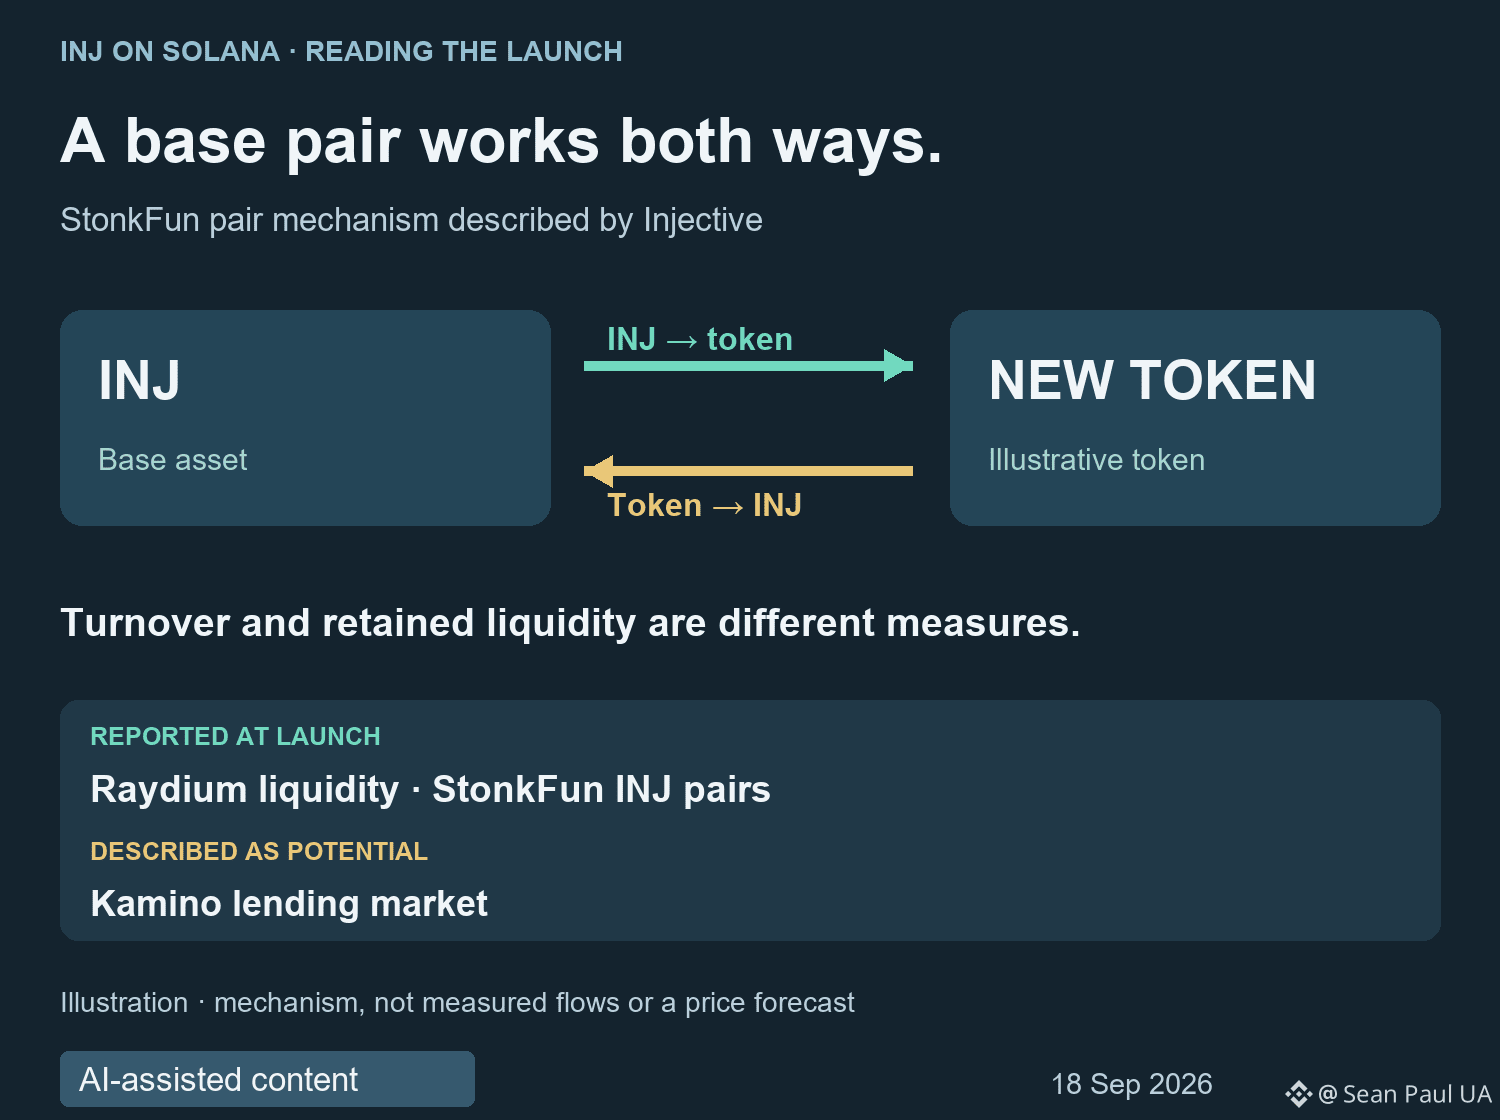
INJ's Solana launch adds a new role: a base pair for other tokens. I'm watching both directions of that relationship.
Injective's September 17 announcement says Sunrise brought INJ to Solana, with launch liquidity on Raydium. StonkFun supports creators launching tokens paired with INJ.
In that pair, someone exchanges INJ for the new token; selling the token returns INJ. More activity can create another use for INJ, but counting every swap as fresh outside buying would miss that two-way flow.
I'd separate turnover from how much INJ stays committed to these markets. They answer different questions, and a launch announcement doesn't establish either number.
There's another distinction in the release: access through more interfaces needn't mean a separate allocation of launch liquidity for each one. More app names aren't automatically more independent pools.
Injective also describes a potential Kamino lending market. I'm keeping that in the possible-integrations column; this announcement doesn't confirm that market is live.
Which would help you judge this expansion most: A) repeat users, B) liquidity depth, or C) sustained INJ balances in the new markets - and why?
$INJ #Injective #Solana
INJ's Solana launch adds a new role: a base pair for other tokens. I'm watching both directions of that relationship.
Injective's September 17 announcement says Sunrise brought INJ to Solana, with launch liquidity on Raydium. StonkFun supports creators launching tokens paired with INJ.
In that pair, someone exchanges INJ for the new token; selling the token returns INJ. More activity can create another use for INJ, but counting every swap as fresh outside buying would miss that two-way flow.
I'd separate turnover from how much INJ stays committed to these markets. They answer different questions, and a launch announcement doesn't establish either number.
There's another distinction in the release: access through more interfaces needn't mean a separate allocation of launch liquidity for each one. More app names aren't automatically more independent pools.
Injective also describes a potential Kamino lending market. I'm keeping that in the possible-integrations column; this announcement doesn't confirm that market is live.
Which would help you judge this expansion most: A) repeat users, B) liquidity depth, or C) sustained INJ balances in the new markets - and why?
$INJ #Injective #Solana
Injective's September 17 announcement says Sunrise brought INJ to Solana, with launch liquidity on Raydium. StonkFun supports creators launching tokens paired with INJ.
In that pair, someone exchanges INJ for the new token; selling the token returns INJ. More activity can create another use for INJ, but counting every swap as fresh outside buying would miss that two-way flow.
I'd separate turnover from how much INJ stays committed to these markets. They answer different questions, and a launch announcement doesn't establish either number.
There's another distinction in the release: access through more interfaces needn't mean a separate allocation of launch liquidity for each one. More app names aren't automatically more independent pools.
Injective also describes a potential Kamino lending market. I'm keeping that in the possible-integrations column; this announcement doesn't confirm that market is live.
Which would help you judge this expansion most: A) repeat users, B) liquidity depth, or C) sustained INJ balances in the new markets - and why?
$INJ #Injective #Solana
1
112
·
--
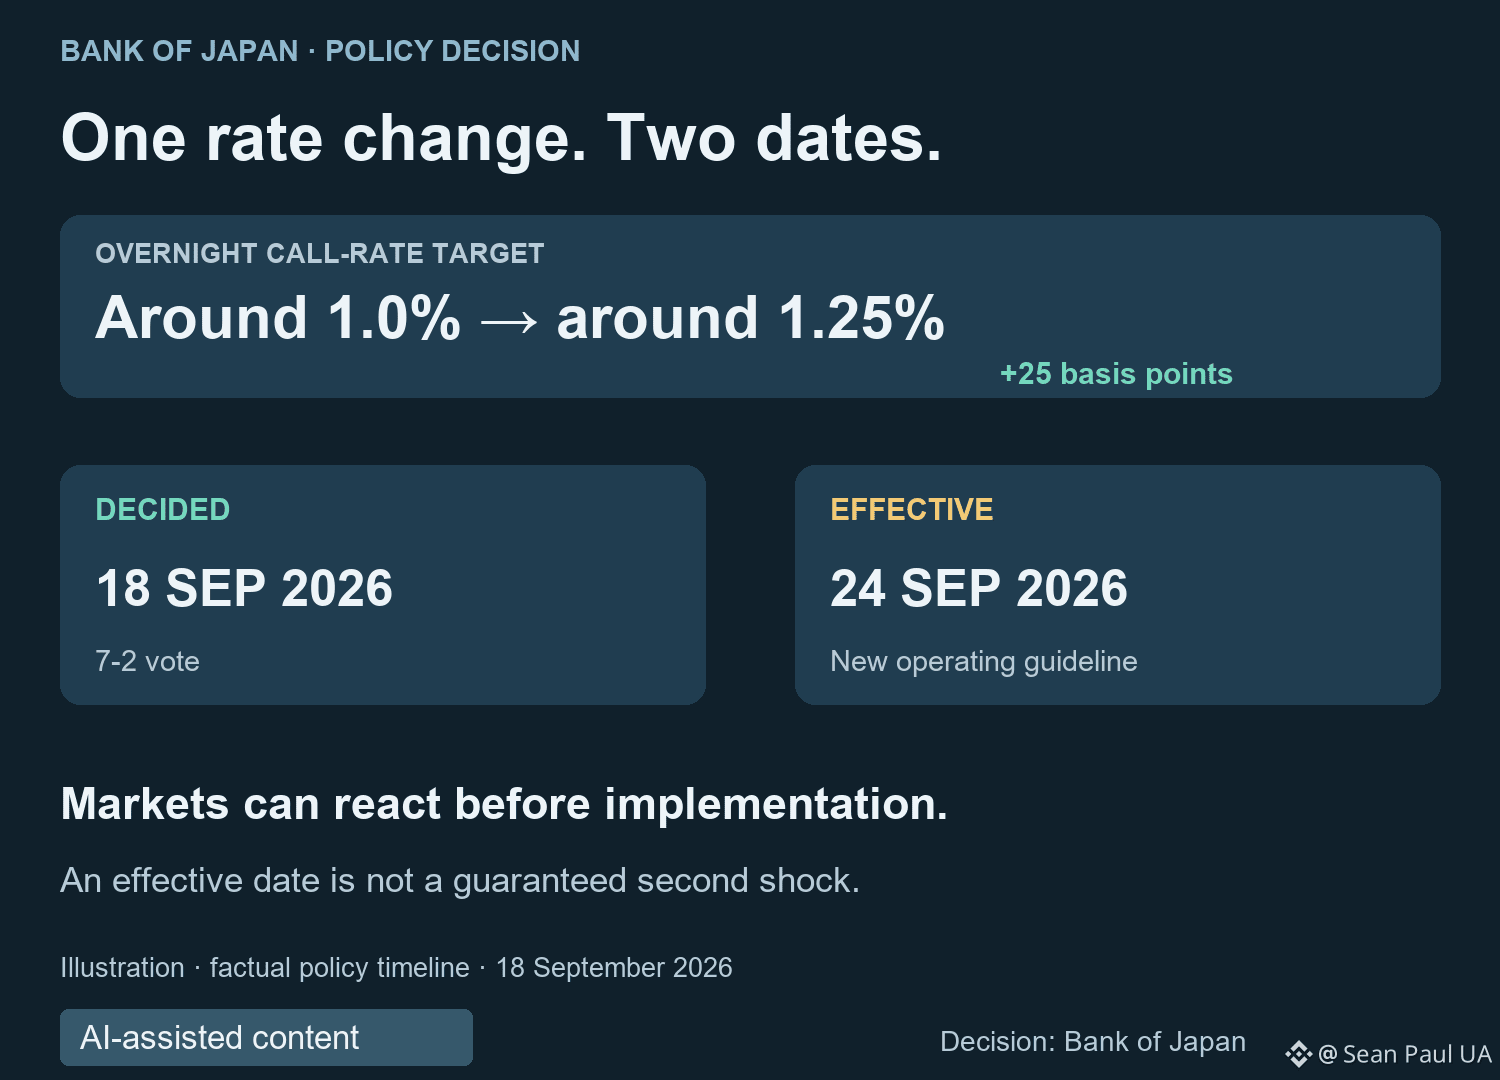
Japan's new 1.25% rate has two dates worth keeping separate.
The Bank of Japan decided today, September 18, to lift its overnight call-rate target from around 1.0% to around 1.25%. The vote was 7-2. That's a 25-basis-point increase.
The detail I'm putting on my calendar: the new guideline takes effect on September 24. The decision date and the implementation date are six days apart.
That gap isn't a six-day countdown before markets can react. Investors can reassess an announced policy change before it becomes operational. I wouldn't treat September 24 as a guaranteed second shock for BTC.
I'm also keeping two parts of the BOJ's message together. It says further rate increases will respond to economic, price and financial developments, while expecting financial conditions to remain accommodative after this change. Today's hike doesn't give us a fixed timetable for the next one.
For my crypto watchlist, this is a confirmed policy update, not proof that yen-funded positions are being unwound. That stronger claim needs separate evidence of positioning and market flows.
Which would change your reading of this decision more: the implementation date or clearer guidance on the next increase, and why?
#BankOfJapan #Macro
Japan's new 1.25% rate has two dates worth keeping separate.
The Bank of Japan decided today, September 18, to lift its overnight call-rate target from around 1.0% to around 1.25%. The vote was 7-2. That's a 25-basis-point increase.
The detail I'm putting on my calendar: the new guideline takes effect on September 24. The decision date and the implementation date are six days apart.
That gap isn't a six-day countdown before markets can react. Investors can reassess an announced policy change before it becomes operational. I wouldn't treat September 24 as a guaranteed second shock for BTC.
I'm also keeping two parts of the BOJ's message together. It says further rate increases will respond to economic, price and financial developments, while expecting financial conditions to remain accommodative after this change. Today's hike doesn't give us a fixed timetable for the next one.
For my crypto watchlist, this is a confirmed policy update, not proof that yen-funded positions are being unwound. That stronger claim needs separate evidence of positioning and market flows.
Which would change your reading of this decision more: the implementation date or clearer guidance on the next increase, and why?
#BankOfJapan #Macro
The Bank of Japan decided today, September 18, to lift its overnight call-rate target from around 1.0% to around 1.25%. The vote was 7-2. That's a 25-basis-point increase.
The detail I'm putting on my calendar: the new guideline takes effect on September 24. The decision date and the implementation date are six days apart.
That gap isn't a six-day countdown before markets can react. Investors can reassess an announced policy change before it becomes operational. I wouldn't treat September 24 as a guaranteed second shock for BTC.
I'm also keeping two parts of the BOJ's message together. It says further rate increases will respond to economic, price and financial developments, while expecting financial conditions to remain accommodative after this change. Today's hike doesn't give us a fixed timetable for the next one.
For my crypto watchlist, this is a confirmed policy update, not proof that yen-funded positions are being unwound. That stronger claim needs separate evidence of positioning and market flows.
Which would change your reading of this decision more: the implementation date or clearer guidance on the next increase, and why?
#BankOfJapan #Macro
1
30
·
--
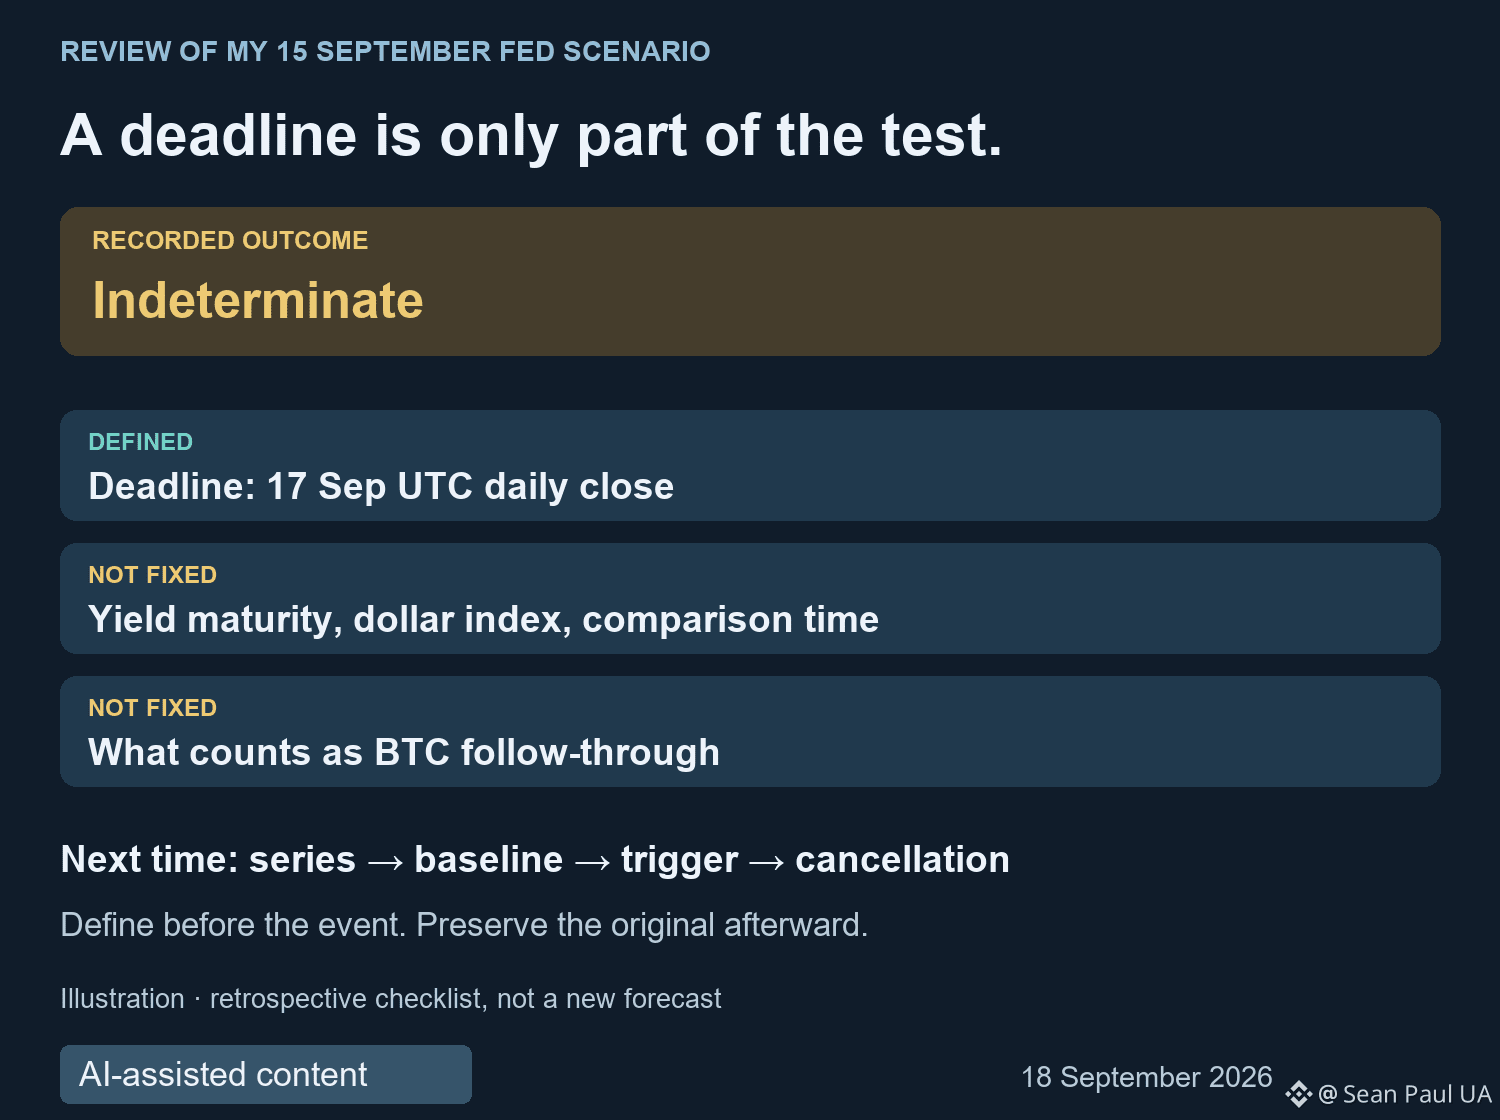
My September 15 Fed scenario gets an indeterminate result. The weak point was in my wording.
I gave it a deadline: the September 17 UTC daily close. But I linked BTC's direction to yields and the dollar without fixing which Treasury maturity, which dollar index or which comparison time I would use.
I also wrote that BTC needed to follow through. I didn't define how much movement, or what sequence of closes, would count. A deadline can't make an undefined test measurable.
That means I can't fairly score this as a correct directional call. Choosing the best-fitting index or threshold after seeing the result would create a different scenario. I'm leaving the original conditions unchanged and recording the outcome as indeterminate.
For the next macro setup, I want the market series, starting observation, trigger and cancellation rule written down before the event. I'd also separate two questions: did the stated conditions occur, and is there enough evidence to attribute the move to that event? Matching directions alone doesn't settle the second question.
Which missing detail makes a macro scenario least useful to you: A) the exact market series, B) the activation threshold, or C) the cancellation rule - and why?
#Macro #MarketEducation
My September 15 Fed scenario gets an indeterminate result. The weak point was in my wording.
I gave it a deadline: the September 17 UTC daily close. But I linked BTC's direction to yields and the dollar without fixing which Treasury maturity, which dollar index or which comparison time I would use.
I also wrote that BTC needed to follow through. I didn't define how much movement, or what sequence of closes, would count. A deadline can't make an undefined test measurable.
That means I can't fairly score this as a correct directional call. Choosing the best-fitting index or threshold after seeing the result would create a different scenario. I'm leaving the original conditions unchanged and recording the outcome as indeterminate.
For the next macro setup, I want the market series, starting observation, trigger and cancellation rule written down before the event. I'd also separate two questions: did the stated conditions occur, and is there enough evidence to attribute the move to that event? Matching directions alone doesn't settle the second question.
Which missing detail makes a macro scenario least useful to you: A) the exact market series, B) the activation threshold, or C) the cancellation rule - and why?
#Macro #MarketEducation
I gave it a deadline: the September 17 UTC daily close. But I linked BTC's direction to yields and the dollar without fixing which Treasury maturity, which dollar index or which comparison time I would use.
I also wrote that BTC needed to follow through. I didn't define how much movement, or what sequence of closes, would count. A deadline can't make an undefined test measurable.
That means I can't fairly score this as a correct directional call. Choosing the best-fitting index or threshold after seeing the result would create a different scenario. I'm leaving the original conditions unchanged and recording the outcome as indeterminate.
For the next macro setup, I want the market series, starting observation, trigger and cancellation rule written down before the event. I'd also separate two questions: did the stated conditions occur, and is there enough evidence to attribute the move to that event? Matching directions alone doesn't settle the second question.
Which missing detail makes a macro scenario least useful to you: A) the exact market series, B) the activation threshold, or C) the cancellation rule - and why?
#Macro #MarketEducation
1
43
·
--
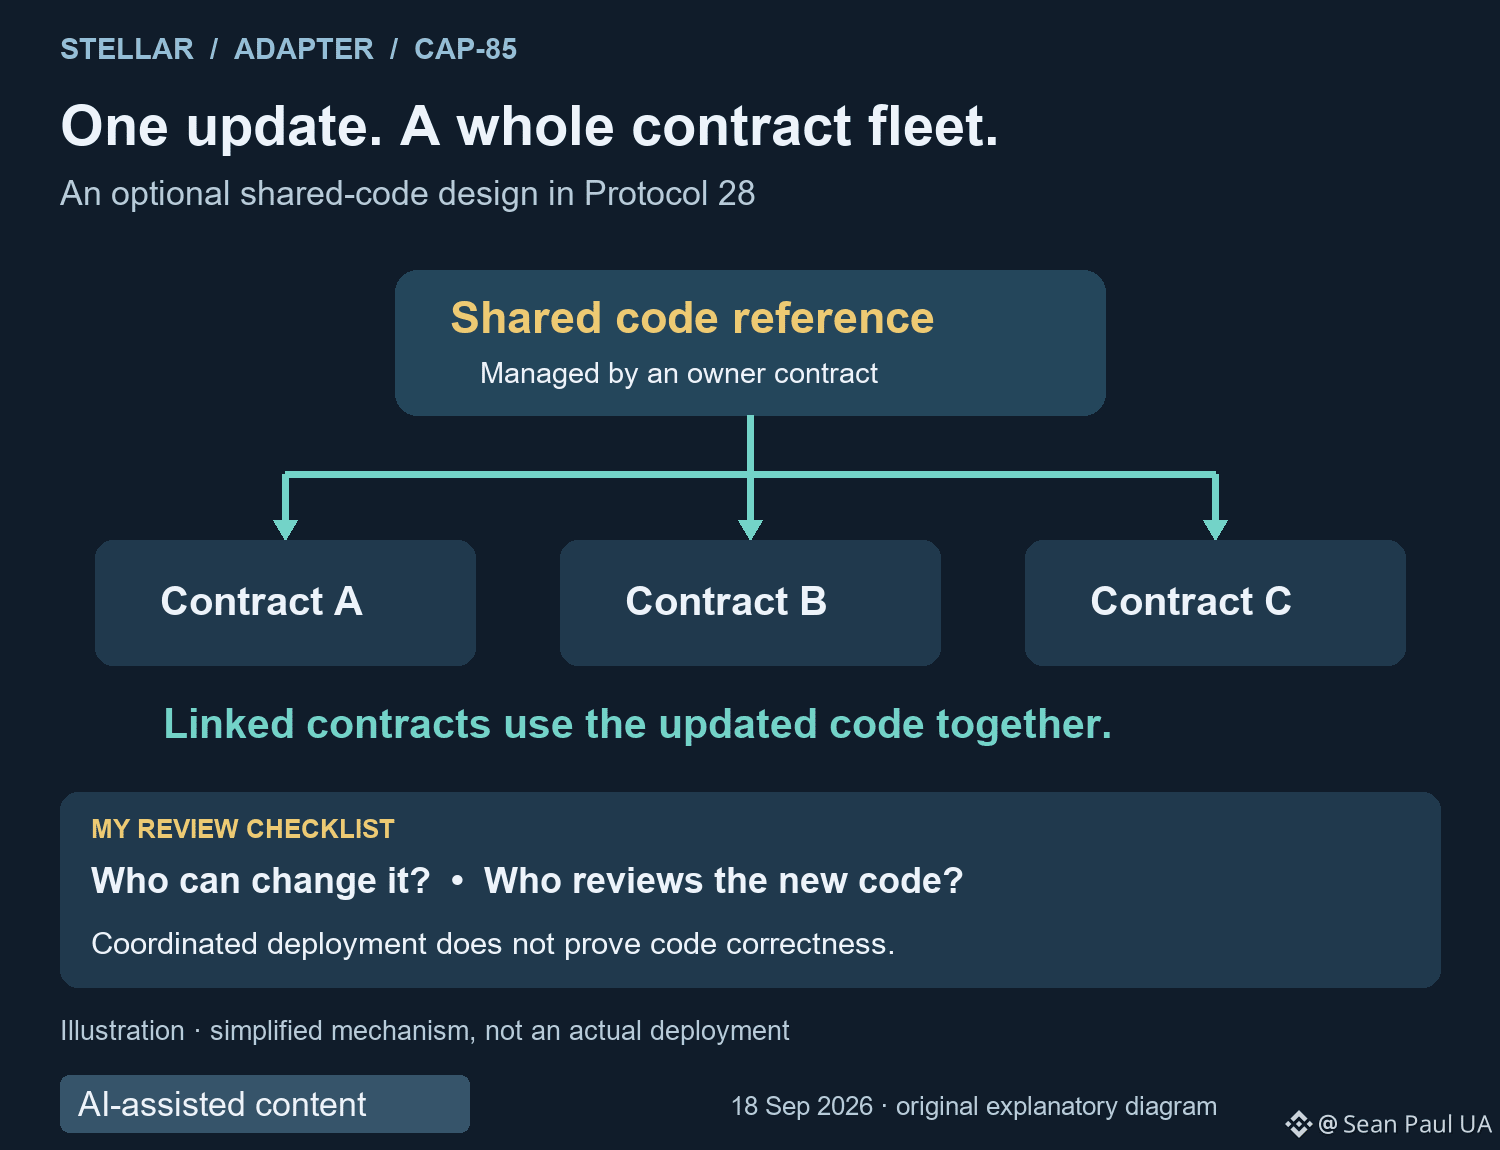
Stellar's Protocol 28 is live. The feature I'm watching is one update reaching a whole fleet of contracts.
Adapter's CAP-85 lets participating smart contracts use a shared code reference managed by another contract. Updating that reference changes the code used by the entire linked fleet together. Stellar's documentation calls this an atomic upgrade.
Why it matters: a large rollout no longer has to leave some linked contracts on the old version while others run the new one. Teams have to adopt this design; it doesn't automatically convert every existing contract.
My next check would be who controls that shared reference and how changes are reviewed. Updating everything together can remove a messy rollout window, but it doesn't prove that the replacement code is correct. One coordinated update still needs careful authorization and testing.
There is a separate speed story, too. The Stellar Development Foundation says the full consensus performance gains will be phased in as parallel transaction-set downloading is enabled. I wouldn't treat the protocol number alone as proof of a particular throughput increase.
What safeguard would you want before an app can update an entire contract fleet together?
$XLM #Stellar #SmartContracts
Stellar's Protocol 28 is live. The feature I'm watching is one update reaching a whole fleet of contracts.
Adapter's CAP-85 lets participating smart contracts use a shared code reference managed by another contract. Updating that reference changes the code used by the entire linked fleet together. Stellar's documentation calls this an atomic upgrade.
Why it matters: a large rollout no longer has to leave some linked contracts on the old version while others run the new one. Teams have to adopt this design; it doesn't automatically convert every existing contract.
My next check would be who controls that shared reference and how changes are reviewed. Updating everything together can remove a messy rollout window, but it doesn't prove that the replacement code is correct. One coordinated update still needs careful authorization and testing.
There is a separate speed story, too. The Stellar Development Foundation says the full consensus performance gains will be phased in as parallel transaction-set downloading is enabled. I wouldn't treat the protocol number alone as proof of a particular throughput increase.
What safeguard would you want before an app can update an entire contract fleet together?
$XLM #Stellar #SmartContracts
Adapter's CAP-85 lets participating smart contracts use a shared code reference managed by another contract. Updating that reference changes the code used by the entire linked fleet together. Stellar's documentation calls this an atomic upgrade.
Why it matters: a large rollout no longer has to leave some linked contracts on the old version while others run the new one. Teams have to adopt this design; it doesn't automatically convert every existing contract.
My next check would be who controls that shared reference and how changes are reviewed. Updating everything together can remove a messy rollout window, but it doesn't prove that the replacement code is correct. One coordinated update still needs careful authorization and testing.
There is a separate speed story, too. The Stellar Development Foundation says the full consensus performance gains will be phased in as parallel transaction-set downloading is enabled. I wouldn't treat the protocol number alone as proof of a particular throughput increase.
What safeguard would you want before an app can update an entire contract fleet together?
$XLM #Stellar #SmartContracts
1
97
·
--
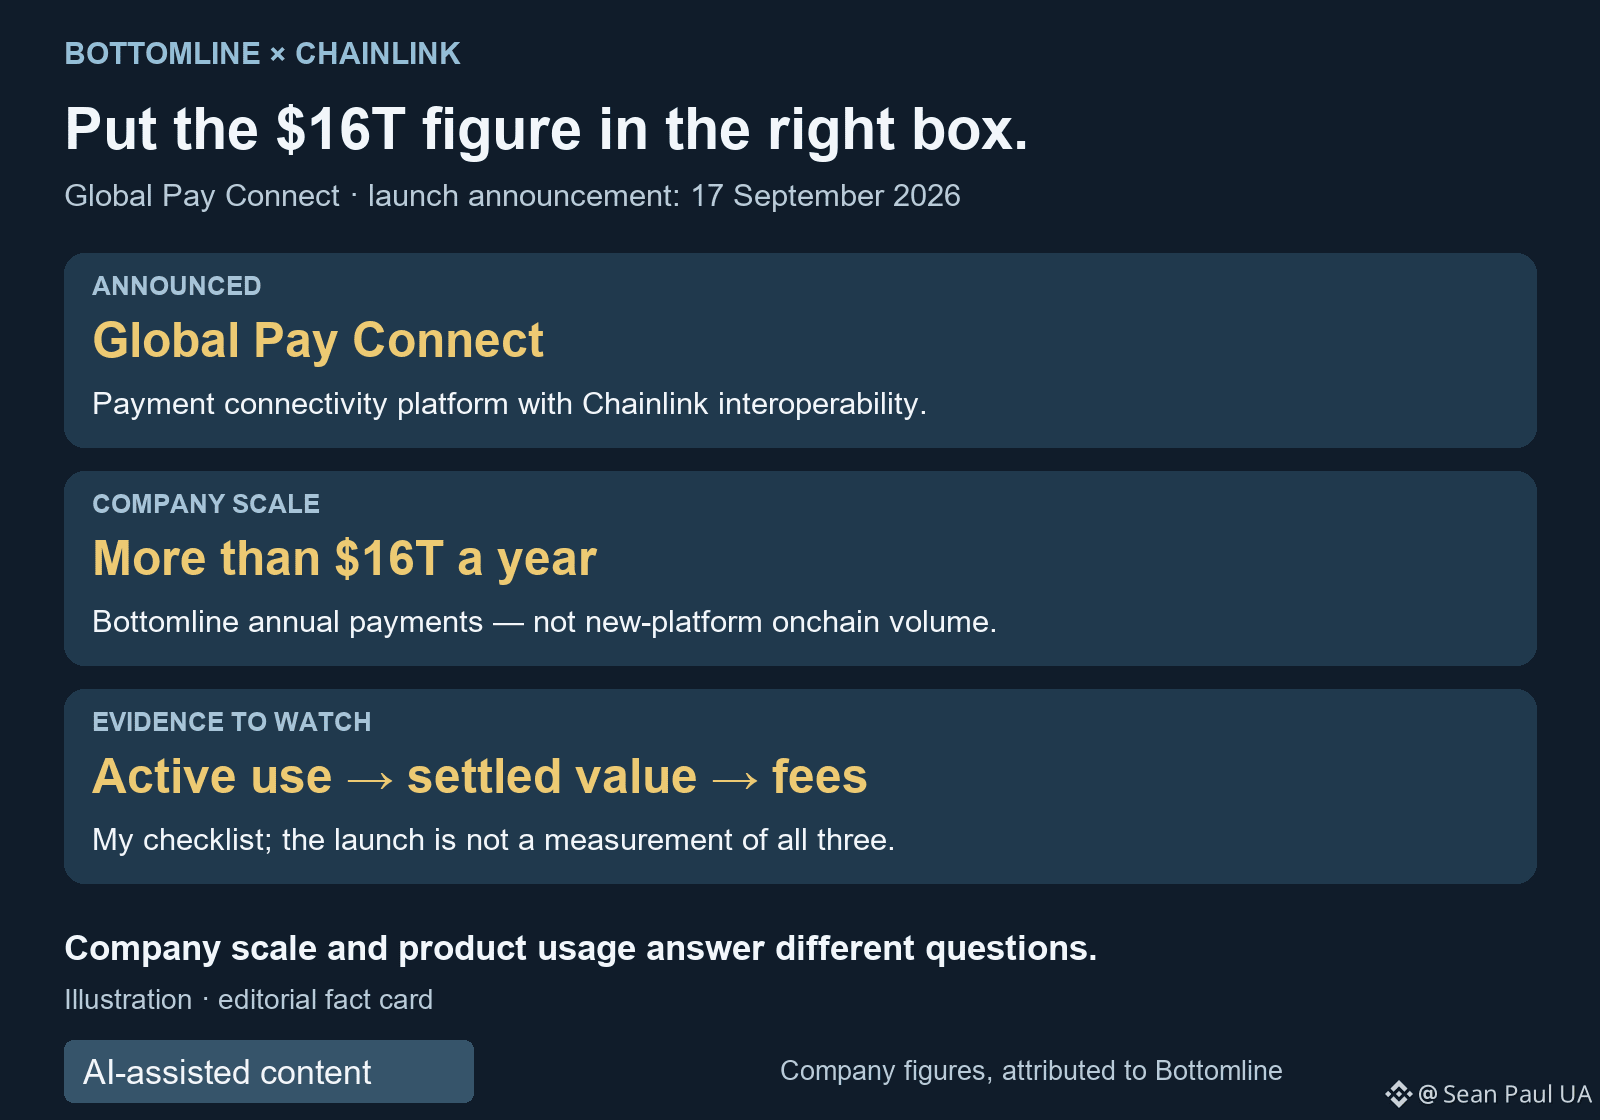
Bottomline's $16 trillion figure needs a label before it becomes a LINK headline.
On September 17, Bottomline announced the launch of Global Pay Connect, a cloud platform for financial messaging and payment connectivity. It says its Chainlink collaboration lets banks connect to multiple blockchain networks through their existing Bottomline connections.
The same release says Bottomline moves more than $16 trillion in payments annually. That is a company-wide scale figure. It isn't a reported total of payments settled onchain through the new platform.
This is the gap I'm watching: access can make adoption easier, but it doesn't measure adoption. The launch release doesn't give a count of banks already using its blockchain connections or a total for payments routed through them.
For my LINK notebook, I'd keep three measurements separate: institutions actively using the connection, the value they actually settle onchain, and the fees generated by that activity. A large existing payments business doesn't supply those answers by itself.
Which disclosure would help you assess this launch most: A) active institutions, B) onchain settlement volume, or C) recurring service fees - and why?
$LINK #Chainlink #Payments
Bottomline's $16 trillion figure needs a label before it becomes a LINK headline.
On September 17, Bottomline announced the launch of Global Pay Connect, a cloud platform for financial messaging and payment connectivity. It says its Chainlink collaboration lets banks connect to multiple blockchain networks through their existing Bottomline connections.
The same release says Bottomline moves more than $16 trillion in payments annually. That is a company-wide scale figure. It isn't a reported total of payments settled onchain through the new platform.
This is the gap I'm watching: access can make adoption easier, but it doesn't measure adoption. The launch release doesn't give a count of banks already using its blockchain connections or a total for payments routed through them.
For my LINK notebook, I'd keep three measurements separate: institutions actively using the connection, the value they actually settle onchain, and the fees generated by that activity. A large existing payments business doesn't supply those answers by itself.
Which disclosure would help you assess this launch most: A) active institutions, B) onchain settlement volume, or C) recurring service fees - and why?
$LINK #Chainlink #Payments
On September 17, Bottomline announced the launch of Global Pay Connect, a cloud platform for financial messaging and payment connectivity. It says its Chainlink collaboration lets banks connect to multiple blockchain networks through their existing Bottomline connections.
The same release says Bottomline moves more than $16 trillion in payments annually. That is a company-wide scale figure. It isn't a reported total of payments settled onchain through the new platform.
This is the gap I'm watching: access can make adoption easier, but it doesn't measure adoption. The launch release doesn't give a count of banks already using its blockchain connections or a total for payments routed through them.
For my LINK notebook, I'd keep three measurements separate: institutions actively using the connection, the value they actually settle onchain, and the fees generated by that activity. A large existing payments business doesn't supply those answers by itself.
Which disclosure would help you assess this launch most: A) active institutions, B) onchain settlement volume, or C) recurring service fees - and why?
$LINK #Chainlink #Payments
1
325
·
--
BTC finally printed two hourly closes above 77,179.47. They came after my deadline.
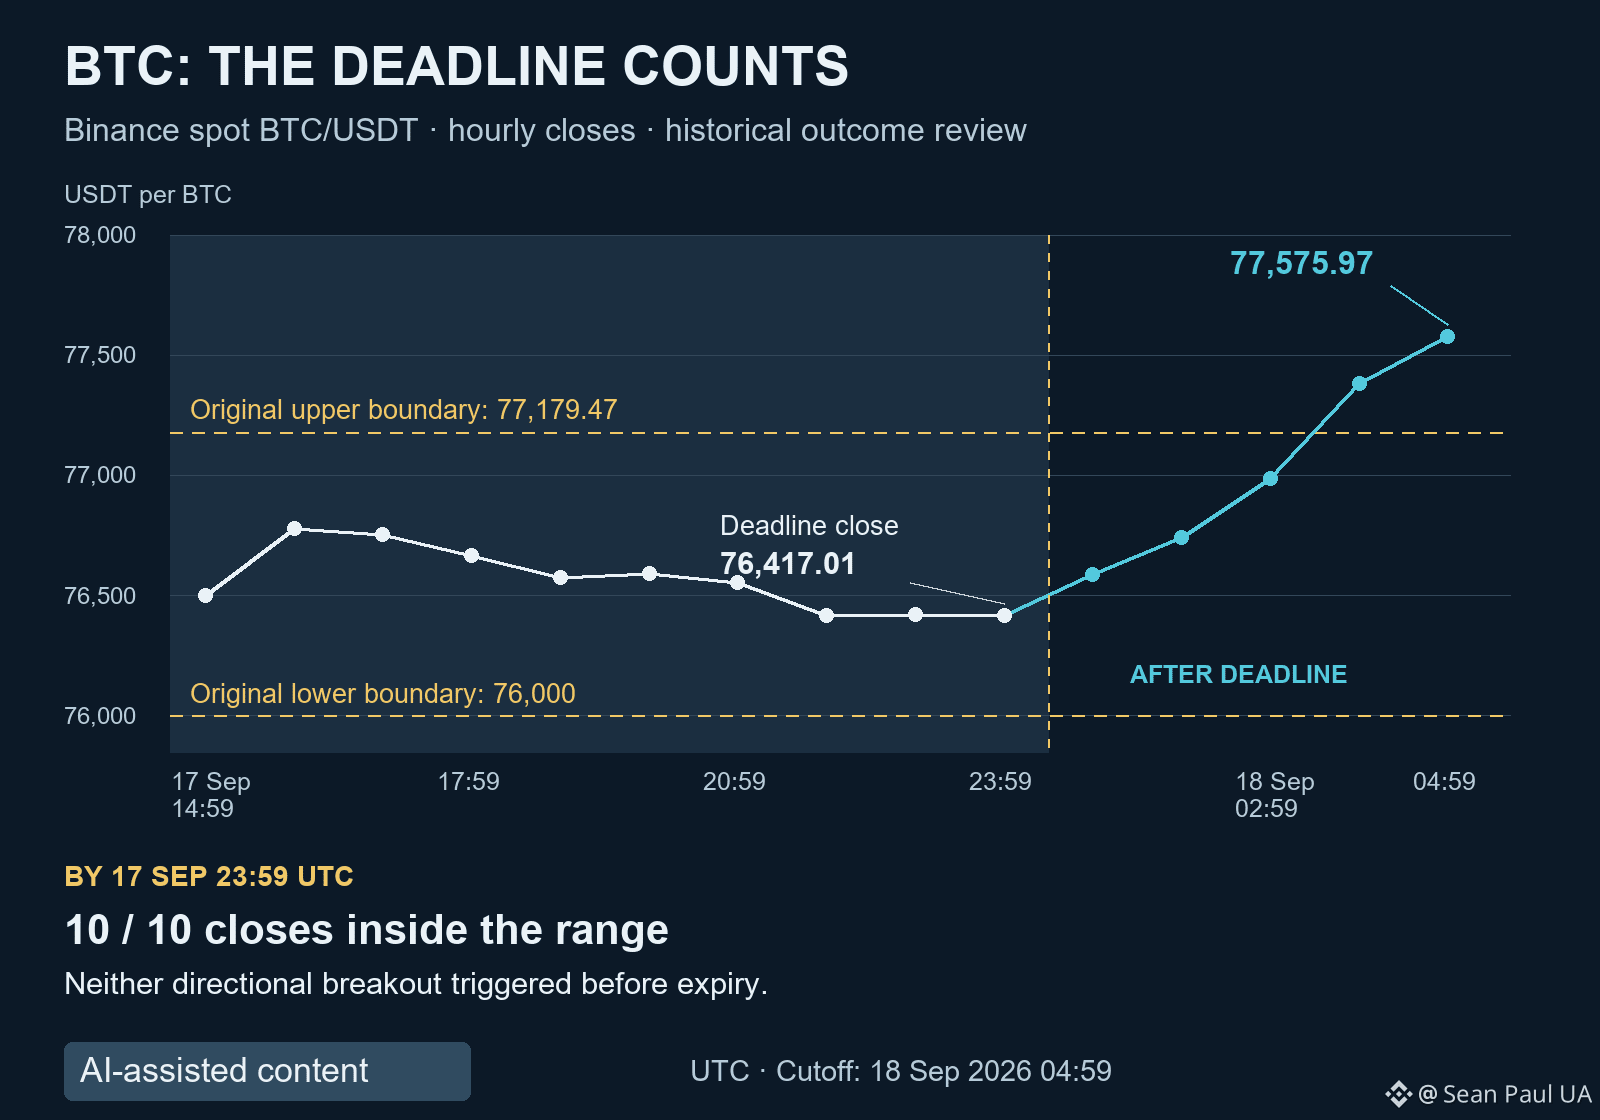
Yesterday's map used 76,000-77,179.47 on Binance spot BTC/USDT. It required two consecutive hourly closes outside that range, and expired at September 17's 23:59 UTC close.
All ten hourly closes after publication and through that deadline stayed inside. The final one was 76,417.01. Neither the upside nor the downside breakout activated. The range condition held; this wasn't a preferred-direction forecast to chalk up as a win.
Then the timing changed the story. September 18's 03:59 and 04:59 UTC closes were 77,383.47 and 77,575.97, both above the old upper boundary. Those observations belong to the next period. They cannot turn an expired, untriggered scenario into a successful breakout call.
That's the distinction I want to keep in my notebook: a level, a confirmation rule and a deadline all belong to the same test. Moving the deadline after seeing the price would change the test.
What rule do you use to keep hindsight out when a move arrives after your scenario's deadline?
$BTC #Bitcoin
BTC finally printed two hourly closes above 77,179.47. They came after my deadline.
Yesterday's map used 76,000-77,179.47 on Binance spot BTC/USDT. It required two consecutive hourly closes outside that range, and expired at September 17's 23:59 UTC close.
All ten hourly closes after publication and through that deadline stayed inside. The final one was 76,417.01. Neither the upside nor the downside breakout activated. The range condition held; this wasn't a preferred-direction forecast to chalk up as a win.
Then the timing changed the story. September 18's 03:59 and 04:59 UTC closes were 77,383.47 and 77,575.97, both above the old upper boundary. Those observations belong to the next period. They cannot turn an expired, untriggered scenario into a successful breakout call.
That's the distinction I want to keep in my notebook: a level, a confirmation rule and a deadline all belong to the same test. Moving the deadline after seeing the price would change the test.
What rule do you use to keep hindsight out when a move arrives after your scenario's deadline?
$BTC #Bitcoin
Yesterday's map used 76,000-77,179.47 on Binance spot BTC/USDT. It required two consecutive hourly closes outside that range, and expired at September 17's 23:59 UTC close.
All ten hourly closes after publication and through that deadline stayed inside. The final one was 76,417.01. Neither the upside nor the downside breakout activated. The range condition held; this wasn't a preferred-direction forecast to chalk up as a win.
Then the timing changed the story. September 18's 03:59 and 04:59 UTC closes were 77,383.47 and 77,575.97, both above the old upper boundary. Those observations belong to the next period. They cannot turn an expired, untriggered scenario into a successful breakout call.
That's the distinction I want to keep in my notebook: a level, a confirmation rule and a deadline all belong to the same test. Moving the deadline after seeing the price would change the test.
What rule do you use to keep hindsight out when a move arrives after your scenario's deadline?
$BTC #Bitcoin
1
109
·
--
196,000 got the headline. The dates are what I'm checking next.
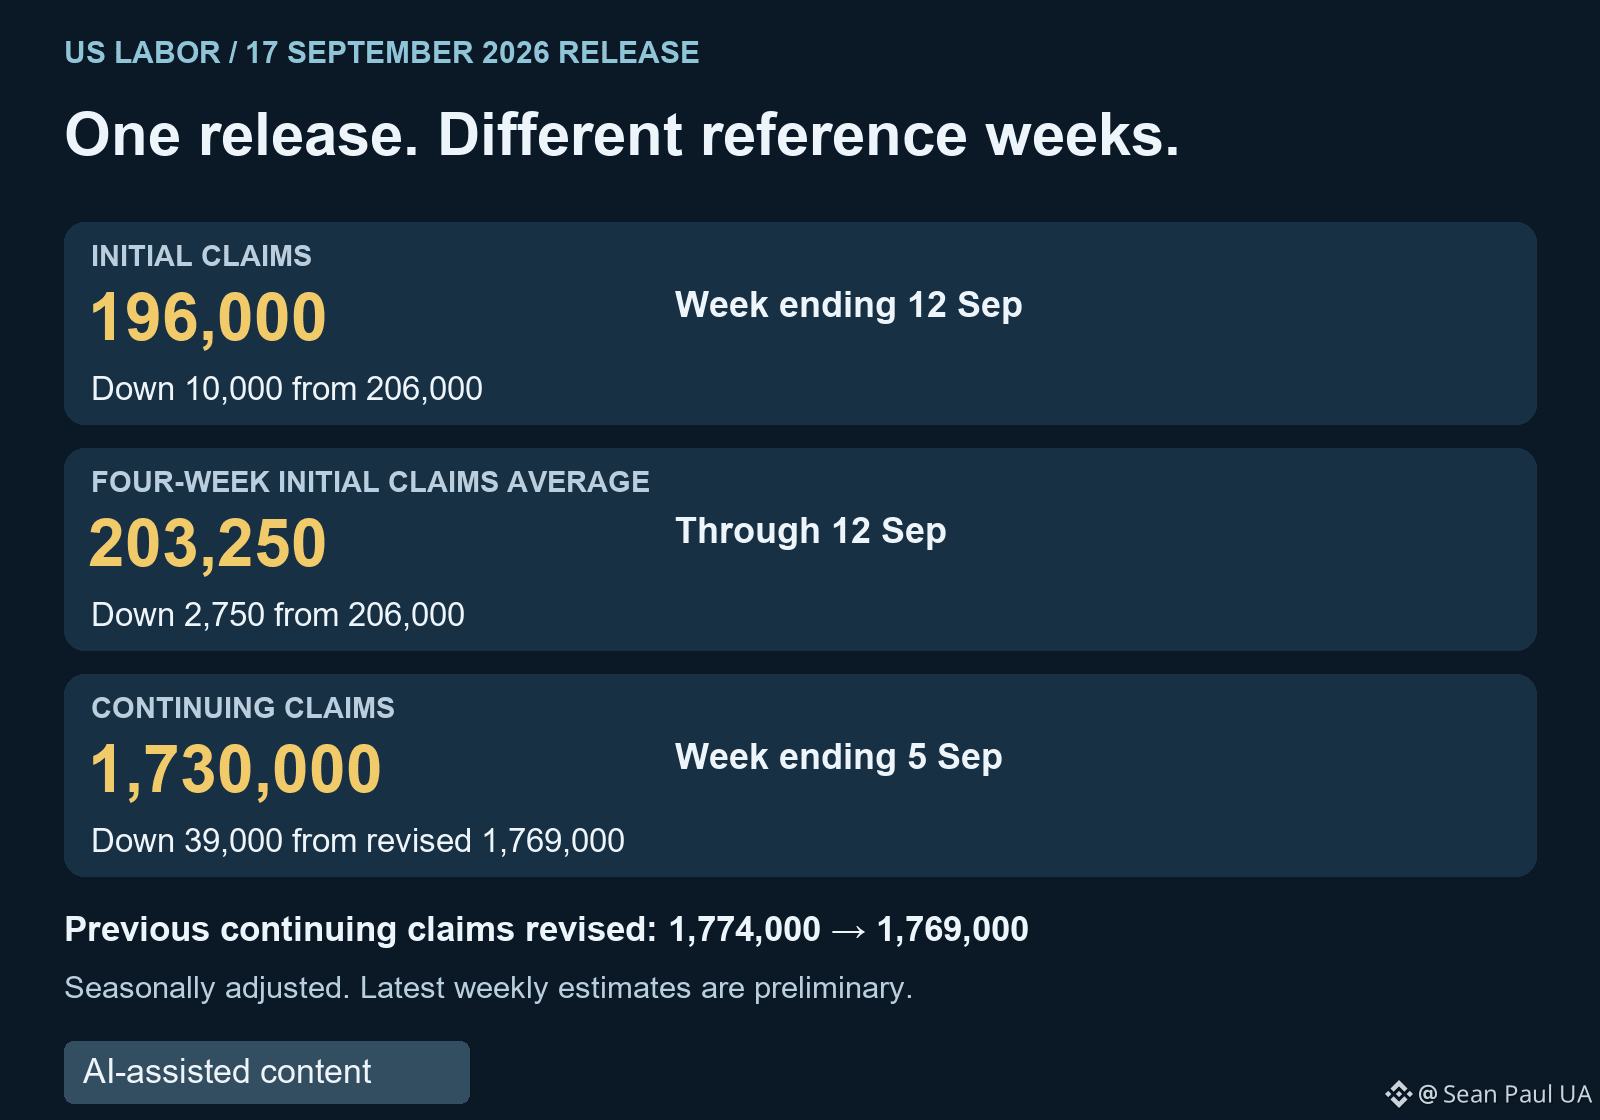
The US Labor Department's September 17 release puts initial jobless claims at 196,000 for the week ending September 12, down 10,000. The four-week average fell to 203,250.
Continuing claims were 1.73 million, down 39,000, but that number covers the week ending September 5. Different measures, different reference weeks. I wouldn't add them together or describe them as one week's total.
There's a revision worth keeping: the previous continuing-claims figure was cut from 1.774 million to 1.769 million. The reported 39,000 decline uses that revised baseline.
All those figures are seasonally adjusted, and the latest weekly estimates are preliminary. For my crypto macro notebook, getting the dates and revisions right comes before drawing a conclusion about rates. This release alone doesn't settle BTC's next move.
Which gets the most weight in your reading of the labor market: A) new claims, B) the four-week average, or C) continuing claims? What makes it more useful to you?
#Macro #LaborMarket
196,000 got the headline. The dates are what I'm checking next.
The US Labor Department's September 17 release puts initial jobless claims at 196,000 for the week ending September 12, down 10,000. The four-week average fell to 203,250.
Continuing claims were 1.73 million, down 39,000, but that number covers the week ending September 5. Different measures, different reference weeks. I wouldn't add them together or describe them as one week's total.
There's a revision worth keeping: the previous continuing-claims figure was cut from 1.774 million to 1.769 million. The reported 39,000 decline uses that revised baseline.
All those figures are seasonally adjusted, and the latest weekly estimates are preliminary. For my crypto macro notebook, getting the dates and revisions right comes before drawing a conclusion about rates. This release alone doesn't settle BTC's next move.
Which gets the most weight in your reading of the labor market: A) new claims, B) the four-week average, or C) continuing claims? What makes it more useful to you?
#Macro #LaborMarket
The US Labor Department's September 17 release puts initial jobless claims at 196,000 for the week ending September 12, down 10,000. The four-week average fell to 203,250.
Continuing claims were 1.73 million, down 39,000, but that number covers the week ending September 5. Different measures, different reference weeks. I wouldn't add them together or describe them as one week's total.
There's a revision worth keeping: the previous continuing-claims figure was cut from 1.774 million to 1.769 million. The reported 39,000 decline uses that revised baseline.
All those figures are seasonally adjusted, and the latest weekly estimates are preliminary. For my crypto macro notebook, getting the dates and revisions right comes before drawing a conclusion about rates. This release alone doesn't settle BTC's next move.
Which gets the most weight in your reading of the labor market: A) new claims, B) the four-week average, or C) continuing claims? What makes it more useful to you?
#Macro #LaborMarket
1
19
·
--
LSK's chain deadline matters more to me than another price target.
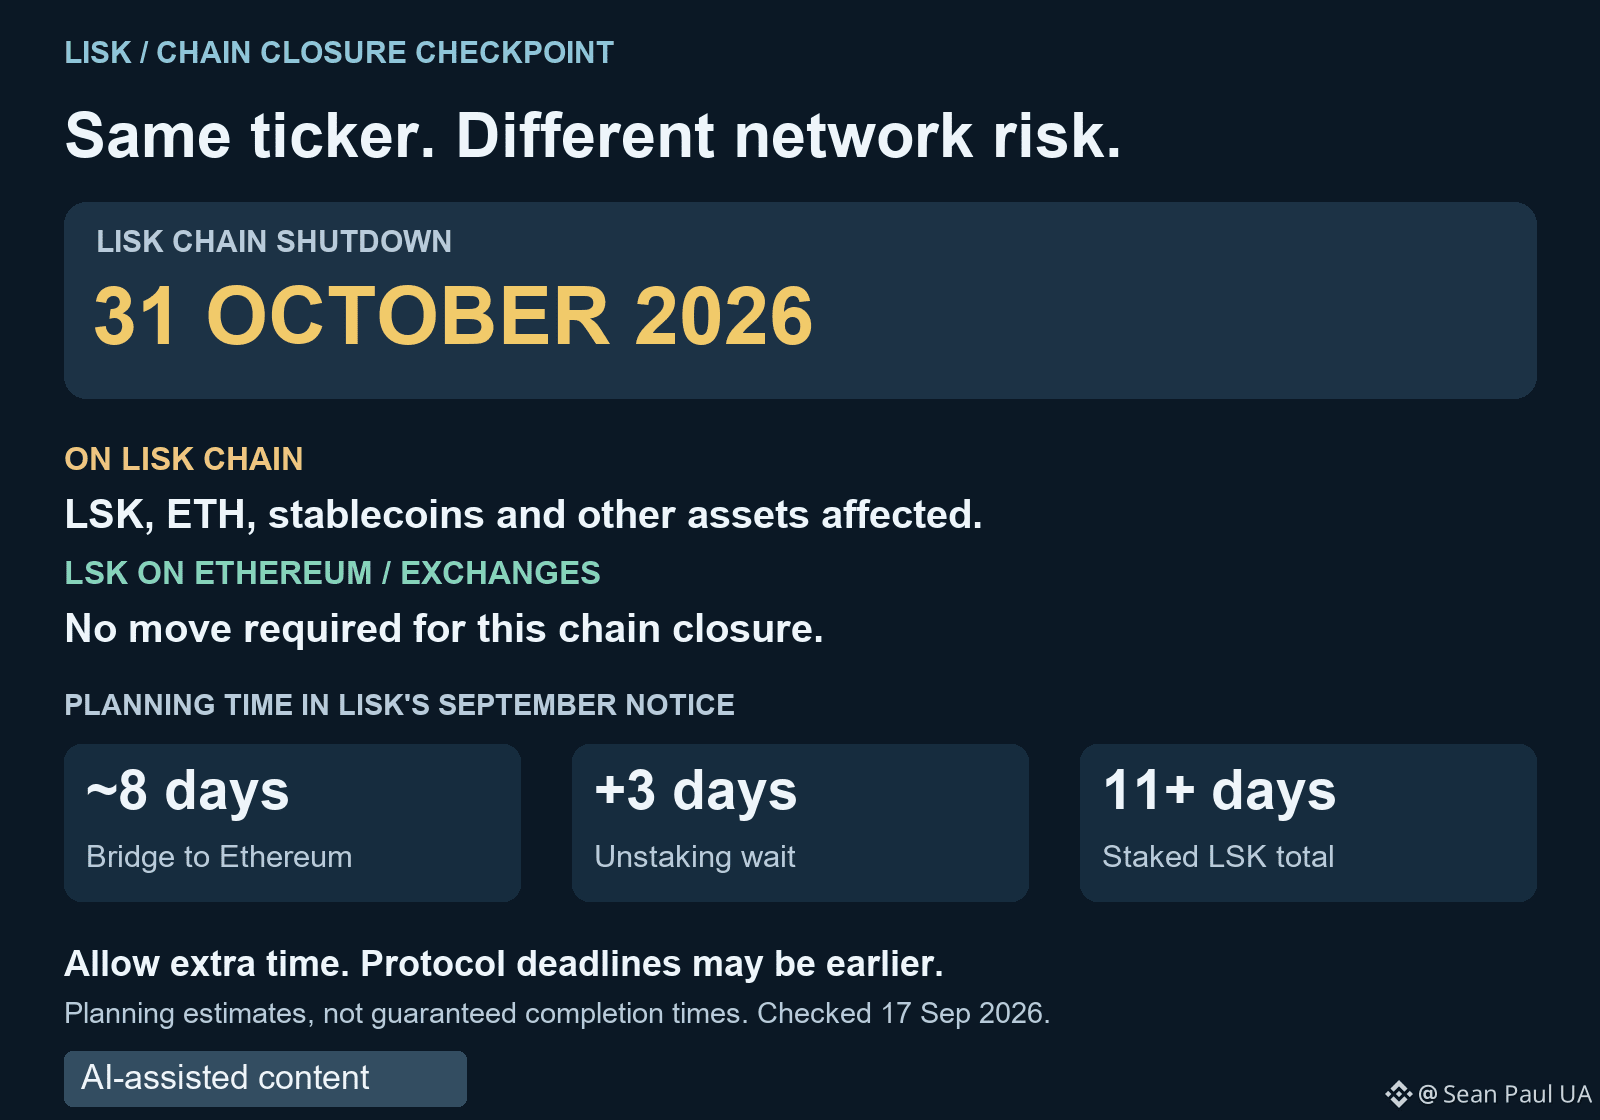
Lisk's September notice says Lisk Chain will shut down on October 31, 2026. That deadline applies to assets on that network, including ETH and stablecoins, not just LSK.
The distinction I don't want to lose: Lisk's token FAQ says the Ethereum LSK contract stays unchanged and there is no token swap. LSK already on Ethereum or an exchange does not need to move because of this chain closure. That isn't a promise about future exchange listings.
The timing deserves attention. The September notice allows around eight days for bridging, plus a three-day wait for unstaking: at least eleven days in total for staked LSK. Those are planning estimates, not guaranteed completion times. Individual DeFi protocols may have earlier deadlines.
Lisk also says assets left on the chain after shutdown become inaccessible. I'm treating this as an operational deadline, not evidence that the token must rise or fall.
My first check would be the network an asset is actually on. A ticker alone doesn't answer that, and the closure announcement isn't new today.
What detail do you think people most often miss in a chain shutdown: the asset's network, the waiting periods, or a protocol's earlier deadline? Why?
$LSK #Lisk
LSK's chain deadline matters more to me than another price target.
Lisk's September notice says Lisk Chain will shut down on October 31, 2026. That deadline applies to assets on that network, including ETH and stablecoins, not just LSK.
The distinction I don't want to lose: Lisk's token FAQ says the Ethereum LSK contract stays unchanged and there is no token swap. LSK already on Ethereum or an exchange does not need to move because of this chain closure. That isn't a promise about future exchange listings.
The timing deserves attention. The September notice allows around eight days for bridging, plus a three-day wait for unstaking: at least eleven days in total for staked LSK. Those are planning estimates, not guaranteed completion times. Individual DeFi protocols may have earlier deadlines.
Lisk also says assets left on the chain after shutdown become inaccessible. I'm treating this as an operational deadline, not evidence that the token must rise or fall.
My first check would be the network an asset is actually on. A ticker alone doesn't answer that, and the closure announcement isn't new today.
What detail do you think people most often miss in a chain shutdown: the asset's network, the waiting periods, or a protocol's earlier deadline? Why?
$LSK #Lisk
Lisk's September notice says Lisk Chain will shut down on October 31, 2026. That deadline applies to assets on that network, including ETH and stablecoins, not just LSK.
The distinction I don't want to lose: Lisk's token FAQ says the Ethereum LSK contract stays unchanged and there is no token swap. LSK already on Ethereum or an exchange does not need to move because of this chain closure. That isn't a promise about future exchange listings.
The timing deserves attention. The September notice allows around eight days for bridging, plus a three-day wait for unstaking: at least eleven days in total for staked LSK. Those are planning estimates, not guaranteed completion times. Individual DeFi protocols may have earlier deadlines.
Lisk also says assets left on the chain after shutdown become inaccessible. I'm treating this as an operational deadline, not evidence that the token must rise or fall.
My first check would be the network an asset is actually on. A ticker alone doesn't answer that, and the closure announcement isn't new today.
What detail do you think people most often miss in a chain shutdown: the asset's network, the waiting periods, or a protocol's earlier deadline? Why?
$LSK #Lisk
1
299
·
--
ZEC's breakout held through the deadline. Here's what the original rules actually showed.
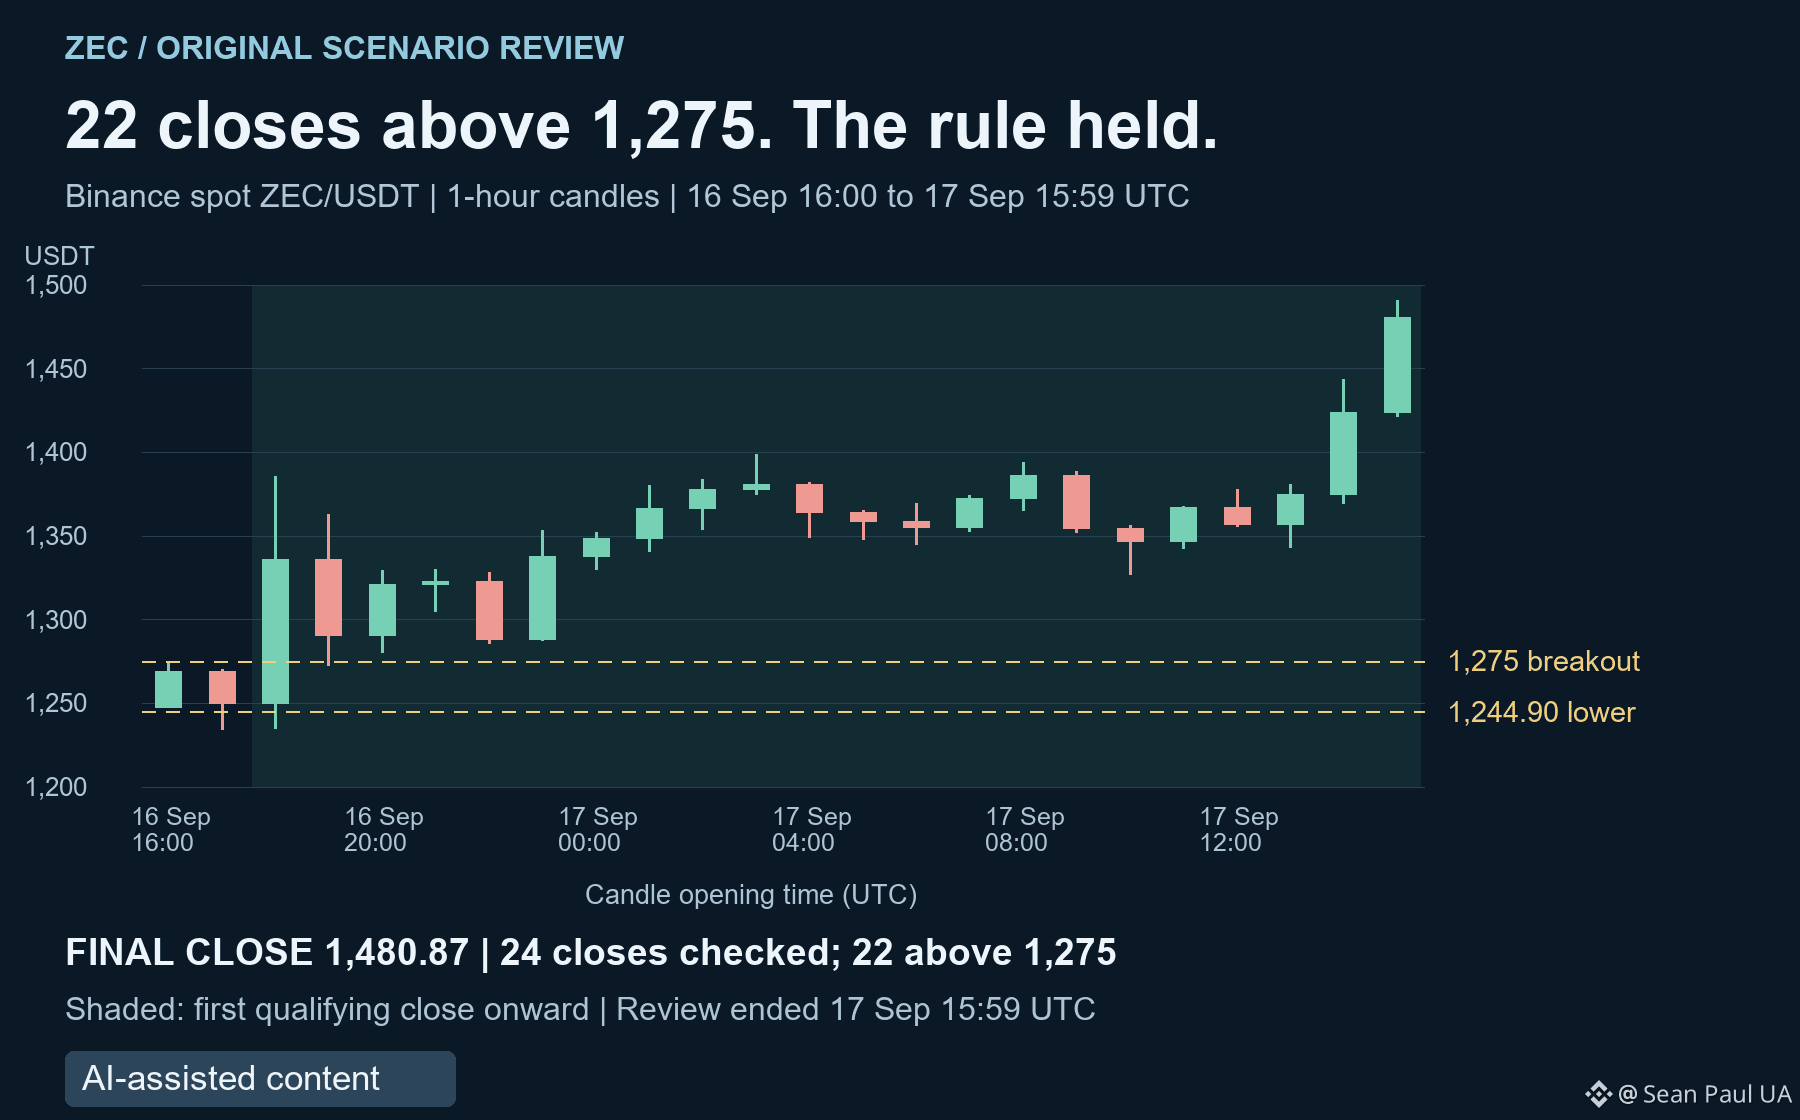
Yesterday I was watching 1,275 on Binance spot ZEC/USDT: a close above it, then a later close holding above. A subsequent hourly close below 1,275 would cancel that upside reading.
The first qualifying close was September 16 at 18:59 UTC: 1,336.23. The next was 1,290.73. From that first break through September 17's 15:59 UTC deadline, all 22 hourly closes stayed above 1,275. The final close was 1,480.87.
The downside check matters too. There were wicks below the original 1,244.90 lower boundary, but none of the 24 hourly closes after publication finished below it. A wick would have given a different answer from the rule I published.
My takeaway: the upside condition appeared and survived its invalidation test for the stated window. I didn't predict a 1,480 price target or claim a trade. This was a conditional map, and its deadline is now over.
Which part matters most when you review a breakout: A) the first close beyond the level, B) whether later closes hold it, or C) the final checkpoint? Why?
$ZEC #Zcash
ZEC's breakout held through the deadline. Here's what the original rules actually showed.
Yesterday I was watching 1,275 on Binance spot ZEC/USDT: a close above it, then a later close holding above. A subsequent hourly close below 1,275 would cancel that upside reading.
The first qualifying close was September 16 at 18:59 UTC: 1,336.23. The next was 1,290.73. From that first break through September 17's 15:59 UTC deadline, all 22 hourly closes stayed above 1,275. The final close was 1,480.87.
The downside check matters too. There were wicks below the original 1,244.90 lower boundary, but none of the 24 hourly closes after publication finished below it. A wick would have given a different answer from the rule I published.
My takeaway: the upside condition appeared and survived its invalidation test for the stated window. I didn't predict a 1,480 price target or claim a trade. This was a conditional map, and its deadline is now over.
Which part matters most when you review a breakout: A) the first close beyond the level, B) whether later closes hold it, or C) the final checkpoint? Why?
$ZEC #Zcash
Yesterday I was watching 1,275 on Binance spot ZEC/USDT: a close above it, then a later close holding above. A subsequent hourly close below 1,275 would cancel that upside reading.
The first qualifying close was September 16 at 18:59 UTC: 1,336.23. The next was 1,290.73. From that first break through September 17's 15:59 UTC deadline, all 22 hourly closes stayed above 1,275. The final close was 1,480.87.
The downside check matters too. There were wicks below the original 1,244.90 lower boundary, but none of the 24 hourly closes after publication finished below it. A wick would have given a different answer from the rule I published.
My takeaway: the upside condition appeared and survived its invalidation test for the stated window. I didn't predict a 1,480 price target or claim a trade. This was a conditional map, and its deadline is now over.
Which part matters most when you review a breakout: A) the first close beyond the level, B) whether later closes hold it, or C) the final checkpoint? Why?
$ZEC #Zcash
1
266
·
--
BTC traded above 77,000. I'm watching whether the closes can follow.
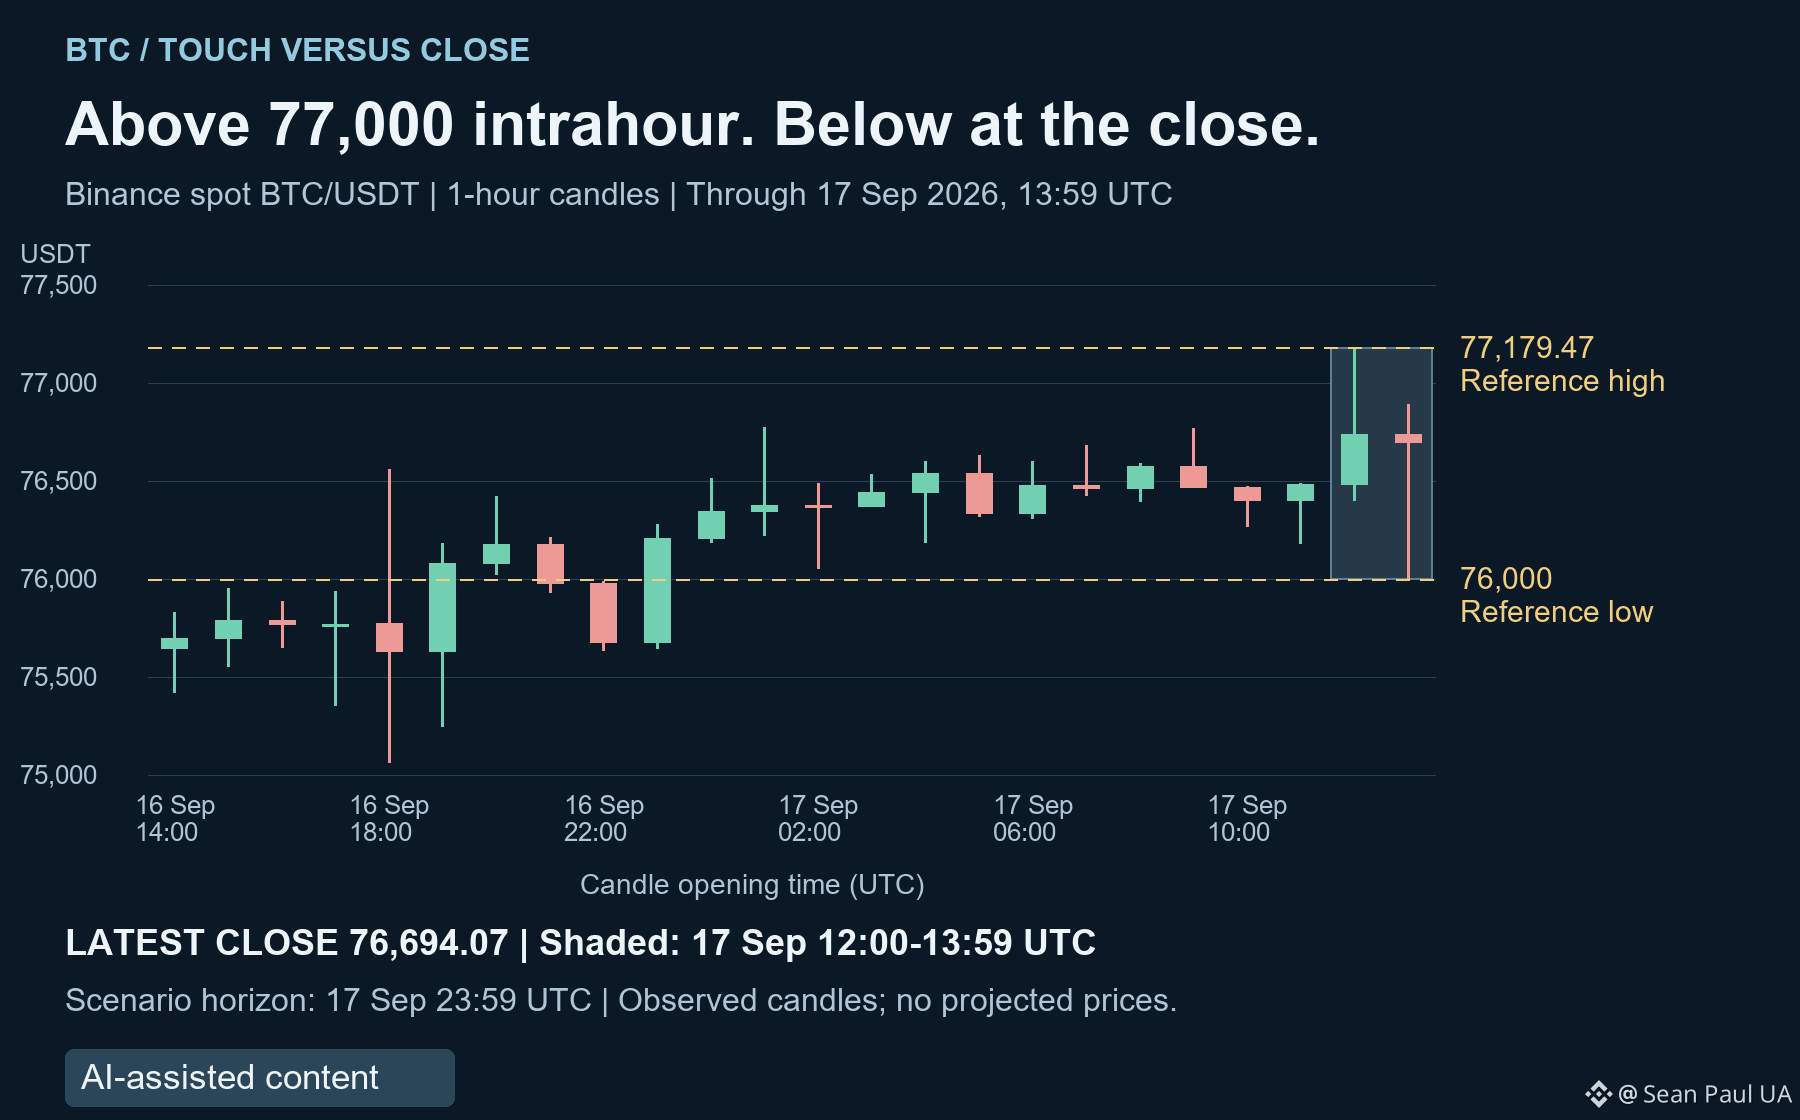
On Binance spot BTC/USDT, September 17's 12:00-12:59 UTC candle reached 77,179.47 but closed at 76,736.59. The next hour closed at 76,694.07 after touching 76,000.
That gives me a fresh reference: 76,000-77,179.47, the extremes of those two completed hours. Both closes were below 77,000. The price touch happened; sustained acceptance above it is a separate test.
My map runs from this post through September 17's 23:59 UTC hourly close.
Two consecutive hourly closes above 77,179.47 would support an upside breakout beyond the observed high.
Closes from 76,000 through 77,179.47 keep price inside this two-hour reference range, even if a wick briefly leaves it.
Two consecutive hourly closes below 76,000 would support a downside break of the observed low.
A later hourly close back inside the range would invalidate either confirmed breakout. These conditions expire at the stated horizon.
These are observed boundaries, not guaranteed support or resistance. I'm leaving the still-open 14:00 UTC candle out of this snapshot.
What would convince you the next BTC breakout is holding: consecutive closes outside the range, or a successful retest? Why?
$BTC #Bitcoin
BTC traded above 77,000. I'm watching whether the closes can follow.
On Binance spot BTC/USDT, September 17's 12:00-12:59 UTC candle reached 77,179.47 but closed at 76,736.59. The next hour closed at 76,694.07 after touching 76,000.
That gives me a fresh reference: 76,000-77,179.47, the extremes of those two completed hours. Both closes were below 77,000. The price touch happened; sustained acceptance above it is a separate test.
My map runs from this post through September 17's 23:59 UTC hourly close.
Two consecutive hourly closes above 77,179.47 would support an upside breakout beyond the observed high.
Closes from 76,000 through 77,179.47 keep price inside this two-hour reference range, even if a wick briefly leaves it.
Two consecutive hourly closes below 76,000 would support a downside break of the observed low.
A later hourly close back inside the range would invalidate either confirmed breakout. These conditions expire at the stated horizon.
These are observed boundaries, not guaranteed support or resistance. I'm leaving the still-open 14:00 UTC candle out of this snapshot.
What would convince you the next BTC breakout is holding: consecutive closes outside the range, or a successful retest? Why?
$BTC #Bitcoin
On Binance spot BTC/USDT, September 17's 12:00-12:59 UTC candle reached 77,179.47 but closed at 76,736.59. The next hour closed at 76,694.07 after touching 76,000.
That gives me a fresh reference: 76,000-77,179.47, the extremes of those two completed hours. Both closes were below 77,000. The price touch happened; sustained acceptance above it is a separate test.
My map runs from this post through September 17's 23:59 UTC hourly close.
Two consecutive hourly closes above 77,179.47 would support an upside breakout beyond the observed high.
Closes from 76,000 through 77,179.47 keep price inside this two-hour reference range, even if a wick briefly leaves it.
Two consecutive hourly closes below 76,000 would support a downside break of the observed low.
A later hourly close back inside the range would invalidate either confirmed breakout. These conditions expire at the stated horizon.
These are observed boundaries, not guaranteed support or resistance. I'm leaving the still-open 14:00 UTC candle out of this snapshot.
What would convince you the next BTC breakout is holding: consecutive closes outside the range, or a successful retest? Why?
$BTC #Bitcoin
1
13
·
--
El Salvador's 7,777 BTC headline made me do a different calculation.
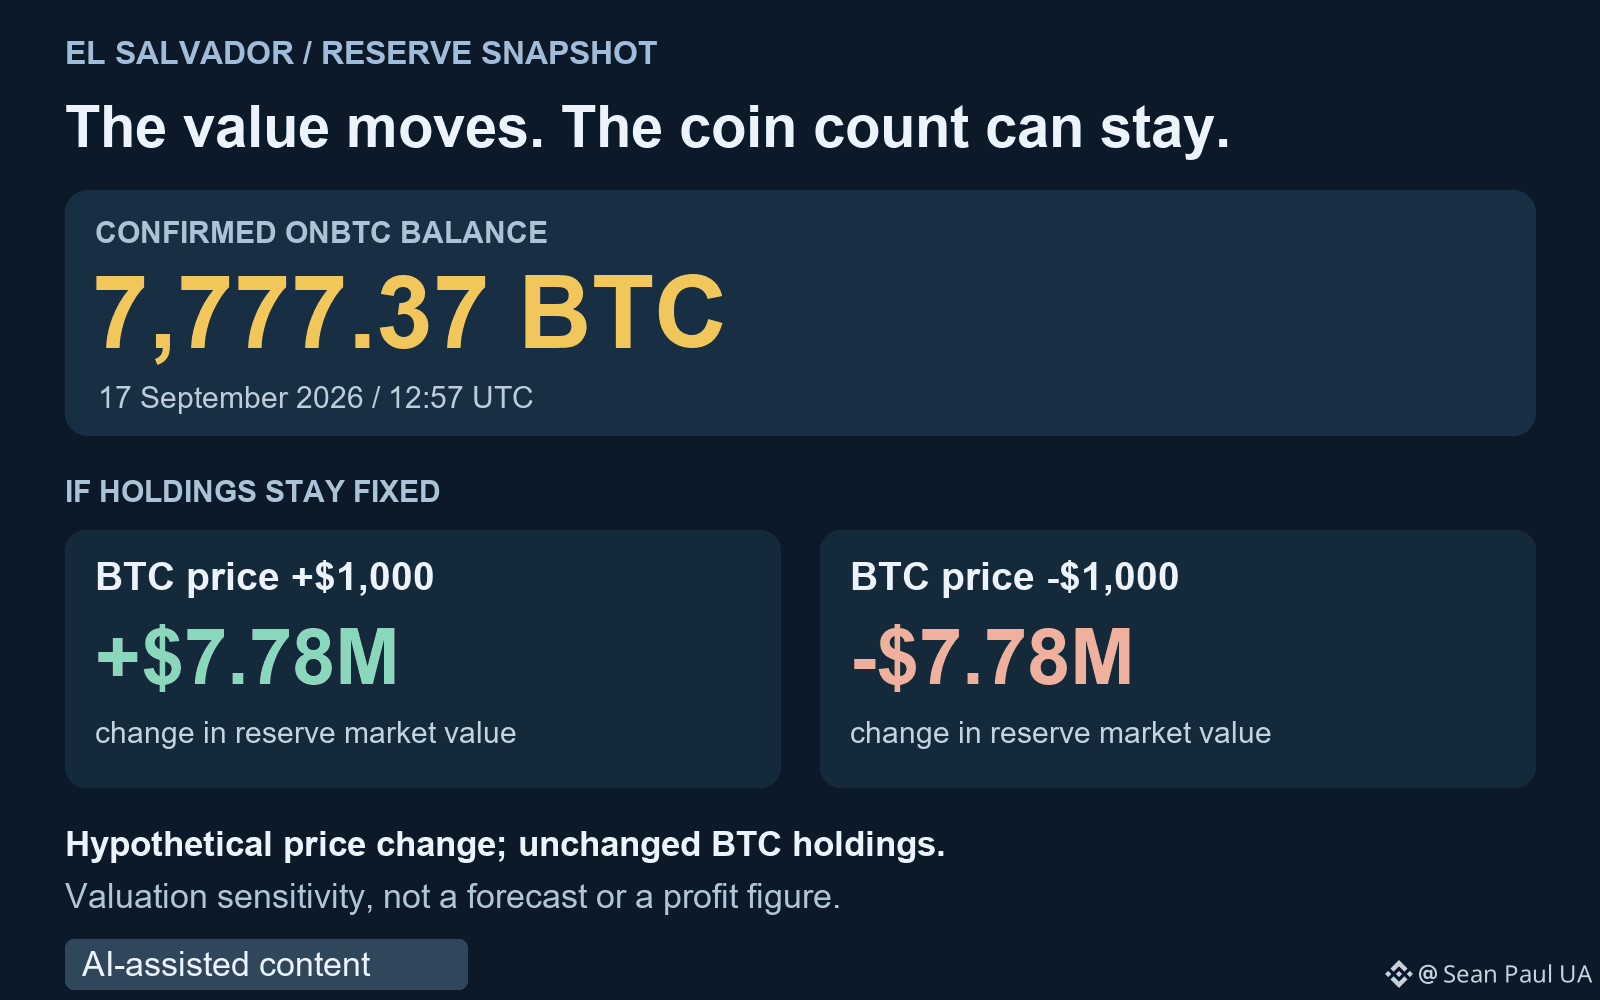
At 12:57 UTC on September 17, its official Bitcoin Office explorer showed a confirmed ONBTC balance of 7,777.37 BTC.
Keep that coin count fixed: every $1,000 rise in Bitcoin's price adds about $7.78 million to the reserve's market value. A $1,000 fall removes the same amount. That's price sensitivity, not a forecast or a calculation of profit.
I'm separating three questions here: how many coins are held, what they're worth, and how they were funded. A bigger dollar valuation can happen without a single new coin arriving.
The funding context needs its own date. In a September 3 statement, IMF staff said documentation showed that accumulation since the program's first review came from private donations, without public resources. That statement predates today's balance and doesn't establish the funding of every later inflow.
For me, a reserve milestone is more useful when the coin count comes with a clear explanation of valuation and funding.
Which would you want alongside the next reserve update: A) price sensitivity, B) funding details, or C) custody arrangements? Why?
#Bitcoin #ElSalvador
El Salvador's 7,777 BTC headline made me do a different calculation.
At 12:57 UTC on September 17, its official Bitcoin Office explorer showed a confirmed ONBTC balance of 7,777.37 BTC.
Keep that coin count fixed: every $1,000 rise in Bitcoin's price adds about $7.78 million to the reserve's market value. A $1,000 fall removes the same amount. That's price sensitivity, not a forecast or a calculation of profit.
I'm separating three questions here: how many coins are held, what they're worth, and how they were funded. A bigger dollar valuation can happen without a single new coin arriving.
The funding context needs its own date. In a September 3 statement, IMF staff said documentation showed that accumulation since the program's first review came from private donations, without public resources. That statement predates today's balance and doesn't establish the funding of every later inflow.
For me, a reserve milestone is more useful when the coin count comes with a clear explanation of valuation and funding.
Which would you want alongside the next reserve update: A) price sensitivity, B) funding details, or C) custody arrangements? Why?
#Bitcoin #ElSalvador
At 12:57 UTC on September 17, its official Bitcoin Office explorer showed a confirmed ONBTC balance of 7,777.37 BTC.
Keep that coin count fixed: every $1,000 rise in Bitcoin's price adds about $7.78 million to the reserve's market value. A $1,000 fall removes the same amount. That's price sensitivity, not a forecast or a calculation of profit.
I'm separating three questions here: how many coins are held, what they're worth, and how they were funded. A bigger dollar valuation can happen without a single new coin arriving.
The funding context needs its own date. In a September 3 statement, IMF staff said documentation showed that accumulation since the program's first review came from private donations, without public resources. That statement predates today's balance and doesn't establish the funding of every later inflow.
For me, a reserve milestone is more useful when the coin count comes with a clear explanation of valuation and funding.
Which would you want alongside the next reserve update: A) price sensitivity, B) funding details, or C) custody arrangements? Why?
#Bitcoin #ElSalvador
1
44
Log in to explore more content
Join global crypto users on Binance Square
⚡️ Get latest and useful information about crypto.
💬 Trusted by the world’s largest crypto exchange.
👍 Discover real insights from verified creators.
Email / Phone number
Trending Topics
SaylorHintsStrategyBitcoinBuy
2.2M views
11,574 Discussing
SAYLOR MAY HAVE BOUGHT MORE $BTC !
Michael Saylor reposted the chart he regularly shares on Sundays. #SaylorHintsStrategyBitcoinBuy
This means that the more orange dots there are, the more buying is taking place. He reposted this today.
He’ll most likely make another substantial purchase. We’ve mentioned before just how significant these purchases are. He holds nearly as much #Bitcoin as Satoshi does.
I think these purchases need to stop at some point and he might even start selling. Do you think this single hand dominance will ever end?
Kripto Kurdu
·9 Likes
·2.5k views
BOJRaisesRatesTo31YearHigh
188,808 views
2,783 Discussing
BuffettStepsDownAsBerkshireChairman
91,716 views
1,450 Discussing