
CryptoWithGanesh
78 Posts

CryptoWithGanesh
Report
Block User
Simple Crypto Updates BTC ETH Altcoins Visual insights Data first No hype.
Open Trade
High-Frequency Trader
1.8 Years
1.2K+ Following
243 Followers
52 Liked
Posts
Portfolio
All
Quotes
·
--
Bullish
Welcome to Crypto With Ganesh 🌍🤖
Hello everyone! I’m Ganesh, and this page is for simple, visual, and data-focused crypto market updates.
Here you’ll find:
📊 Quick updates on BTC, ETH, and altcoins
🤖 Cartoon-style crypto explainers
📰 Major market news in simple English
📈 Key signals like volume, sentiment, and market trends
🛡️ Risk-aware content without hype or promises
My goal is to make crypto easier to follow for everyone—whether you are new to the market or already tracking it daily.
I’ll focus on facts, visuals, and clear explanations. Crypto moves fast, so always do your own research and manage risk.
Follow the page and let’s learn through the market together.
Follow @GaneshCrypto for simple crypto updates. 🤖
What coin are you watching most right now—BTC, ETH, SOL, or another one? Comment below 👇
Crypto #Bitcoin #Ethereum #Altcoins #CryptoMarket #MarketUpdate #BinanceSquare #CryptoEducation💡🚀
Welcome to Crypto With Ganesh 🌍🤖
Hello everyone! I’m Ganesh, and this page is for simple, visual, and data-focused crypto market updates.
Here you’ll find:
📊 Quick updates on BTC, ETH, and altcoins
🤖 Cartoon-style crypto explainers
📰 Major market news in simple English
📈 Key signals like volume, sentiment, and market trends
🛡️ Risk-aware content without hype or promises
My goal is to make crypto easier to follow for everyone—whether you are new to the market or already tracking it daily.
I’ll focus on facts, visuals, and clear explanations. Crypto moves fast, so always do your own research and manage risk.
Follow the page and let’s learn through the market together.
Follow @GaneshCrypto for simple crypto updates. 🤖
What coin are you watching most right now—BTC, ETH, SOL, or another one? Comment below 👇
Crypto #Bitcoin #Ethereum #Altcoins #CryptoMarket #MarketUpdate #BinanceSquare #CryptoEducation💡🚀
Hello everyone! I’m Ganesh, and this page is for simple, visual, and data-focused crypto market updates.
Here you’ll find:
📊 Quick updates on BTC, ETH, and altcoins
🤖 Cartoon-style crypto explainers
📰 Major market news in simple English
📈 Key signals like volume, sentiment, and market trends
🛡️ Risk-aware content without hype or promises
My goal is to make crypto easier to follow for everyone—whether you are new to the market or already tracking it daily.
I’ll focus on facts, visuals, and clear explanations. Crypto moves fast, so always do your own research and manage risk.
Follow the page and let’s learn through the market together.
Follow @GaneshCrypto for simple crypto updates. 🤖
What coin are you watching most right now—BTC, ETH, SOL, or another one? Comment below 👇
Crypto #Bitcoin #Ethereum #Altcoins #CryptoMarket #MarketUpdate #BinanceSquare #CryptoEducation💡🚀
113
Article
which one🤔 asked yourselfwhich one🤔 asked yourself first and then choose one below 👇 from Three major scenarios
#fed ,#intrestratehike ,#economy ,#FOMO
A. Disinflation / softer-landing scenario
If upcoming inflation data cools while employment and consumer activity do not weaken sharply, markets may interpret it as room for less restrictive Fed policy later. That environment can support rate-sensitive small-cap shares and may weigh on inverse small-cap products such as $TZA.ETF
B. Sticky-inflation scenario
If core inflation stays elevated or re-accelerates, the Fed may keep a restrictive tone for longer. Treasury yields can remain high, financial conditions may stay tight, and smaller companies may face more pressure because refinancing costs matter more for them. This can be relatively supportive for TZA’s underlying inverse exposure, though daily moves remain volatile.
C. Growth-slowdown scenario
If jobs, consumption or credit conditions deteriorate materially, markets can initially become risk-off. Russell 2000/$IWV.ETF often reacts strongly because it has broad domestic and cyclical exposure. However, if the slowdown becomes severe enough to increase expectations of future easing, markets can reverse quickly—so the path matters, not only the final Fed decision.
Comment share with me about your point of view
Follow @GaneshCrypto for simple crypto updates.
which one🤔 asked yourself
which one🤔 asked yourself first and then choose one below 👇 from Three major scenarios
#fed ,#intrestratehike ,#economy ,#FOMO
A. Disinflation / softer-landing scenario
If upcoming inflation data cools while employment and consumer activity do not weaken sharply, markets may interpret it as room for less restrictive Fed policy later. That environment can support rate-sensitive small-cap shares and may weigh on inverse small-cap products such as $TZA.ETF
B. Sticky-inflation scenario
If core inflation stays elevated or re-accelerates, the Fed may keep a restrictive tone for longer. Treasury yields can remain high, financial conditions may stay tight, and smaller companies may face more pressure because refinancing costs matter more for them. This can be relatively supportive for TZA’s underlying inverse exposure, though daily moves remain volatile.
C. Growth-slowdown scenario
If jobs, consumption or credit conditions deteriorate materially, markets can initially become risk-off. Russell 2000/$IWV.ETF often reacts strongly because it has broad domestic and cyclical exposure. However, if the slowdown becomes severe enough to increase expectations of future easing, markets can reverse quickly—so the path matters, not only the final Fed decision.
Comment share with me about your point of view
Follow @GaneshCrypto for simple crypto updates.
#fed ,#intrestratehike ,#economy ,#FOMO
A. Disinflation / softer-landing scenario
If upcoming inflation data cools while employment and consumer activity do not weaken sharply, markets may interpret it as room for less restrictive Fed policy later. That environment can support rate-sensitive small-cap shares and may weigh on inverse small-cap products such as $TZA.ETF
B. Sticky-inflation scenario
If core inflation stays elevated or re-accelerates, the Fed may keep a restrictive tone for longer. Treasury yields can remain high, financial conditions may stay tight, and smaller companies may face more pressure because refinancing costs matter more for them. This can be relatively supportive for TZA’s underlying inverse exposure, though daily moves remain volatile.
C. Growth-slowdown scenario
If jobs, consumption or credit conditions deteriorate materially, markets can initially become risk-off. Russell 2000/$IWV.ETF often reacts strongly because it has broad domestic and cyclical exposure. However, if the slowdown becomes severe enough to increase expectations of future easing, markets can reverse quickly—so the path matters, not only the final Fed decision.
Comment share with me about your point of view
Follow @GaneshCrypto for simple crypto updates.
IWVETF+2.41%
TZAETF+0.11%
61
Article
""Fed Role-Play """"The Fed has to strike a balance: if it cuts rates too quickly, inflation could rise again; if it keeps rates high for too long, pressure on growth and jobs could increase.""
Let's understand it
The Fed's job is to keep the economy from getting too hot or too cold. That's why it has to balance inflation against growth and jobs.
1) What is the Fed's main tool?
The Fed's biggest tool is the interest rate—specifically, the federal funds rate.
The effects of this rate spread gradually throughout the economy:
The Fed raises or keeps rates high → loans become more expensive → spending and borrowing slow down → demand cools → downward pressure on prices eases → inflation cools
""Fed Role-Play ""
""The Fed has to strike a balance: if it cuts rates too quickly, inflation could rise again; if it keeps rates high for too long, pressure on growth and jobs could increase.""
Let's understand it
The Fed's job is to keep the economy from getting too hot or too cold. That's why it has to balance inflation against growth and jobs.
1) What is the Fed's main tool?
The Fed's biggest tool is the interest rate—specifically, the federal funds rate.
The effects of this rate spread gradually throughout the economy:
The Fed raises or keeps rates high → loans become more expensive → spending and borrowing slow down → demand cools → downward pressure on prices eases → inflation cools
Let's understand it
The Fed's job is to keep the economy from getting too hot or too cold. That's why it has to balance inflation against growth and jobs.
1) What is the Fed's main tool?
The Fed's biggest tool is the interest rate—specifically, the federal funds rate.
The effects of this rate spread gradually throughout the economy:
The Fed raises or keeps rates high → loans become more expensive → spending and borrowing slow down → demand cools → downward pressure on prices eases → inflation cools
1
74
Article
How Do High Interest Rates Reduce Inflation?How Do High Interest Rates Reduce Inflation?
When a central bank keeps interest rates high, borrowing becomes more expensive. That may sound technical—but it affects everyday life, from buying a home to running a business.
A. Impact on Consumers
Higher rates can raise the cost of:
Credit-card borrowing Auto loans Home loans / mortgages Personal loans
Imagine a family planning to buy a house.
With a lower mortgage rate, the monthly installment may feel affordable. But when mortgage rates rise, the installment for the same house becomes much higher.
As a result, some families delay buying a home.
When this happens across millions of households:
Housing demand slows
Demand for furniture, appliances, interiors, and related services may soften
Overall consumer spending becomes more cautious
Less demand means businesses find it harder to keep increasing prices. Over time, this can help bring inflation under control.
B. Impact on Businesses
High interest rates also make borrowing more costly for companies. Expenses can rise for:
Expansion loans Warehouse financing New machinery and equipment Working-capital credit Refinancing older debt
Because funding becomes expensive, some businesses postpone expansion, hiring, inventory purchases, or major investments.
This can reduce overall demand in the economy—and when demand cools, price pressure may also ease.
The Simple Idea
High interest rates do not reduce inflation overnight.
They work by making borrowing and spending slower, which cools excess demand in the economy.
However, there is a trade-off: if rates stay too high for too long, growth, jobs, and business activity can also be affected.
In one line:
Higher rates → Costlier borrowing → Lower spending and investment → Slower demand → Lower inflation pressure.
Follow @GaneshCrypto for simple crypto updates.
#fed ,#infilation ,#EconomicAlert ,#EconomicInsight
{future}(TMFUSDT)
{future}(TQQQUSDT)
{future}(TZAUSDT)
How Do High Interest Rates Reduce Inflation?
How Do High Interest Rates Reduce Inflation?
When a central bank keeps interest rates high, borrowing becomes more expensive. That may sound technical—but it affects everyday life, from buying a home to running a business.
A. Impact on Consumers
Higher rates can raise the cost of:
Credit-card borrowing Auto loans Home loans / mortgages Personal loans
Imagine a family planning to buy a house.
With a lower mortgage rate, the monthly installment may feel affordable. But when mortgage rates rise, the installment for the same house becomes much higher.
As a result, some families delay buying a home.
When this happens across millions of households:
Housing demand slows
Demand for furniture, appliances, interiors, and related services may soften
Overall consumer spending becomes more cautious
Less demand means businesses find it harder to keep increasing prices. Over time, this can help bring inflation under control.
B. Impact on Businesses
High interest rates also make borrowing more costly for companies. Expenses can rise for:
Expansion loans Warehouse financing New machinery and equipment Working-capital credit Refinancing older debt
Because funding becomes expensive, some businesses postpone expansion, hiring, inventory purchases, or major investments.
This can reduce overall demand in the economy—and when demand cools, price pressure may also ease.
The Simple Idea
High interest rates do not reduce inflation overnight.
They work by making borrowing and spending slower, which cools excess demand in the economy.
However, there is a trade-off: if rates stay too high for too long, growth, jobs, and business activity can also be affected.
In one line:
Higher rates → Costlier borrowing → Lower spending and investment → Slower demand → Lower inflation pressure.
Follow @GaneshCrypto for simple crypto updates.
#fed ,#infilation ,#EconomicAlert ,#EconomicInsight
When a central bank keeps interest rates high, borrowing becomes more expensive. That may sound technical—but it affects everyday life, from buying a home to running a business.
A. Impact on Consumers
Higher rates can raise the cost of:
Credit-card borrowing Auto loans Home loans / mortgages Personal loans
Imagine a family planning to buy a house.
With a lower mortgage rate, the monthly installment may feel affordable. But when mortgage rates rise, the installment for the same house becomes much higher.
As a result, some families delay buying a home.
When this happens across millions of households:
Housing demand slows
Demand for furniture, appliances, interiors, and related services may soften
Overall consumer spending becomes more cautious
Less demand means businesses find it harder to keep increasing prices. Over time, this can help bring inflation under control.
B. Impact on Businesses
High interest rates also make borrowing more costly for companies. Expenses can rise for:
Expansion loans Warehouse financing New machinery and equipment Working-capital credit Refinancing older debt
Because funding becomes expensive, some businesses postpone expansion, hiring, inventory purchases, or major investments.
This can reduce overall demand in the economy—and when demand cools, price pressure may also ease.
The Simple Idea
High interest rates do not reduce inflation overnight.
They work by making borrowing and spending slower, which cools excess demand in the economy.
However, there is a trade-off: if rates stay too high for too long, growth, jobs, and business activity can also be affected.
In one line:
Higher rates → Costlier borrowing → Lower spending and investment → Slower demand → Lower inflation pressure.
Follow @GaneshCrypto for simple crypto updates.
#fed ,#infilation ,#EconomicAlert ,#EconomicInsight
1
44
A: Disinflation/softer-landing
B: Sticky-inflation scenario
C: Growth-slowdown scenario
Please vote with choose one!
6 day(s) left
BTC-0.33%
TZAETF+0.11%
1
208
Article
“Policy rate restrictive”#FOMC ,#FedInterestRate
“Policy rate restrictive” means the Fed’s interest rate is high enough to make borrowing and spending more expensive, which is intended to cool inflation.
September PCE at 3.60% and core PCE at 3.10% mean that prices are still higher than they were a year ago, and inflation remains above the Fed’s 2% target.
The Fed has to strike a balance: if it cuts rates too soon, inflation could rise again; if it keeps them high for too long, growth and jobs could come under greater pressure.
The simple meaning of this statement is that inflation in the US is not yet fully under control, so the Fed is keeping interest rates relatively high. High rates slow the economy down to keep prices from rising too quickly.
“Policy rate restrictive”
#FOMC ,#FedInterestRate
“Policy rate restrictive” means the Fed’s interest rate is high enough to make borrowing and spending more expensive, which is intended to cool inflation.
September PCE at 3.60% and core PCE at 3.10% mean that prices are still higher than they were a year ago, and inflation remains above the Fed’s 2% target.
The Fed has to strike a balance: if it cuts rates too soon, inflation could rise again; if it keeps them high for too long, growth and jobs could come under greater pressure.
The simple meaning of this statement is that inflation in the US is not yet fully under control, so the Fed is keeping interest rates relatively high. High rates slow the economy down to keep prices from rising too quickly.
“Policy rate restrictive” means the Fed’s interest rate is high enough to make borrowing and spending more expensive, which is intended to cool inflation.
September PCE at 3.60% and core PCE at 3.10% mean that prices are still higher than they were a year ago, and inflation remains above the Fed’s 2% target.
The Fed has to strike a balance: if it cuts rates too soon, inflation could rise again; if it keeps them high for too long, growth and jobs could come under greater pressure.
The simple meaning of this statement is that inflation in the US is not yet fully under control, so the Fed is keeping interest rates relatively high. High rates slow the economy down to keep prices from rising too quickly.
1
23
Article
inflation is above the Fed’s 2% objective, while consumer spending was still positive but real...Inflation: latest confirmed data
The latest confirmed Fed-preferred inflation reading is September 2026 PCE:
Headline PCE inflation: 3.60% year-on-yearCore PCE inflation: 3.10% year-on-yearMonthly headline PCE: +0.50%Monthly core PCE: +0.30%Personal spending: +0.50% month-on-monthReal consumer spending: roughly flat month-on-monthPersonal saving rate: 3.80%
BEA data therefore shows inflation is above the Fed’s 2% objective, while consumer spending was still positive but real spending momentum was weak. (bea.gov)
The next PCE release, covering October 2026, is scheduled for 2026-11-25. (bea.gov)
#confirmratehike
CPI consumer prices ka broad measure hai; PCE consumer spending aur substitution patterns ko zyada dynamically capture karta hai.
Core PCE, PCE se food aur energy ko hata deta hai, taaki underlying inflation trend clearer dikhe.
Fed policy mein Core PCE ko khas importance deta hai, jabki CPI market reaction ke liye bhi bahut important hota hai.
1) CPI kya hai?
CPI = Consumer Price Index.
Ye measure karta hai ki aam consumers ke liye daily goods aur services—jaise rent, food, petrol, kapde, medical care—kitne mehange hue.
CPI ek fixed-type basket ko track karta hai. Isliye agar kisi item ki price bahut badh jaaye aur log uska cheaper alternative lene lagen, CPI us change ko comparatively kam reflect kar sakta hai.
2) PCE kya hai?
PCE = Personal Consumption Expenditures Price Index.
Ye bhi US consumers ki prices measure karta hai, lekin isme consumer spending ka wider picture hota hai.
PCE mein data businesses se bhi aata hai—jaise hospitals, retailers aur service providers. Ye consumer behavior ke changes ko zyada adjust karta hai: agar beef mehenga ho aur log chicken zyada lene lagen, PCE us substitution ko better capture karne ki koshish karta hai.
3) Core PCE kya hai?
Core PCE = PCE inflation, food aur energy ko hata kar.
Food aur petrol/oil prices weather, supply disruption ya geopolitical events ki wajah se jaldi aur sharply move kar sakte hain. Inko remove karke Core PCE underlying inflation pressure ko dikhata hai—jaise rent, wages-linked services, healthcare aur insurance.
Ek simple hypothetical example
Maan lo ek saal mein:
petrol prices bahut badh jaati hain,
lekin rent, healthcare aur baaki services relatively stable hain.
To headline CPI/PCE zyada high aa sakta hai, kyunki energy prices add hui hain.
Lekin Core PCE comparatively lower aa sakta hai, kyunki petrol aur food usme include nahi hote.
Ulta, agar energy stable hai lekin rent aur services consistently mehange ho rahe hain, to Core PCE elevated reh sakta hai—Fed isko zyada concerning signal maan sakta hai.
Main difference, ek table mein
| Measure | Kya cover karta hai | Food & energy | Kaun release karta hai | Fed ke liye relevance |
|---|---|---|---|---|#Fed ,#fomc
| CPI | Consumer basket ki prices | Included | Bureau of Labor Statistics | Inflation ka early, widely watched signal |
| PCE | Consumer spending ka broader measure | Included | Bureau of Economic Analysis | Fed ka preferred headline inflation gauge |
| Core PCE | PCE minus food and energy | Excluded | Bureau of Economic Analysis | Underlying inflation trend ke liye Fed ka key measure |
Trader ke liye kyun important hai?
CPI expected se high aaye, to market soch sakta hai Fed rates longer time high rakhega; yields aur US dollar react kar sakte hain, aur risk assets par pressure aa sakta hai.
PCE/Core PCE high rahe, to Fed ke 2% inflation target tak pahunchne ki progress slow lag sakti hai.
Data expectations se lower aaye, to markets less-restrictive policy ki possibility price kar sakte hain.
Market sirf number nahi dekhta—woh actual data ko expectations, jobs data, growth aur Fed ki language ke against compare karta hai.
Yeh sirf market education ke liye hai, investment advice nahi hai।
{future}(TMFUSDT)
{future}(TQQQUSDT)
inflation is above the Fed’s 2% objective, while consumer spending was still positive but real...
Inflation: latest confirmed data
The latest confirmed Fed-preferred inflation reading is September 2026 PCE:
Headline PCE inflation: 3.60% year-on-yearCore PCE inflation: 3.10% year-on-yearMonthly headline PCE: +0.50%Monthly core PCE: +0.30%Personal spending: +0.50% month-on-monthReal consumer spending: roughly flat month-on-monthPersonal saving rate: 3.80%
BEA data therefore shows inflation is above the Fed’s 2% objective, while consumer spending was still positive but real spending momentum was weak. (bea.gov)
The next PCE release, covering October 2026, is scheduled for 2026-11-25. (bea.gov)
#confirmratehike
CPI consumer prices ka broad measure hai; PCE consumer spending aur substitution patterns ko zyada dynamically capture karta hai.
Core PCE, PCE se food aur energy ko hata deta hai, taaki underlying inflation trend clearer dikhe.
Fed policy mein Core PCE ko khas importance deta hai, jabki CPI market reaction ke liye bhi bahut important hota hai.
1) CPI kya hai?
CPI = Consumer Price Index.
Ye measure karta hai ki aam consumers ke liye daily goods aur services—jaise rent, food, petrol, kapde, medical care—kitne mehange hue.
CPI ek fixed-type basket ko track karta hai. Isliye agar kisi item ki price bahut badh jaaye aur log uska cheaper alternative lene lagen, CPI us change ko comparatively kam reflect kar sakta hai.
2) PCE kya hai?
PCE = Personal Consumption Expenditures Price Index.
Ye bhi US consumers ki prices measure karta hai, lekin isme consumer spending ka wider picture hota hai.
PCE mein data businesses se bhi aata hai—jaise hospitals, retailers aur service providers. Ye consumer behavior ke changes ko zyada adjust karta hai: agar beef mehenga ho aur log chicken zyada lene lagen, PCE us substitution ko better capture karne ki koshish karta hai.
3) Core PCE kya hai?
Core PCE = PCE inflation, food aur energy ko hata kar.
Food aur petrol/oil prices weather, supply disruption ya geopolitical events ki wajah se jaldi aur sharply move kar sakte hain. Inko remove karke Core PCE underlying inflation pressure ko dikhata hai—jaise rent, wages-linked services, healthcare aur insurance.
Ek simple hypothetical example
Maan lo ek saal mein:
petrol prices bahut badh jaati hain,
lekin rent, healthcare aur baaki services relatively stable hain.
To headline CPI/PCE zyada high aa sakta hai, kyunki energy prices add hui hain.
Lekin Core PCE comparatively lower aa sakta hai, kyunki petrol aur food usme include nahi hote.
Ulta, agar energy stable hai lekin rent aur services consistently mehange ho rahe hain, to Core PCE elevated reh sakta hai—Fed isko zyada concerning signal maan sakta hai.
Main difference, ek table mein
| Measure | Kya cover karta hai | Food & energy | Kaun release karta hai | Fed ke liye relevance |
|---|---|---|---|---|#Fed ,#fomc
| CPI | Consumer basket ki prices | Included | Bureau of Labor Statistics | Inflation ka early, widely watched signal |
| PCE | Consumer spending ka broader measure | Included | Bureau of Economic Analysis | Fed ka preferred headline inflation gauge |
| Core PCE | PCE minus food and energy | Excluded | Bureau of Economic Analysis | Underlying inflation trend ke liye Fed ka key measure |
Trader ke liye kyun important hai?
CPI expected se high aaye, to market soch sakta hai Fed rates longer time high rakhega; yields aur US dollar react kar sakte hain, aur risk assets par pressure aa sakta hai.
PCE/Core PCE high rahe, to Fed ke 2% inflation target tak pahunchne ki progress slow lag sakti hai.
Data expectations se lower aaye, to markets less-restrictive policy ki possibility price kar sakte hain.
Market sirf number nahi dekhta—woh actual data ko expectations, jobs data, growth aur Fed ki language ke against compare karta hai.
Yeh sirf market education ke liye hai, investment advice nahi hai।
The latest confirmed Fed-preferred inflation reading is September 2026 PCE:
Headline PCE inflation: 3.60% year-on-yearCore PCE inflation: 3.10% year-on-yearMonthly headline PCE: +0.50%Monthly core PCE: +0.30%Personal spending: +0.50% month-on-monthReal consumer spending: roughly flat month-on-monthPersonal saving rate: 3.80%
BEA data therefore shows inflation is above the Fed’s 2% objective, while consumer spending was still positive but real spending momentum was weak. (bea.gov)
The next PCE release, covering October 2026, is scheduled for 2026-11-25. (bea.gov)
#confirmratehike
CPI consumer prices ka broad measure hai; PCE consumer spending aur substitution patterns ko zyada dynamically capture karta hai.
Core PCE, PCE se food aur energy ko hata deta hai, taaki underlying inflation trend clearer dikhe.
Fed policy mein Core PCE ko khas importance deta hai, jabki CPI market reaction ke liye bhi bahut important hota hai.
1) CPI kya hai?
CPI = Consumer Price Index.
Ye measure karta hai ki aam consumers ke liye daily goods aur services—jaise rent, food, petrol, kapde, medical care—kitne mehange hue.
CPI ek fixed-type basket ko track karta hai. Isliye agar kisi item ki price bahut badh jaaye aur log uska cheaper alternative lene lagen, CPI us change ko comparatively kam reflect kar sakta hai.
2) PCE kya hai?
PCE = Personal Consumption Expenditures Price Index.
Ye bhi US consumers ki prices measure karta hai, lekin isme consumer spending ka wider picture hota hai.
PCE mein data businesses se bhi aata hai—jaise hospitals, retailers aur service providers. Ye consumer behavior ke changes ko zyada adjust karta hai: agar beef mehenga ho aur log chicken zyada lene lagen, PCE us substitution ko better capture karne ki koshish karta hai.
3) Core PCE kya hai?
Core PCE = PCE inflation, food aur energy ko hata kar.
Food aur petrol/oil prices weather, supply disruption ya geopolitical events ki wajah se jaldi aur sharply move kar sakte hain. Inko remove karke Core PCE underlying inflation pressure ko dikhata hai—jaise rent, wages-linked services, healthcare aur insurance.
Ek simple hypothetical example
Maan lo ek saal mein:
petrol prices bahut badh jaati hain,
lekin rent, healthcare aur baaki services relatively stable hain.
To headline CPI/PCE zyada high aa sakta hai, kyunki energy prices add hui hain.
Lekin Core PCE comparatively lower aa sakta hai, kyunki petrol aur food usme include nahi hote.
Ulta, agar energy stable hai lekin rent aur services consistently mehange ho rahe hain, to Core PCE elevated reh sakta hai—Fed isko zyada concerning signal maan sakta hai.
Main difference, ek table mein
| Measure | Kya cover karta hai | Food & energy | Kaun release karta hai | Fed ke liye relevance |
|---|---|---|---|---|#Fed ,#fomc
| CPI | Consumer basket ki prices | Included | Bureau of Labor Statistics | Inflation ka early, widely watched signal |
| PCE | Consumer spending ka broader measure | Included | Bureau of Economic Analysis | Fed ka preferred headline inflation gauge |
| Core PCE | PCE minus food and energy | Excluded | Bureau of Economic Analysis | Underlying inflation trend ke liye Fed ka key measure |
Trader ke liye kyun important hai?
CPI expected se high aaye, to market soch sakta hai Fed rates longer time high rakhega; yields aur US dollar react kar sakte hain, aur risk assets par pressure aa sakta hai.
PCE/Core PCE high rahe, to Fed ke 2% inflation target tak pahunchne ki progress slow lag sakti hai.
Data expectations se lower aaye, to markets less-restrictive policy ki possibility price kar sakte hain.
Market sirf number nahi dekhta—woh actual data ko expectations, jobs data, growth aur Fed ki language ke against compare karta hai.
Yeh sirf market education ke liye hai, investment advice nahi hai।
1
147

Article
Current macro snapshot — as of 2026-11-14 (inside Detailing){future}(BTCUSDT)
{future}(TZAUSDT)
{future}(IWMUSDT)
Russell 2000 aur crypto markets short-term volatility will start soon
Current US macro picture: policy rate is still restrictive, while September PCE inflation was 3.60% YoY and core PCE 3.10% YoY.
Main market trigger is the December 8–9, 2026 Fed meeting; the decision, updated projections and dot plot can move US equities, Russell 2000-linked contracts and crypto.
Outlook depends on whether inflation cools without jobs/growth weakening sharply; both upside and downside scenarios remain open.
Current macro snapshot — as of 2026-11-14
1) Fed rate and key dates
The next Fed/FOMC meeting is 2026-12-08 to 2026-12-09. This meeting includes updated economic projections and the dot plot, so the market will focus not only on the rate decision but also on the Fed’s inflation and growth language. The Federal Reserve’s official calendar confirms this schedule. (federalreserve.gov)
The latest policy decision was on 2026-10-28. For the current exact fed-funds target range, I would rely on the Fed’s latest statement rather than estimate it from market commentary.
#RateHike
2) Inflation: latest confirmed data
The latest confirmed Fed-preferred inflation reading is September 2026 PCE:
Headline PCE inflation: 3.60% year-on-yearCore PCE inflation: 3.10% year-on-yearMonthly headline PCE: +0.50%Monthly core PCE: +0.30%Personal spending: +0.50% month-on-monthReal consumer spending: roughly flat month-on-monthPersonal saving rate: 3.80%#FOMC
BEA data therefore shows inflation is above the Fed’s 2% objective, while consumer spending was still positive but real spending momentum was weak. (bea.gov)
The next PCE release, covering October 2026, is scheduled for 2026-11-25. (bea.gov)
3) US economy: current reading
The mixed picture is:
Inflation: still higher than the Fed’s target.
Consumer demand: nominal spending remains positive, but inflation-adjusted spending has softened.
Rates: restrictive policy remains a headwind for small caps, lower-quality credit, housing-sensitive sectors and leveraged businesses.
Russell 2000 / small caps: these are especially sensitive to borrowing costs, bank lending conditions and domestic-growth expectations.
For contracts such as TZAUSDT—which tracks the inverse leveraged small-cap ETF—the most important inputs are Russell 2000 direction, bond yields, Fed messaging and growth data.
4) Three major scenarios
A. Disinflation / softer-landing scenario
If upcoming inflation data cools while employment and consumer activity do not weaken sharply, markets may interpret it as room for less restrictive Fed policy later. That environment can support rate-sensitive small-cap shares and may weigh on inverse small-cap products such as TZA.
B. Sticky-inflation scenario
If core inflation stays elevated or re-accelerates, the Fed may keep a restrictive tone for longer. Treasury yields can remain high, financial conditions may stay tight, and smaller companies may face more pressure because refinancing costs matter more for them. This can be relatively supportive for TZA’s underlying inverse exposure, though daily moves remain volatile.
C. Growth-slowdown scenario
If jobs, consumption or credit conditions deteriorate materially, markets can initially become risk-off. Russell 2000 often reacts strongly because it has broad domestic and cyclical exposure. However, if the slowdown becomes severe enough to increase expectations of future easing, markets can reverse quickly—so the path matters, not only the final Fed decision.
#FedMeeting
5) Global response to watch
Global markets are broadly reacting to four themes:
US dollar and Treasury yields: higher yields/dollar can pressure emerging markets, commodities and risk assets.Central-bank divergence: markets compare the Fed’s stance with Europe, Japan, China and other major economies; policy gaps can move FX and capital flows.Growth and trade conditions: weaker global demand can hurt cyclical equities and industrials, while renewed demand can improve risk appetite.Oil and geopolitical risk: higher energy prices can feed inflation expectations and complicate the Fed’s task.
What matters most before the Fed meeting
October PCE inflation on 2026-11-25 Upcoming US jobs data Treasury-yield and US-dollar reaction Fed speakers’ language on inflation progress versus growth risks Whether Russell 2000 breadth improves or remains weak relative to large-cap stocks
Yeh market analysis hai, investment advice nahi hai.
#fed
Agle Fed/FOMC interest-rate decision ki date 9 December 2026, Wednesday hai. Meeting 8–9 December ko hogi, aur rate statement/decision 2:00 PM New York time (ET) par aayega—India mein lagbhag 10 December, 12:30 AM IST. Is meeting ke saath Fed projections aur dot plot bhi release honge. (federalreserve.gov)
Fed rate decision USD, US stocks, Russell 2000 aur crypto markets mein short-term volatility la sakta hai; actual reaction inflation outlook, growth outlook aur Fed ke guidance par depend karega.
#FedMeeting
Current macro snapshot — as of 2026-11-14 (inside Detailing)
Russell 2000 aur crypto markets short-term volatility will start soon
Current US macro picture: policy rate is still restrictive, while September PCE inflation was 3.60% YoY and core PCE 3.10% YoY.
Main market trigger is the December 8–9, 2026 Fed meeting; the decision, updated projections and dot plot can move US equities, Russell 2000-linked contracts and crypto.
Outlook depends on whether inflation cools without jobs/growth weakening sharply; both upside and downside scenarios remain open.
Current macro snapshot — as of 2026-11-14
1) Fed rate and key dates
The next Fed/FOMC meeting is 2026-12-08 to 2026-12-09. This meeting includes updated economic projections and the dot plot, so the market will focus not only on the rate decision but also on the Fed’s inflation and growth language. The Federal Reserve’s official calendar confirms this schedule. (federalreserve.gov)
The latest policy decision was on 2026-10-28. For the current exact fed-funds target range, I would rely on the Fed’s latest statement rather than estimate it from market commentary.
#RateHike
2) Inflation: latest confirmed data
The latest confirmed Fed-preferred inflation reading is September 2026 PCE:
Headline PCE inflation: 3.60% year-on-yearCore PCE inflation: 3.10% year-on-yearMonthly headline PCE: +0.50%Monthly core PCE: +0.30%Personal spending: +0.50% month-on-monthReal consumer spending: roughly flat month-on-monthPersonal saving rate: 3.80%#FOMC
BEA data therefore shows inflation is above the Fed’s 2% objective, while consumer spending was still positive but real spending momentum was weak. (bea.gov)
The next PCE release, covering October 2026, is scheduled for 2026-11-25. (bea.gov)
3) US economy: current reading
The mixed picture is:
Inflation: still higher than the Fed’s target.
Consumer demand: nominal spending remains positive, but inflation-adjusted spending has softened.
Rates: restrictive policy remains a headwind for small caps, lower-quality credit, housing-sensitive sectors and leveraged businesses.
Russell 2000 / small caps: these are especially sensitive to borrowing costs, bank lending conditions and domestic-growth expectations.
For contracts such as TZAUSDT—which tracks the inverse leveraged small-cap ETF—the most important inputs are Russell 2000 direction, bond yields, Fed messaging and growth data.
4) Three major scenarios
A. Disinflation / softer-landing scenario
If upcoming inflation data cools while employment and consumer activity do not weaken sharply, markets may interpret it as room for less restrictive Fed policy later. That environment can support rate-sensitive small-cap shares and may weigh on inverse small-cap products such as TZA.
B. Sticky-inflation scenario
If core inflation stays elevated or re-accelerates, the Fed may keep a restrictive tone for longer. Treasury yields can remain high, financial conditions may stay tight, and smaller companies may face more pressure because refinancing costs matter more for them. This can be relatively supportive for TZA’s underlying inverse exposure, though daily moves remain volatile.
C. Growth-slowdown scenario
If jobs, consumption or credit conditions deteriorate materially, markets can initially become risk-off. Russell 2000 often reacts strongly because it has broad domestic and cyclical exposure. However, if the slowdown becomes severe enough to increase expectations of future easing, markets can reverse quickly—so the path matters, not only the final Fed decision.
#FedMeeting
5) Global response to watch
Global markets are broadly reacting to four themes:
US dollar and Treasury yields: higher yields/dollar can pressure emerging markets, commodities and risk assets.Central-bank divergence: markets compare the Fed’s stance with Europe, Japan, China and other major economies; policy gaps can move FX and capital flows.Growth and trade conditions: weaker global demand can hurt cyclical equities and industrials, while renewed demand can improve risk appetite.Oil and geopolitical risk: higher energy prices can feed inflation expectations and complicate the Fed’s task.
What matters most before the Fed meeting
October PCE inflation on 2026-11-25 Upcoming US jobs data Treasury-yield and US-dollar reaction Fed speakers’ language on inflation progress versus growth risks Whether Russell 2000 breadth improves or remains weak relative to large-cap stocks
Yeh market analysis hai, investment advice nahi hai.
#fed
Agle Fed/FOMC interest-rate decision ki date 9 December 2026, Wednesday hai. Meeting 8–9 December ko hogi, aur rate statement/decision 2:00 PM New York time (ET) par aayega—India mein lagbhag 10 December, 12:30 AM IST. Is meeting ke saath Fed projections aur dot plot bhi release honge. (federalreserve.gov)
Fed rate decision USD, US stocks, Russell 2000 aur crypto markets mein short-term volatility la sakta hai; actual reaction inflation outlook, growth outlook aur Fed ke guidance par depend karega.
#FedMeeting
Current US macro picture: policy rate is still restrictive, while September PCE inflation was 3.60% YoY and core PCE 3.10% YoY.
Main market trigger is the December 8–9, 2026 Fed meeting; the decision, updated projections and dot plot can move US equities, Russell 2000-linked contracts and crypto.
Outlook depends on whether inflation cools without jobs/growth weakening sharply; both upside and downside scenarios remain open.
Current macro snapshot — as of 2026-11-14
1) Fed rate and key dates
The next Fed/FOMC meeting is 2026-12-08 to 2026-12-09. This meeting includes updated economic projections and the dot plot, so the market will focus not only on the rate decision but also on the Fed’s inflation and growth language. The Federal Reserve’s official calendar confirms this schedule. (federalreserve.gov)
The latest policy decision was on 2026-10-28. For the current exact fed-funds target range, I would rely on the Fed’s latest statement rather than estimate it from market commentary.
#RateHike
2) Inflation: latest confirmed data
The latest confirmed Fed-preferred inflation reading is September 2026 PCE:
Headline PCE inflation: 3.60% year-on-yearCore PCE inflation: 3.10% year-on-yearMonthly headline PCE: +0.50%Monthly core PCE: +0.30%Personal spending: +0.50% month-on-monthReal consumer spending: roughly flat month-on-monthPersonal saving rate: 3.80%#FOMC
BEA data therefore shows inflation is above the Fed’s 2% objective, while consumer spending was still positive but real spending momentum was weak. (bea.gov)
The next PCE release, covering October 2026, is scheduled for 2026-11-25. (bea.gov)
3) US economy: current reading
The mixed picture is:
Inflation: still higher than the Fed’s target.
Consumer demand: nominal spending remains positive, but inflation-adjusted spending has softened.
Rates: restrictive policy remains a headwind for small caps, lower-quality credit, housing-sensitive sectors and leveraged businesses.
Russell 2000 / small caps: these are especially sensitive to borrowing costs, bank lending conditions and domestic-growth expectations.
For contracts such as TZAUSDT—which tracks the inverse leveraged small-cap ETF—the most important inputs are Russell 2000 direction, bond yields, Fed messaging and growth data.
4) Three major scenarios
A. Disinflation / softer-landing scenario
If upcoming inflation data cools while employment and consumer activity do not weaken sharply, markets may interpret it as room for less restrictive Fed policy later. That environment can support rate-sensitive small-cap shares and may weigh on inverse small-cap products such as TZA.
B. Sticky-inflation scenario
If core inflation stays elevated or re-accelerates, the Fed may keep a restrictive tone for longer. Treasury yields can remain high, financial conditions may stay tight, and smaller companies may face more pressure because refinancing costs matter more for them. This can be relatively supportive for TZA’s underlying inverse exposure, though daily moves remain volatile.
C. Growth-slowdown scenario
If jobs, consumption or credit conditions deteriorate materially, markets can initially become risk-off. Russell 2000 often reacts strongly because it has broad domestic and cyclical exposure. However, if the slowdown becomes severe enough to increase expectations of future easing, markets can reverse quickly—so the path matters, not only the final Fed decision.
#FedMeeting
5) Global response to watch
Global markets are broadly reacting to four themes:
US dollar and Treasury yields: higher yields/dollar can pressure emerging markets, commodities and risk assets.Central-bank divergence: markets compare the Fed’s stance with Europe, Japan, China and other major economies; policy gaps can move FX and capital flows.Growth and trade conditions: weaker global demand can hurt cyclical equities and industrials, while renewed demand can improve risk appetite.Oil and geopolitical risk: higher energy prices can feed inflation expectations and complicate the Fed’s task.
What matters most before the Fed meeting
October PCE inflation on 2026-11-25 Upcoming US jobs data Treasury-yield and US-dollar reaction Fed speakers’ language on inflation progress versus growth risks Whether Russell 2000 breadth improves or remains weak relative to large-cap stocks
Yeh market analysis hai, investment advice nahi hai.
#fed
Agle Fed/FOMC interest-rate decision ki date 9 December 2026, Wednesday hai. Meeting 8–9 December ko hogi, aur rate statement/decision 2:00 PM New York time (ET) par aayega—India mein lagbhag 10 December, 12:30 AM IST. Is meeting ke saath Fed projections aur dot plot bhi release honge. (federalreserve.gov)
Fed rate decision USD, US stocks, Russell 2000 aur crypto markets mein short-term volatility la sakta hai; actual reaction inflation outlook, growth outlook aur Fed ke guidance par depend karega.
#FedMeeting
1
163
Article
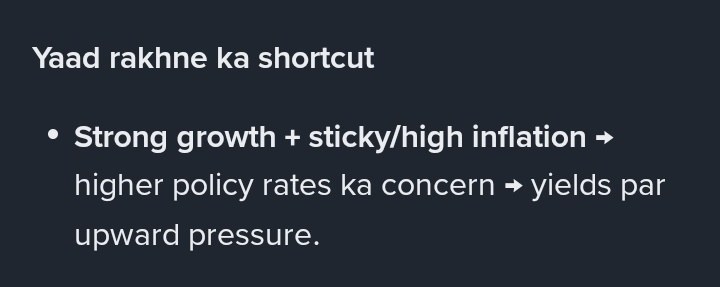
The neutral rate is commonly called r-star. It means a policy that... let's see#Fed , #RateHike , #fomc ,#TMFUSDT
""Every economy has an approximate neutral rate—a rate that neither strongly stimulates the economy nor significantly slows it down. The exact neutral rate is unknown; the Fed estimates it.""
What do they look at to judge it? How do they figure out what the neutral level is?
The neutral rate is commonly called r-star (r\). It means a policy-rate level that, when inflation is near its target and the economy is operating at normal capacity, neither gives demand an extra boost nor puts on the brakes.
The neutral rate is commonly called r-star. It means a policy that... let's see
#Fed , #RateHike , #fomc ,#TMFUSDT
""Every economy has an approximate neutral rate—a rate that neither strongly stimulates the economy nor significantly slows it down. The exact neutral rate is unknown; the Fed estimates it.""
What do they look at to judge it? How do they figure out what the neutral level is?
The neutral rate is commonly called r-star (r\). It means a policy-rate level that, when inflation is near its target and the economy is operating at normal capacity, neither gives demand an extra boost nor puts on the brakes.
""Every economy has an approximate neutral rate—a rate that neither strongly stimulates the economy nor significantly slows it down. The exact neutral rate is unknown; the Fed estimates it.""
What do they look at to judge it? How do they figure out what the neutral level is?
The neutral rate is commonly called r-star (r\). It means a policy-rate level that, when inflation is near its target and the economy is operating at normal capacity, neither gives demand an extra boost nor puts on the brakes.
3
96
#russia
may be more excitement to see how market will react after dollar strength goes more stronger than now
Euro may goes dip against after 22November
#russia
may be more excitement to see how market will react after dollar strength goes more stronger than now
Euro may goes dip against after 22November
may be more excitement to see how market will react after dollar strength goes more stronger than now
Euro may goes dip against after 22November
1
65
Article
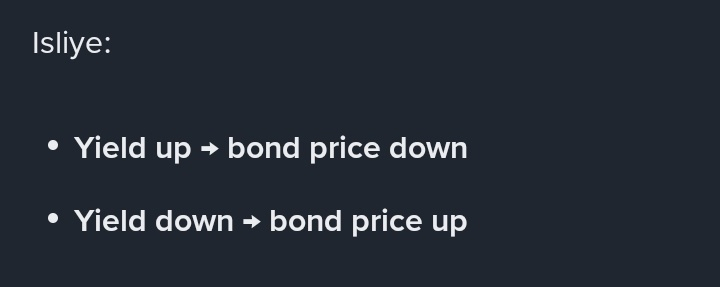
""Strong growth data can push bond yields higher because both demand and inflation play a role#TBF
#TMF
#TMFUSDT
#TBTUSDT
""Strong growth data can push bond yields higher because both demand and inflation may remain firm. But if inflation is soft alongside growth, the market reaction may be more balanced.""
I didn't understand this point. What does it mean? Explain it again—how does this work, and what role does it play?
Let's understand it again through a role-play. Absolutely—let's understand it with a role-play.
Imagine the economy is a marketplace, and the bond market looks at that marketplace to decide what return it wants in exchange for lending money to the government—that return is called the yield.
""Strong growth data can push bond yields higher because both demand and inflation play a role
#TBF
#TMF
#TMFUSDT
#TBTUSDT
""Strong growth data can push bond yields higher because both demand and inflation may remain firm. But if inflation is soft alongside growth, the market reaction may be more balanced.""
I didn't understand this point. What does it mean? Explain it again—how does this work, and what role does it play?
Let's understand it again through a role-play. Absolutely—let's understand it with a role-play.
Imagine the economy is a marketplace, and the bond market looks at that marketplace to decide what return it wants in exchange for lending money to the government—that return is called the yield.
#TMF
#TMFUSDT
#TBTUSDT
""Strong growth data can push bond yields higher because both demand and inflation may remain firm. But if inflation is soft alongside growth, the market reaction may be more balanced.""
I didn't understand this point. What does it mean? Explain it again—how does this work, and what role does it play?
Let's understand it again through a role-play. Absolutely—let's understand it with a role-play.
Imagine the economy is a marketplace, and the bond market looks at that marketplace to decide what return it wants in exchange for lending money to the government—that return is called the yield.
3
127

Article
TBTUSDT#tbt
<t-8/>#TBTUSDT
The TBTUSDT Perpetual Contract is a USDT-settled perpetual contract that tracks the price movements of the ProShares UltraShort 20+ Year Treasury ETF (ticker: TBT)—giving you exposure to its price without owning actual ETF shares.
What is TBT itself?
TBT is a leveraged inverse ETF. Its objective is to provide roughly the opposite of the daily performance of long-term US Treasury bonds—especially bonds with maturities of 20+ years—with 2x exposure.
Simplified relationship:
Long-term US Treasury bond prices fall → TBT generally rises
TBTUSDT
#tbt
<t-8/>#TBTUSDT
The TBTUSDT Perpetual Contract is a USDT-settled perpetual contract that tracks the price movements of the ProShares UltraShort 20+ Year Treasury ETF (ticker: TBT)—giving you exposure to its price without owning actual ETF shares.
What is TBT itself?
TBT is a leveraged inverse ETF. Its objective is to provide roughly the opposite of the daily performance of long-term US Treasury bonds—especially bonds with maturities of 20+ years—with 2x exposure.
Simplified relationship:
Long-term US Treasury bond prices fall → TBT generally rises
<t-8/>#TBTUSDT
The TBTUSDT Perpetual Contract is a USDT-settled perpetual contract that tracks the price movements of the ProShares UltraShort 20+ Year Treasury ETF (ticker: TBT)—giving you exposure to its price without owning actual ETF shares.
What is TBT itself?
TBT is a leveraged inverse ETF. Its objective is to provide roughly the opposite of the daily performance of long-term US Treasury bonds—especially bonds with maturities of 20+ years—with 2x exposure.
Simplified relationship:
Long-term US Treasury bond prices fall → TBT generally rises
TBTETF-0.05%
TBT-1.42%
2
95

Article
TBTUSDT perpetual#TBTUSDT
The most important point to understand is that TBTUSDT is a “double-layer derivative”:
TBT itself is a daily leveraged ETF that moves in the opposite direction to long-term US Treasury bonds.
TBTUSDT perpetual is a USDT-margined perpetual contract that tracks the price of the US TBT ETF.
So it is not a straightforward instrument like a direct Treasury bond, a regular stock, or a BTC perpetual.
1) First of all: What does TBT track?
TBT = ProShares UltraShort 20+ Year Treasury ETF.
This ETF targets approximately -2x the daily performance of long-duration US government Treasury bonds—bonds with maturities of 20 years or more.
TBTUSDT perpetual
#TBTUSDT
The most important point to understand is that TBTUSDT is a “double-layer derivative”:
TBT itself is a daily leveraged ETF that moves in the opposite direction to long-term US Treasury bonds.
TBTUSDT perpetual is a USDT-margined perpetual contract that tracks the price of the US TBT ETF.
So it is not a straightforward instrument like a direct Treasury bond, a regular stock, or a BTC perpetual.
1) First of all: What does TBT track?
TBT = ProShares UltraShort 20+ Year Treasury ETF.
This ETF targets approximately -2x the daily performance of long-duration US government Treasury bonds—bonds with maturities of 20 years or more.
The most important point to understand is that TBTUSDT is a “double-layer derivative”:
TBT itself is a daily leveraged ETF that moves in the opposite direction to long-term US Treasury bonds.
TBTUSDT perpetual is a USDT-margined perpetual contract that tracks the price of the US TBT ETF.
So it is not a straightforward instrument like a direct Treasury bond, a regular stock, or a BTC perpetual.
1) First of all: What does TBT track?
TBT = ProShares UltraShort 20+ Year Treasury ETF.
This ETF targets approximately -2x the daily performance of long-duration US government Treasury bonds—bonds with maturities of 20 years or more.
2
99
imp
imp


Binance Academy
·
--
How to Trade POPMART, TMF, TBT, and BITO on the Binance Futures Platform
Disclaimer: This content is for general information and educational purposes only. Products mentioned in this article may not be available in your region.
Key points
Binance Futures will list four [TradFi](https://www.binance.com/en/academy/glossary/tradfi) perpetual contracts between July 23 and 27, 2026: POPMARTUSDT, TMFUSDT, TBTUSDT, and BITOUSDT.
Track the share price of POPMARTUSDT for Pop Mart International Group (HKEX: 9992). The company is a designer toy and pop culture company headquartered in China and listed on the Hong Kong Stock Exchange.
TMFUSDT and TBTUSDT track leveraged and inverse U.S. Treasury ETFs, providing traders with directional exposure to the U.S. long-term government bond market.
Key points
Binance Futures will list four [TradFi](https://www.binance.com/en/academy/glossary/tradfi) perpetual contracts between July 23 and 27, 2026: POPMARTUSDT, TMFUSDT, TBTUSDT, and BITOUSDT.
Track the share price of POPMARTUSDT for Pop Mart International Group (HKEX: 9992). The company is a designer toy and pop culture company headquartered in China and listed on the Hong Kong Stock Exchange.
TMFUSDT and TBTUSDT track leveraged and inverse U.S. Treasury ETFs, providing traders with directional exposure to the U.S. long-term government bond market.
1
3
·
--
Bullish
i am filling bullish
what do you think ?
wrong or it' time to take it
i am filling bullish
what do you think ?
wrong or it' time to take it
what do you think ?
wrong or it' time to take it
564
This is 100% real — no clich or misconceptions
i am still wested for get some new but...
guys i want to share too much experience i have it from day 1 i remember still date and when came here too much excited about getting some new
instead of big boss
now i never lay down you guys from your expectations
I’d love to start livestreaming, but I don’t have enough followers yet. 🥹
It’s such a bummer! If you don’t mind, could you give me a follow?
or help me if can do
#BTC
#GOLD
#oil
#cryptouniverseofficial
This is 100% real — no clich or misconceptions
i am still wested for get some new but...
guys i want to share too much experience i have it from day 1 i remember still date and when came here too much excited about getting some new
instead of big boss
now i never lay down you guys from your expectations
I’d love to start livestreaming, but I don’t have enough followers yet. 🥹
It’s such a bummer! If you don’t mind, could you give me a follow?
or help me if can do
#BTC
#GOLD
#oil
#cryptouniverseofficial
i am still wested for get some new but...
guys i want to share too much experience i have it from day 1 i remember still date and when came here too much excited about getting some new
instead of big boss
now i never lay down you guys from your expectations
I’d love to start livestreaming, but I don’t have enough followers yet. 🥹
It’s such a bummer! If you don’t mind, could you give me a follow?
or help me if can do
#BTC
#GOLD
#oil
#cryptouniverseofficial
1
386
·
--
Bearish
tik tik time bom will activate soon about big boom 💥💥💥 hipe related Bitcoin and dfi market nuts and it starts soon before November second half and it regular time money pried cycle yet new deep for inflow of money 💰💰💰💰
and socially guys i have done it before time and eye on this again again when something happened into economic pressure and global supply chain management
trick triks simple is that know has we aslo follow to make money instead of big another
let's see it we more deep to get more profit into dfi market
#bitcoin
#GoldenOpportunity
#decentralization
#difi理财
what will happen within second half of November 2026
tik tik time bom will activate soon about big boom 💥💥💥 hipe related Bitcoin and dfi market nuts and it starts soon before November second half and it regular time money pried cycle yet new deep for inflow of money 💰💰💰💰
and socially guys i have done it before time and eye on this again again when something happened into economic pressure and global supply chain management
trick triks simple is that know has we aslo follow to make money instead of big another
let's see it we more deep to get more profit into dfi market
#bitcoin
#GoldenOpportunity
#decentralization
#difi理财
what will happen within second half of November 2026
and socially guys i have done it before time and eye on this again again when something happened into economic pressure and global supply chain management
trick triks simple is that know has we aslo follow to make money instead of big another
let's see it we more deep to get more profit into dfi market
#bitcoin
#GoldenOpportunity
#decentralization
#difi理财
what will happen within second half of November 2026
get more deep in downward
80%
or up
20%
5 votes • Voting closed
260
guys take it entry point before miss out because may it' will has reverse trend will happen towards upside
what do you think ?
i am right or wrong
pls comment share our feedback to comment box it's valuable part of my analytical information or hypothetical part also
pls share this post with our community group and ask also then and follow me also to be nest time touch other topics with me
share like and follow guys eachother for make hipe
#silvar
#commodities
#goldfollowers
#silverfollower
guys take it entry point before miss out because may it' will has reverse trend will happen towards upside
what do you think ?
i am right or wrong
pls comment share our feedback to comment box it's valuable part of my analytical information or hypothetical part also
pls share this post with our community group and ask also then and follow me also to be nest time touch other topics with me
share like and follow guys eachother for make hipe
#silvar
#commodities
#goldfollowers
#silverfollower
what do you think ?
i am right or wrong
pls comment share our feedback to comment box it's valuable part of my analytical information or hypothetical part also
pls share this post with our community group and ask also then and follow me also to be nest time touch other topics with me
share like and follow guys eachother for make hipe
#silvar
#commodities
#goldfollowers
#silverfollower
422
that's too much not enough
my friend first time you also motivated me to learn new language
and definitely i am trying yet now in this time
my friend i want also your help when i want so 🙏pls do fever like big brother , family do when i want it because
i am learning new things,new language so when i want help like big brother
and one again thank you much friend
that's too much not enough
my friend first time you also motivated me to learn new language
and definitely i am trying yet now in this time
my friend i want also your help when i want so 🙏pls do fever like big brother , family do when i want it because
i am learning new things,new language so when i want help like big brother
and one again thank you much friend
my friend first time you also motivated me to learn new language
and definitely i am trying yet now in this time
my friend i want also your help when i want so 🙏pls do fever like big brother , family do when i want it because
i am learning new things,new language so when i want help like big brother
and one again thank you much friend

Agusting_交易40
·
--
[Ended] 🎙️ Good afternoon, team 💪🚧🚧🚧
176 listens
151
Ni hao (hi guys ) all of you guys all
may hop your doing well
glad to hear informed you guys Bitcoin has correcting himself soon before setup new trend
and trust me guys it will happen within few days or weeks and booooom 💥💥💥
then he new take down back or looking himself downward trend may be hopefully it happen level of market intrest cause fuel cycle has not started yet and last two years big announcement is deployments issue and wors situation triggered back to back
that's why gold cycle has too much strong at specific level of support and intrensic value price
and news is guys gold , crude has it theing owned self marginal line owned it has all ready improved so it now time currently money cycle too much teit and new cycle yet new making it ways , sources till period of time pending it.
but good news it all our big god father means inflation days let's soon triggered it and trust it will happen within few weeks or may get it take out month may be
but it will definitely happen so keep patience guys countdown all started when Bitcoin has touched level below $bitcoin $60000
#bitcoin
#GOLD
#crude
#GlobalFinance
chill guys cool relaxing like me
let's party whenever you want with me
so all guys follow , like and share also your ideas mental mindset with me
do you want join us , share follow me join as good friend or part of our community , family ?
Ni hao (hi guys ) all of you guys all
may hop your doing well
glad to hear informed you guys Bitcoin has correcting himself soon before setup new trend
and trust me guys it will happen within few days or weeks and booooom 💥💥💥
then he new take down back or looking himself downward trend may be hopefully it happen level of market intrest cause fuel cycle has not started yet and last two years big announcement is deployments issue and wors situation triggered back to back
that's why gold cycle has too much strong at specific level of support and intrensic value price
and news is guys gold , crude has it theing owned self marginal line owned it has all ready improved so it now time currently money cycle too much teit and new cycle yet new making it ways , sources till period of time pending it.
but good news it all our big god father means inflation days let's soon triggered it and trust it will happen within few weeks or may get it take out month may be
but it will definitely happen so keep patience guys countdown all started when Bitcoin has touched level below $bitcoin $60000
#bitcoin
#GOLD
#crude
#GlobalFinance
chill guys cool relaxing like me
let's party whenever you want with me
so all guys follow , like and share also your ideas mental mindset with me
do you want join us , share follow me join as good friend or part of our community , family ?
may hop your doing well
glad to hear informed you guys Bitcoin has correcting himself soon before setup new trend
and trust me guys it will happen within few days or weeks and booooom 💥💥💥
then he new take down back or looking himself downward trend may be hopefully it happen level of market intrest cause fuel cycle has not started yet and last two years big announcement is deployments issue and wors situation triggered back to back
that's why gold cycle has too much strong at specific level of support and intrensic value price
and news is guys gold , crude has it theing owned self marginal line owned it has all ready improved so it now time currently money cycle too much teit and new cycle yet new making it ways , sources till period of time pending it.
but good news it all our big god father means inflation days let's soon triggered it and trust it will happen within few weeks or may get it take out month may be
but it will definitely happen so keep patience guys countdown all started when Bitcoin has touched level below $bitcoin $60000
#bitcoin
#GOLD
#crude
#GlobalFinance
chill guys cool relaxing like me
let's party whenever you want with me
so all guys follow , like and share also your ideas mental mindset with me
do you want join us , share follow me join as good friend or part of our community , family ?
so guys says yes
100%
or no so wait write down why
0%
3 votes • Voting closed
2
191
Log in to explore more content
Join global crypto users on Binance Square
⚡️ Get latest and useful information about crypto.
💬 Trusted by the world’s largest crypto exchange.
👍 Discover real insights from verified creators.
Email / Phone number
Trending Topics
NvidiaBeatsEstimatesWith$130BQ4Outlook
2,700 views
55 Discussing
Nvidia Beats With $115.8 Billion in Revenue, Guides to $130 Billion and Adds $150 Billion Buyback
Binance News
·25 Likes
·31.3k views
AnthropicIPOPriceCouldExceed$80
6,553 views
60 Discussing
CanNvidia’sDataCenterGrowthContinue?
14,508 views
258 Discussing