

#mr320
mr320
1.1M views
2,217 Discussing
Hot
Latest

·
--
Bullish
$BTC
{spot}(BTCUSDT)
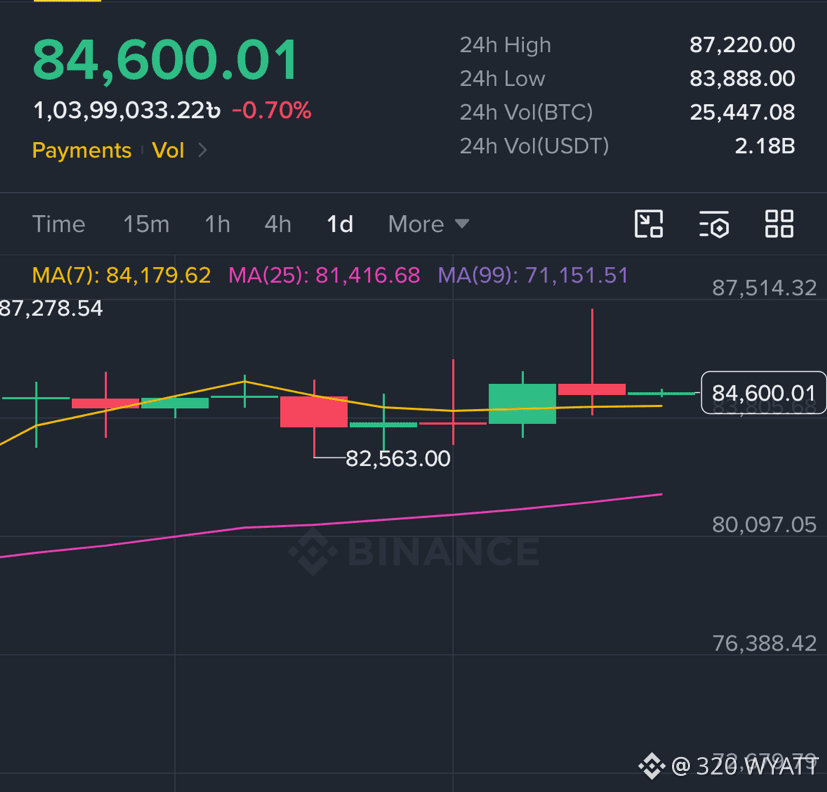
Bitcoin was $57,000 just 3 months ago
Now BTC is back over $84,000
#BTC320 #Trendingissue #Trendingcoin320 #mr320 #writetoearn320
$BTC
Bitcoin was $57,000 just 3 months ago
Now BTC is back over $84,000
#BTC320 #Trendingissue #Trendingcoin320 #mr320 #writetoearn320
Bitcoin was $57,000 just 3 months ago
Now BTC is back over $84,000
#BTC320 #Trendingissue #Trendingcoin320 #mr320 #writetoearn320
92
·
--
Bullish
$XRP
{spot}(XRPUSDT)
XRP at $1.54, extending its advance well above the main Exponential Moving Averages, which keeps the near-term bias bullish. Price holds over the 50-day EMA at $1.38 and the 200-day EMA at $1.37, while the 100-day EMA at $1.32 and the SuperTrend line at $1.28 track far below as trend support.
Momentum remains constructive, with the Relative Strength Index (RSI) around 60 suggesting sustained buying pressure, although the slightly negative Moving Average Convergence Divergence (MACD) near the zero line hints at a moderating upside swing rather than an outright.
On the downside, immediate technical footing lies at the former break area of the rising support trendline near $1.40, followed by clustered dynamic demand at the 50-day EMA at $1.38 and the 200-day EMA at $1.37. Deeper pullbacks would expose the 100-day EMA at $1.32, then the SuperTrend baseline at $1.28, where a stronger medium-term floor lies.
With no clear overhead levels on the daily chart, the pair would likely need a decisive break back below the $1.40-$1.38 region to weaken the prevailing bullish structure on the daily timeframe.
On the weekly chart, XRP similarly retains a constructive bullish bias as price holds above the 50-week EMA at $1.52 and the longer-term 200-week EMA at $1.37. The SuperTrend line at $0.96 sits well below the market, reinforcing a medium-term uptrend, while the RSI at 57 leans bullish without being overbought.
#xrp320 #mr320 #Trendingissue #Trendingcoin320 #writetoearn320
$XRP
XRP at $1.54, extending its advance well above the main Exponential Moving Averages, which keeps the near-term bias bullish. Price holds over the 50-day EMA at $1.38 and the 200-day EMA at $1.37, while the 100-day EMA at $1.32 and the SuperTrend line at $1.28 track far below as trend support.
Momentum remains constructive, with the Relative Strength Index (RSI) around 60 suggesting sustained buying pressure, although the slightly negative Moving Average Convergence Divergence (MACD) near the zero line hints at a moderating upside swing rather than an outright.
On the downside, immediate technical footing lies at the former break area of the rising support trendline near $1.40, followed by clustered dynamic demand at the 50-day EMA at $1.38 and the 200-day EMA at $1.37. Deeper pullbacks would expose the 100-day EMA at $1.32, then the SuperTrend baseline at $1.28, where a stronger medium-term floor lies.
With no clear overhead levels on the daily chart, the pair would likely need a decisive break back below the $1.40-$1.38 region to weaken the prevailing bullish structure on the daily timeframe.
On the weekly chart, XRP similarly retains a constructive bullish bias as price holds above the 50-week EMA at $1.52 and the longer-term 200-week EMA at $1.37. The SuperTrend line at $0.96 sits well below the market, reinforcing a medium-term uptrend, while the RSI at 57 leans bullish without being overbought.
#xrp320 #mr320 #Trendingissue #Trendingcoin320 #writetoearn320
XRP at $1.54, extending its advance well above the main Exponential Moving Averages, which keeps the near-term bias bullish. Price holds over the 50-day EMA at $1.38 and the 200-day EMA at $1.37, while the 100-day EMA at $1.32 and the SuperTrend line at $1.28 track far below as trend support.
Momentum remains constructive, with the Relative Strength Index (RSI) around 60 suggesting sustained buying pressure, although the slightly negative Moving Average Convergence Divergence (MACD) near the zero line hints at a moderating upside swing rather than an outright.
On the downside, immediate technical footing lies at the former break area of the rising support trendline near $1.40, followed by clustered dynamic demand at the 50-day EMA at $1.38 and the 200-day EMA at $1.37. Deeper pullbacks would expose the 100-day EMA at $1.32, then the SuperTrend baseline at $1.28, where a stronger medium-term floor lies.
With no clear overhead levels on the daily chart, the pair would likely need a decisive break back below the $1.40-$1.38 region to weaken the prevailing bullish structure on the daily timeframe.
On the weekly chart, XRP similarly retains a constructive bullish bias as price holds above the 50-week EMA at $1.52 and the longer-term 200-week EMA at $1.37. The SuperTrend line at $0.96 sits well below the market, reinforcing a medium-term uptrend, while the RSI at 57 leans bullish without being overbought.
#xrp320 #mr320 #Trendingissue #Trendingcoin320 #writetoearn320
121
·
--
Bullish
$DOGE
{spot}(DOGEUSDT)
🚨🚨Dogecoin whales purchased over 1,140,000,000 DOGE in the past 4 days.
#doge320 #mr320 #Trendingissue #Trendingcoin320 #writetoearn320
$DOGE
🚨🚨Dogecoin whales purchased over 1,140,000,000 DOGE in the past 4 days.
#doge320 #mr320 #Trendingissue #Trendingcoin320 #writetoearn320
🚨🚨Dogecoin whales purchased over 1,140,000,000 DOGE in the past 4 days.
#doge320 #mr320 #Trendingissue #Trendingcoin320 #writetoearn320

92
·
--
Bullish
$XRP
{spot}(XRPUSDT)
XRP trades around $1.51, holding steady near the $1.50 mark since late September. A key event is the shareholder vote in New York on the merger creating Evernorth, a company holding 473 million XRP, which would list on Nasdaq under ticker XRPN. This could influence XRP supply and price dynamics. Additionally, Ripple's monthly escrow window opens, potentially releasing up to 1 billion XRP into the market, a significant volume relative to daily trading. German investors should note tax differences between owning XRP tokens directly and shares like XRPN. The market awaits these developments, with price levels between $1.28 and $1.57 critical for near-term movements.
#xrp320 #mr320 #Trendingcoin320 #Trendingissue #WriteToEarn2026
$XRP
XRP trades around $1.51, holding steady near the $1.50 mark since late September. A key event is the shareholder vote in New York on the merger creating Evernorth, a company holding 473 million XRP, which would list on Nasdaq under ticker XRPN. This could influence XRP supply and price dynamics. Additionally, Ripple's monthly escrow window opens, potentially releasing up to 1 billion XRP into the market, a significant volume relative to daily trading. German investors should note tax differences between owning XRP tokens directly and shares like XRPN. The market awaits these developments, with price levels between $1.28 and $1.57 critical for near-term movements.
#xrp320 #mr320 #Trendingcoin320 #Trendingissue #WriteToEarn2026
XRP trades around $1.51, holding steady near the $1.50 mark since late September. A key event is the shareholder vote in New York on the merger creating Evernorth, a company holding 473 million XRP, which would list on Nasdaq under ticker XRPN. This could influence XRP supply and price dynamics. Additionally, Ripple's monthly escrow window opens, potentially releasing up to 1 billion XRP into the market, a significant volume relative to daily trading. German investors should note tax differences between owning XRP tokens directly and shares like XRPN. The market awaits these developments, with price levels between $1.28 and $1.57 critical for near-term movements.
#xrp320 #mr320 #Trendingcoin320 #Trendingissue #WriteToEarn2026
XRP-2.90%
XRPNUS+67.48%
64
·
--
Bullish
$XRP
{spot}(XRPUSDT)
XRP enters Q4 with the market watching a straightforward test: can new demand absorb the supply between $1.60 and $1.70? ETF inflows, large-holder accumulation and expanding institutional use of XRPL provide measurable demand indicators, while derivatives positioning adds liquidity and leverage to the market. The technical structure remains constructive above the $1.37–$1.46 support band.
A sustained break above $1.70 would move the Q4 setup toward $1.80–$1.90 and then the $2.00–$2.20 supply zone shown on the chart. Until that breakout occurs, XRP remains in a defined consolidation beneath major overhead resistance.
#xrp320 #mr320 #Trendingcoin320 #Trendingissue #writetoearn320
$XRP
XRP enters Q4 with the market watching a straightforward test: can new demand absorb the supply between $1.60 and $1.70? ETF inflows, large-holder accumulation and expanding institutional use of XRPL provide measurable demand indicators, while derivatives positioning adds liquidity and leverage to the market. The technical structure remains constructive above the $1.37–$1.46 support band.
A sustained break above $1.70 would move the Q4 setup toward $1.80–$1.90 and then the $2.00–$2.20 supply zone shown on the chart. Until that breakout occurs, XRP remains in a defined consolidation beneath major overhead resistance.
#xrp320 #mr320 #Trendingcoin320 #Trendingissue #writetoearn320
XRP enters Q4 with the market watching a straightforward test: can new demand absorb the supply between $1.60 and $1.70? ETF inflows, large-holder accumulation and expanding institutional use of XRPL provide measurable demand indicators, while derivatives positioning adds liquidity and leverage to the market. The technical structure remains constructive above the $1.37–$1.46 support band.
A sustained break above $1.70 would move the Q4 setup toward $1.80–$1.90 and then the $2.00–$2.20 supply zone shown on the chart. Until that breakout occurs, XRP remains in a defined consolidation beneath major overhead resistance.
#xrp320 #mr320 #Trendingcoin320 #Trendingissue #writetoearn320
274
·
--
Bullish
$SOL
{spot}(SOLUSDT)
🚨🚨JUST IN:
Bitwise ETF clients buy $5.75 million worth of $SOL.
#solana320 #mr320 #Trendingissue #Trendingcoin320 #writetoearn320
$SOL
🚨🚨JUST IN:
Bitwise ETF clients buy $5.75 million worth of $SOL .
#solana320 #mr320 #Trendingissue #Trendingcoin320 #writetoearn320
🚨🚨JUST IN:
Bitwise ETF clients buy $5.75 million worth of $SOL .
#solana320 #mr320 #Trendingissue #Trendingcoin320 #writetoearn320

1
84
·
--
Bullish
$BTC
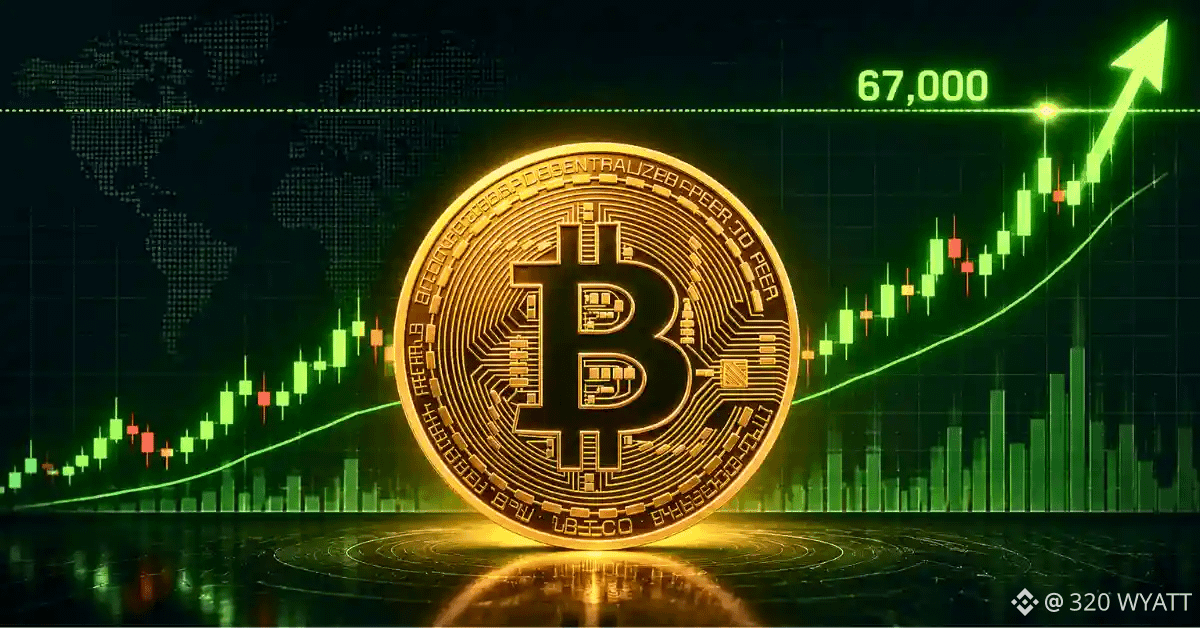
Bitcoin is up 43.1% so far in Q3 2026, on track for its best quarterly performance since Q4 2024 and its third-best quarterly gain since US spot Bitcoin ETFs began trading in January 2024. Since August 19 alone, Bitcoin has surged 29.8%, coinciding with the US Treasury’s announcement that it would increase buybacks of long-dated Treasuries. US spot Bitcoin ETFs posted $2.4 billion in inflows for the week ending September 25, their largest weekly intake since October 2025. Year-to-date inflows now stand at $1.0 billion, a sharp reversal from $5.0 billion in total outflows recorded at the end of July.
#BTC320 #mr320 #Trendingcoin320 #writetoearn320 #Trendingissue
{spot}(BTCUSDT)
$BTC
Bitcoin is up 43.1% so far in Q3 2026, on track for its best quarterly performance since Q4 2024 and its third-best quarterly gain since US spot Bitcoin ETFs began trading in January 2024. Since August 19 alone, Bitcoin has surged 29.8%, coinciding with the US Treasury’s announcement that it would increase buybacks of long-dated Treasuries. US spot Bitcoin ETFs posted $2.4 billion in inflows for the week ending September 25, their largest weekly intake since October 2025. Year-to-date inflows now stand at $1.0 billion, a sharp reversal from $5.0 billion in total outflows recorded at the end of July.
#BTC320 #mr320 #Trendingcoin320 #writetoearn320 #Trendingissue
Bitcoin is up 43.1% so far in Q3 2026, on track for its best quarterly performance since Q4 2024 and its third-best quarterly gain since US spot Bitcoin ETFs began trading in January 2024. Since August 19 alone, Bitcoin has surged 29.8%, coinciding with the US Treasury’s announcement that it would increase buybacks of long-dated Treasuries. US spot Bitcoin ETFs posted $2.4 billion in inflows for the week ending September 25, their largest weekly intake since October 2025. Year-to-date inflows now stand at $1.0 billion, a sharp reversal from $5.0 billion in total outflows recorded at the end of July.
#BTC320 #mr320 #Trendingcoin320 #writetoearn320 #Trendingissue
250
·
--
Bullish
$XRP
{spot}(XRPUSDT)
🚨XRP shows early signs of weakness🚨
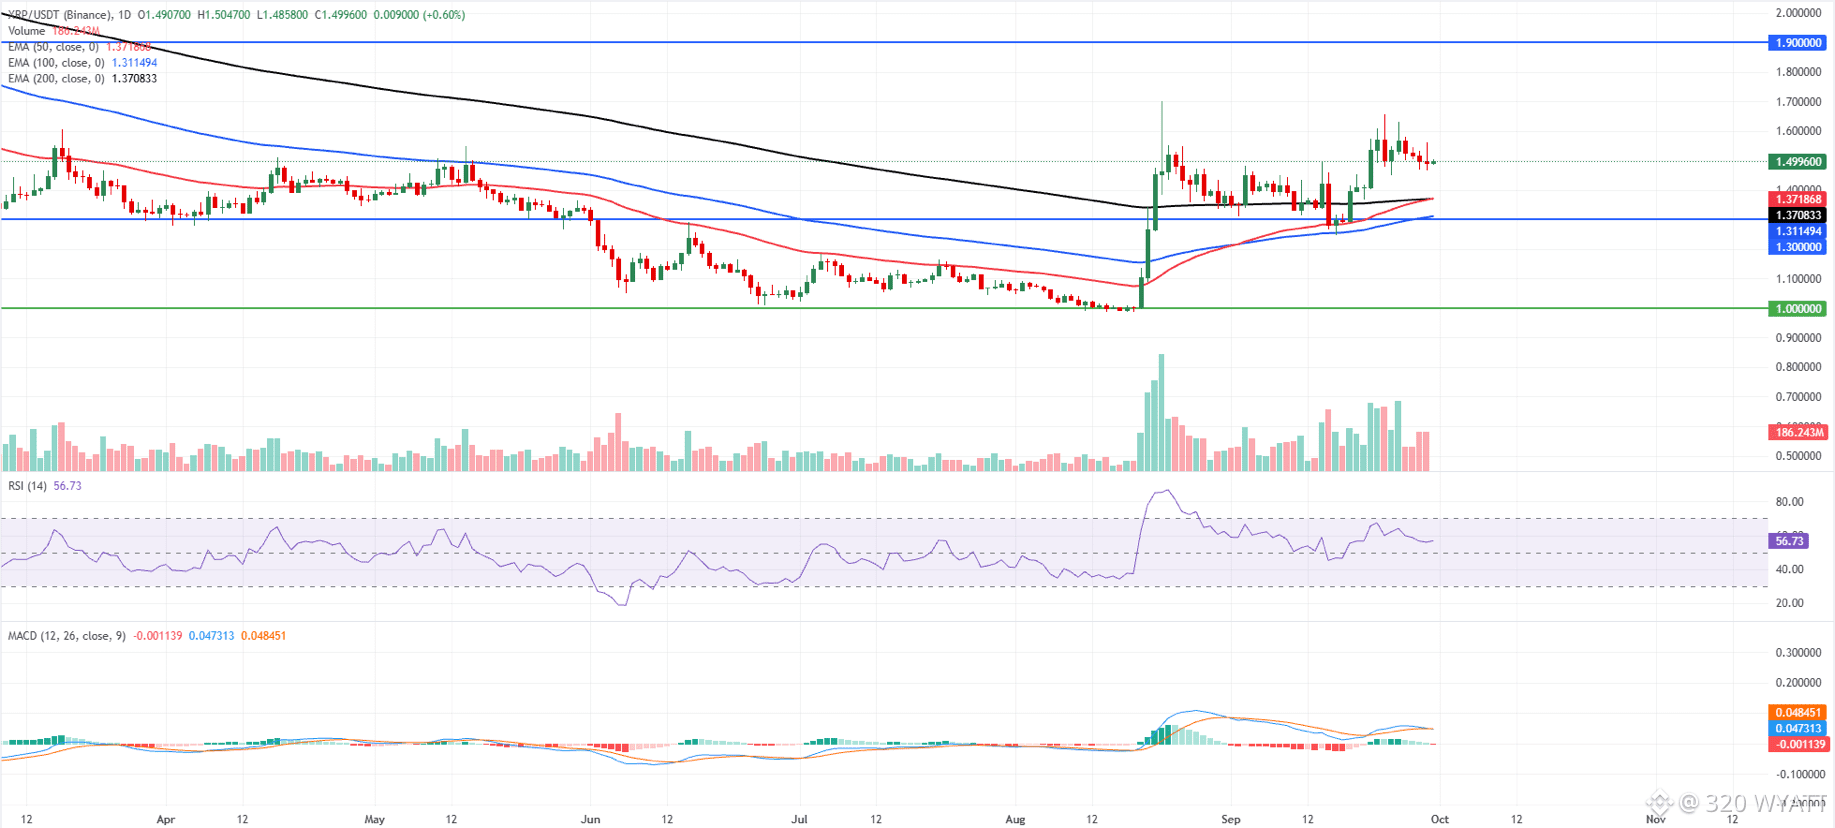
XRP price trades at $1.499 on Wednesday after four consecutive days of losses since last week. Despite this correction, XRP maintains a constructive Outlook, holding well above the 50-day and 200-day EMAs at $1.371 and $1.370, as well as the 100-day EMA at $1.311.
The RSI at 56 stays in positive territory without reaching overbought levels. At the same time, the MACD flattens just below the zero line, suggesting that bullish momentum is moderating but the broader upside structure remains intact.
On the downside, initial support is seen at the clustered 50-day and 200-day EMAs around $1.370, followed by the 100-day EMA at $1.311 and the horizontal level at $1.300, before a deeper floor emerges near $1.000.
On the topside, the next key hurdle is the horizontal resistance at $1.900, and a sustained break above this barrier would open the path for a continuation of the prevailing uptrend.
#xrp320 #mr320 #Trendingissue #Trendingcoin320 #WriteToEarn2026
$XRP
🚨XRP shows early signs of weakness🚨
XRP price trades at $1.499 on Wednesday after four consecutive days of losses since last week. Despite this correction, XRP maintains a constructive Outlook, holding well above the 50-day and 200-day EMAs at $1.371 and $1.370, as well as the 100-day EMA at $1.311.
The RSI at 56 stays in positive territory without reaching overbought levels. At the same time, the MACD flattens just below the zero line, suggesting that bullish momentum is moderating but the broader upside structure remains intact.
On the downside, initial support is seen at the clustered 50-day and 200-day EMAs around $1.370, followed by the 100-day EMA at $1.311 and the horizontal level at $1.300, before a deeper floor emerges near $1.000.
On the topside, the next key hurdle is the horizontal resistance at $1.900, and a sustained break above this barrier would open the path for a continuation of the prevailing uptrend.
#xrp320 #mr320 #Trendingissue #Trendingcoin320 #WriteToEarn2026
🚨XRP shows early signs of weakness🚨
XRP price trades at $1.499 on Wednesday after four consecutive days of losses since last week. Despite this correction, XRP maintains a constructive Outlook, holding well above the 50-day and 200-day EMAs at $1.371 and $1.370, as well as the 100-day EMA at $1.311.
The RSI at 56 stays in positive territory without reaching overbought levels. At the same time, the MACD flattens just below the zero line, suggesting that bullish momentum is moderating but the broader upside structure remains intact.
On the downside, initial support is seen at the clustered 50-day and 200-day EMAs around $1.370, followed by the 100-day EMA at $1.311 and the horizontal level at $1.300, before a deeper floor emerges near $1.000.
On the topside, the next key hurdle is the horizontal resistance at $1.900, and a sustained break above this barrier would open the path for a continuation of the prevailing uptrend.
#xrp320 #mr320 #Trendingissue #Trendingcoin320 #WriteToEarn2026
68
·
--
Bullish
$ETH
{spot}(ETHUSDT)
🚨 Ethereum bulls show signs of exhaustion 🚨
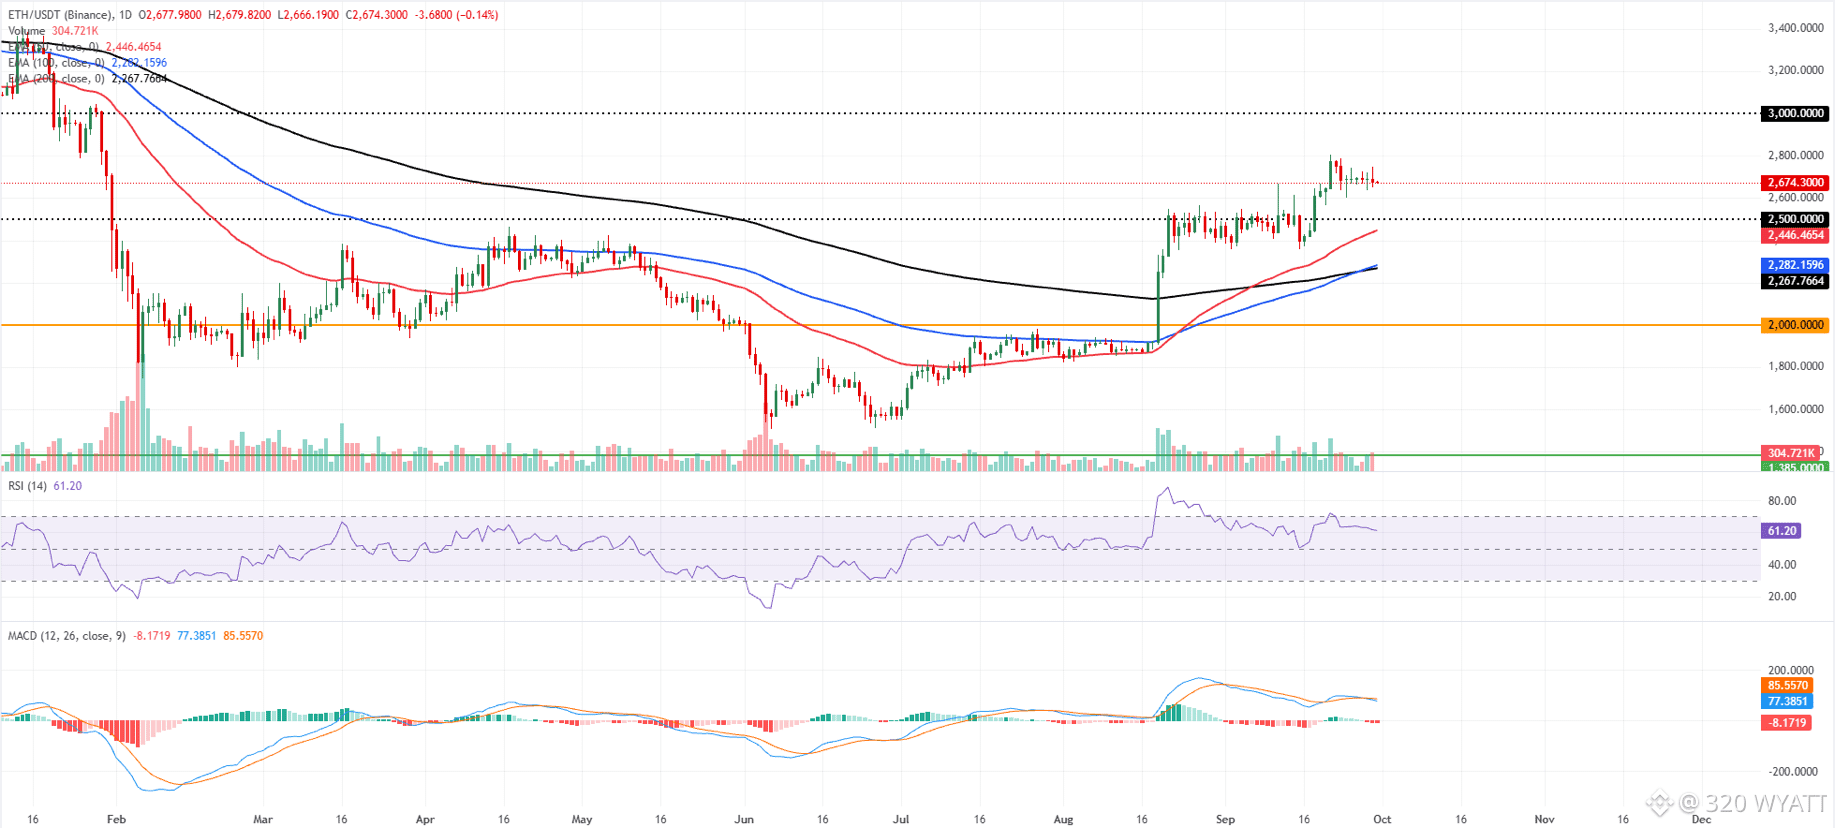
Ethereum price trades at $2,674 on Wednesday, consolidating near recent highs as bulls show signs of exhaustion. Despite pauses in its rally, ETH holds a constructive bias as it remains well above the 50-day, 100-day and 200-day EMAs at $2,446, $2,282 and $2,267, respectively.
The cluster of underlying EMAs and the horizontal level at $2,500 reinforce a supportive backdrop. At the same time, the RSI around 61 suggests steady, but not overextended, upside momentum even as the MACD indicator slips further below zero, hinting at a mild loss of short-term upside conviction rather than a full-fledged reversal.
On the downside, immediate support is seen at the $2,500 horizontal line, followed closely by the 50-day EMA at $2,446, with the 100-day and 200-day EMAs at $2,282 and $2,267 providing a deeper demand band ahead of the more distant $2,000 and $1,385 structural floors.
On the topside, the next relevant resistance is the psychological $3,000 barrier, and a decisive daily close above it would likely open the way for an extension of the prevailing uptrend despite the currently cautious MACD signal.
#ETH320 #mr320 #Trendingissue #Trendingcoin320 #writetoearn320
$ETH
🚨 Ethereum bulls show signs of exhaustion 🚨
Ethereum price trades at $2,674 on Wednesday, consolidating near recent highs as bulls show signs of exhaustion. Despite pauses in its rally, ETH holds a constructive bias as it remains well above the 50-day, 100-day and 200-day EMAs at $2,446, $2,282 and $2,267, respectively.
The cluster of underlying EMAs and the horizontal level at $2,500 reinforce a supportive backdrop. At the same time, the RSI around 61 suggests steady, but not overextended, upside momentum even as the MACD indicator slips further below zero, hinting at a mild loss of short-term upside conviction rather than a full-fledged reversal.
On the downside, immediate support is seen at the $2,500 horizontal line, followed closely by the 50-day EMA at $2,446, with the 100-day and 200-day EMAs at $2,282 and $2,267 providing a deeper demand band ahead of the more distant $2,000 and $1,385 structural floors.
On the topside, the next relevant resistance is the psychological $3,000 barrier, and a decisive daily close above it would likely open the way for an extension of the prevailing uptrend despite the currently cautious MACD signal.
#ETH320 #mr320 #Trendingissue #Trendingcoin320 #writetoearn320
🚨 Ethereum bulls show signs of exhaustion 🚨
Ethereum price trades at $2,674 on Wednesday, consolidating near recent highs as bulls show signs of exhaustion. Despite pauses in its rally, ETH holds a constructive bias as it remains well above the 50-day, 100-day and 200-day EMAs at $2,446, $2,282 and $2,267, respectively.
The cluster of underlying EMAs and the horizontal level at $2,500 reinforce a supportive backdrop. At the same time, the RSI around 61 suggests steady, but not overextended, upside momentum even as the MACD indicator slips further below zero, hinting at a mild loss of short-term upside conviction rather than a full-fledged reversal.
On the downside, immediate support is seen at the $2,500 horizontal line, followed closely by the 50-day EMA at $2,446, with the 100-day and 200-day EMAs at $2,282 and $2,267 providing a deeper demand band ahead of the more distant $2,000 and $1,385 structural floors.
On the topside, the next relevant resistance is the psychological $3,000 barrier, and a decisive daily close above it would likely open the way for an extension of the prevailing uptrend despite the currently cautious MACD signal.
#ETH320 #mr320 #Trendingissue #Trendingcoin320 #writetoearn320
82
·
--
Bullish
$BTC
{spot}(BTCUSDT)
🚨🚨JUST IN:
BlackRock ETF clients buy $51.09 million worth of $BTC.
#BTC320 #Trendingissue #Trendingcoin320 #mr320 #writetoearn320
$BTC
🚨🚨JUST IN:
BlackRock ETF clients buy $51.09 million worth of $BTC .
#BTC320 #Trendingissue #Trendingcoin320 #mr320 #writetoearn320
🚨🚨JUST IN:
BlackRock ETF clients buy $51.09 million worth of $BTC .
#BTC320 #Trendingissue #Trendingcoin320 #mr320 #writetoearn320

133
·
--
Bullish
$SOL
{spot}(SOLUSDT)
Solana (SOL) is trading at $121.69, slightly up by 0.23%, after reaching an intraday high of $124.95. The price rally gained momentum after breaking above $94.85 earlier in September, supported by strong technical indicators like RSI near overbought levels and a positive MACD. Network activity has increased, with total value locked on Solana rising from $4.7 billion in August to $6.7 billion in late September. Additionally, derivatives open interest has climbed to $7.5 billion, highlighted by a large 20x leveraged long position worth $67.88 million, signaling high trader confidence but also potential for volatility. The next key price level to watch is $124.95, which if surpassed, could extend the uptrend.
#solana320 #Trendingissue #mr320 #Trendingcoin320 #writetoearn2026
$SOL
Solana (SOL) is trading at $121.69, slightly up by 0.23%, after reaching an intraday high of $124.95. The price rally gained momentum after breaking above $94.85 earlier in September, supported by strong technical indicators like RSI near overbought levels and a positive MACD. Network activity has increased, with total value locked on Solana rising from $4.7 billion in August to $6.7 billion in late September. Additionally, derivatives open interest has climbed to $7.5 billion, highlighted by a large 20x leveraged long position worth $67.88 million, signaling high trader confidence but also potential for volatility. The next key price level to watch is $124.95, which if surpassed, could extend the uptrend.
#solana320 #Trendingissue #mr320 #Trendingcoin320 #writetoearn2026
Solana (SOL) is trading at $121.69, slightly up by 0.23%, after reaching an intraday high of $124.95. The price rally gained momentum after breaking above $94.85 earlier in September, supported by strong technical indicators like RSI near overbought levels and a positive MACD. Network activity has increased, with total value locked on Solana rising from $4.7 billion in August to $6.7 billion in late September. Additionally, derivatives open interest has climbed to $7.5 billion, highlighted by a large 20x leveraged long position worth $67.88 million, signaling high trader confidence but also potential for volatility. The next key price level to watch is $124.95, which if surpassed, could extend the uptrend.
#solana320 #Trendingissue #mr320 #Trendingcoin320 #writetoearn2026

98
·
--
Bullish
$XRP
{spot}(XRPUSDT)
XRP closed June at $1.04 and closed July at $1.06. Throughout August, it fluctuated between $0.99 and $1.70 but managed to stabilize in September within a tighter range of $1.25 to $1.66, indicating that buyers are holding onto most of August's gains.
Despite this recovery, XRP remains down 17.3% for 2026 and 45.8% compared to the previous year, a more significant decline than Bitcoin's drop of 23.2%. The token reached a high of $3.67 in July 2025, closed the year at $1.84, and hit $2.42 in January 2026, placing it about 58% below its peak and 37% below its January high.
Many investors are still facing losses since many bought in at prices above $2.75, leading them to sell during each rally as the price nears their purchase levels.
#xrp320 #mr320 #Trendingissue #Trendingcoin320 #mr320
$XRP
XRP closed June at $1.04 and closed July at $1.06. Throughout August, it fluctuated between $0.99 and $1.70 but managed to stabilize in September within a tighter range of $1.25 to $1.66, indicating that buyers are holding onto most of August's gains.
Despite this recovery, XRP remains down 17.3% for 2026 and 45.8% compared to the previous year, a more significant decline than Bitcoin's drop of 23.2%. The token reached a high of $3.67 in July 2025, closed the year at $1.84, and hit $2.42 in January 2026, placing it about 58% below its peak and 37% below its January high.
Many investors are still facing losses since many bought in at prices above $2.75, leading them to sell during each rally as the price nears their purchase levels.
#xrp320 #mr320 #Trendingissue #Trendingcoin320 #mr320
XRP closed June at $1.04 and closed July at $1.06. Throughout August, it fluctuated between $0.99 and $1.70 but managed to stabilize in September within a tighter range of $1.25 to $1.66, indicating that buyers are holding onto most of August's gains.
Despite this recovery, XRP remains down 17.3% for 2026 and 45.8% compared to the previous year, a more significant decline than Bitcoin's drop of 23.2%. The token reached a high of $3.67 in July 2025, closed the year at $1.84, and hit $2.42 in January 2026, placing it about 58% below its peak and 37% below its January high.
Many investors are still facing losses since many bought in at prices above $2.75, leading them to sell during each rally as the price nears their purchase levels.
#xrp320 #mr320 #Trendingissue #Trendingcoin320 #mr320
114
·
--
Bullish
$SHIB
{spot}(SHIBUSDT)
SHIB traded at $0.00000598 on September 27, 2026, which works out at roughly 0.0000052 euros. The figure comes from the CoinGecko market snapshot taken at that moment. Over the preceding 24 hours the price moved between $0.00000582 and $0.00000606, a daily gain of 0.16 percent. Market capitalisation stood at $3.486 billion, rank 34 in the overall market, on trading volume of $84.5 million in 24 hours.
The gap between the time frames is more telling than the single day. Over seven days the token is up 9.46 percent, over 30 days 10.71 percent, over 60 days 28.04 percent. Measured over a full year it is down 50.27 percent. SHIB has worked its way up out of a deep hole without recovering even half of what it lost over the year.
The all-time high of $0.00008616 dates from October 27, 2021. The current price sits around 93 percent below it. For SHIB to reach that high again, the price would have to multiply fourteenfold. With the circulating supply unchanged, market capitalisation would then stand at roughly $50.7 billion. Call that a multiplication exercise. It shows the order of magnitude hiding behind a seemingly small number with a lot of zeros.
$SHIB #mr320 #Trendingissue #Trendingcoin320 #writetoearn2026
$SHIB
SHIB traded at $0.00000598 on September 27, 2026, which works out at roughly 0.0000052 euros. The figure comes from the CoinGecko market snapshot taken at that moment. Over the preceding 24 hours the price moved between $0.00000582 and $0.00000606, a daily gain of 0.16 percent. Market capitalisation stood at $3.486 billion, rank 34 in the overall market, on trading volume of $84.5 million in 24 hours.
The gap between the time frames is more telling than the single day. Over seven days the token is up 9.46 percent, over 30 days 10.71 percent, over 60 days 28.04 percent. Measured over a full year it is down 50.27 percent. SHIB has worked its way up out of a deep hole without recovering even half of what it lost over the year.
The all-time high of $0.00008616 dates from October 27, 2021. The current price sits around 93 percent below it. For SHIB to reach that high again, the price would have to multiply fourteenfold. With the circulating supply unchanged, market capitalisation would then stand at roughly $50.7 billion. Call that a multiplication exercise. It shows the order of magnitude hiding behind a seemingly small number with a lot of zeros.
$SHIB #mr320 #Trendingissue #Trendingcoin320 #writetoearn2026
SHIB traded at $0.00000598 on September 27, 2026, which works out at roughly 0.0000052 euros. The figure comes from the CoinGecko market snapshot taken at that moment. Over the preceding 24 hours the price moved between $0.00000582 and $0.00000606, a daily gain of 0.16 percent. Market capitalisation stood at $3.486 billion, rank 34 in the overall market, on trading volume of $84.5 million in 24 hours.
The gap between the time frames is more telling than the single day. Over seven days the token is up 9.46 percent, over 30 days 10.71 percent, over 60 days 28.04 percent. Measured over a full year it is down 50.27 percent. SHIB has worked its way up out of a deep hole without recovering even half of what it lost over the year.
The all-time high of $0.00008616 dates from October 27, 2021. The current price sits around 93 percent below it. For SHIB to reach that high again, the price would have to multiply fourteenfold. With the circulating supply unchanged, market capitalisation would then stand at roughly $50.7 billion. Call that a multiplication exercise. It shows the order of magnitude hiding behind a seemingly small number with a lot of zeros.
$SHIB #mr320 #Trendingissue #Trendingcoin320 #writetoearn2026

1
54
·
--
Bullish
$ETH
{spot}(ETHUSDT)
$ETH is very close to another bullish breakout.
A 4H close above $2,730 could pump ETH to $3K🚀
#ETH320 #mr320 #Trendingissue #Trendingcoin320 #WriteToEarn2026
$ETH
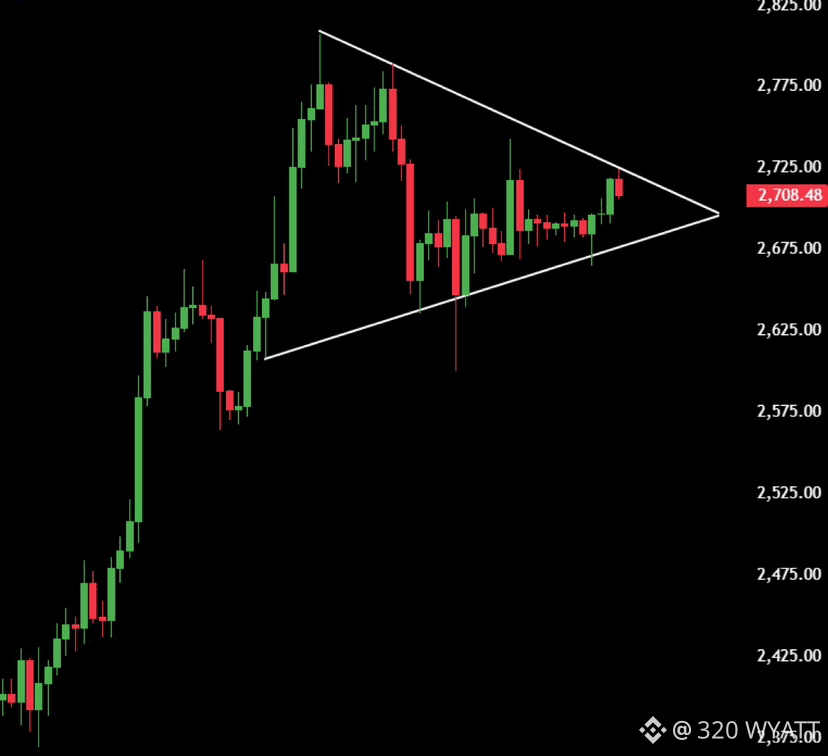
$ETH is very close to another bullish breakout.
A 4H close above $2,730 could pump ETH to $3K🚀
#ETH320 #mr320 #Trendingissue #Trendingcoin320 #WriteToEarn2026
$ETH is very close to another bullish breakout.
A 4H close above $2,730 could pump ETH to $3K🚀
#ETH320 #mr320 #Trendingissue #Trendingcoin320 #WriteToEarn2026
73
·
--
Bullish
$SOL
{spot}(SOLUSDT)
Solana (SOL) has risen above $120 for the first time since January, gaining about 8% in a week amid strong market momentum. This surge follows the deployment of the Alpenglow network upgrade on devnet, which aims to drastically reduce transaction finality times from 12.8 seconds to 150 milliseconds, enhancing speed and efficiency. Institutional interest is high, with U.S.-listed Solana ETFs recording a record $86.67 million in single-day inflows, pushing total ETF assets to $1.96 billion. On-chain metrics also show robust activity, including a stablecoin market cap hitting $17.394 billion and Solana's spot trading volume surpassing major exchanges like Coinbase. Market watchers see $130 and $150 as key resistance levels, with a close above $150 potentially triggering much higher price targets.
#solana320 #Trendingcoin320 #Trendingissue #mr320 #writetoearn320
$SOL
Solana (SOL) has risen above $120 for the first time since January, gaining about 8% in a week amid strong market momentum. This surge follows the deployment of the Alpenglow network upgrade on devnet, which aims to drastically reduce transaction finality times from 12.8 seconds to 150 milliseconds, enhancing speed and efficiency. Institutional interest is high, with U.S.-listed Solana ETFs recording a record $86.67 million in single-day inflows, pushing total ETF assets to $1.96 billion. On-chain metrics also show robust activity, including a stablecoin market cap hitting $17.394 billion and Solana's spot trading volume surpassing major exchanges like Coinbase. Market watchers see $130 and $150 as key resistance levels, with a close above $150 potentially triggering much higher price targets.
#solana320 #Trendingcoin320 #Trendingissue #mr320 #writetoearn320
Solana (SOL) has risen above $120 for the first time since January, gaining about 8% in a week amid strong market momentum. This surge follows the deployment of the Alpenglow network upgrade on devnet, which aims to drastically reduce transaction finality times from 12.8 seconds to 150 milliseconds, enhancing speed and efficiency. Institutional interest is high, with U.S.-listed Solana ETFs recording a record $86.67 million in single-day inflows, pushing total ETF assets to $1.96 billion. On-chain metrics also show robust activity, including a stablecoin market cap hitting $17.394 billion and Solana's spot trading volume surpassing major exchanges like Coinbase. Market watchers see $130 and $150 as key resistance levels, with a close above $150 potentially triggering much higher price targets.
#solana320 #Trendingcoin320 #Trendingissue #mr320 #writetoearn320

1
71
·
--
Bullish
$XRP
{spot}(XRPUSDT)
A symmetric triangle occurs when each rally peaks lower than the previous one and each decline bottoms higher, creating two trendlines that squeeze the price toward a point. The upper trendline acts as resistance, where sellers halt rallies, while the lower line serves as support, where buyers prevent price drops. A breakout occurs when price moves past one of these lines, and a retest follows, testing whether old resistance now serves as support.
XRP’s triangle formation began at its January 2018 peak of $3.31. The rally in April 2021 peaked at $1.96, hitting the upper trendline before XRP broke above it in November 2024, still below $1. After that breakout, XRP soared to a high of $3.65 in July 2025. However, a bear market that started in August 2025 pushed the price down to $0.98 by August 2026, where it touched the old trendline and bounced back.
This sequence of breakout, subsequent rally, pullback to the line, and recovery is the classic pattern. The move up to $1.60 on September 22 completed this sequence. The slight dip to $1.55 raises concerns, as closing back inside the triangle would suggest a false breakout and could trap late buyers
#xrp320 #mr320 #Trendingissue #Trendingcoin320 #writetoearn320
$XRP
A symmetric triangle occurs when each rally peaks lower than the previous one and each decline bottoms higher, creating two trendlines that squeeze the price toward a point. The upper trendline acts as resistance, where sellers halt rallies, while the lower line serves as support, where buyers prevent price drops. A breakout occurs when price moves past one of these lines, and a retest follows, testing whether old resistance now serves as support.
XRP’s triangle formation began at its January 2018 peak of $3.31. The rally in April 2021 peaked at $1.96, hitting the upper trendline before XRP broke above it in November 2024, still below $1. After that breakout, XRP soared to a high of $3.65 in July 2025. However, a bear market that started in August 2025 pushed the price down to $0.98 by August 2026, where it touched the old trendline and bounced back.
This sequence of breakout, subsequent rally, pullback to the line, and recovery is the classic pattern. The move up to $1.60 on September 22 completed this sequence. The slight dip to $1.55 raises concerns, as closing back inside the triangle would suggest a false breakout and could trap late buyers
#xrp320 #mr320 #Trendingissue #Trendingcoin320 #writetoearn320
A symmetric triangle occurs when each rally peaks lower than the previous one and each decline bottoms higher, creating two trendlines that squeeze the price toward a point. The upper trendline acts as resistance, where sellers halt rallies, while the lower line serves as support, where buyers prevent price drops. A breakout occurs when price moves past one of these lines, and a retest follows, testing whether old resistance now serves as support.
XRP’s triangle formation began at its January 2018 peak of $3.31. The rally in April 2021 peaked at $1.96, hitting the upper trendline before XRP broke above it in November 2024, still below $1. After that breakout, XRP soared to a high of $3.65 in July 2025. However, a bear market that started in August 2025 pushed the price down to $0.98 by August 2026, where it touched the old trendline and bounced back.
This sequence of breakout, subsequent rally, pullback to the line, and recovery is the classic pattern. The move up to $1.60 on September 22 completed this sequence. The slight dip to $1.55 raises concerns, as closing back inside the triangle would suggest a false breakout and could trap late buyers
#xrp320 #mr320 #Trendingissue #Trendingcoin320 #writetoearn320
1
112
·
--
Bullish
$BTC
{spot}(BTCUSDT)
Saylor hints at buying more Bitcoin 🔥
#BTC320 #Trendingcoin320 #Trendingissue #writetoearn320 #mr320
$BTC
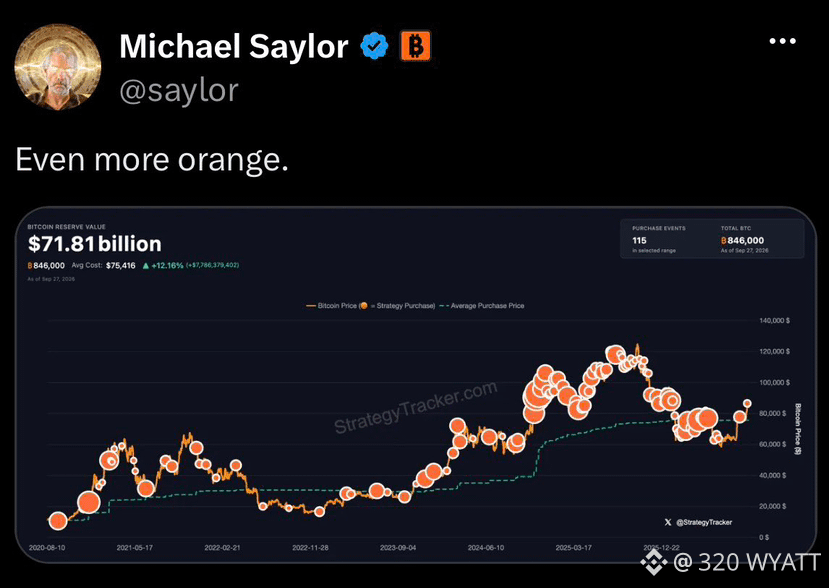
Saylor hints at buying more Bitcoin 🔥
#BTC320 #Trendingcoin320 #Trendingissue #writetoearn320 #mr320
Saylor hints at buying more Bitcoin 🔥
#BTC320 #Trendingcoin320 #Trendingissue #writetoearn320 #mr320
95
·
--
Bullish
$BTC
{spot}(BTCUSDT)
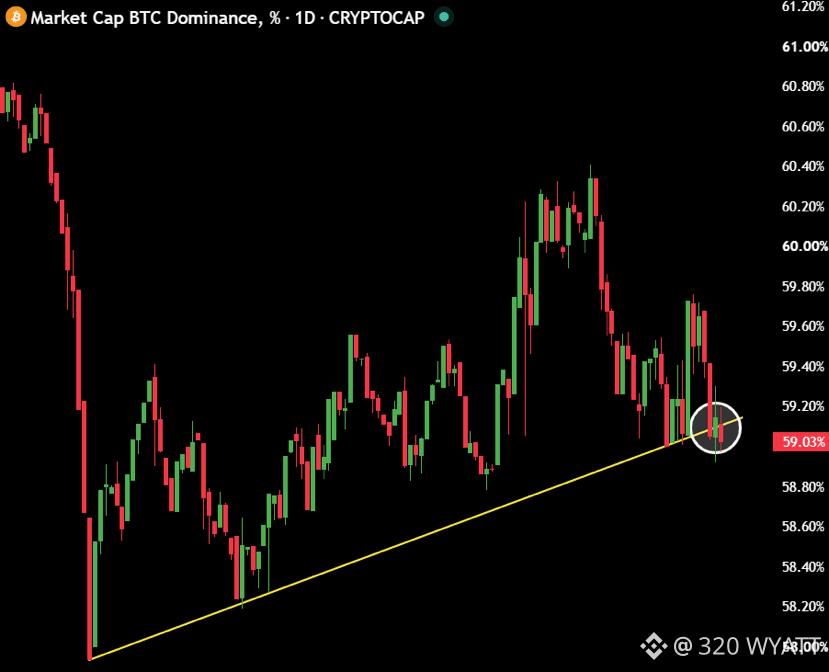
Bitcoin dominance has lost its 11-week uptrend.
BULLISH FOR ALTS.
#BTC320 #Trendingissue #Trendingcoin320 #mr320 #writetoearn320
$BTC
Bitcoin dominance has lost its 11-week uptrend.
BULLISH FOR ALTS.
#BTC320 #Trendingissue #Trendingcoin320 #mr320 #writetoearn320
Bitcoin dominance has lost its 11-week uptrend.
BULLISH FOR ALTS.
#BTC320 #Trendingissue #Trendingcoin320 #mr320 #writetoearn320
101
·
--
Bullish
$BTC
{spot}(BTCUSDT)
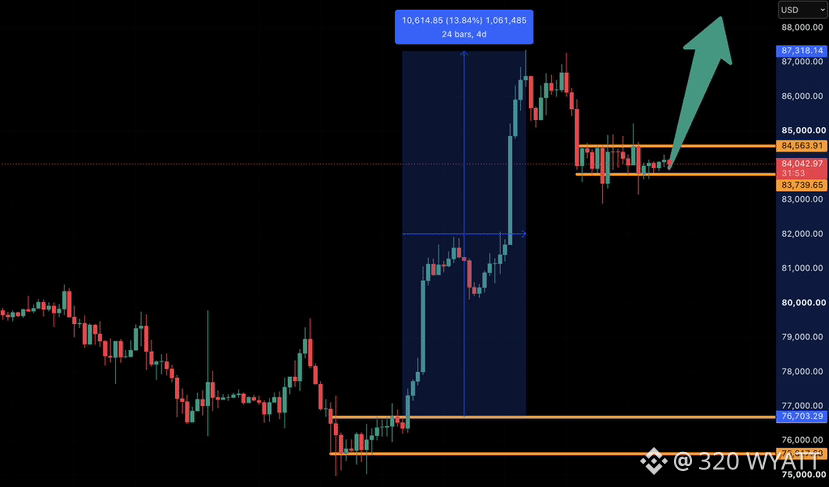
Crypto is about to MELT FACES.
The last time $BTC stayed in a multi-day $1000 range we pumped 15%.
They just keep repeating the patterns and low IQ people fall for it.
Everyone who knows exactly what's about to happen is buying more and staying patient.
DO NOT let them shake you out before the God candles happen.
#BTC320 #Trendingcoin320 #Trendingissue #mr320 #btc
$BTC
Crypto is about to MELT FACES.
The last time $BTC stayed in a multi-day $1000 range we pumped 15%.
They just keep repeating the patterns and low IQ people fall for it.
Everyone who knows exactly what's about to happen is buying more and staying patient.
DO NOT let them shake you out before the God candles happen.
#BTC320 #Trendingcoin320 #Trendingissue #mr320 #btc
Crypto is about to MELT FACES.
The last time $BTC stayed in a multi-day $1000 range we pumped 15%.
They just keep repeating the patterns and low IQ people fall for it.
Everyone who knows exactly what's about to happen is buying more and staying patient.
DO NOT let them shake you out before the God candles happen.
#BTC320 #Trendingcoin320 #Trendingissue #mr320 #btc
47
·
--
Bullish
$XRP
{spot}(XRPUSDT)
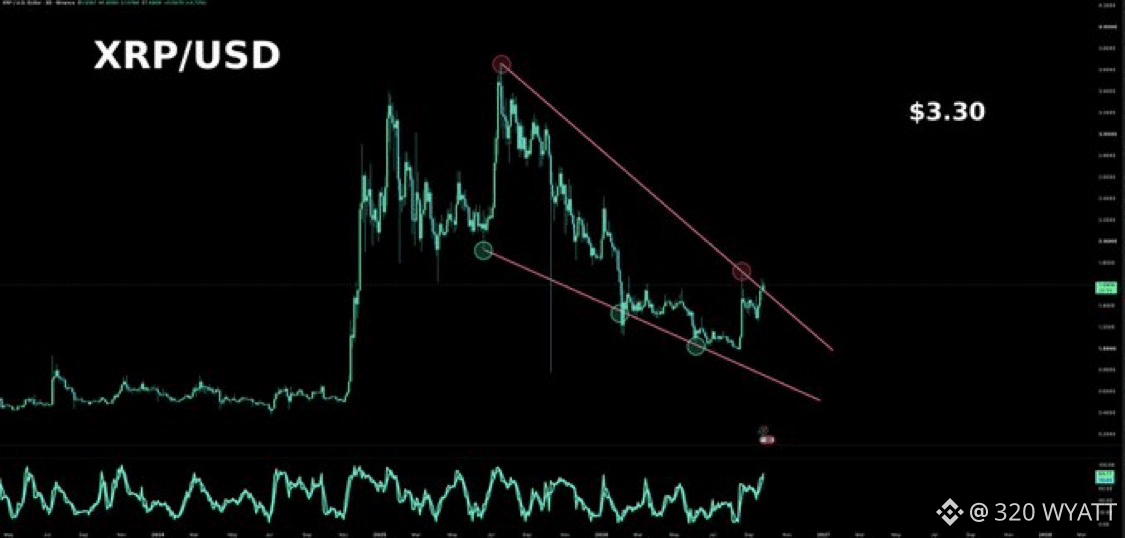
XRP is gearing up to MELT FACES.
$3.30 is the first target.
Are you in?
#xrp #xrp320 #Trendingcoin320 #mr320 #Trendingissue
$XRP
XRP is gearing up to MELT FACES.
$3.30 is the first target.
Are you in?
#xrp #xrp320 #Trendingcoin320 #mr320 #Trendingissue
XRP is gearing up to MELT FACES.
$3.30 is the first target.
Are you in?
#xrp #xrp320 #Trendingcoin320 #mr320 #Trendingissue
80
Log in to explore more content
Join global crypto users on Binance Square
⚡️ Get latest and useful information about crypto.
💬 Trusted by the world’s largest crypto exchange.
👍 Discover real insights from verified creators.
Email / Phone number
Trending Topics
1
#CerebrasSinksNearly20%OnReportNvidiaToPowerOpenAI
5 views
16 Discussing
2
#SECProposesCryptoCustodyRules
11,716 views
169 Discussing
3
#SECApproves3xLongCryptoCommodityETPs
12,950 views
184 Discussing
4
#G7PlansToReleaseUpTo100MBarrelsOilDiesel
14,182 views
223 Discussing
5
#ICBASuesOCCOverCryptoBankCharters
12,109 views
149 Discussing
6
#USStocksCloseHigherOnWeakJobsData
11,625 views
133 Discussing
7
#AnchorageReportedlyCuts17%Workforce
869 views
49 Discussing
8
#NFPWatch
11M views
19,625 Discussing
9
#NEARIntentsRecovers$3.8MAfterAttack
0 views
0 Discussing
10
#BlastToGraduallyShutDownItsL2Network
630 views
42 Discussing