
Crypto Adda Official
59 Posts

Crypto Adda Official
Report
Block User
Decoding charts and spotting multi-X gems before the crowd 📊✨ 10 years in crypto. Pure price action and discipline 🧠 Find me on X: BazaidRaza 🚀
1 Following
84 Followers
39 Liked
Posts
All
Quotes
·
--
Bullish
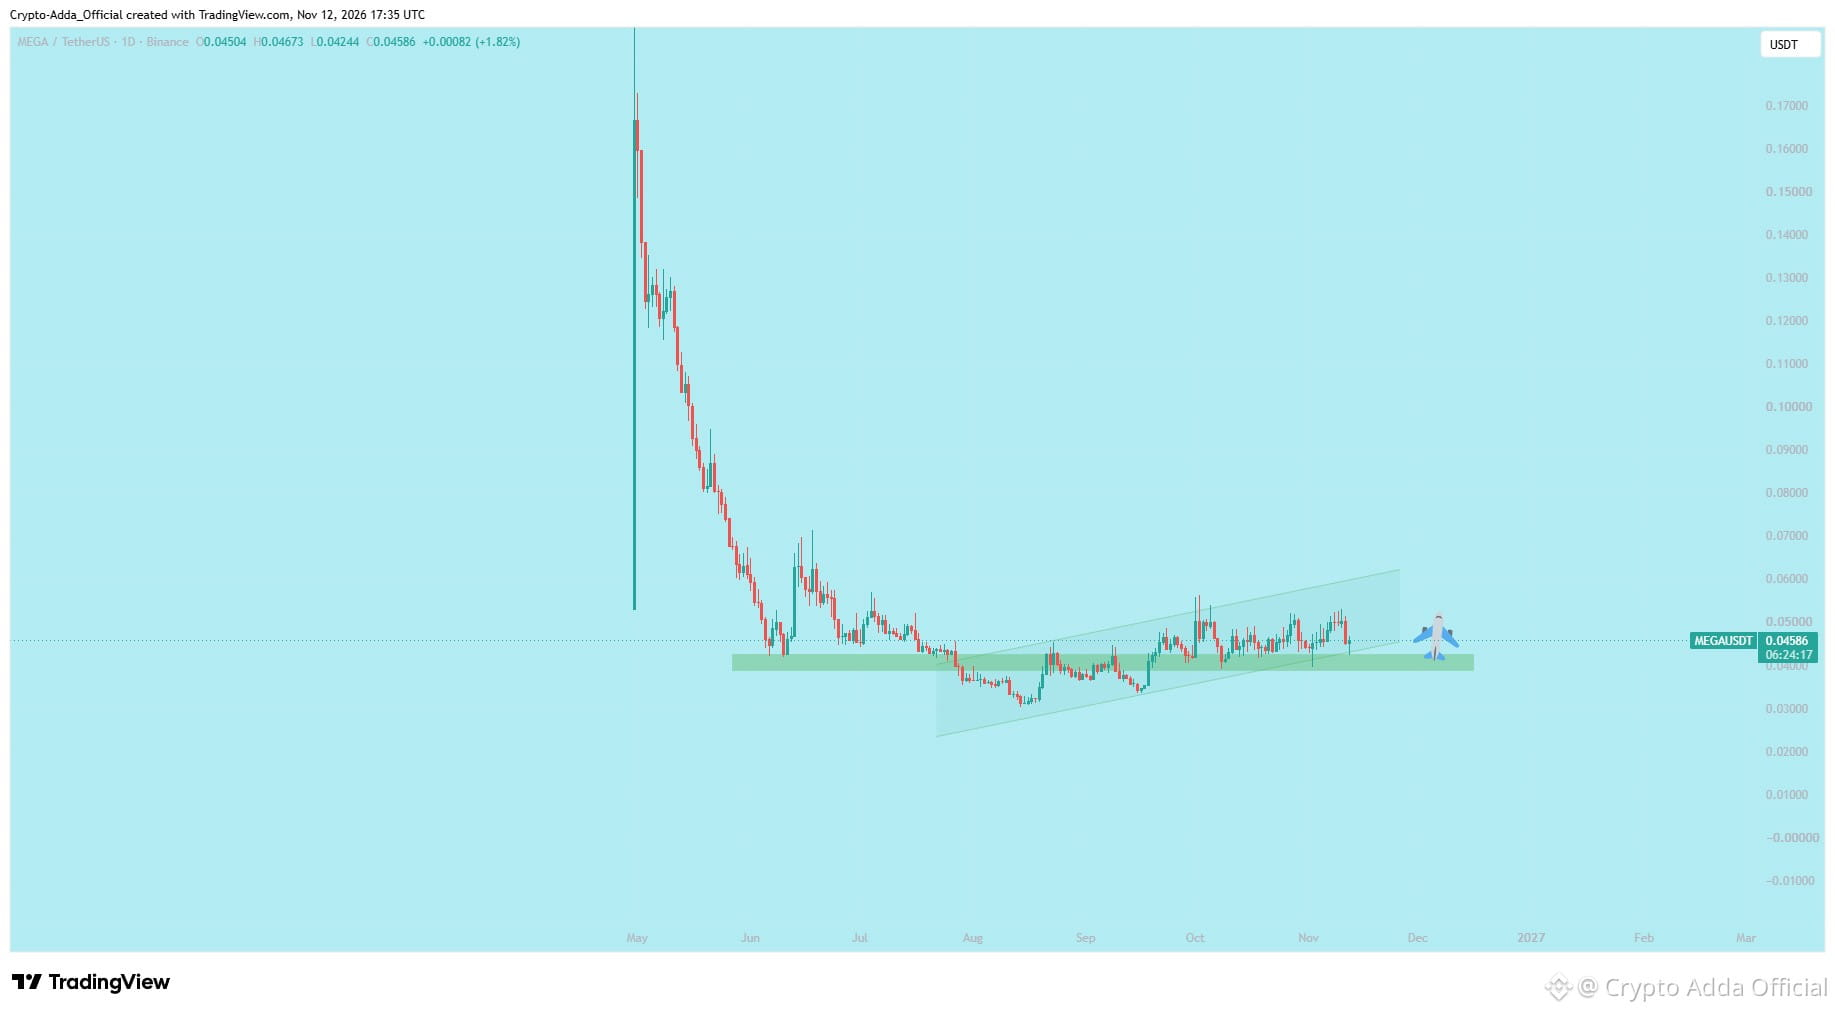
$MEGA /USDT daily chart technical breakdown! 📊 Price action is forming a bullish ascending channel right above a major green demand support zone around 0.040 to 0.045. 📈
• Clean accumulation pattern building up inside the channel structure
• Buyers actively defending the key support block and absorbing sell pressure
• Holding this zone sets up a powerful upward expansion phase
Patience and strict risk management are the keys to catching major moves. 🧠💎
Catch more chart breakdowns and community updates by checking my profile bio and finding me on X: BazaidRaza 🚀
$MAGMA $AGT #AGT #MAGMA #DODOX #play
$MEGA /USDT daily chart technical breakdown! 📊 Price action is forming a bullish ascending channel right above a major green demand support zone around 0.040 to 0.045. 📈
• Clean accumulation pattern building up inside the channel structure
• Buyers actively defending the key support block and absorbing sell pressure
• Holding this zone sets up a powerful upward expansion phase
Patience and strict risk management are the keys to catching major moves. 🧠💎
Catch more chart breakdowns and community updates by checking my profile bio and finding me on X: BazaidRaza 🚀
$MAGMA $AGT #AGT #MAGMA #DODOX #play
• Clean accumulation pattern building up inside the channel structure
• Buyers actively defending the key support block and absorbing sell pressure
• Holding this zone sets up a powerful upward expansion phase
Patience and strict risk management are the keys to catching major moves. 🧠💎
Catch more chart breakdowns and community updates by checking my profile bio and finding me on X: BazaidRaza 🚀
$MAGMA $AGT #AGT #MAGMA #DODOX #play
1
354
·
--
Bullish
$AIOT
{future}(AIOTUSDT)
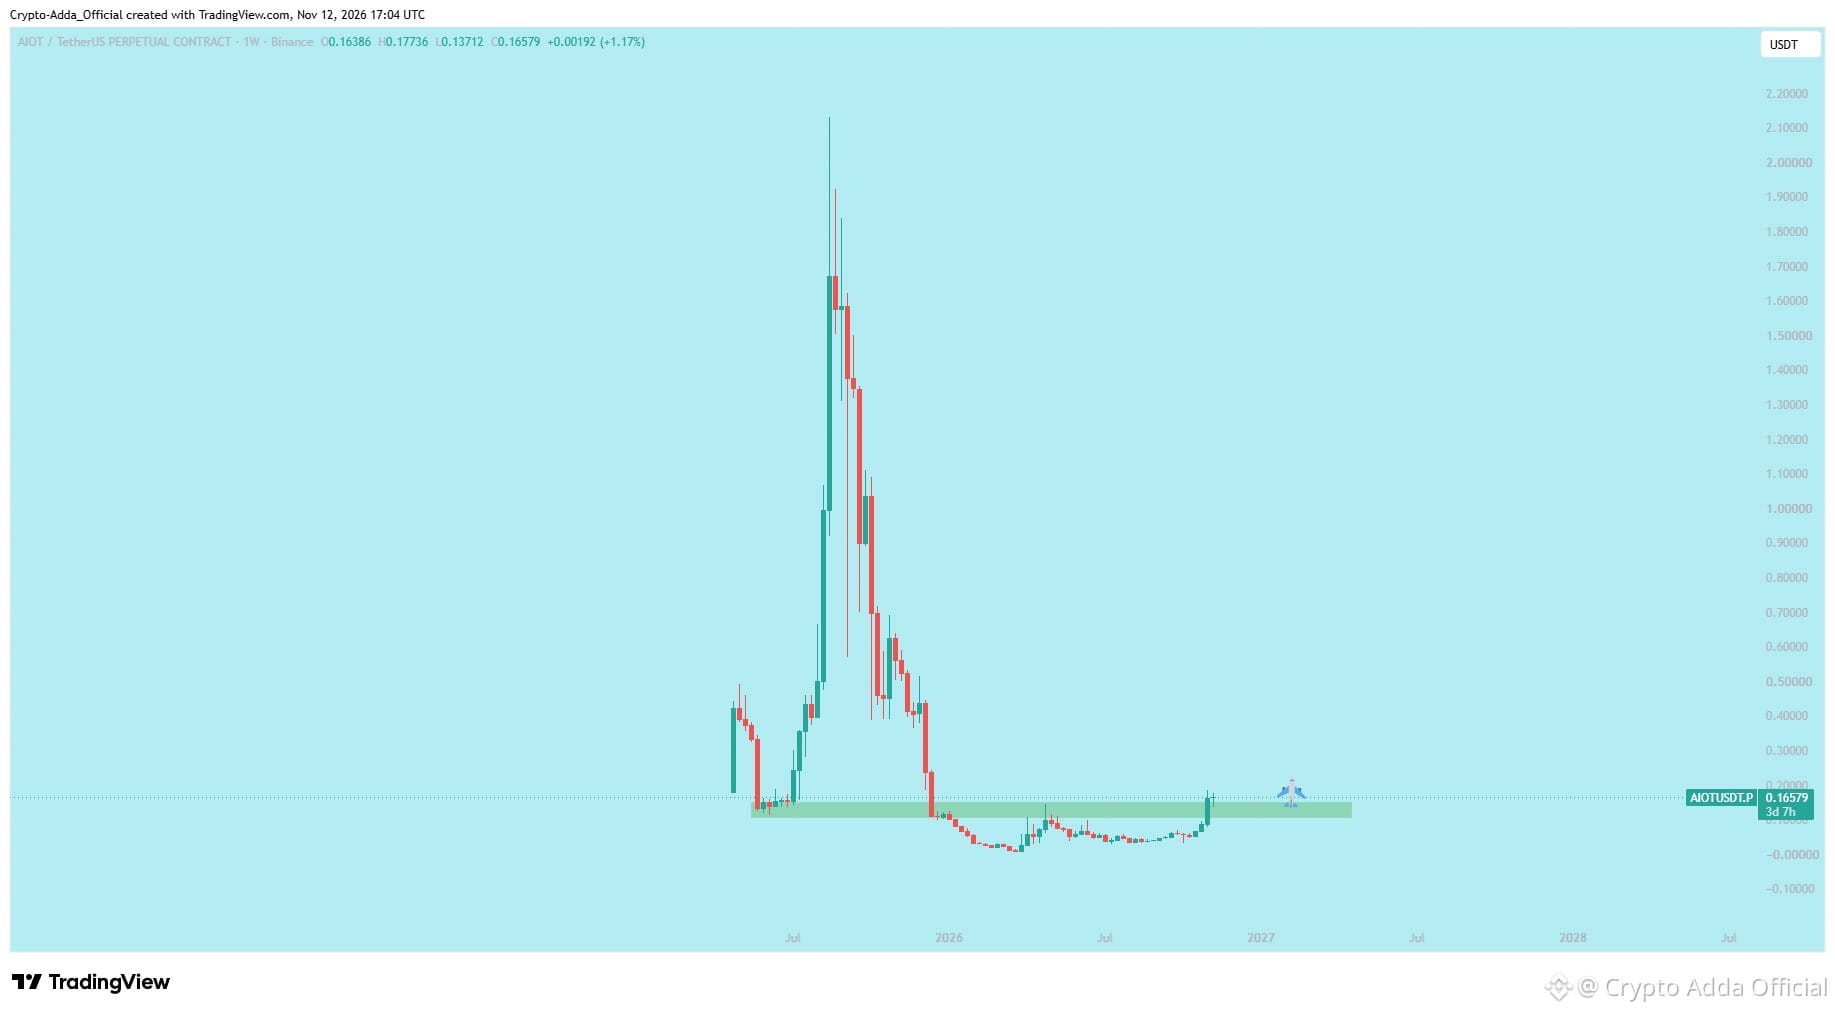
weekly chart analysis update! 📊 Price action is holding strong and building powerful momentum on the higher timeframe. 📈
• Clean technical structure with strong buyer interest
• Key moving averages and support zones respecting the plan
• Patience on weekly charts sets up massive potential expansions
Always manage your risk properly and let the market structure play out. 🧠💎
Catch more chart breakdowns and community updates by checking my profile bio and finding me on X: BazaidRaza 🚀
$AGT $MAGMA #Bard #AGT
$AIOT
weekly chart analysis update! 📊 Price action is holding strong and building powerful momentum on the higher timeframe. 📈
• Clean technical structure with strong buyer interest
• Key moving averages and support zones respecting the plan
• Patience on weekly charts sets up massive potential expansions
Always manage your risk properly and let the market structure play out. 🧠💎
Catch more chart breakdowns and community updates by checking my profile bio and finding me on X: BazaidRaza 🚀
$AGT $MAGMA #Bard #AGT
weekly chart analysis update! 📊 Price action is holding strong and building powerful momentum on the higher timeframe. 📈
• Clean technical structure with strong buyer interest
• Key moving averages and support zones respecting the plan
• Patience on weekly charts sets up massive potential expansions
Always manage your risk properly and let the market structure play out. 🧠💎
Catch more chart breakdowns and community updates by checking my profile bio and finding me on X: BazaidRaza 🚀
$AGT $MAGMA #Bard #AGT
1
530
$HANA
{future}(HANAUSDT)
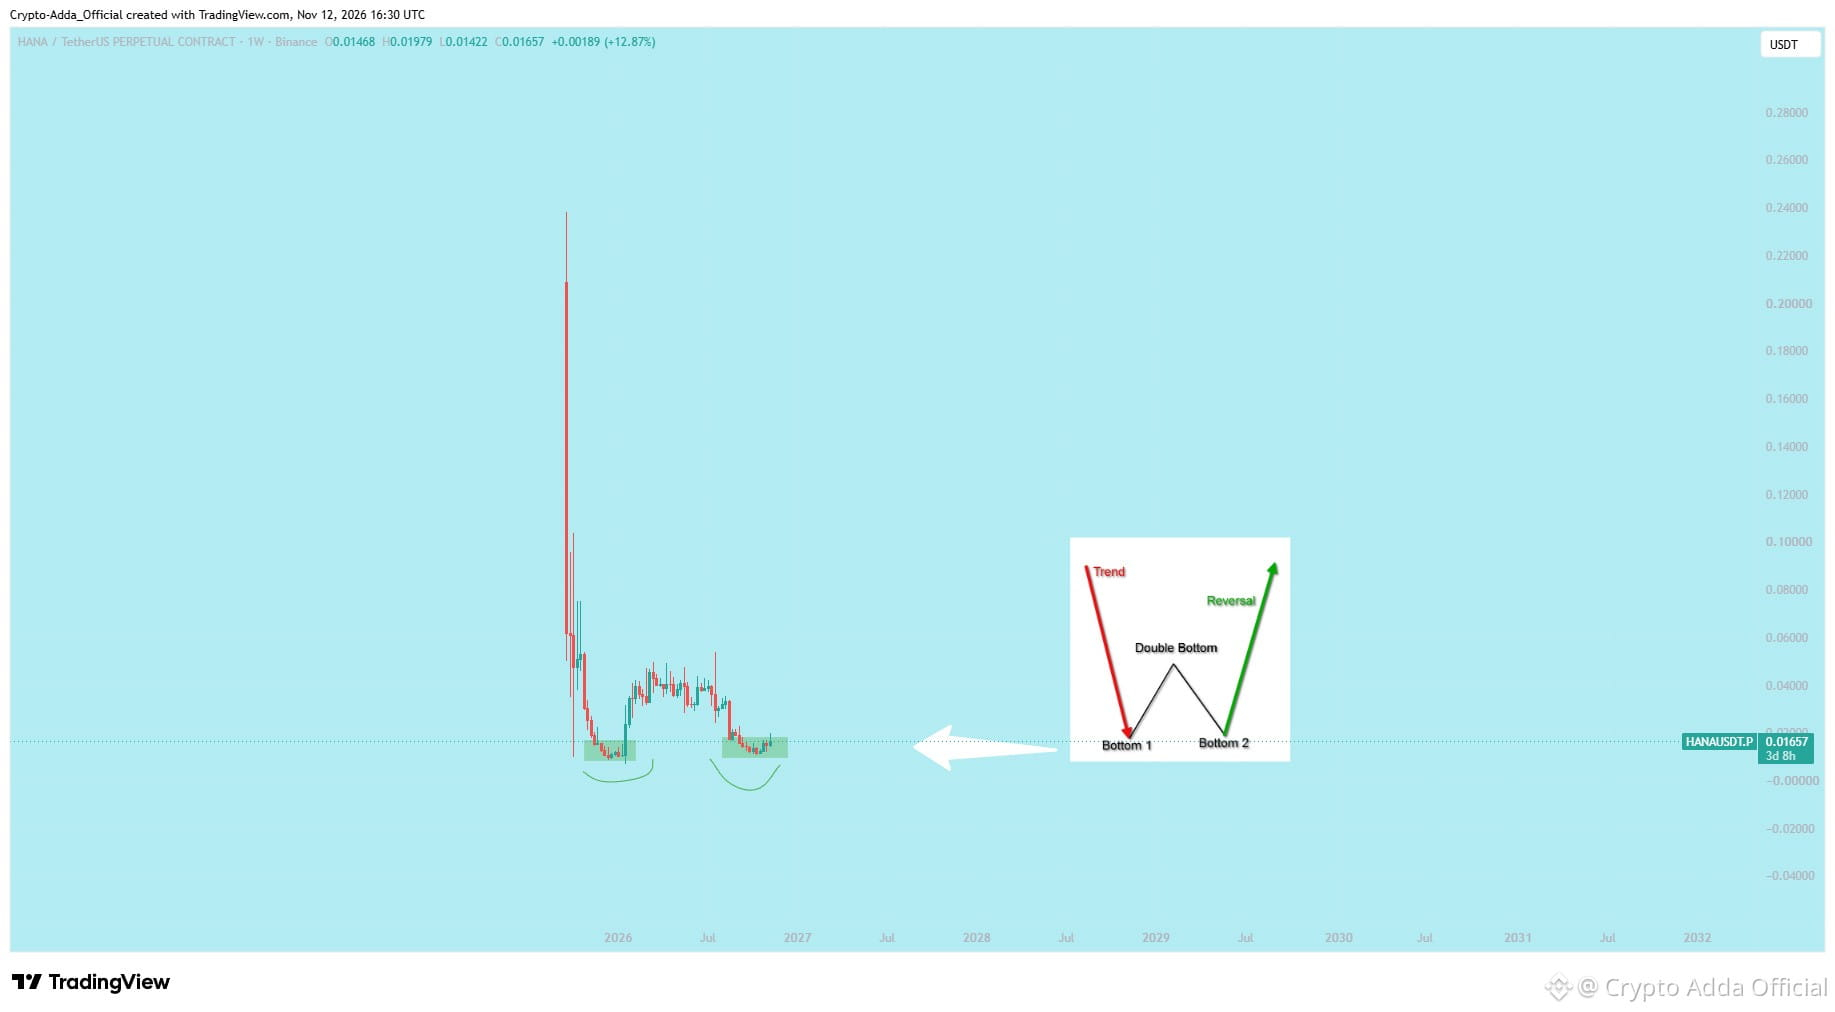
/USDT weekly chart update! 📊 Price is forming a textbook Double Bottom structure right inside a major demand zone at 0.014 to 0.017. 📈
• Two clean reactions at Bottom 1 and Bottom 2 showing solid buyer accumulation
• Higher timeframe momentum signaling potential trend reversal
• Holding this support zone keeps the bullish outlook intact
Patience on weekly charts pays the biggest rewards. Manage your risk properly.
🧠💎 Catch more chart breakdowns and community updates by checking my profile bio and finding me on X: BazaidRaza 🚀
$AGT $MAGMA #play #BTC #Binance
$HANA
/USDT weekly chart update! 📊 Price is forming a textbook Double Bottom structure right inside a major demand zone at 0.014 to 0.017. 📈
• Two clean reactions at Bottom 1 and Bottom 2 showing solid buyer accumulation
• Higher timeframe momentum signaling potential trend reversal
• Holding this support zone keeps the bullish outlook intact
Patience on weekly charts pays the biggest rewards. Manage your risk properly.
🧠💎 Catch more chart breakdowns and community updates by checking my profile bio and finding me on X: BazaidRaza 🚀
$AGT $MAGMA #play #BTC #Binance
/USDT weekly chart update! 📊 Price is forming a textbook Double Bottom structure right inside a major demand zone at 0.014 to 0.017. 📈
• Two clean reactions at Bottom 1 and Bottom 2 showing solid buyer accumulation
• Higher timeframe momentum signaling potential trend reversal
• Holding this support zone keeps the bullish outlook intact
Patience on weekly charts pays the biggest rewards. Manage your risk properly.
🧠💎 Catch more chart breakdowns and community updates by checking my profile bio and finding me on X: BazaidRaza 🚀
$AGT $MAGMA #play #BTC #Binance
1
613
·
--
Bullish
"It's just luck." — Until it happens for the 10th time. 🚨📈
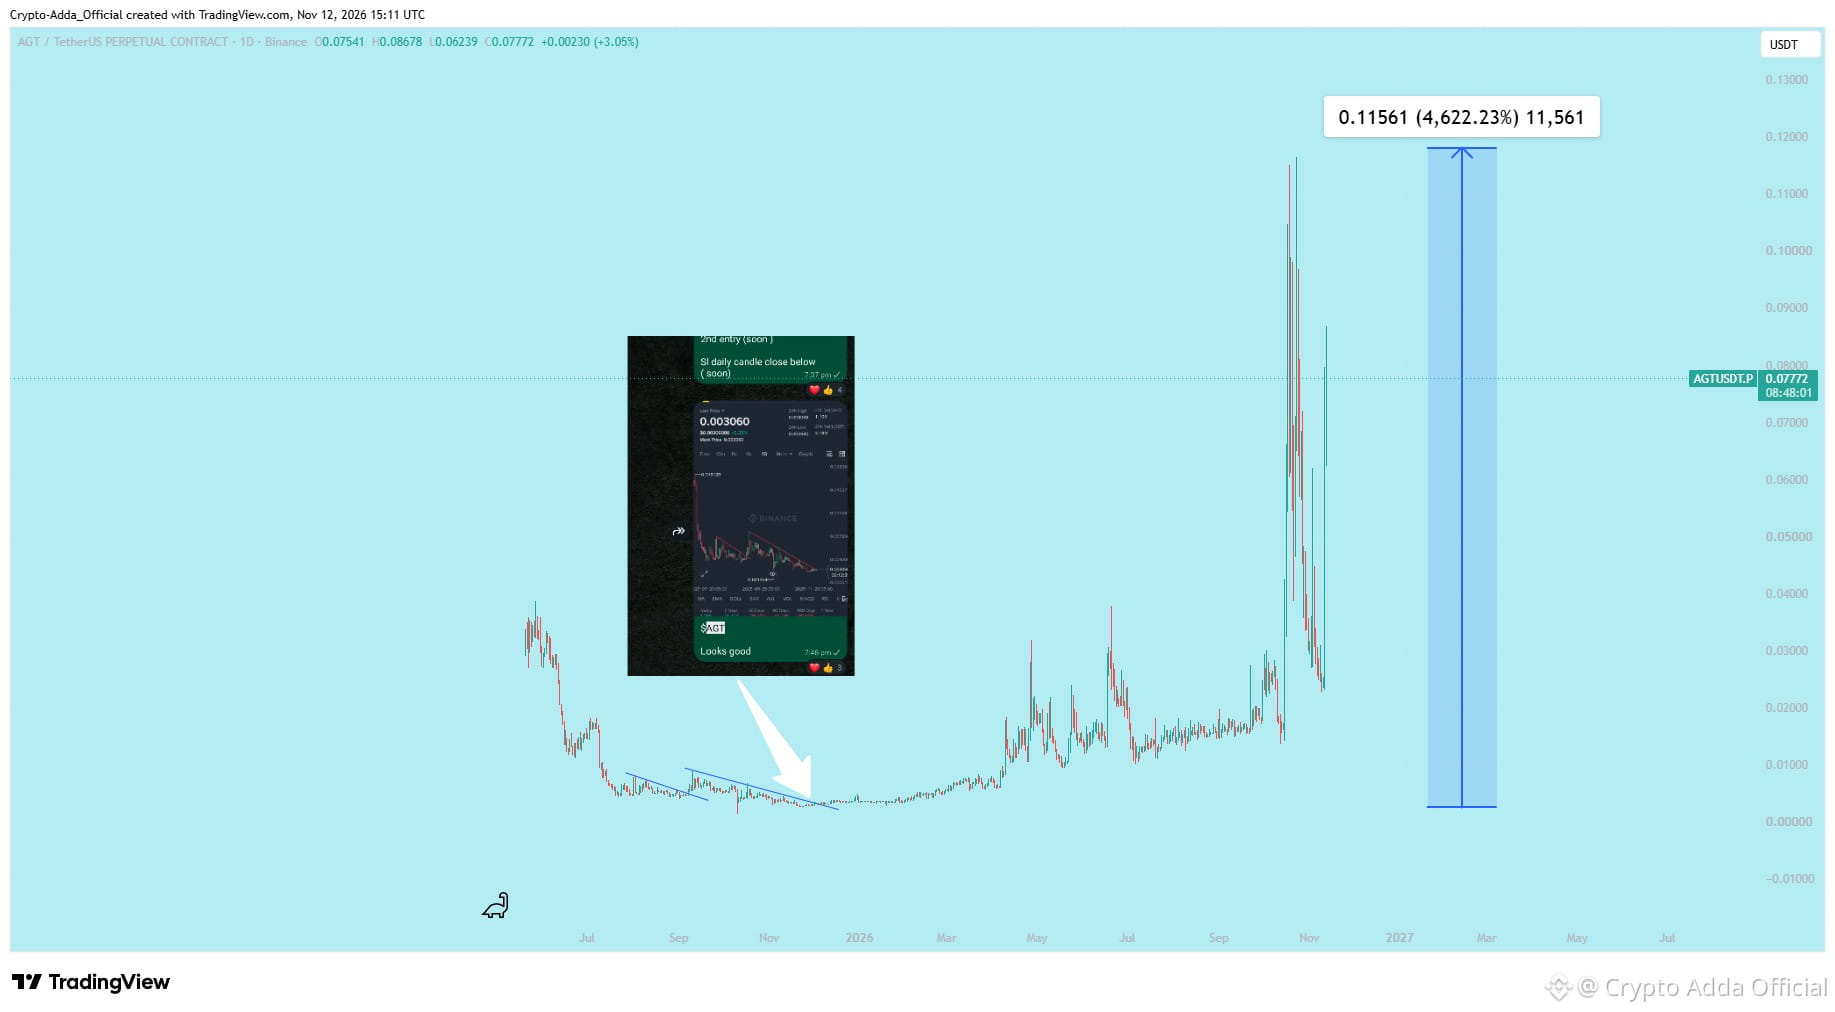
+4,622% on $AGT . Purely from our call zone. Luck doesn't repeat this consistently.
Master Position Sizing, Money Management, and Trade Management.
One single trade can change your life if you know how to hold it. 🔥
#AGT #Crypto #CryptoTrading #Altcoins #Binance
"It's just luck." — Until it happens for the 10th time. 🚨📈
+4,622% on $AGT . Purely from our call zone. Luck doesn't repeat this consistently.
Master Position Sizing, Money Management, and Trade Management.
One single trade can change your life if you know how to hold it. 🔥
#AGT #Crypto #CryptoTrading #Altcoins #Binance
+4,622% on $AGT . Purely from our call zone. Luck doesn't repeat this consistently.
Master Position Sizing, Money Management, and Trade Management.
One single trade can change your life if you know how to hold it. 🔥
#AGT #Crypto #CryptoTrading #Altcoins #Binance
9
4
2.6k
·
--
Bullish
$BTC
{spot}(BTCUSDT)
MACRO MARKET STRUCTURE UPDATE (1W) 📊
Here is a pure technical analysis of the current market structure on the weekly timeframe:
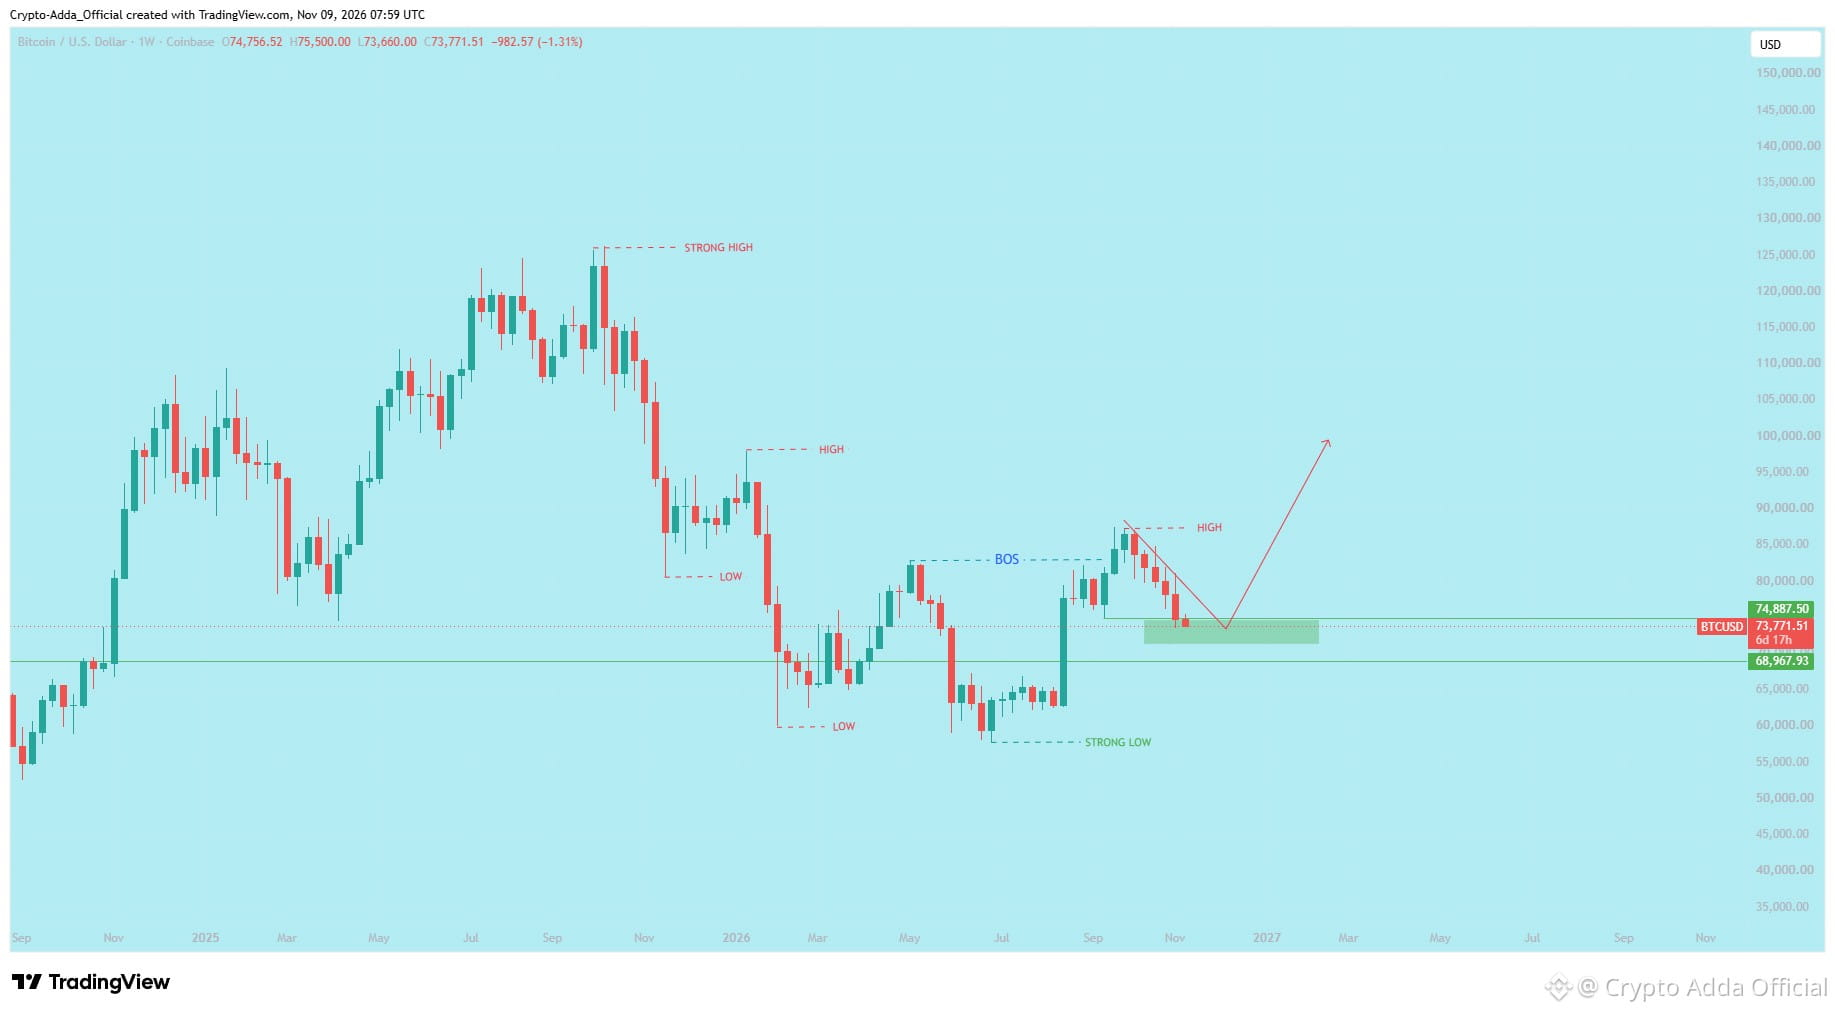
🔹 **Strong Low Established**
• The market protected the key demand baseline around **$58,000 – $60,000**, confirming a validated macro "Strong Low" backed by strong institutional absorption.
🔹 **Break of Structure (BOS)**
• Pushing cleanly above the prior major swing high (~$83,000) triggered a textbook weekly **Break of Structure (BOS)**, establishing a structural transition back to higher highs.
🔹 **Corrective Retest (Current Phase)**
• Following the local high above $88,000, the current pullback represents a controlled, corrective retracement rather than an impulsive distribution.
• Price is actively retesting the previous resistance-turned-support / primary weekly demand block at **$70,000 – $74,800**.
🔹 **Macro Trajectory**
• The structure is positioning for a macro **Higher Low** formation.
• As long as this primary demand shelf ($70,000 – $74,800) holds on a weekly closing basis, the bullish sequence remains technically intact, with the $100K+ psychological zone serving as the natural pathway for the next macro expansion.
*Pure market structure breakdown—tracking higher-timeframe price action.* 🧠✨ #bitcoin #eth
$BTC
MACRO MARKET STRUCTURE UPDATE (1W) 📊
Here is a pure technical analysis of the current market structure on the weekly timeframe:
🔹 **Strong Low Established**
• The market protected the key demand baseline around **$58,000 – $60,000**, confirming a validated macro "Strong Low" backed by strong institutional absorption.
🔹 **Break of Structure (BOS)**
• Pushing cleanly above the prior major swing high (~$83,000) triggered a textbook weekly **Break of Structure (BOS)**, establishing a structural transition back to higher highs.
🔹 **Corrective Retest (Current Phase)**
• Following the local high above $88,000, the current pullback represents a controlled, corrective retracement rather than an impulsive distribution.
• Price is actively retesting the previous resistance-turned-support / primary weekly demand block at **$70,000 – $74,800**.
🔹 **Macro Trajectory**
• The structure is positioning for a macro **Higher Low** formation.
• As long as this primary demand shelf ($70,000 – $74,800) holds on a weekly closing basis, the bullish sequence remains technically intact, with the $100K+ psychological zone serving as the natural pathway for the next macro expansion.
*Pure market structure breakdown—tracking higher-timeframe price action.* 🧠✨ #bitcoin #eth
MACRO MARKET STRUCTURE UPDATE (1W) 📊
Here is a pure technical analysis of the current market structure on the weekly timeframe:
🔹 **Strong Low Established**
• The market protected the key demand baseline around **$58,000 – $60,000**, confirming a validated macro "Strong Low" backed by strong institutional absorption.
🔹 **Break of Structure (BOS)**
• Pushing cleanly above the prior major swing high (~$83,000) triggered a textbook weekly **Break of Structure (BOS)**, establishing a structural transition back to higher highs.
🔹 **Corrective Retest (Current Phase)**
• Following the local high above $88,000, the current pullback represents a controlled, corrective retracement rather than an impulsive distribution.
• Price is actively retesting the previous resistance-turned-support / primary weekly demand block at **$70,000 – $74,800**.
🔹 **Macro Trajectory**
• The structure is positioning for a macro **Higher Low** formation.
• As long as this primary demand shelf ($70,000 – $74,800) holds on a weekly closing basis, the bullish sequence remains technically intact, with the $100K+ psychological zone serving as the natural pathway for the next macro expansion.
*Pure market structure breakdown—tracking higher-timeframe price action.* 🧠✨ #bitcoin #eth
61
·
--
Bullish
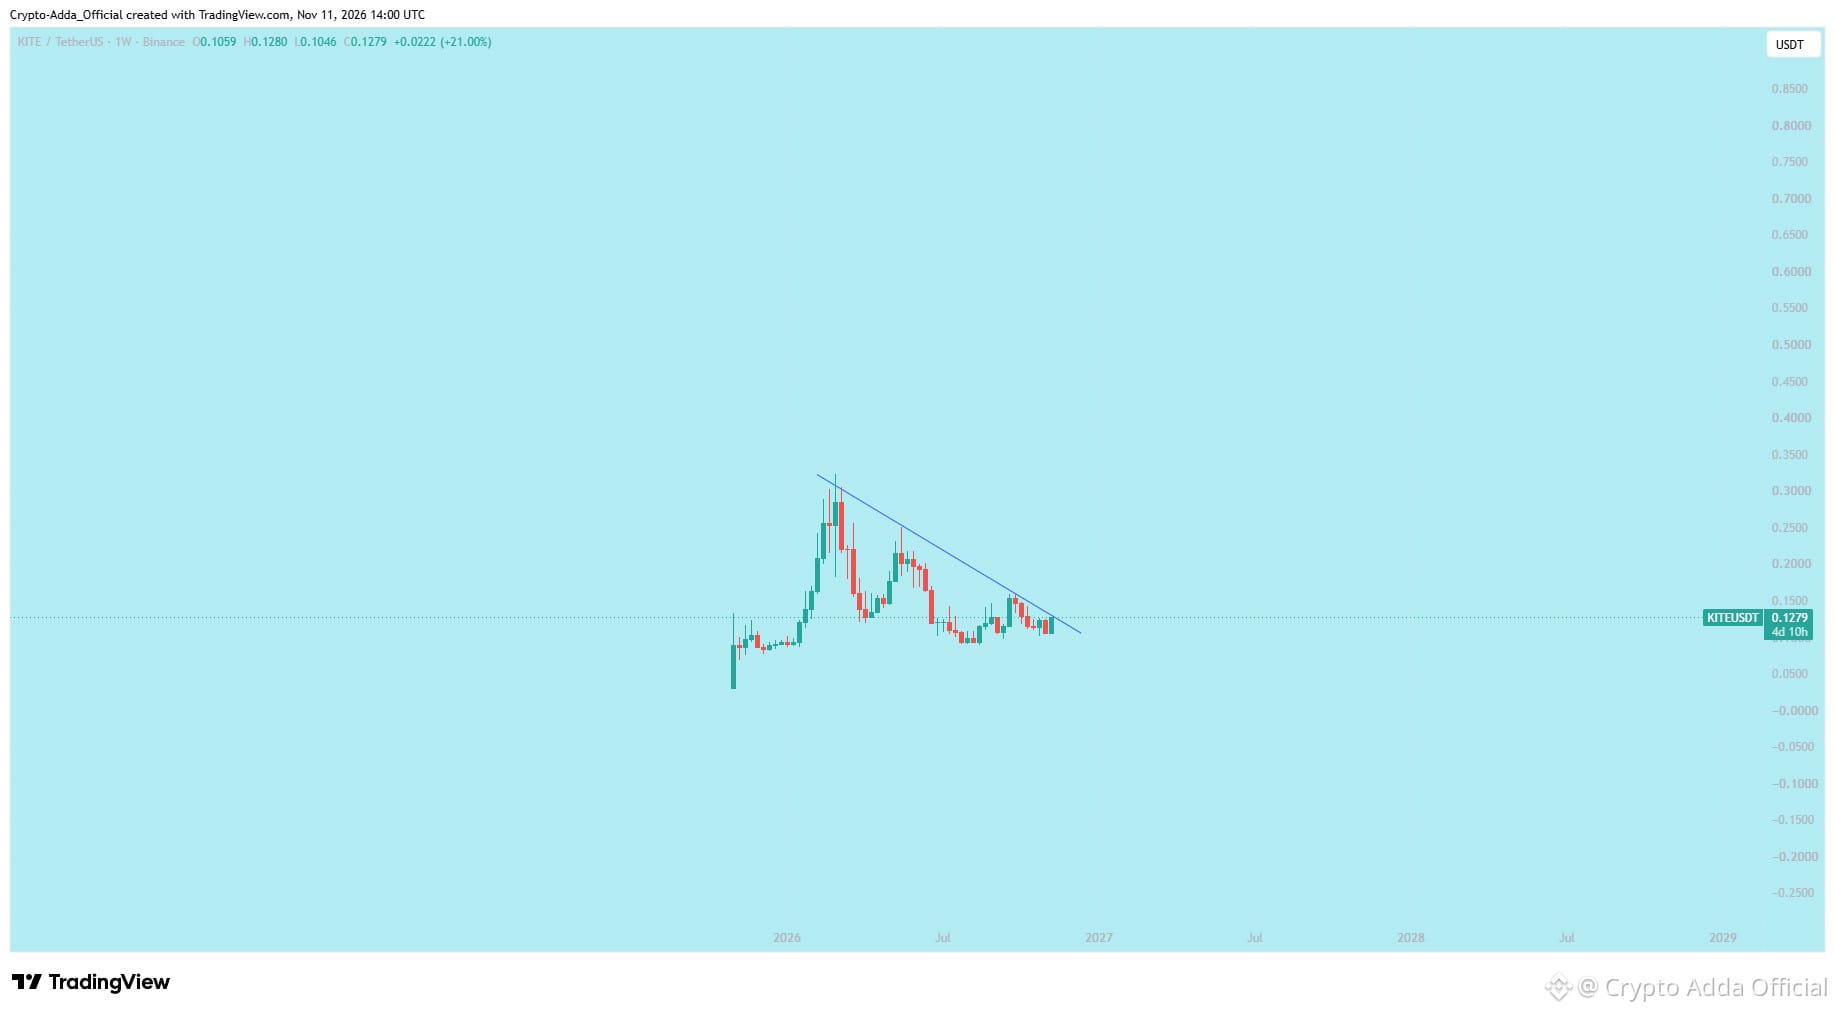
$KITE Descending Resistance Trendline Breakout on 1W Timeframe
#BTC #ETH #KİTE #CRYPTO #TradFiForBeginners
$KITE Descending Resistance Trendline Breakout on 1W Timeframe
#BTC #ETH #KİTE #CRYPTO #TradFiForBeginners
#BTC #ETH #KİTE #CRYPTO #TradFiForBeginners
135
·
--
Bullish
148
3
617
118
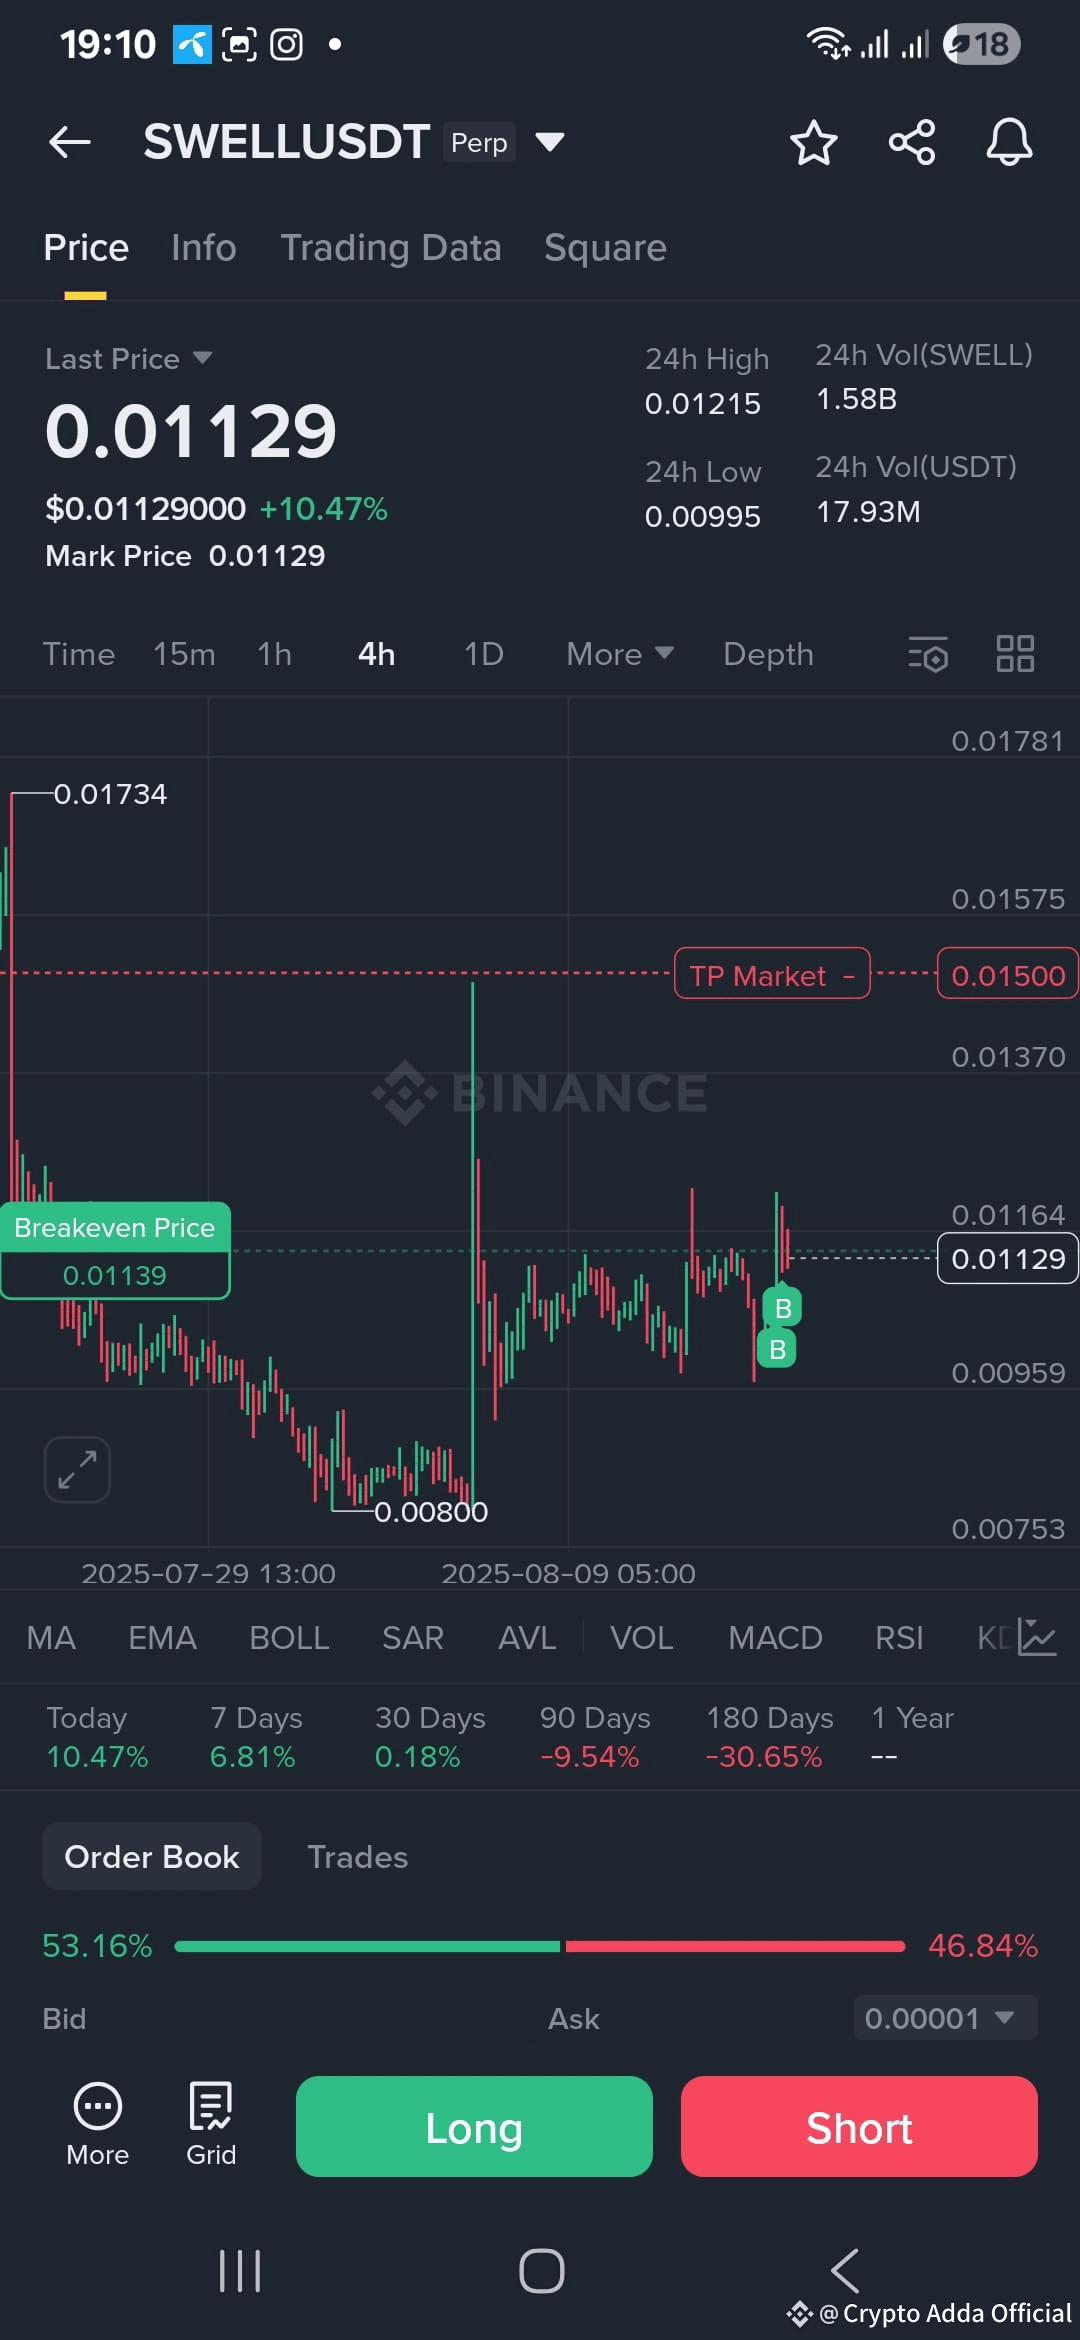
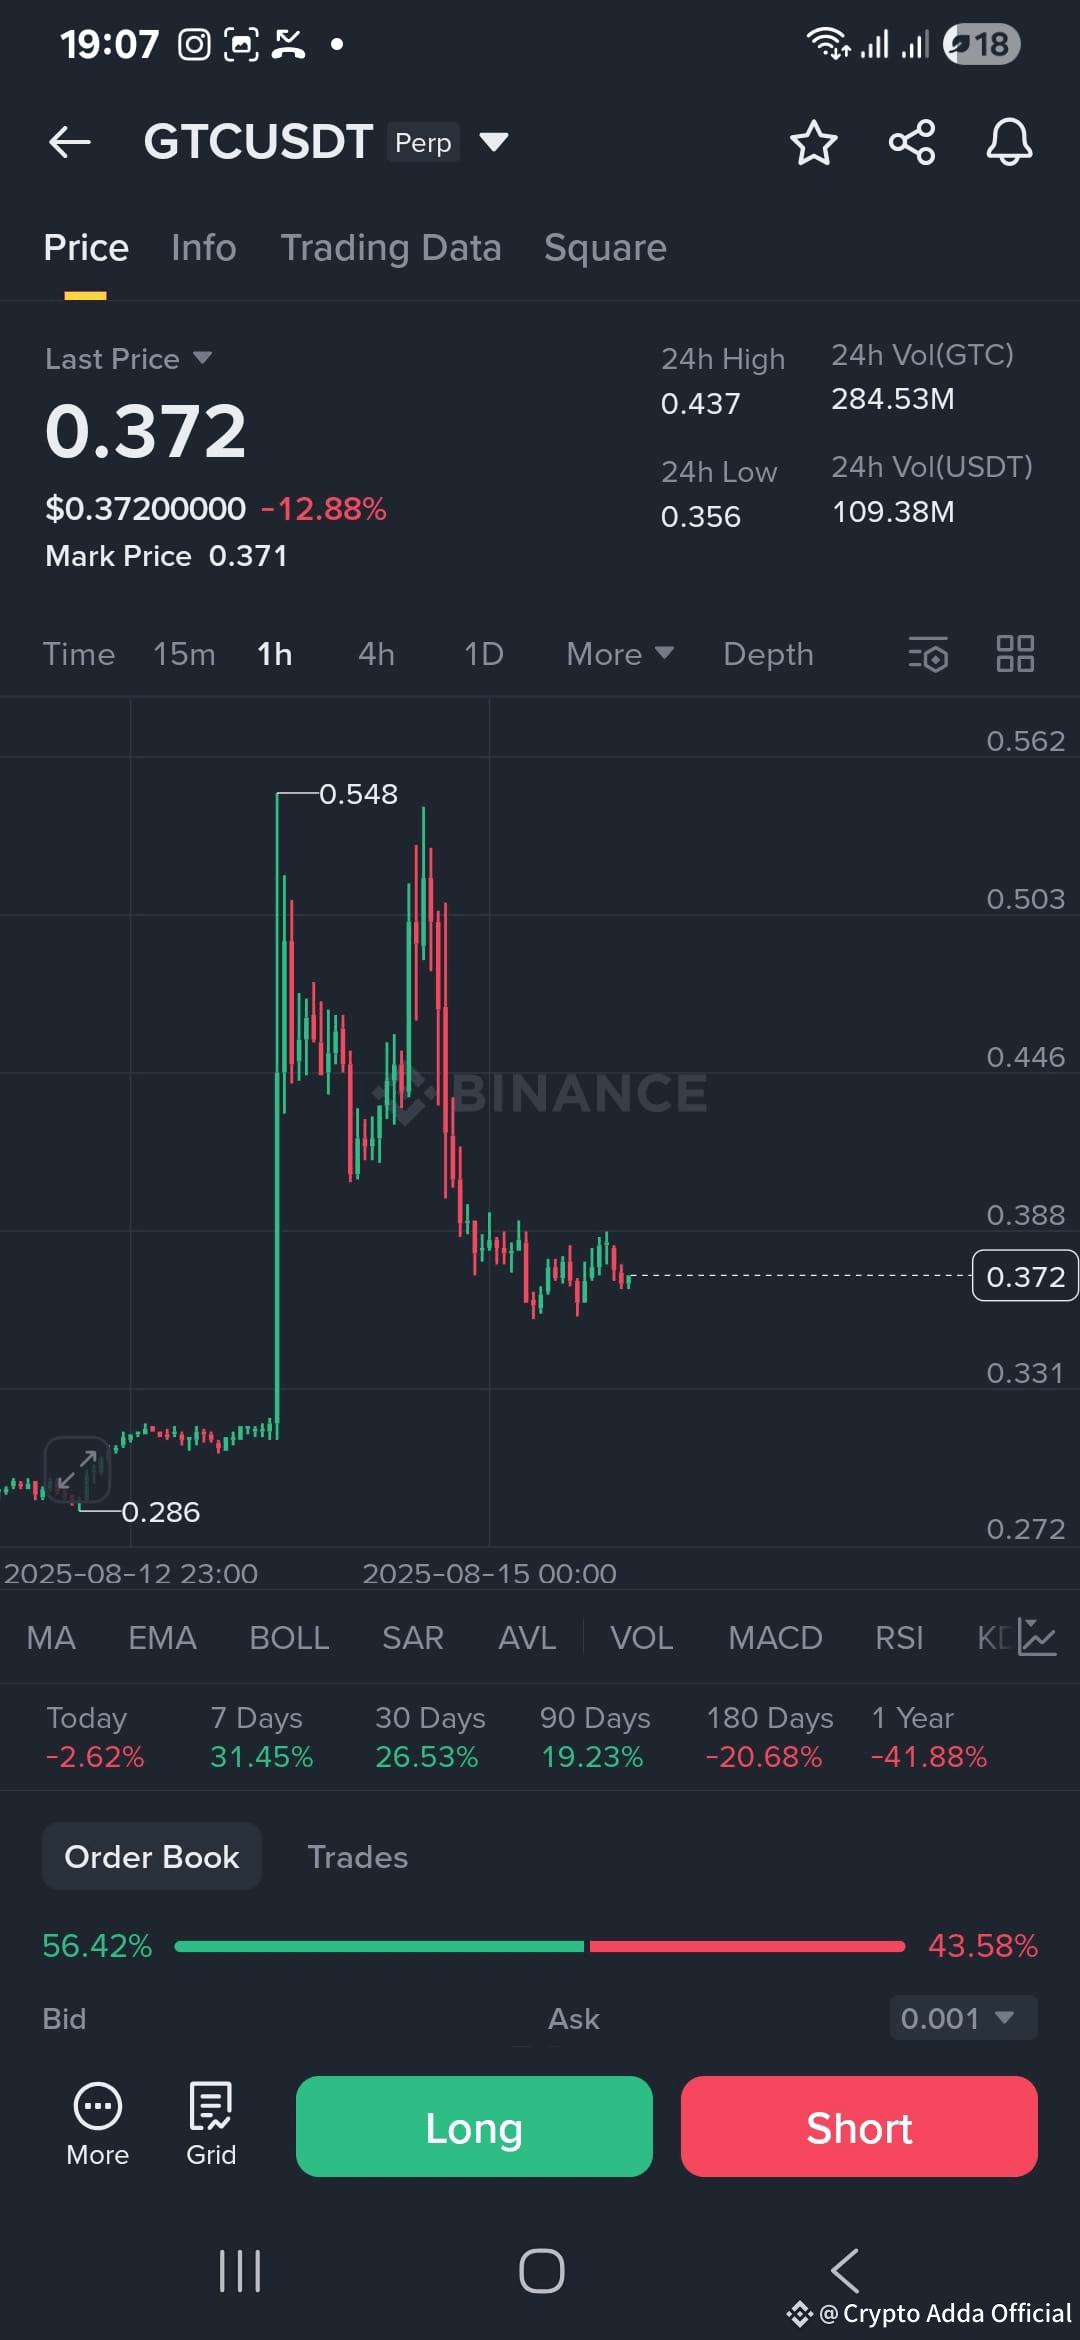
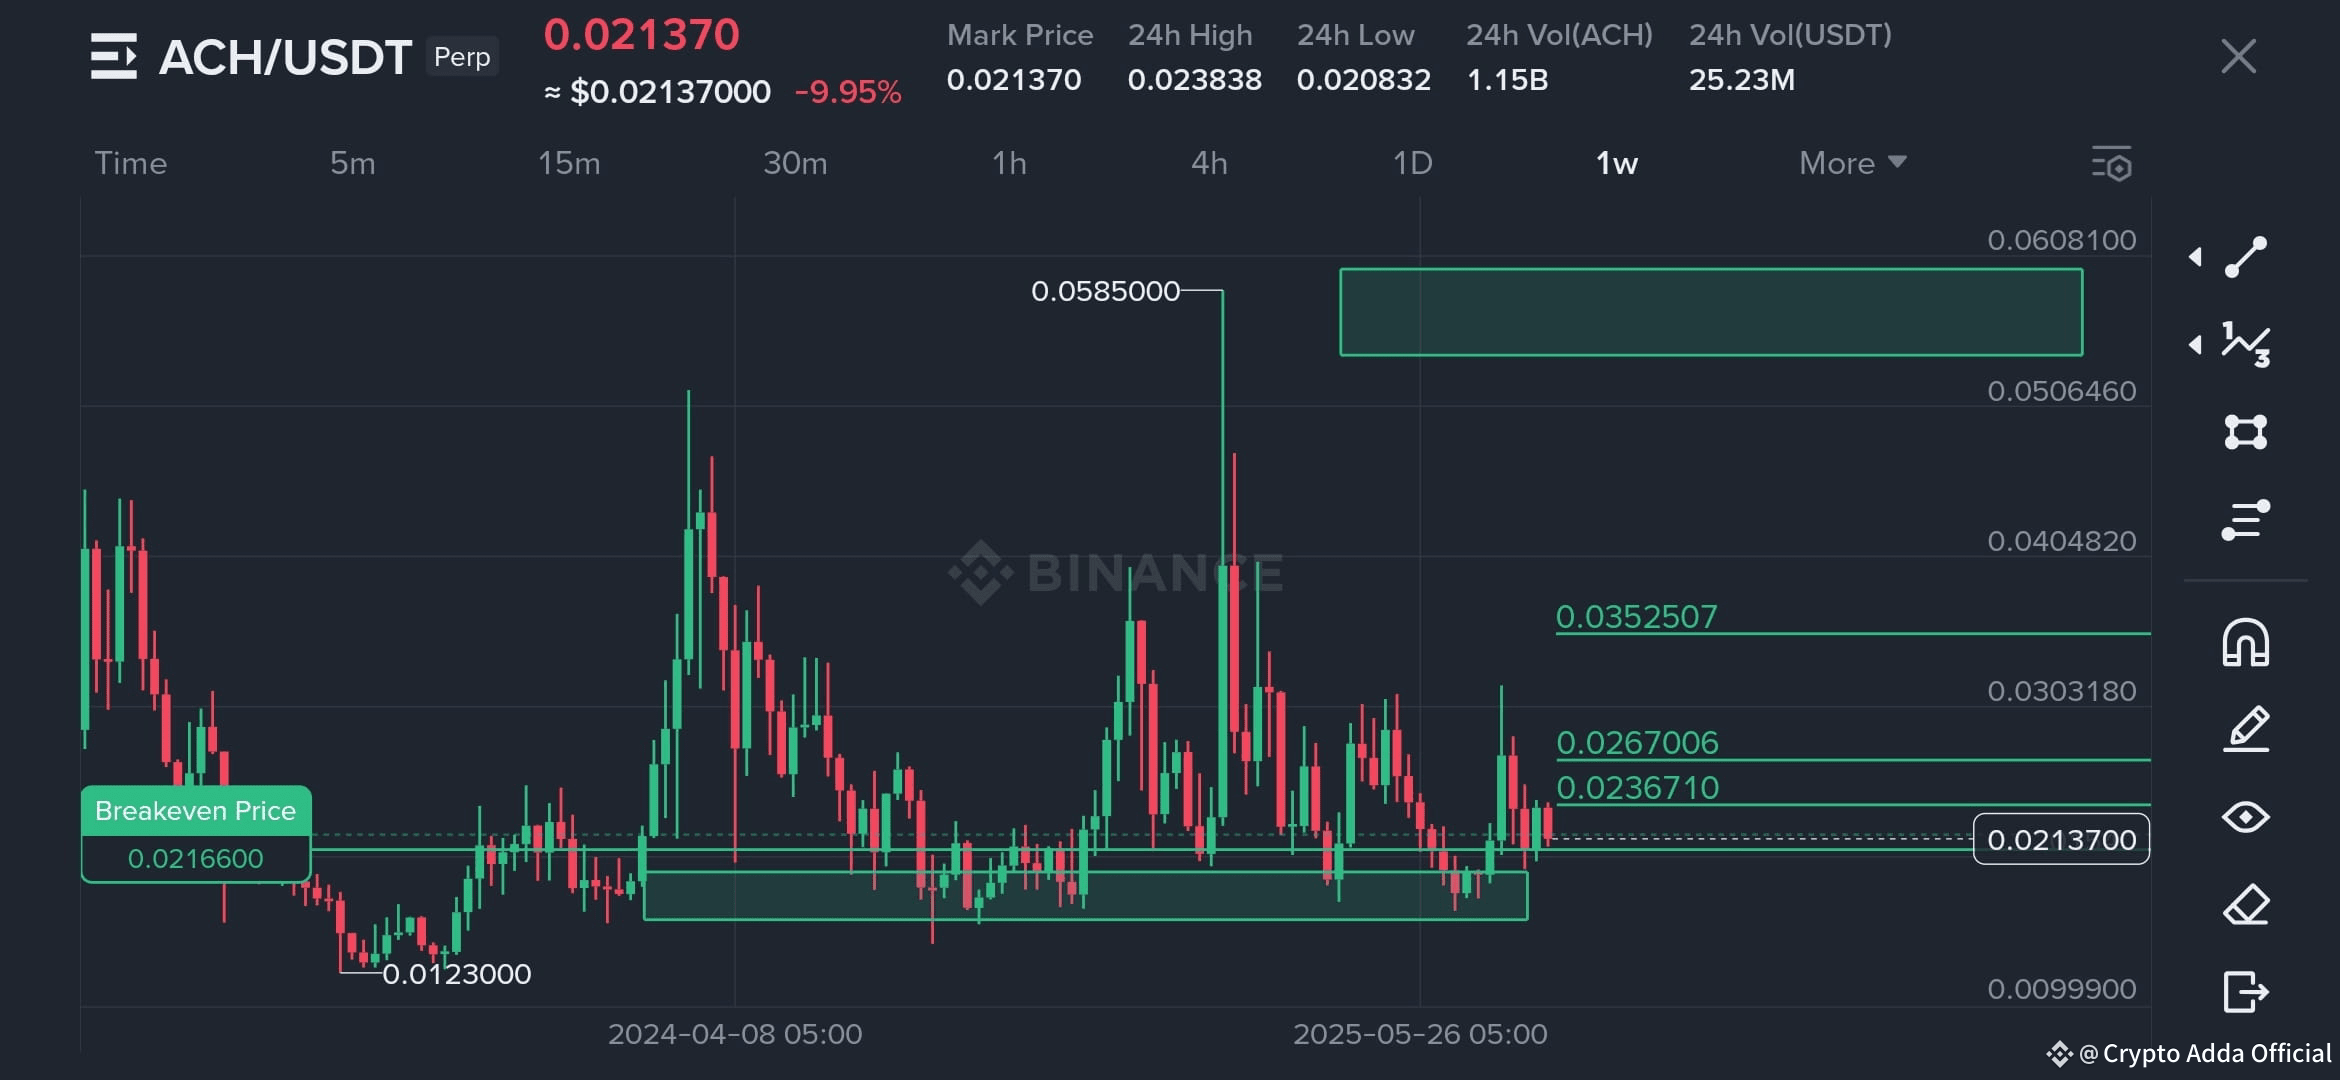
*$ACH Signal Alert!*
*Coin:* $ACH
*Trade Type* : Swing Spot & Futures
*Entry Points:*
1. CMP Price (Current Market Price)
2. Second Entry: Around $0.02
*Targets:*
Check the chart for detailed targets
*Final Target:* $0.04
#BTCBreaksATH #ETHRally #CPIWatch
*$ACH Signal Alert!*
*Coin:* $ACH
*Trade Type* : Swing Spot & Futures
*Entry Points:*
1. CMP Price (Current Market Price)
2. Second Entry: Around $0.02
*Targets:*
Check the chart for detailed targets
*Final Target:* $0.04
#BTCBreaksATH #ETHRally #CPIWatch
*Coin:* $ACH
*Trade Type* : Swing Spot & Futures
*Entry Points:*
1. CMP Price (Current Market Price)
2. Second Entry: Around $0.02
*Targets:*
Check the chart for detailed targets
*Final Target:* $0.04
#BTCBreaksATH #ETHRally #CPIWatch
442

·
--
Bullish

359
Log in to explore more content
Join global crypto users on Binance Square
⚡️ Get latest and useful information about crypto.
💬 Trusted by the world’s largest crypto exchange.
👍 Discover real insights from verified creators.
Email / Phone number
Trending Topics
HuangExitNvidiaStrategyInFocus
67,845 views
831 Discussing
STOCKS | Nvidia’s Jensen Huang Resigns, Colette Kress Named as Interim CEO
Binance News
·21 Likes
·31.4k views
AnthropicRejectsIPODelayValuationinQuestion
658,081 views
5,105 Discussing
BitMineReports$6.3BNetLossForFiscal2026
8,119 views
98 Discussing