
#vix
vix
61,888 views
230 Discussing
Hot
Latest

·
--
US Stocks | Knowledge Brief | September 10
# One-sentence takeaway on the VIX Fear Index: the market’s thermometer
If you go to the vegetable market: everyone grabs the cabbages (no matter how expensive, they cram them into the cages) = extreme greed; everyone hangs around at the entrance, watching and no one dares to go in = extreme fear.
The VIX (Volatility Index) is a thermometer that quantifies market sentiment.
It tells you: over the next 30 days, how much the S&P 500 is expected to move.
- Low VIX → the market is stable, calm seas
- High VIX → the market is tense, a storm is coming
# How is the VIX calculated?
The VIX doesn’t care about up/down moves; it’s based on options prices.
When panic hits, everyone rushes to buy Put “insurance” → Put prices spike → the VIX rises.
When things are peaceful and nobody buys insurance → the VIX falls.
In essence, the VIX measures how much the market is willing to pay for insurance.
# Key VIX thresholds (practical memory cues)
| VIX range | State | Practical meaning |
|---------|------|----------|
| < 12 | Extreme calm | A contrarian signal, near the top |
| 12-20 | Normal | A healthy uptrend |
| 20-30 | Caution | Panic sentiment is heating up |
| 30-40 | Clear panic | A bargain-hunting zone |
| > 40 | Extreme panic | On the level of 2008/2020 |
Iron rule:
- VIX > 30 + the broad market plunges sharply = usually a bottom (when others are afraid, I’m greedy)
- VIX < 12 + the broad market keeps rallying = beware of a pullback
- VIX spikes quickly = often accompanied by a black swan
# Tonight’s market temperature
Before the U.S. East Coast opens tonight (Beijing time), the VIX has already risen to 16.46, up +4.71% for the day, with a +14.9% gain over the past five days.
Meaning:
1. Ahead of the CPI release, the market held its breath—VIX reacted early
2. Nearly +15% over five days signals trend-like warming, not a one-day show
3. But 16.46 is still in the normal range—not yet at the panic moment
Memory cue: VIX watches the trend; the S&P watches the position
- VIX rising + S&P falling = true panic
- VIX rising + S&P choppy = uncertainty rising
- VIX rising + S&P also rising = a chaotic undertow
# VIX and Crypto: a shadow indicator of risk-off sentiment
Many people think BTC is a safe-haven asset. In fact, BTC is a high-beta version of the Nasdaq—its volatility is highly correlated with U.S. tech stocks.
Transmission chain:
Fed/Inflation → VIX → Nasdaq tech stocks → BTC (high-beta amplification)
Current data confirms:
- Nasdaq premarket -0.64%
- BTC 78311, -0.55% over 24h
- MSTR premarket -2.80%, COIN -2.36%
- IBIT (BTC ETF) +1.1% over 5 days, lagging on the short-term dip
So, in other words: if the VIX breaks through 17-18 tonight, BTC is likely to take another step down into the 77,000-77,500 range.
# Trading suggestions
## For U.S. stock players
1. Reduce exposure before earnings season for overvalued stocks: although META is up +6.55% after-hours, tonight’s CPI release may amplify the moves
2. SOXX semiconductor: +6.1% over 5 days—already deviating from moving averages; be cautious about chasing
3. When VIX > 20, hedge Nasdaq risk in batches with SQQQ
## For Crypto players
1. Tonight’s CPI is the key variable: if it comes in as more hawkish than expected, BTC could test 77,000; ETH looks at 2,350
2. Leveraged users must cut leverage: VIX volatility spikes + earnings season = a double hit to volatility
3. Spot traders: buy in batches—76,000 to 77,000 is strong support; place orders
4. Watch IBIT flows: net inflows of over $100 million for 3 straight days is a real signal of institutions entering with conviction
# Last note
The VIX isn’t a forecasting tool—it’s a sentiment thermometer. It tells you how tense the market is, but it can’t tell you direction.
Real trading discipline:
- VIX at 12-20 → hold with confidence
- VIX breaks above 25 → start to be alert
- VIX breaks above 30 → prepare to bargain-hunt
- VIX breaks above 40 → go all-in
Tonight’s watch items: CPI data + whether the VIX breaks above 17.
Lao Yi’s three-character VIX mantra: look at temperature, make decisions, don’t predict.
#美股 #VIX #BTC
US Stocks | Knowledge Brief | September 10
# One-sentence takeaway on the VIX Fear Index: the market’s thermometer
If you go to the vegetable market: everyone grabs the cabbages (no matter how expensive, they cram them into the cages) = extreme greed; everyone hangs around at the entrance, watching and no one dares to go in = extreme fear.
The VIX (Volatility Index) is a thermometer that quantifies market sentiment.
It tells you: over the next 30 days, how much the S&P 500 is expected to move.
- Low VIX → the market is stable, calm seas
- High VIX → the market is tense, a storm is coming
# How is the VIX calculated?
The VIX doesn’t care about up/down moves; it’s based on options prices.
When panic hits, everyone rushes to buy Put “insurance” → Put prices spike → the VIX rises.
When things are peaceful and nobody buys insurance → the VIX falls.
In essence, the VIX measures how much the market is willing to pay for insurance.
# Key VIX thresholds (practical memory cues)
| VIX range | State | Practical meaning |
|---------|------|----------|
| < 12 | Extreme calm | A contrarian signal, near the top |
| 12-20 | Normal | A healthy uptrend |
| 20-30 | Caution | Panic sentiment is heating up |
| 30-40 | Clear panic | A bargain-hunting zone |
| > 40 | Extreme panic | On the level of 2008/2020 |
Iron rule:
- VIX > 30 + the broad market plunges sharply = usually a bottom (when others are afraid, I’m greedy)
- VIX < 12 + the broad market keeps rallying = beware of a pullback
- VIX spikes quickly = often accompanied by a black swan
# Tonight’s market temperature
Before the U.S. East Coast opens tonight (Beijing time), the VIX has already risen to 16.46, up +4.71% for the day, with a +14.9% gain over the past five days.
Meaning:
1. Ahead of the CPI release, the market held its breath—VIX reacted early
2. Nearly +15% over five days signals trend-like warming, not a one-day show
3. But 16.46 is still in the normal range—not yet at the panic moment
Memory cue: VIX watches the trend; the S&P watches the position
- VIX rising + S&P falling = true panic
- VIX rising + S&P choppy = uncertainty rising
- VIX rising + S&P also rising = a chaotic undertow
# VIX and Crypto: a shadow indicator of risk-off sentiment
Many people think BTC is a safe-haven asset. In fact, BTC is a high-beta version of the Nasdaq—its volatility is highly correlated with U.S. tech stocks.
Transmission chain:
Fed/Inflation → VIX → Nasdaq tech stocks → BTC (high-beta amplification)
Current data confirms:
- Nasdaq premarket -0.64%
- BTC 78311, -0.55% over 24h
- MSTR premarket -2.80%, COIN -2.36%
- IBIT (BTC ETF) +1.1% over 5 days, lagging on the short-term dip
So, in other words: if the VIX breaks through 17-18 tonight, BTC is likely to take another step down into the 77,000-77,500 range.
# Trading suggestions
## For U.S. stock players
1. Reduce exposure before earnings season for overvalued stocks: although META is up +6.55% after-hours, tonight’s CPI release may amplify the moves
2. SOXX semiconductor: +6.1% over 5 days—already deviating from moving averages; be cautious about chasing
3. When VIX > 20, hedge Nasdaq risk in batches with SQQQ
## For Crypto players
1. Tonight’s CPI is the key variable: if it comes in as more hawkish than expected, BTC could test 77,000; ETH looks at 2,350
2. Leveraged users must cut leverage: VIX volatility spikes + earnings season = a double hit to volatility
3. Spot traders: buy in batches—76,000 to 77,000 is strong support; place orders
4. Watch IBIT flows: net inflows of over $100 million for 3 straight days is a real signal of institutions entering with conviction
# Last note
The VIX isn’t a forecasting tool—it’s a sentiment thermometer. It tells you how tense the market is, but it can’t tell you direction.
Real trading discipline:
- VIX at 12-20 → hold with confidence
- VIX breaks above 25 → start to be alert
- VIX breaks above 30 → prepare to bargain-hunt
- VIX breaks above 40 → go all-in
Tonight’s watch items: CPI data + whether the VIX breaks above 17.
Lao Yi’s three-character VIX mantra: look at temperature, make decisions, don’t predict.
#美股 #VIX #BTC
# One-sentence takeaway on the VIX Fear Index: the market’s thermometer
If you go to the vegetable market: everyone grabs the cabbages (no matter how expensive, they cram them into the cages) = extreme greed; everyone hangs around at the entrance, watching and no one dares to go in = extreme fear.
The VIX (Volatility Index) is a thermometer that quantifies market sentiment.
It tells you: over the next 30 days, how much the S&P 500 is expected to move.
- Low VIX → the market is stable, calm seas
- High VIX → the market is tense, a storm is coming
# How is the VIX calculated?
The VIX doesn’t care about up/down moves; it’s based on options prices.
When panic hits, everyone rushes to buy Put “insurance” → Put prices spike → the VIX rises.
When things are peaceful and nobody buys insurance → the VIX falls.
In essence, the VIX measures how much the market is willing to pay for insurance.
# Key VIX thresholds (practical memory cues)
| VIX range | State | Practical meaning |
|---------|------|----------|
| < 12 | Extreme calm | A contrarian signal, near the top |
| 12-20 | Normal | A healthy uptrend |
| 20-30 | Caution | Panic sentiment is heating up |
| 30-40 | Clear panic | A bargain-hunting zone |
| > 40 | Extreme panic | On the level of 2008/2020 |
Iron rule:
- VIX > 30 + the broad market plunges sharply = usually a bottom (when others are afraid, I’m greedy)
- VIX < 12 + the broad market keeps rallying = beware of a pullback
- VIX spikes quickly = often accompanied by a black swan
# Tonight’s market temperature
Before the U.S. East Coast opens tonight (Beijing time), the VIX has already risen to 16.46, up +4.71% for the day, with a +14.9% gain over the past five days.
Meaning:
1. Ahead of the CPI release, the market held its breath—VIX reacted early
2. Nearly +15% over five days signals trend-like warming, not a one-day show
3. But 16.46 is still in the normal range—not yet at the panic moment
Memory cue: VIX watches the trend; the S&P watches the position
- VIX rising + S&P falling = true panic
- VIX rising + S&P choppy = uncertainty rising
- VIX rising + S&P also rising = a chaotic undertow
# VIX and Crypto: a shadow indicator of risk-off sentiment
Many people think BTC is a safe-haven asset. In fact, BTC is a high-beta version of the Nasdaq—its volatility is highly correlated with U.S. tech stocks.
Transmission chain:
Fed/Inflation → VIX → Nasdaq tech stocks → BTC (high-beta amplification)
Current data confirms:
- Nasdaq premarket -0.64%
- BTC 78311, -0.55% over 24h
- MSTR premarket -2.80%, COIN -2.36%
- IBIT (BTC ETF) +1.1% over 5 days, lagging on the short-term dip
So, in other words: if the VIX breaks through 17-18 tonight, BTC is likely to take another step down into the 77,000-77,500 range.
# Trading suggestions
## For U.S. stock players
1. Reduce exposure before earnings season for overvalued stocks: although META is up +6.55% after-hours, tonight’s CPI release may amplify the moves
2. SOXX semiconductor: +6.1% over 5 days—already deviating from moving averages; be cautious about chasing
3. When VIX > 20, hedge Nasdaq risk in batches with SQQQ
## For Crypto players
1. Tonight’s CPI is the key variable: if it comes in as more hawkish than expected, BTC could test 77,000; ETH looks at 2,350
2. Leveraged users must cut leverage: VIX volatility spikes + earnings season = a double hit to volatility
3. Spot traders: buy in batches—76,000 to 77,000 is strong support; place orders
4. Watch IBIT flows: net inflows of over $100 million for 3 straight days is a real signal of institutions entering with conviction
# Last note
The VIX isn’t a forecasting tool—it’s a sentiment thermometer. It tells you how tense the market is, but it can’t tell you direction.
Real trading discipline:
- VIX at 12-20 → hold with confidence
- VIX breaks above 25 → start to be alert
- VIX breaks above 30 → prepare to bargain-hunt
- VIX breaks above 40 → go all-in
Tonight’s watch items: CPI data + whether the VIX breaks above 17.
Lao Yi’s three-character VIX mantra: look at temperature, make decisions, don’t predict.
#美股 #VIX #BTC
90

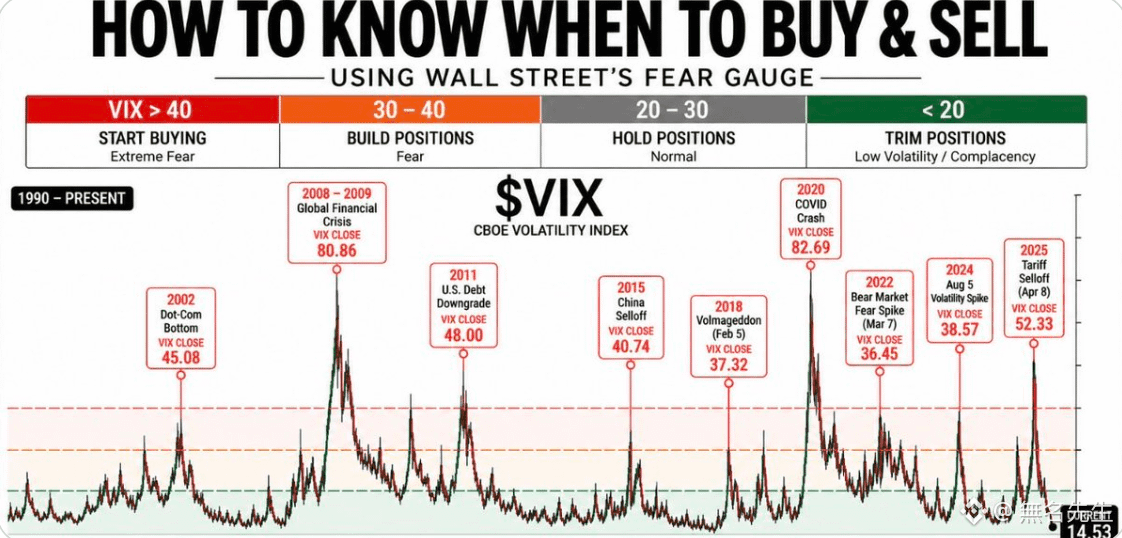

HISTORIC VOLATILITY COMPRESSION: $VIX REGISTERS LONGEST CALM STREAK SINCE 1992! 🚨 📊
Smart money recognizes that extreme volatility suppression is rarely permanent. $VIX has now consolidated between 14 and 17 for 25 consecutive sessions—a historical compression cycle not witnessed since May 1992. 🔍
With Thursday closing at 14.3 and zero -1% pullback sessions across broad benchmarks in 26 days, structural order flow is coiling into tight equilibrium. 📊 Historical data demonstrates that prolonged low-volatility regimes inevitably resolve in sharp liquidity expansion. 📌
Low volatility does not equate to zero risk—it signals quiet institutional positioning ahead of the next major expansion wave. 💬 Are you hedging your portfolio now, or waiting for the volatility expansion sweep? 👇
⚠️ Not financial advice. Always manage your risk. 🛡️
🏷️ #VIX #Macro #MarketStructure #Volatility #Trading
🔥 ⚖️
HISTORIC VOLATILITY COMPRESSION: $VIX REGISTERS LONGEST CALM STREAK SINCE 1992! 🚨 📊
Smart money recognizes that extreme volatility suppression is rarely permanent. $VIX has now consolidated between 14 and 17 for 25 consecutive sessions—a historical compression cycle not witnessed since May 1992. 🔍
With Thursday closing at 14.3 and zero -1% pullback sessions across broad benchmarks in 26 days, structural order flow is coiling into tight equilibrium. 📊 Historical data demonstrates that prolonged low-volatility regimes inevitably resolve in sharp liquidity expansion. 📌
Low volatility does not equate to zero risk—it signals quiet institutional positioning ahead of the next major expansion wave. 💬 Are you hedging your portfolio now, or waiting for the volatility expansion sweep? 👇
⚠️ Not financial advice. Always manage your risk. 🛡️
🏷️ #VIX #Macro #MarketStructure #Volatility #Trading
🔥 ⚖️
Smart money recognizes that extreme volatility suppression is rarely permanent. $VIX has now consolidated between 14 and 17 for 25 consecutive sessions—a historical compression cycle not witnessed since May 1992. 🔍
With Thursday closing at 14.3 and zero -1% pullback sessions across broad benchmarks in 26 days, structural order flow is coiling into tight equilibrium. 📊 Historical data demonstrates that prolonged low-volatility regimes inevitably resolve in sharp liquidity expansion. 📌
Low volatility does not equate to zero risk—it signals quiet institutional positioning ahead of the next major expansion wave. 💬 Are you hedging your portfolio now, or waiting for the volatility expansion sweep? 👇
⚠️ Not financial advice. Always manage your risk. 🛡️
🏷️ #VIX #Macro #MarketStructure #Volatility #Trading
🔥 ⚖️
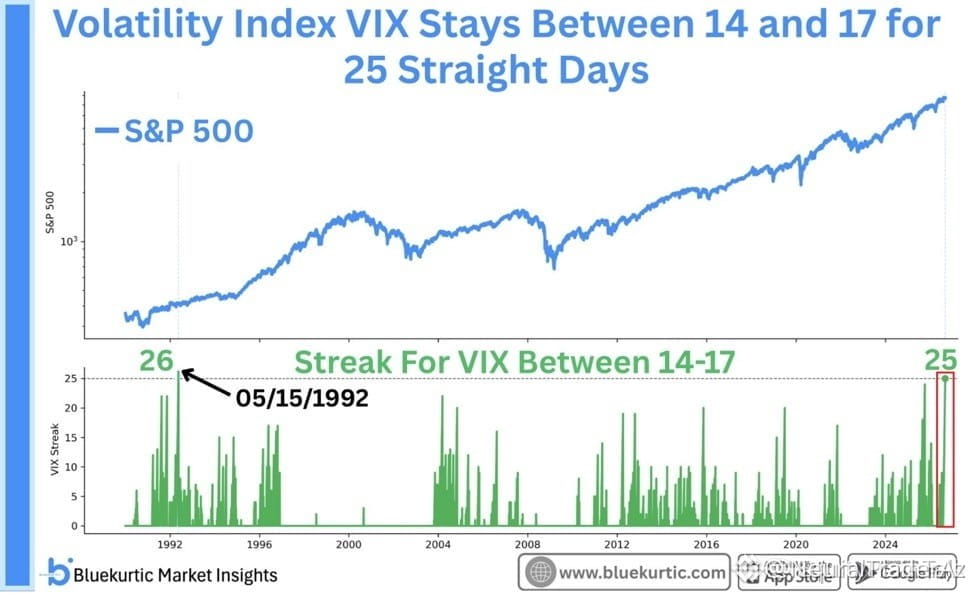
16

🚨 INSANE CALM BEFORE THE STORM AS $VIX CRASHES TO LOWS! 🌊
Equities are pulling off a historic low-volatility grind, with 22 straight sessions without even a 1% dip while $VIX sits crushed at 14.4. 📊 Nearly $12 trillion in market cap has poured back into the system, pushing indices within 1.5% of all-time highs as downside protection gets priced to zero.
Smart money knows these extended periods of artificial quiet can linger, but suppressing volatility this hard creates a massive pressure cooker. ⚡ When the market prices in zero risk, the first unexpected shock usually triggers a violent liquidity cascade into risk assets. 💡 How are you hedging your portfolio while the market pretends risk doesn't exist? 👇
⚠️ Not financial advice. Always manage your risk. 🛡️
🏷️ #VIX #Macro #Volatility #SP500 #Crypto
⚡ 🦈
🚨 INSANE CALM BEFORE THE STORM AS $VIX CRASHES TO LOWS! 🌊
Equities are pulling off a historic low-volatility grind, with 22 straight sessions without even a 1% dip while $VIX sits crushed at 14.4. 📊 Nearly $12 trillion in market cap has poured back into the system, pushing indices within 1.5% of all-time highs as downside protection gets priced to zero.
Smart money knows these extended periods of artificial quiet can linger, but suppressing volatility this hard creates a massive pressure cooker. ⚡ When the market prices in zero risk, the first unexpected shock usually triggers a violent liquidity cascade into risk assets. 💡 How are you hedging your portfolio while the market pretends risk doesn't exist? 👇
⚠️ Not financial advice. Always manage your risk. 🛡️
🏷️ #VIX #Macro #Volatility #SP500 #Crypto
⚡ 🦈
Equities are pulling off a historic low-volatility grind, with 22 straight sessions without even a 1% dip while $VIX sits crushed at 14.4. 📊 Nearly $12 trillion in market cap has poured back into the system, pushing indices within 1.5% of all-time highs as downside protection gets priced to zero.
Smart money knows these extended periods of artificial quiet can linger, but suppressing volatility this hard creates a massive pressure cooker. ⚡ When the market prices in zero risk, the first unexpected shock usually triggers a violent liquidity cascade into risk assets. 💡 How are you hedging your portfolio while the market pretends risk doesn't exist? 👇
⚠️ Not financial advice. Always manage your risk. 🛡️
🏷️ #VIX #Macro #Volatility #SP500 #Crypto
⚡ 🦈
36

·
--
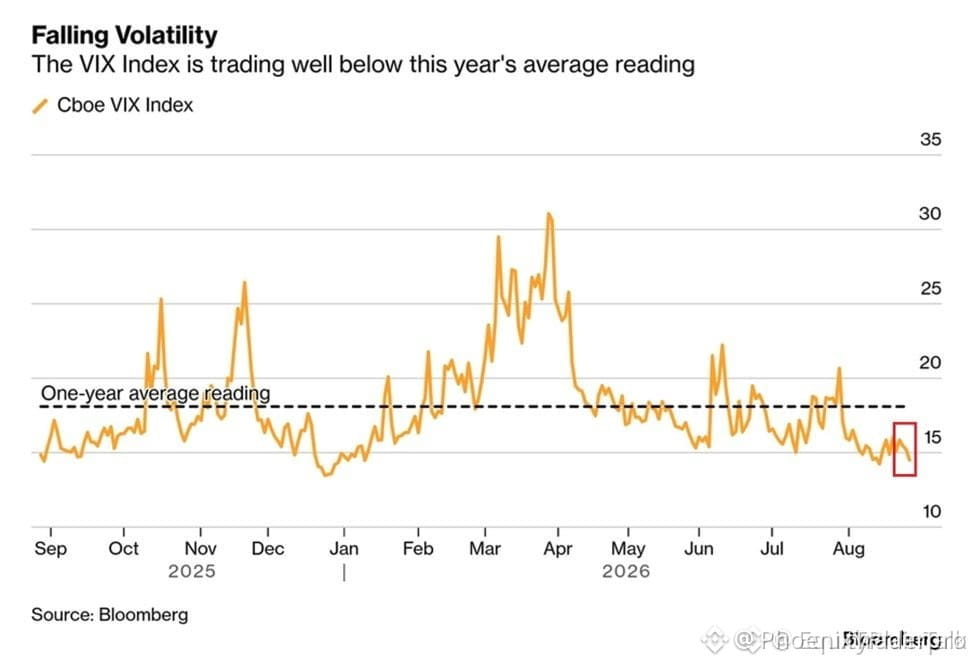
🚨 UNPRECEDENTED VOLATILITY COMPRESSION IN $VIX SIGNALS AN IMPENDING LIQUIDITY EXPANSION ⚡
Institutional order flow reflects extreme structural calm, with $VIX sitting at 14.4—nearly 20% below its yearly baseline. 📊 Market participants are pricing out immediate tail risk while smart money expands equity capitalization by $12 trillion off recent lows.
Extended periods of suppressed volatility traditionally precede aggressive liquidity hunts once structural complacency peaks. 💡 With indices holding within 1.5% of historical highs, this tight compression setting favors systematic positioning over chasing late momentum. 💬 Are you hedging against a volatility expansion or riding this structural grind higher? 👇
⚠️ Not financial advice. Always manage your risk. 🛡️
🏷️ #VIX #Macro #MarketStructure #Liquidity #Trading
🎯 🦈
🚨 UNPRECEDENTED VOLATILITY COMPRESSION IN $VIX SIGNALS AN IMPENDING LIQUIDITY EXPANSION ⚡
Institutional order flow reflects extreme structural calm, with $VIX sitting at 14.4—nearly 20% below its yearly baseline. 📊 Market participants are pricing out immediate tail risk while smart money expands equity capitalization by $12 trillion off recent lows.
Extended periods of suppressed volatility traditionally precede aggressive liquidity hunts once structural complacency peaks. 💡 With indices holding within 1.5% of historical highs, this tight compression setting favors systematic positioning over chasing late momentum. 💬 Are you hedging against a volatility expansion or riding this structural grind higher? 👇
⚠️ Not financial advice. Always manage your risk. 🛡️
🏷️ #VIX #Macro #MarketStructure #Liquidity #Trading
🎯 🦈
Institutional order flow reflects extreme structural calm, with $VIX sitting at 14.4—nearly 20% below its yearly baseline. 📊 Market participants are pricing out immediate tail risk while smart money expands equity capitalization by $12 trillion off recent lows.
Extended periods of suppressed volatility traditionally precede aggressive liquidity hunts once structural complacency peaks. 💡 With indices holding within 1.5% of historical highs, this tight compression setting favors systematic positioning over chasing late momentum. 💬 Are you hedging against a volatility expansion or riding this structural grind higher? 👇
⚠️ Not financial advice. Always manage your risk. 🛡️
🏷️ #VIX #Macro #MarketStructure #Liquidity #Trading
🎯 🦈
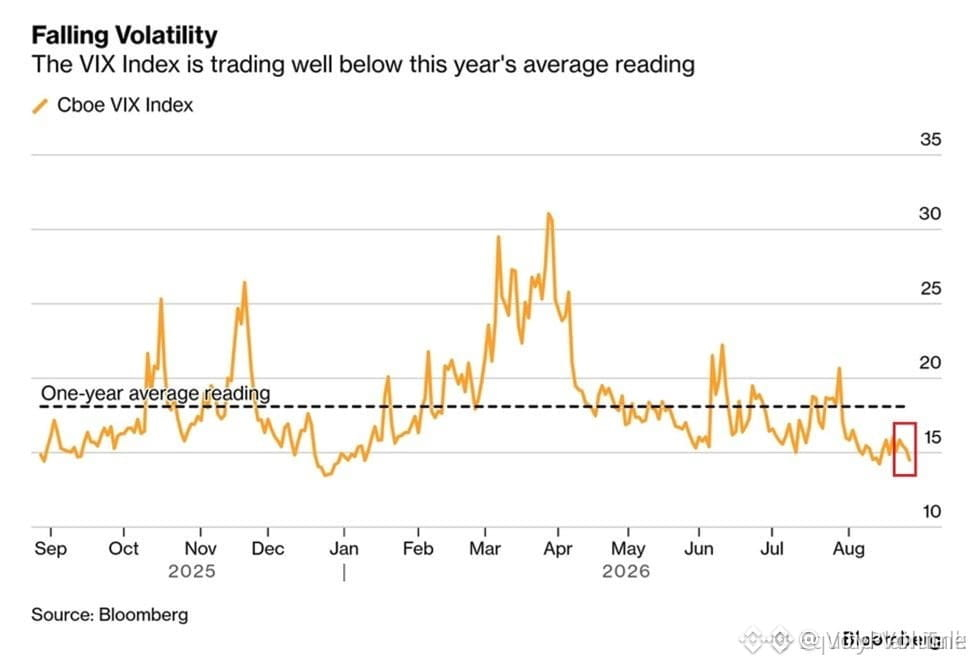
26


📈 Wall Street is already pricing in more volatility around the U.S. midterms.
The VIX futures curve is starting to steepen as traders prepare for potentially higher market volatility around the November U.S. midterm elections.
Current futures pricing:
September VIX: ~17.4
October VIX: ~19.0
November VIX: ~19.7
That upward curve suggests traders are already paying more for volatility protection around the election window.
Historical data adds another layer:
Since 1945, 80% of U.S. midterm-election years have recorded higher realized volatility than the previous year, with an average increase of around 3.5 volatility points.
When the White House and Congress are controlled by the same party, the average increase has been around 6 volatility points.
And with Nvidia earnings and the Fed’s Jackson Hole speech also dominating this week’s macro calendar, traders have plenty of reasons to keep their hedges close.
The market isn't necessarily saying “crash.”
It's saying:
“Maybe keep the seatbelt on.” 💀📈
Theo bạn, November volatility is being underpriced or are traders just over-hedging the election risk? 👀
#VIX #stocks #SP500 #Macro #trading
📈 Wall Street is already pricing in more volatility around the U.S. midterms.
The VIX futures curve is starting to steepen as traders prepare for potentially higher market volatility around the November U.S. midterm elections.
Current futures pricing:
September VIX: ~17.4
October VIX: ~19.0
November VIX: ~19.7
That upward curve suggests traders are already paying more for volatility protection around the election window.
Historical data adds another layer:
Since 1945, 80% of U.S. midterm-election years have recorded higher realized volatility than the previous year, with an average increase of around 3.5 volatility points.
When the White House and Congress are controlled by the same party, the average increase has been around 6 volatility points.
And with Nvidia earnings and the Fed’s Jackson Hole speech also dominating this week’s macro calendar, traders have plenty of reasons to keep their hedges close.
The market isn't necessarily saying “crash.”
It's saying:
“Maybe keep the seatbelt on.” 💀📈
Theo bạn, November volatility is being underpriced or are traders just over-hedging the election risk? 👀
#VIX #stocks #SP500 #Macro #trading
The VIX futures curve is starting to steepen as traders prepare for potentially higher market volatility around the November U.S. midterm elections.
Current futures pricing:
September VIX: ~17.4
October VIX: ~19.0
November VIX: ~19.7
That upward curve suggests traders are already paying more for volatility protection around the election window.
Historical data adds another layer:
Since 1945, 80% of U.S. midterm-election years have recorded higher realized volatility than the previous year, with an average increase of around 3.5 volatility points.
When the White House and Congress are controlled by the same party, the average increase has been around 6 volatility points.
And with Nvidia earnings and the Fed’s Jackson Hole speech also dominating this week’s macro calendar, traders have plenty of reasons to keep their hedges close.
The market isn't necessarily saying “crash.”
It's saying:
“Maybe keep the seatbelt on.” 💀📈
Theo bạn, November volatility is being underpriced or are traders just over-hedging the election risk? 👀
#VIX #stocks #SP500 #Macro #trading
40
·
--
US Stocks | Knowledge Session | August 19
VIX Fear Index: the market’s thermometer—today it quietly spikes
1. What is VIX?
VIX stands for the Volatility Index, published by the Chicago Board Options Exchange (CBOE). It measures the market’s expectation of volatility for the next 30 days of the S&P 500.
Think of it like this:
VIX is the market’s thermometer
The lower the VIX, the calmer the market is (normal body temperature)
The higher the VIX, the more panic the market shows (a high fever)
Normal body temperature range:
Below 15: extremely comfortable
15 to 20: healthy and steady (today’s close: 15.84)
20 to 30: start to feel anxious
30 to 40: real panic—2008 and 2020 were both in this range
Above 50: extreme panic—when the circuit breakers were triggered in March 2020, it surged to 82
2. How is VIX calculated?
VIX doesn’t care whether prices go up or down. It only reflects how violently people think things might move in the future.
If everyone is aggressively buying put options as crash insurance, the market will anticipate a big drop—and VIX will jump.
In simple terms: VIX equals the market’s “heat” of betting on whether something will go wrong tomorrow.
3. The relationship between VIX and stocks: a seesaw
VIX and the S&P 500 generally move in opposite directions:
When the stock market falls, VIX surges
When the stock market rises, VIX lies low
That’s why there are inverse VIX ETFs—people who bet that the market will keep falling buy them.
4. What today’s data tells us
As of the market close on August 18 (US Eastern Time):
Nasdaq -1.33% (tech shares hit hard)
Semiconductors SOXX -4.96% (NVDA -2.34%, AMD -4.27%, META -4.45%)
VIX +4.28%, climbing to 15.84
But the Fear Index’s 5-day cumulative increase is +8.9%, having been elevated for several straight days
This isn’t crash-level panic (not yet above 20), but it’s already the critical point where comfort switches into tension. The market is voting with money: volatility is likely to increase next.
5. What’s the connection between VIX and crypto?
Many people ignore an underlying thread:
When VIX rises, risk-off sentiment in US stocks strengthens. Funds leave high-volatility assets, putting short-term pressure on BTC and ETH.
However, since 2024, BTC has been charting an independent trend. In January 2024, when VIX spiked to 18, the BTC ETF saw $2 billion in net inflows for the week via IBIT. Spot BTC ETFs became a new risk-off “reservoir.”
Today is a perfect example:
US tech stocks broadly sell off—mining companies: MARA -7.82%, MSTR -5.28%
But spot BTC fell only 0.29%, while ETH actually rose +0.99%
IBIT was up +0.49% against the trend
This suggests BTC is decoupling from US tech stocks. When the Nasdaq is in panic, BTC doesn’t necessarily sell off in sync. Institutional capital treats BTC as a new asset-allocation tool—not as a follower of the Nasdaq.
6. Practical advice (crypto perspective)
1. If VIX breaks above 20 and keeps rising, reduce crypto leverage; spot holdings can be kept
2. If VIX breaks above 30, it’s a real bargain-hunting opportunity—historically, BTC has always bounced violently each time
3. If VIX drops to below 12, the market is overly optimistic—watch out for reverse indicators
4. Check VIX once a day first; it gives you a bigger-picture view than staring at candlestick charts
Today VIX = 15.84, in the warning zone but not the panic range. For action:
Spot BTC and ETH: continue to hold—no need to panic
Futures leverage: suggest reducing to below 3x
Key watch: tonight’s Nvidia earnings. If NVDA misses expectations, VIX could jump straight to 18–20
One-sentence summary:
VIX is the most easily overlooked—but most useful—indicator for retail investors. It’s not a tool for predicting stock prices; it’s a thermometer that tells you how panicked the market is. When the thermometer rises, you either put on more layers (reduce positions), or prepare food for winter (buy spot on dips).
#VIX #恐慌指数 #BTC
US Stocks | Knowledge Session | August 19
VIX Fear Index: the market’s thermometer—today it quietly spikes
1. What is VIX?
VIX stands for the Volatility Index, published by the Chicago Board Options Exchange (CBOE). It measures the market’s expectation of volatility for the next 30 days of the S&P 500.
Think of it like this:
VIX is the market’s thermometer
The lower the VIX, the calmer the market is (normal body temperature)
The higher the VIX, the more panic the market shows (a high fever)
Normal body temperature range:
Below 15: extremely comfortable
15 to 20: healthy and steady (today’s close: 15.84)
20 to 30: start to feel anxious
30 to 40: real panic—2008 and 2020 were both in this range
Above 50: extreme panic—when the circuit breakers were triggered in March 2020, it surged to 82
2. How is VIX calculated?
VIX doesn’t care whether prices go up or down. It only reflects how violently people think things might move in the future.
If everyone is aggressively buying put options as crash insurance, the market will anticipate a big drop—and VIX will jump.
In simple terms: VIX equals the market’s “heat” of betting on whether something will go wrong tomorrow.
3. The relationship between VIX and stocks: a seesaw
VIX and the S&P 500 generally move in opposite directions:
When the stock market falls, VIX surges
When the stock market rises, VIX lies low
That’s why there are inverse VIX ETFs—people who bet that the market will keep falling buy them.
4. What today’s data tells us
As of the market close on August 18 (US Eastern Time):
Nasdaq -1.33% (tech shares hit hard)
Semiconductors SOXX -4.96% (NVDA -2.34%, AMD -4.27%, META -4.45%)
VIX +4.28%, climbing to 15.84
But the Fear Index’s 5-day cumulative increase is +8.9%, having been elevated for several straight days
This isn’t crash-level panic (not yet above 20), but it’s already the critical point where comfort switches into tension. The market is voting with money: volatility is likely to increase next.
5. What’s the connection between VIX and crypto?
Many people ignore an underlying thread:
When VIX rises, risk-off sentiment in US stocks strengthens. Funds leave high-volatility assets, putting short-term pressure on BTC and ETH.
However, since 2024, BTC has been charting an independent trend. In January 2024, when VIX spiked to 18, the BTC ETF saw $2 billion in net inflows for the week via IBIT. Spot BTC ETFs became a new risk-off “reservoir.”
Today is a perfect example:
US tech stocks broadly sell off—mining companies: MARA -7.82%, MSTR -5.28%
But spot BTC fell only 0.29%, while ETH actually rose +0.99%
IBIT was up +0.49% against the trend
This suggests BTC is decoupling from US tech stocks. When the Nasdaq is in panic, BTC doesn’t necessarily sell off in sync. Institutional capital treats BTC as a new asset-allocation tool—not as a follower of the Nasdaq.
6. Practical advice (crypto perspective)
1. If VIX breaks above 20 and keeps rising, reduce crypto leverage; spot holdings can be kept
2. If VIX breaks above 30, it’s a real bargain-hunting opportunity—historically, BTC has always bounced violently each time
3. If VIX drops to below 12, the market is overly optimistic—watch out for reverse indicators
4. Check VIX once a day first; it gives you a bigger-picture view than staring at candlestick charts
Today VIX = 15.84, in the warning zone but not the panic range. For action:
Spot BTC and ETH: continue to hold—no need to panic
Futures leverage: suggest reducing to below 3x
Key watch: tonight’s Nvidia earnings. If NVDA misses expectations, VIX could jump straight to 18–20
One-sentence summary:
VIX is the most easily overlooked—but most useful—indicator for retail investors. It’s not a tool for predicting stock prices; it’s a thermometer that tells you how panicked the market is. When the thermometer rises, you either put on more layers (reduce positions), or prepare food for winter (buy spot on dips).
#VIX #恐慌指数 #BTC
VIX Fear Index: the market’s thermometer—today it quietly spikes
1. What is VIX?
VIX stands for the Volatility Index, published by the Chicago Board Options Exchange (CBOE). It measures the market’s expectation of volatility for the next 30 days of the S&P 500.
Think of it like this:
VIX is the market’s thermometer
The lower the VIX, the calmer the market is (normal body temperature)
The higher the VIX, the more panic the market shows (a high fever)
Normal body temperature range:
Below 15: extremely comfortable
15 to 20: healthy and steady (today’s close: 15.84)
20 to 30: start to feel anxious
30 to 40: real panic—2008 and 2020 were both in this range
Above 50: extreme panic—when the circuit breakers were triggered in March 2020, it surged to 82
2. How is VIX calculated?
VIX doesn’t care whether prices go up or down. It only reflects how violently people think things might move in the future.
If everyone is aggressively buying put options as crash insurance, the market will anticipate a big drop—and VIX will jump.
In simple terms: VIX equals the market’s “heat” of betting on whether something will go wrong tomorrow.
3. The relationship between VIX and stocks: a seesaw
VIX and the S&P 500 generally move in opposite directions:
When the stock market falls, VIX surges
When the stock market rises, VIX lies low
That’s why there are inverse VIX ETFs—people who bet that the market will keep falling buy them.
4. What today’s data tells us
As of the market close on August 18 (US Eastern Time):
Nasdaq -1.33% (tech shares hit hard)
Semiconductors SOXX -4.96% (NVDA -2.34%, AMD -4.27%, META -4.45%)
VIX +4.28%, climbing to 15.84
But the Fear Index’s 5-day cumulative increase is +8.9%, having been elevated for several straight days
This isn’t crash-level panic (not yet above 20), but it’s already the critical point where comfort switches into tension. The market is voting with money: volatility is likely to increase next.
5. What’s the connection between VIX and crypto?
Many people ignore an underlying thread:
When VIX rises, risk-off sentiment in US stocks strengthens. Funds leave high-volatility assets, putting short-term pressure on BTC and ETH.
However, since 2024, BTC has been charting an independent trend. In January 2024, when VIX spiked to 18, the BTC ETF saw $2 billion in net inflows for the week via IBIT. Spot BTC ETFs became a new risk-off “reservoir.”
Today is a perfect example:
US tech stocks broadly sell off—mining companies: MARA -7.82%, MSTR -5.28%
But spot BTC fell only 0.29%, while ETH actually rose +0.99%
IBIT was up +0.49% against the trend
This suggests BTC is decoupling from US tech stocks. When the Nasdaq is in panic, BTC doesn’t necessarily sell off in sync. Institutional capital treats BTC as a new asset-allocation tool—not as a follower of the Nasdaq.
6. Practical advice (crypto perspective)
1. If VIX breaks above 20 and keeps rising, reduce crypto leverage; spot holdings can be kept
2. If VIX breaks above 30, it’s a real bargain-hunting opportunity—historically, BTC has always bounced violently each time
3. If VIX drops to below 12, the market is overly optimistic—watch out for reverse indicators
4. Check VIX once a day first; it gives you a bigger-picture view than staring at candlestick charts
Today VIX = 15.84, in the warning zone but not the panic range. For action:
Spot BTC and ETH: continue to hold—no need to panic
Futures leverage: suggest reducing to below 3x
Key watch: tonight’s Nvidia earnings. If NVDA misses expectations, VIX could jump straight to 18–20
One-sentence summary:
VIX is the most easily overlooked—but most useful—indicator for retail investors. It’s not a tool for predicting stock prices; it’s a thermometer that tells you how panicked the market is. When the thermometer rises, you either put on more layers (reduce positions), or prepare food for winter (buy spot on dips).
#VIX #恐慌指数 #BTC
179

·
--
Bullish
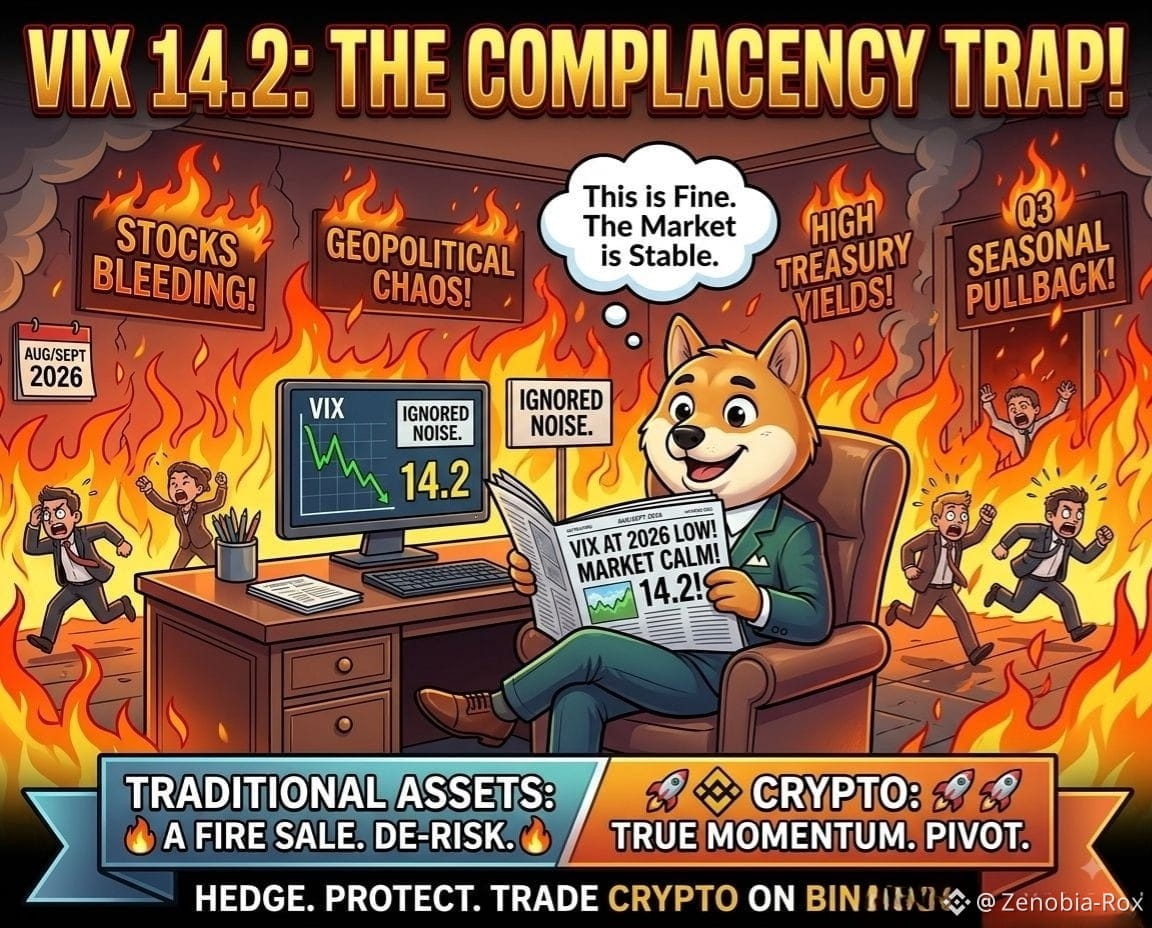
I’ve been looking at the VIX dropping to a new 2026 low around 14.2, and honestly, it’s making me pay more attention, not less.
The market feels unusually calm right now. But when I look around, there’s still plenty that could shake things up. Rates are high, oil can still surprise, geopolitics is messy, and the Fed remains a big part of the story.
So I’m not taking the low VIX as a sign that everything is suddenly safe.
It just tells me traders aren’t expecting much volatility right now.
Markets can stay calm for a long time, but I’ve learned not to confuse calm with certainty. Sometimes the quietest periods are the ones where a small surprise gets everyone moving at once.
For now, I’m watching the calm.
The real question is how long it lasts.
#VIXFallsTo2026Low #VIX #Markets #Volatility #SP500
#MarketComplacency #WallStreet #VIX
$ACE
{spot}(ACEUSDT)
$SOL
{spot}(SOLUSDT)
$BTC
{spot}(BTCUSDT)
I’ve been looking at the VIX dropping to a new 2026 low around 14.2, and honestly, it’s making me pay more attention, not less.
The market feels unusually calm right now. But when I look around, there’s still plenty that could shake things up. Rates are high, oil can still surprise, geopolitics is messy, and the Fed remains a big part of the story.
So I’m not taking the low VIX as a sign that everything is suddenly safe.
It just tells me traders aren’t expecting much volatility right now.
Markets can stay calm for a long time, but I’ve learned not to confuse calm with certainty. Sometimes the quietest periods are the ones where a small surprise gets everyone moving at once.
For now, I’m watching the calm.
The real question is how long it lasts.
#VIXFallsTo2026Low #VIX #Markets #Volatility #SP500
#MarketComplacency #WallStreet #VIX
$ACE
$SOL
$BTC
The market feels unusually calm right now. But when I look around, there’s still plenty that could shake things up. Rates are high, oil can still surprise, geopolitics is messy, and the Fed remains a big part of the story.
So I’m not taking the low VIX as a sign that everything is suddenly safe.
It just tells me traders aren’t expecting much volatility right now.
Markets can stay calm for a long time, but I’ve learned not to confuse calm with certainty. Sometimes the quietest periods are the ones where a small surprise gets everyone moving at once.
For now, I’m watching the calm.
The real question is how long it lasts.
#VIXFallsTo2026Low #VIX #Markets #Volatility #SP500
#MarketComplacency #WallStreet #VIX
$ACE
$SOL
$BTC
251

#vixfallsto2026low
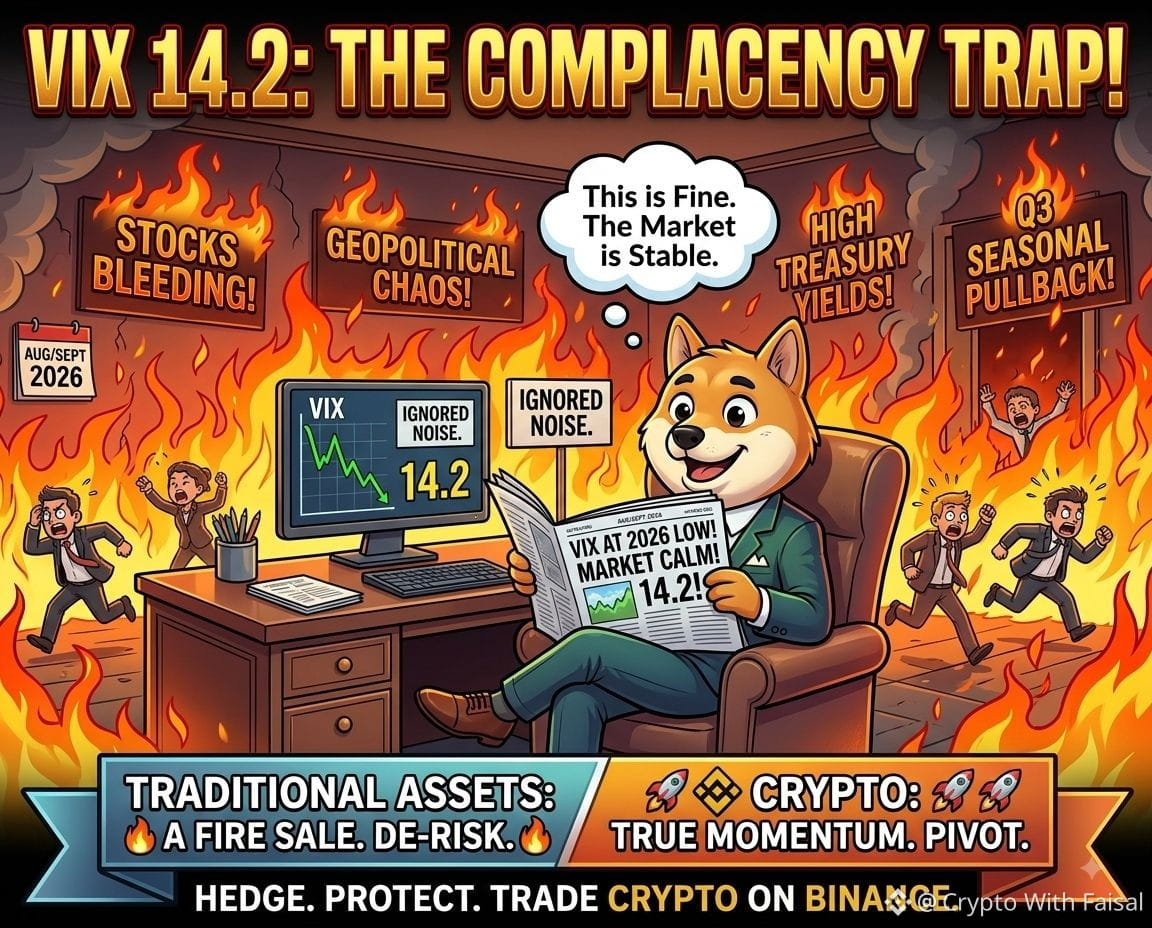
Is Wall Street Walking Straight Into a Volatility Trap? 📉
The VIX dropping to a 2026 low of 14.2 while stocks continue to sink isn't a sign of safety—it's a massive red flag for market oversight.
Traders are completely brushing off key macro headwinds:
Escalating geopolitical turmoil
High Treasury yields pulling liquidity from equities
Severe seasonal downside risks typical of Q3
A suppressed fear index creates a false sense of security right before liquidity dries up. Don't fall for the illusion. De-risk your traditional assets, shield your portfolio, and capture active market momentum in crypto on Binance! 🚀
⚠️ DYOR. Not financial advice.
#MarketComplacency #WallStreet #VIX
$ACE
{future}(ACEUSDT)
$SOL
{future}(SOLUSDT)
$BTC
{future}(BTCUSDT)
#vixfallsto2026low
Is Wall Street Walking Straight Into a Volatility Trap? 📉
The VIX dropping to a 2026 low of 14.2 while stocks continue to sink isn't a sign of safety—it's a massive red flag for market oversight.
Traders are completely brushing off key macro headwinds:
Escalating geopolitical turmoil
High Treasury yields pulling liquidity from equities
Severe seasonal downside risks typical of Q3
A suppressed fear index creates a false sense of security right before liquidity dries up. Don't fall for the illusion. De-risk your traditional assets, shield your portfolio, and capture active market momentum in crypto on Binance! 🚀
⚠️ DYOR. Not financial advice.
#MarketComplacency #WallStreet #VIX
$ACE
$SOL
$BTC
Is Wall Street Walking Straight Into a Volatility Trap? 📉
The VIX dropping to a 2026 low of 14.2 while stocks continue to sink isn't a sign of safety—it's a massive red flag for market oversight.
Traders are completely brushing off key macro headwinds:
Escalating geopolitical turmoil
High Treasury yields pulling liquidity from equities
Severe seasonal downside risks typical of Q3
A suppressed fear index creates a false sense of security right before liquidity dries up. Don't fall for the illusion. De-risk your traditional assets, shield your portfolio, and capture active market momentum in crypto on Binance! 🚀
⚠️ DYOR. Not financial advice.
#MarketComplacency #WallStreet #VIX
$ACE
$SOL
$BTC
1
8
22.5k

·
--
Bearish
Verified
#vixfallsto2026low
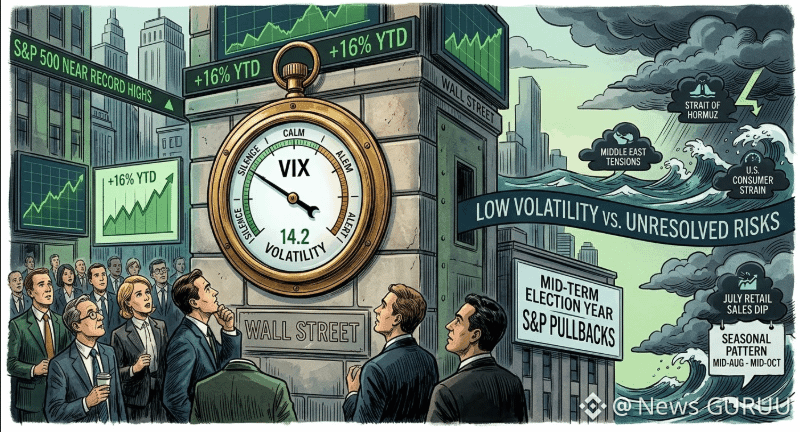
🚨 VIX HITS 2026 LOW — IS THE MARKET TOO CALM?
The VIX fell to 14.2, its lowest level of 2026, as the S&P 500 stays near record highs and equity fund inflows continue.
📊 The Risk: Low volatility, high valuations, Middle East tensions, and signs of consumer weakness could leave markets vulnerable if sentiment suddenly shifts. Historically, mid-August to mid-October can also bring more volatility.
🎯 TRADING VIEW: SELL 📉
Risk appears underpriced. With volatility unusually low and valuations elevated, a pullback could offer the better short-term setup if momentum starts breaking.
❓ Is the market underpricing risk? "CLICK ON THE BELOW YELLOW COIN TAG TO GO TO DESIRED TRADING PAGE TO GET BENEFIT TRADE"$ACE $RED $ETH
{spot}(ETHUSDT)
{spot}(REDUSDT)
{spot}(ACEUSDT)
#VIX #SP500
#vixfallsto2026low
🚨 VIX HITS 2026 LOW — IS THE MARKET TOO CALM?
The VIX fell to 14.2, its lowest level of 2026, as the S&P 500 stays near record highs and equity fund inflows continue.
📊 The Risk: Low volatility, high valuations, Middle East tensions, and signs of consumer weakness could leave markets vulnerable if sentiment suddenly shifts. Historically, mid-August to mid-October can also bring more volatility.
🎯 TRADING VIEW: SELL 📉
Risk appears underpriced. With volatility unusually low and valuations elevated, a pullback could offer the better short-term setup if momentum starts breaking.
❓ Is the market underpricing risk? "CLICK ON THE BELOW YELLOW COIN TAG TO GO TO DESIRED TRADING PAGE TO GET BENEFIT TRADE"$ACE $RED $ETH
#VIX #SP500
🚨 VIX HITS 2026 LOW — IS THE MARKET TOO CALM?
The VIX fell to 14.2, its lowest level of 2026, as the S&P 500 stays near record highs and equity fund inflows continue.
📊 The Risk: Low volatility, high valuations, Middle East tensions, and signs of consumer weakness could leave markets vulnerable if sentiment suddenly shifts. Historically, mid-August to mid-October can also bring more volatility.
🎯 TRADING VIEW: SELL 📉
Risk appears underpriced. With volatility unusually low and valuations elevated, a pullback could offer the better short-term setup if momentum starts breaking.
❓ Is the market underpricing risk? "CLICK ON THE BELOW YELLOW COIN TAG TO GO TO DESIRED TRADING PAGE TO GET BENEFIT TRADE"$ACE $RED $ETH
#VIX #SP500
1
3
2.4k

·
--
#VIXFallsTo2026Low
#VIX #SP500
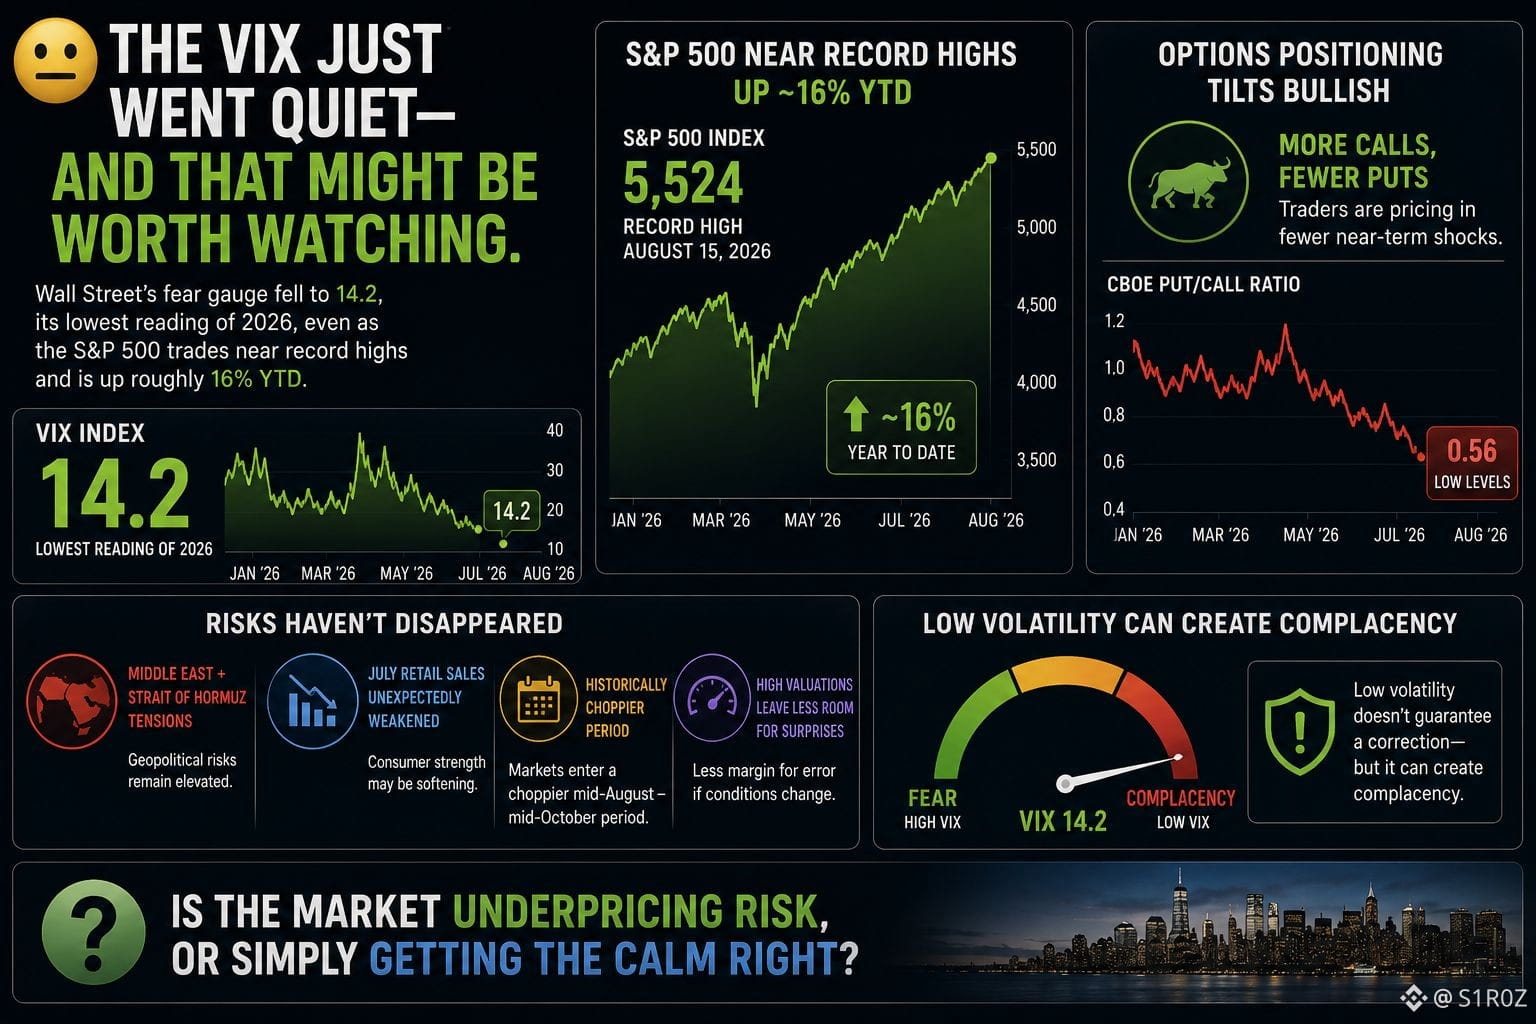
😶 The VIX just went quiet—and that might be worth watching.
$RED ,$EDEN ,$VIXM.ETF
{etf_us}(VIXM.ETF)
{spot}(EDENUSDT)
{spot}(REDUSDT)
Wall Street’s fear gauge fell to 14.2, its lowest reading of 2026, even as the S&P 500 trades near record highs and is up roughly 16% YTD.
Options positioning has also shifted toward calls, suggesting traders are pricing in fewer near-term shocks.
But risks haven’t disappeared:
⚠️ Middle East + Strait of Hormuz tensions
📉 July retail sales unexpectedly weakened
📊 Markets enter a historically choppier mid-August–mid-October period
👀 High valuations leave less room for surprises
Low volatility doesn’t guarantee a correction—but it can create complacency.
Is the market underpricing risk, or simply getting the calm right?
#Stocks #Macro #Trading
#VIXFallsTo2026Low
#VIX #SP500
😶 The VIX just went quiet—and that might be worth watching.
$RED ,$EDEN ,$VIXM.ETF
Wall Street’s fear gauge fell to 14.2, its lowest reading of 2026, even as the S&P 500 trades near record highs and is up roughly 16% YTD.
Options positioning has also shifted toward calls, suggesting traders are pricing in fewer near-term shocks.
But risks haven’t disappeared:
⚠️ Middle East + Strait of Hormuz tensions
📉 July retail sales unexpectedly weakened
📊 Markets enter a historically choppier mid-August–mid-October period
👀 High valuations leave less room for surprises
Low volatility doesn’t guarantee a correction—but it can create complacency.
Is the market underpricing risk, or simply getting the calm right?
#Stocks #Macro #Trading
#VIX #SP500
😶 The VIX just went quiet—and that might be worth watching.
$RED ,$EDEN ,$VIXM.ETF
Wall Street’s fear gauge fell to 14.2, its lowest reading of 2026, even as the S&P 500 trades near record highs and is up roughly 16% YTD.
Options positioning has also shifted toward calls, suggesting traders are pricing in fewer near-term shocks.
But risks haven’t disappeared:
⚠️ Middle East + Strait of Hormuz tensions
📉 July retail sales unexpectedly weakened
📊 Markets enter a historically choppier mid-August–mid-October period
👀 High valuations leave less room for surprises
Low volatility doesn’t guarantee a correction—but it can create complacency.
Is the market underpricing risk, or simply getting the calm right?
#Stocks #Macro #Trading
1
140

·
--

Article
Title: 😨 The VIX fear index falls to 14.2, a new 2026 low! Wall Street warns: don’t get too comfortable—fall selloff risks are building up##VIX恐慌指数跌至2026年低点
Last Friday (August 14), the Cboe Volatility Index (VIX)—a key gauge of market fear on Wall Street—plunged to 14.2, the lowest level since 2026 to date. During the day, the VIX briefly fell to 14.18 before ending at 14.25.
At the same time, the S&P 500 index is up about 16% year-to-date, and other major equity indices are either near record highs or have already hit historical peaks.
📉 Why did the VIX fall to an intra-year low?
The VIX measures the expected market volatility over the next 30 days by tracking S&P 500 index option prices; the lower the number, the calmer the market. The immediate backdrop for the sharp drop in the VIX is a series of “Goldilocks”-level inflation data—July CPI was exactly in line with expectations, while July PPI month-over-month was unchanged and came in below expectations. These figures strengthened market expectations that the Federal Reserve has finished raising rates; the probability that rates will remain unchanged in September has risen to 67%.
Title: 😨 The VIX fear index falls to 14.2, a new 2026 low! Wall Street warns: don’t get too comfortable—fall selloff risks are building up
##VIX恐慌指数跌至2026年低点
Last Friday (August 14), the Cboe Volatility Index (VIX)—a key gauge of market fear on Wall Street—plunged to 14.2, the lowest level since 2026 to date. During the day, the VIX briefly fell to 14.18 before ending at 14.25.
At the same time, the S&P 500 index is up about 16% year-to-date, and other major equity indices are either near record highs or have already hit historical peaks.
📉 Why did the VIX fall to an intra-year low?
The VIX measures the expected market volatility over the next 30 days by tracking S&P 500 index option prices; the lower the number, the calmer the market. The immediate backdrop for the sharp drop in the VIX is a series of “Goldilocks”-level inflation data—July CPI was exactly in line with expectations, while July PPI month-over-month was unchanged and came in below expectations. These figures strengthened market expectations that the Federal Reserve has finished raising rates; the probability that rates will remain unchanged in September has risen to 67%.
Last Friday (August 14), the Cboe Volatility Index (VIX)—a key gauge of market fear on Wall Street—plunged to 14.2, the lowest level since 2026 to date. During the day, the VIX briefly fell to 14.18 before ending at 14.25.
At the same time, the S&P 500 index is up about 16% year-to-date, and other major equity indices are either near record highs or have already hit historical peaks.
📉 Why did the VIX fall to an intra-year low?
The VIX measures the expected market volatility over the next 30 days by tracking S&P 500 index option prices; the lower the number, the calmer the market. The immediate backdrop for the sharp drop in the VIX is a series of “Goldilocks”-level inflation data—July CPI was exactly in line with expectations, while July PPI month-over-month was unchanged and came in below expectations. These figures strengthened market expectations that the Federal Reserve has finished raising rates; the probability that rates will remain unchanged in September has risen to 67%.
70

·
--
💥💥The market is calm just before something big💥💥
Wall Street’s fear index (VIX) hit its lowest level of
all 2026 — the market is more relaxed than ever this year. But at the same time, traffic in the Strait of Hormuz has come to a complete standstill ahead of the expiration of the ceasefire between the US and Iran.
Analysts are already warning that this calm won’t last. When the market is this quiet and there’s a major geopolitical risk on the table, any bad news hits twice as hard because nobody is prepared.
$BTC at $63,599, recovering from last week’s lows and with momentum improving.
🔺 If the ceasefire is extended → relief and a clear path to keep rising
🔻 If it’s broken → a big shock, and with the market so confident, the drop would be more violent
Extreme calm is not a sign of safety—it's a sign that nobody is covered.
Are you taking risk with this calm, or would you rather wait? 👇
#BTC #VIX #Hormuz #MercadosCripto
💥💥The market is calm just before something big💥💥
Wall Street’s fear index (VIX) hit its lowest level of
all 2026 — the market is more relaxed than ever this year. But at the same time, traffic in the Strait of Hormuz has come to a complete standstill ahead of the expiration of the ceasefire between the US and Iran.
Analysts are already warning that this calm won’t last. When the market is this quiet and there’s a major geopolitical risk on the table, any bad news hits twice as hard because nobody is prepared.
$BTC at $63,599, recovering from last week’s lows and with momentum improving.
🔺 If the ceasefire is extended → relief and a clear path to keep rising
🔻 If it’s broken → a big shock, and with the market so confident, the drop would be more violent
Extreme calm is not a sign of safety—it's a sign that nobody is covered.
Are you taking risk with this calm, or would you rather wait? 👇
#BTC #VIX #Hormuz #MercadosCripto
Wall Street’s fear index (VIX) hit its lowest level of
all 2026 — the market is more relaxed than ever this year. But at the same time, traffic in the Strait of Hormuz has come to a complete standstill ahead of the expiration of the ceasefire between the US and Iran.
Analysts are already warning that this calm won’t last. When the market is this quiet and there’s a major geopolitical risk on the table, any bad news hits twice as hard because nobody is prepared.
$BTC at $63,599, recovering from last week’s lows and with momentum improving.
🔺 If the ceasefire is extended → relief and a clear path to keep rising
🔻 If it’s broken → a big shock, and with the market so confident, the drop would be more violent
Extreme calm is not a sign of safety—it's a sign that nobody is covered.
Are you taking risk with this calm, or would you rather wait? 👇
#BTC #VIX #Hormuz #MercadosCripto

168
·
--
Title: US Stocks | Knowledge Session | August 14
【VIX Fear Index】
Many beginners get overwhelmed as soon as they see the VIX, thinking it’s some fancy financial jargon. The truth is, it’s actually very simple. You can think of it as a thermometer for the US stock market.
1. What is the VIX?
The VIX stands for the Volatility Index, published by the Chicago Board Options Exchange (CBOE). It measures the market’s expected level of volatility for the next 30 days for the S&P 500—essentially how much market participants are betting the future stock market will be bumpy.
For example, imagine you’ve been on a roller coaster at an amusement park.
VIX below 15: the carousel—almost no bumps
VIX between 15 and 20: a mini roller coaster—some刺激
VIX between 20 and 30: a medium-to-big roller coaster—hold tight
VIX above 30: a free-fall ride—you start questioning life
VIX above 50: closes your eyes and yells “Mom!”
So the VIX is also called the “Fear Index,” because the higher it is, the more afraid the market is.
2. What’s the relationship between the VIX and stock prices?
Remember this inverse rule: the VIX and the S&P 500 nearly always move in opposite directions.
When stocks rise, people think the future will be steady, and the VIX falls.
When stocks drop, people think things are about to collapse, and the VIX soars.
That’s why the VIX also has a nickname: the inverse ETF. When you want to hedge risk, you buy VIX-related products. When the market is calm, it just lies there and does nothing.
3. How to interpret the current data?
Today (August 14), the VIX is 14.63, and it’s down 1.8% over the past 5 days. This is an extremely low level, meaning the market is currently extremely optimistic and self-satisfied.
But here’s some timely advice: when the VIX stays below 15 for the long term, it often isn’t a sign of “peace and prosperity,” but rather calm before the storm.
Historical data keeps proving this: the longer the VIX stays low, the more dramatic its spike tends to be when the next “black swan” event hits (in 2020 during the pandemic, the VIX jumped to 82; in 2022 during the Russia-Ukraine conflict, it reached 36).
4. The relationship between the VIX and BTC
This is a linkage crypto traders must know.
1. For most of the time, BTC and the VIX are positively correlated. When the VIX rises, global fear rises, and BTC gets dragged down too—it’s a high-beta asset, with the first wave of capital fleeing.
2. But in a low-VIX environment, BTC is more likely to break into an independent trend, because liquidity is abundant, risk appetite increases, and funds move from boring stocks to story-driven coins.
3. When the VIX suddenly jumps from a low level—say, from 14 to above 20—it’s often a signal that BTC is topping in the short term, and “smart money” starts trimming positions in stealth.
Today BTC is quoted at $63,282, down 0.53% over the past 24 hours. IBIT (spot BTC ETF) is down 2.5% over 5 days, while the S&P 500 is up 0.5% over the same period. This is a classic setup: US stocks are rising while crypto doesn’t follow. Behind it is a low-VIX, risk-on market environment where BTC is weak. That suggests there’s a lack of catalysts within crypto—stay alert.
5. Practical suggestions
- For friends holding BTC and ETH spot: with the current VIX at 14.63, it’s in an overconfidence zone. Don’t chase gains with a heavy position—keep enough USDT to deal with volatility.
- For those who want to hedge: you can allocate a small amount to VIX-related products such as UVXY and VXX as “black swan insurance.”
- For short-term traders: watch the VIX for sudden shifts. A single-day increase of more than 15% is an alarm.
- For long-term coin-hodlers: ignore the VIX. It doesn’t matter to you—time will help.
In one sentence: the VIX is the market’s mood thermometer. Below 14 degrees feels comfortable, but hail can hit at any moment. Respect volatility, and you’ll live longer.
#VIX #恐慌指数 #crypto
Title: US Stocks | Knowledge Session | August 14
【VIX Fear Index】
Many beginners get overwhelmed as soon as they see the VIX, thinking it’s some fancy financial jargon. The truth is, it’s actually very simple. You can think of it as a thermometer for the US stock market.
1. What is the VIX?
The VIX stands for the Volatility Index, published by the Chicago Board Options Exchange (CBOE). It measures the market’s expected level of volatility for the next 30 days for the S&P 500—essentially how much market participants are betting the future stock market will be bumpy.
For example, imagine you’ve been on a roller coaster at an amusement park.
VIX below 15: the carousel—almost no bumps
VIX between 15 and 20: a mini roller coaster—some刺激
VIX between 20 and 30: a medium-to-big roller coaster—hold tight
VIX above 30: a free-fall ride—you start questioning life
VIX above 50: closes your eyes and yells “Mom!”
So the VIX is also called the “Fear Index,” because the higher it is, the more afraid the market is.
2. What’s the relationship between the VIX and stock prices?
Remember this inverse rule: the VIX and the S&P 500 nearly always move in opposite directions.
When stocks rise, people think the future will be steady, and the VIX falls.
When stocks drop, people think things are about to collapse, and the VIX soars.
That’s why the VIX also has a nickname: the inverse ETF. When you want to hedge risk, you buy VIX-related products. When the market is calm, it just lies there and does nothing.
3. How to interpret the current data?
Today (August 14), the VIX is 14.63, and it’s down 1.8% over the past 5 days. This is an extremely low level, meaning the market is currently extremely optimistic and self-satisfied.
But here’s some timely advice: when the VIX stays below 15 for the long term, it often isn’t a sign of “peace and prosperity,” but rather calm before the storm.
Historical data keeps proving this: the longer the VIX stays low, the more dramatic its spike tends to be when the next “black swan” event hits (in 2020 during the pandemic, the VIX jumped to 82; in 2022 during the Russia-Ukraine conflict, it reached 36).
4. The relationship between the VIX and BTC
This is a linkage crypto traders must know.
1. For most of the time, BTC and the VIX are positively correlated. When the VIX rises, global fear rises, and BTC gets dragged down too—it’s a high-beta asset, with the first wave of capital fleeing.
2. But in a low-VIX environment, BTC is more likely to break into an independent trend, because liquidity is abundant, risk appetite increases, and funds move from boring stocks to story-driven coins.
3. When the VIX suddenly jumps from a low level—say, from 14 to above 20—it’s often a signal that BTC is topping in the short term, and “smart money” starts trimming positions in stealth.
Today BTC is quoted at $63,282, down 0.53% over the past 24 hours. IBIT (spot BTC ETF) is down 2.5% over 5 days, while the S&P 500 is up 0.5% over the same period. This is a classic setup: US stocks are rising while crypto doesn’t follow. Behind it is a low-VIX, risk-on market environment where BTC is weak. That suggests there’s a lack of catalysts within crypto—stay alert.
5. Practical suggestions
- For friends holding BTC and ETH spot: with the current VIX at 14.63, it’s in an overconfidence zone. Don’t chase gains with a heavy position—keep enough USDT to deal with volatility.
- For those who want to hedge: you can allocate a small amount to VIX-related products such as UVXY and VXX as “black swan insurance.”
- For short-term traders: watch the VIX for sudden shifts. A single-day increase of more than 15% is an alarm.
- For long-term coin-hodlers: ignore the VIX. It doesn’t matter to you—time will help.
In one sentence: the VIX is the market’s mood thermometer. Below 14 degrees feels comfortable, but hail can hit at any moment. Respect volatility, and you’ll live longer.
#VIX #恐慌指数 #crypto
【VIX Fear Index】
Many beginners get overwhelmed as soon as they see the VIX, thinking it’s some fancy financial jargon. The truth is, it’s actually very simple. You can think of it as a thermometer for the US stock market.
1. What is the VIX?
The VIX stands for the Volatility Index, published by the Chicago Board Options Exchange (CBOE). It measures the market’s expected level of volatility for the next 30 days for the S&P 500—essentially how much market participants are betting the future stock market will be bumpy.
For example, imagine you’ve been on a roller coaster at an amusement park.
VIX below 15: the carousel—almost no bumps
VIX between 15 and 20: a mini roller coaster—some刺激
VIX between 20 and 30: a medium-to-big roller coaster—hold tight
VIX above 30: a free-fall ride—you start questioning life
VIX above 50: closes your eyes and yells “Mom!”
So the VIX is also called the “Fear Index,” because the higher it is, the more afraid the market is.
2. What’s the relationship between the VIX and stock prices?
Remember this inverse rule: the VIX and the S&P 500 nearly always move in opposite directions.
When stocks rise, people think the future will be steady, and the VIX falls.
When stocks drop, people think things are about to collapse, and the VIX soars.
That’s why the VIX also has a nickname: the inverse ETF. When you want to hedge risk, you buy VIX-related products. When the market is calm, it just lies there and does nothing.
3. How to interpret the current data?
Today (August 14), the VIX is 14.63, and it’s down 1.8% over the past 5 days. This is an extremely low level, meaning the market is currently extremely optimistic and self-satisfied.
But here’s some timely advice: when the VIX stays below 15 for the long term, it often isn’t a sign of “peace and prosperity,” but rather calm before the storm.
Historical data keeps proving this: the longer the VIX stays low, the more dramatic its spike tends to be when the next “black swan” event hits (in 2020 during the pandemic, the VIX jumped to 82; in 2022 during the Russia-Ukraine conflict, it reached 36).
4. The relationship between the VIX and BTC
This is a linkage crypto traders must know.
1. For most of the time, BTC and the VIX are positively correlated. When the VIX rises, global fear rises, and BTC gets dragged down too—it’s a high-beta asset, with the first wave of capital fleeing.
2. But in a low-VIX environment, BTC is more likely to break into an independent trend, because liquidity is abundant, risk appetite increases, and funds move from boring stocks to story-driven coins.
3. When the VIX suddenly jumps from a low level—say, from 14 to above 20—it’s often a signal that BTC is topping in the short term, and “smart money” starts trimming positions in stealth.
Today BTC is quoted at $63,282, down 0.53% over the past 24 hours. IBIT (spot BTC ETF) is down 2.5% over 5 days, while the S&P 500 is up 0.5% over the same period. This is a classic setup: US stocks are rising while crypto doesn’t follow. Behind it is a low-VIX, risk-on market environment where BTC is weak. That suggests there’s a lack of catalysts within crypto—stay alert.
5. Practical suggestions
- For friends holding BTC and ETH spot: with the current VIX at 14.63, it’s in an overconfidence zone. Don’t chase gains with a heavy position—keep enough USDT to deal with volatility.
- For those who want to hedge: you can allocate a small amount to VIX-related products such as UVXY and VXX as “black swan insurance.”
- For short-term traders: watch the VIX for sudden shifts. A single-day increase of more than 15% is an alarm.
- For long-term coin-hodlers: ignore the VIX. It doesn’t matter to you—time will help.
In one sentence: the VIX is the market’s mood thermometer. Below 14 degrees feels comfortable, but hail can hit at any moment. Respect volatility, and you’ll live longer.
#VIX #恐慌指数 #crypto
271
·
--
US Stocks | Knowledge Session | August 13
Today we’ll talk about an indicator that even many veteran traders are watching, but beginners look totally confused about—VIX, the Volatility Index. We’ll also briefly uncover its “secret” connection to the BTC ETF (IBIT).
1. What exactly is VIX?
Simply put: VIX = the market’s pricing of an insurance premium for expected volatility in the next 30 days of US stocks.
For example:
- You go to an amusement park; a regular day ticket costs 30 yuan.
- But you hear there might be a typhoon warning next week, and the ticket price jumps to 80 yuan.
- The more likely the typhoon is, the more expensive the ticket becomes.
- VIX is the price of that volatility ticket. The higher the number, the more fear the market is showing.
Experience-based thresholds:
- VIX < 15: Everything’s calm; institutions can “lie flat”
- VIX 15–20: Normal fluctuations; no need to get nervous
- VIX 20–30: Things start to get spicy; there may be an event
- VIX > 30: Panic everywhere; commonly seen in “black swan” moments
- VIX > 40: A flood of red (e.g., March 2020, June 2022)
Note: VIX and the S&P 500 are negatively correlated. On days when the S&P 500 crashes, VIX often spikes—vice versa as well.
2. VIX and BTC: a “hit from afar” effect
Many people don’t know this: when VIX spikes, BTC often falls too—and the drop is frequently harsher than in US equities.
The reasons:
1. Risk contagion—US stock panic triggers a global risk-off move. The worst-liquid assets get sold first (BTC is “always on” 24/7, but it gets hit fastest).
2. Tightening USD liquidity—when VIX surges, people buy safe-haven USD; BTC/USDT-priced assets then decline.
3. Forced deleveraging—CME BTC futures and options liquidation can cascade.
But there are exceptions: in March 2020, when VIX broke above 80, BTC was actually among the assets that rebounded the most later (after liquidity got smashed, institutions flipped and built positions).
3. IBIT (a BTC spot ETF) is the real key
VIX is just a thermometer. To truly understand BTC’s funding conditions, look at IBIT’s net inflows:
- Continuous net inflows = institutions are buying; BTC is easier to rise and harder to drop
- Continuous net redemptions = institutions are exiting; BTC gets worse, like adding fuel to the fire
- Flat = range-bound; we’re waiting for the next catalyst
Historical pattern (since 2024):
- IBIT single-day net inflow > $500M: the probability that BTC rises within the next 7 days is about 70%
- IBIT single-day net outflow > $200M: the probability that BTC falls within the next 7 days is about 65%
- IBIT net inflows for 5 consecutive days: a signal that BTC’s medium-term bull impulse may be starting
4. How does the market view things right now?
Current snapshot (2026-08-13):
- BTC: $63,626 (24h -0.27%)
- ETH: $1,886 (flat)
- SOL: $76.23
- The market is in a narrow range; BTC is holding the 63,000 level
What does this imply?
- If IBIT net inflows keep coming, BTC likely can’t fall much further
- If VIX suddenly spikes (breaks above 20), BTC might actually be in its “last drop” phase
- The real risk isn’t VIX by itself, but the combination of IBIT net outflows plus a VIX surge occurring at the same time
5. Crypto trading advice (practical, hands-on)
1. Don’t chase BTC when VIX is low (< 15)—that’s when greed is at its peak
2. VIX 20–25 + IBIT net inflow = a “golden” add-to-position window
3. When VIX > 30, don’t go all-in to bottom-fish—wait until VIX drops back below 25
4. Check IBIT net inflow data once a week (farside.co can be used). It’s more useful than analyzing 100 KOLs
5. Real alpha: when VIX spikes but IBIT is still net inflow—smart money is building positions amid the chaos
One-sentence summary: VIX is a noise filter; IBIT is the real capital signal. When both resonate, follow the smart money.
#BTC #IBIT #VIX
US Stocks | Knowledge Session | August 13
Today we’ll talk about an indicator that even many veteran traders are watching, but beginners look totally confused about—VIX, the Volatility Index. We’ll also briefly uncover its “secret” connection to the BTC ETF (IBIT).
1. What exactly is VIX?
Simply put: VIX = the market’s pricing of an insurance premium for expected volatility in the next 30 days of US stocks.
For example:
- You go to an amusement park; a regular day ticket costs 30 yuan.
- But you hear there might be a typhoon warning next week, and the ticket price jumps to 80 yuan.
- The more likely the typhoon is, the more expensive the ticket becomes.
- VIX is the price of that volatility ticket. The higher the number, the more fear the market is showing.
Experience-based thresholds:
- VIX < 15: Everything’s calm; institutions can “lie flat”
- VIX 15–20: Normal fluctuations; no need to get nervous
- VIX 20–30: Things start to get spicy; there may be an event
- VIX > 30: Panic everywhere; commonly seen in “black swan” moments
- VIX > 40: A flood of red (e.g., March 2020, June 2022)
Note: VIX and the S&P 500 are negatively correlated. On days when the S&P 500 crashes, VIX often spikes—vice versa as well.
2. VIX and BTC: a “hit from afar” effect
Many people don’t know this: when VIX spikes, BTC often falls too—and the drop is frequently harsher than in US equities.
The reasons:
1. Risk contagion—US stock panic triggers a global risk-off move. The worst-liquid assets get sold first (BTC is “always on” 24/7, but it gets hit fastest).
2. Tightening USD liquidity—when VIX surges, people buy safe-haven USD; BTC/USDT-priced assets then decline.
3. Forced deleveraging—CME BTC futures and options liquidation can cascade.
But there are exceptions: in March 2020, when VIX broke above 80, BTC was actually among the assets that rebounded the most later (after liquidity got smashed, institutions flipped and built positions).
3. IBIT (a BTC spot ETF) is the real key
VIX is just a thermometer. To truly understand BTC’s funding conditions, look at IBIT’s net inflows:
- Continuous net inflows = institutions are buying; BTC is easier to rise and harder to drop
- Continuous net redemptions = institutions are exiting; BTC gets worse, like adding fuel to the fire
- Flat = range-bound; we’re waiting for the next catalyst
Historical pattern (since 2024):
- IBIT single-day net inflow > $500M: the probability that BTC rises within the next 7 days is about 70%
- IBIT single-day net outflow > $200M: the probability that BTC falls within the next 7 days is about 65%
- IBIT net inflows for 5 consecutive days: a signal that BTC’s medium-term bull impulse may be starting
4. How does the market view things right now?
Current snapshot (2026-08-13):
- BTC: $63,626 (24h -0.27%)
- ETH: $1,886 (flat)
- SOL: $76.23
- The market is in a narrow range; BTC is holding the 63,000 level
What does this imply?
- If IBIT net inflows keep coming, BTC likely can’t fall much further
- If VIX suddenly spikes (breaks above 20), BTC might actually be in its “last drop” phase
- The real risk isn’t VIX by itself, but the combination of IBIT net outflows plus a VIX surge occurring at the same time
5. Crypto trading advice (practical, hands-on)
1. Don’t chase BTC when VIX is low (< 15)—that’s when greed is at its peak
2. VIX 20–25 + IBIT net inflow = a “golden” add-to-position window
3. When VIX > 30, don’t go all-in to bottom-fish—wait until VIX drops back below 25
4. Check IBIT net inflow data once a week (farside.co can be used). It’s more useful than analyzing 100 KOLs
5. Real alpha: when VIX spikes but IBIT is still net inflow—smart money is building positions amid the chaos
One-sentence summary: VIX is a noise filter; IBIT is the real capital signal. When both resonate, follow the smart money.
#BTC #IBIT #VIX
Today we’ll talk about an indicator that even many veteran traders are watching, but beginners look totally confused about—VIX, the Volatility Index. We’ll also briefly uncover its “secret” connection to the BTC ETF (IBIT).
1. What exactly is VIX?
Simply put: VIX = the market’s pricing of an insurance premium for expected volatility in the next 30 days of US stocks.
For example:
- You go to an amusement park; a regular day ticket costs 30 yuan.
- But you hear there might be a typhoon warning next week, and the ticket price jumps to 80 yuan.
- The more likely the typhoon is, the more expensive the ticket becomes.
- VIX is the price of that volatility ticket. The higher the number, the more fear the market is showing.
Experience-based thresholds:
- VIX < 15: Everything’s calm; institutions can “lie flat”
- VIX 15–20: Normal fluctuations; no need to get nervous
- VIX 20–30: Things start to get spicy; there may be an event
- VIX > 30: Panic everywhere; commonly seen in “black swan” moments
- VIX > 40: A flood of red (e.g., March 2020, June 2022)
Note: VIX and the S&P 500 are negatively correlated. On days when the S&P 500 crashes, VIX often spikes—vice versa as well.
2. VIX and BTC: a “hit from afar” effect
Many people don’t know this: when VIX spikes, BTC often falls too—and the drop is frequently harsher than in US equities.
The reasons:
1. Risk contagion—US stock panic triggers a global risk-off move. The worst-liquid assets get sold first (BTC is “always on” 24/7, but it gets hit fastest).
2. Tightening USD liquidity—when VIX surges, people buy safe-haven USD; BTC/USDT-priced assets then decline.
3. Forced deleveraging—CME BTC futures and options liquidation can cascade.
But there are exceptions: in March 2020, when VIX broke above 80, BTC was actually among the assets that rebounded the most later (after liquidity got smashed, institutions flipped and built positions).
3. IBIT (a BTC spot ETF) is the real key
VIX is just a thermometer. To truly understand BTC’s funding conditions, look at IBIT’s net inflows:
- Continuous net inflows = institutions are buying; BTC is easier to rise and harder to drop
- Continuous net redemptions = institutions are exiting; BTC gets worse, like adding fuel to the fire
- Flat = range-bound; we’re waiting for the next catalyst
Historical pattern (since 2024):
- IBIT single-day net inflow > $500M: the probability that BTC rises within the next 7 days is about 70%
- IBIT single-day net outflow > $200M: the probability that BTC falls within the next 7 days is about 65%
- IBIT net inflows for 5 consecutive days: a signal that BTC’s medium-term bull impulse may be starting
4. How does the market view things right now?
Current snapshot (2026-08-13):
- BTC: $63,626 (24h -0.27%)
- ETH: $1,886 (flat)
- SOL: $76.23
- The market is in a narrow range; BTC is holding the 63,000 level
What does this imply?
- If IBIT net inflows keep coming, BTC likely can’t fall much further
- If VIX suddenly spikes (breaks above 20), BTC might actually be in its “last drop” phase
- The real risk isn’t VIX by itself, but the combination of IBIT net outflows plus a VIX surge occurring at the same time
5. Crypto trading advice (practical, hands-on)
1. Don’t chase BTC when VIX is low (< 15)—that’s when greed is at its peak
2. VIX 20–25 + IBIT net inflow = a “golden” add-to-position window
3. When VIX > 30, don’t go all-in to bottom-fish—wait until VIX drops back below 25
4. Check IBIT net inflow data once a week (farside.co can be used). It’s more useful than analyzing 100 KOLs
5. Real alpha: when VIX spikes but IBIT is still net inflow—smart money is building positions amid the chaos
One-sentence summary: VIX is a noise filter; IBIT is the real capital signal. When both resonate, follow the smart money.
#BTC #IBIT #VIX
BTC-0.59%
IBITETF+0.27%
97

#vixfallstojanuarylow
📉 The VIX index stays calm. This may be a warning.
The VIX has fallen to its lowest level since January, suggesting that options markets are pricing far more tranquil conditions.
It looks bullish.
But there’s another side to the story.
🟢 Less demand for protection
🟢 Lower expected volatility
🟢 Greater appetite for risk
Nevertheless, when volatility is unusually low, a kind of complacency can build up.
The risk isn’t today’s calm.
Rather, it’s what happens when an unexpected shock hits the macroeconomic, geopolitical, or earnings landscape in a market that has become centered on stability.
And once volatility returns, it can come back quickly.
And for crypto traders, this also matters:
A drop in VIX can support risk appetite—but it’s not a buy signal.
Watch the relationship between:
VIX → liquidity → BTC → altcoins
because the next big move may come when everyone is less prepared for it. 👀
Please follow up
$LAB
{alpha}(560x7ec43cf65f1663f820427c62a5780b8f2e25593a)
$TUT
{future}(TUTUSDT)
#VIX #SP500 #BTC #Crypto
#vixfallstojanuarylow
📉 The VIX index stays calm. This may be a warning.
The VIX has fallen to its lowest level since January, suggesting that options markets are pricing far more tranquil conditions.
It looks bullish.
But there’s another side to the story.
🟢 Less demand for protection
🟢 Lower expected volatility
🟢 Greater appetite for risk
Nevertheless, when volatility is unusually low, a kind of complacency can build up.
The risk isn’t today’s calm.
Rather, it’s what happens when an unexpected shock hits the macroeconomic, geopolitical, or earnings landscape in a market that has become centered on stability.
And once volatility returns, it can come back quickly.
And for crypto traders, this also matters:
A drop in VIX can support risk appetite—but it’s not a buy signal.
Watch the relationship between:
VIX → liquidity → BTC → altcoins
because the next big move may come when everyone is less prepared for it. 👀
Please follow up
$LAB
$TUT
#VIX #SP500 #BTC #Crypto
📉 The VIX index stays calm. This may be a warning.
The VIX has fallen to its lowest level since January, suggesting that options markets are pricing far more tranquil conditions.
It looks bullish.
But there’s another side to the story.
🟢 Less demand for protection
🟢 Lower expected volatility
🟢 Greater appetite for risk
Nevertheless, when volatility is unusually low, a kind of complacency can build up.
The risk isn’t today’s calm.
Rather, it’s what happens when an unexpected shock hits the macroeconomic, geopolitical, or earnings landscape in a market that has become centered on stability.
And once volatility returns, it can come back quickly.
And for crypto traders, this also matters:
A drop in VIX can support risk appetite—but it’s not a buy signal.
Watch the relationship between:
VIX → liquidity → BTC → altcoins
because the next big move may come when everyone is less prepared for it. 👀
Please follow up
$LAB
$TUT
#VIX #SP500 #BTC #Crypto
1
80

·
--
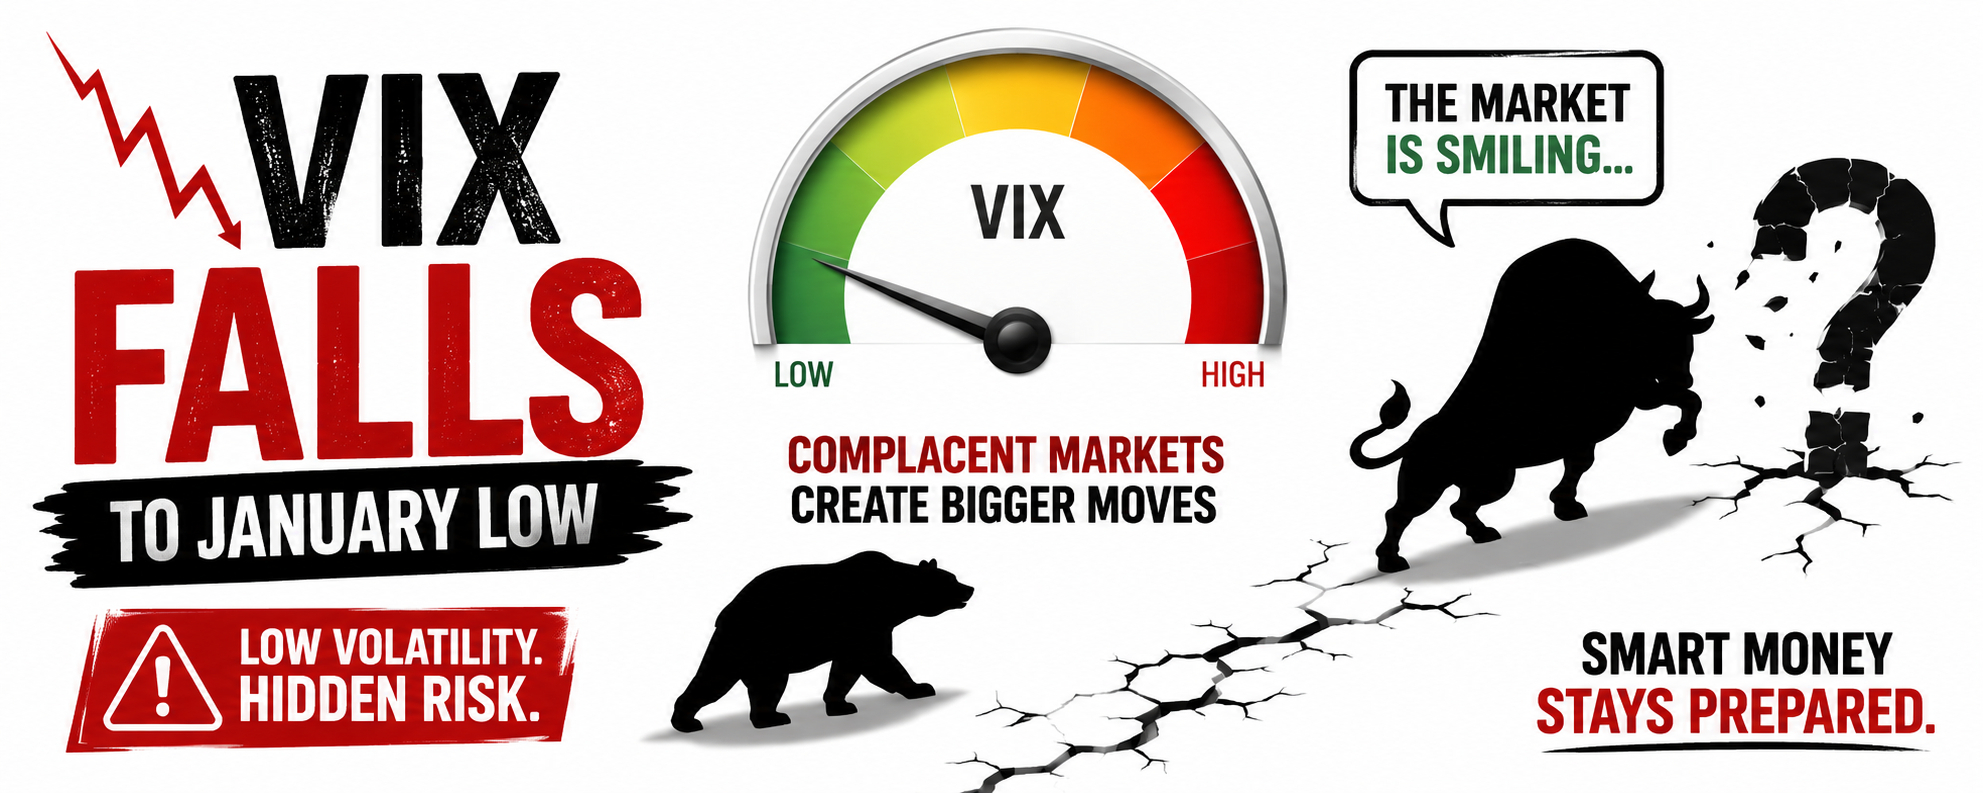
Article
🚨 The VIX Just Hit a January Low… And That's When Smart Money Gets Nervous🔥📉 The Market Is Smiling Again… And That’s Exactly When Smart Money Becomes Careful.
The loudest warning in the market isn't panic—it's silence.
While most investors are celebrating, experienced traders are quietly watching one number: the VIX, and it has just fallen to its lowest level since January.
For many, that's great news. A lower VIX signals confidence, stronger risk appetite, and a market that believes the worst is behind it.
But markets have a habit of punishing comfort.
History has shown that some of the biggest price swings don't begin when fear is high—they begin when almost nobody expects them. When investors stop thinking about risk, even a small surprise can trigger a wave of profit-taking, liquidations, and sudden volatility.
This doesn't mean a crash is coming tomorrow. It means the market has entered a phase where emotions can become more dangerous than fundamentals.
For crypto investors, this matters even more.
Bitcoin and the broader crypto market thrive on liquidity and confidence. As long as optimism continues, capital can keep flowing into digital assets. But confidence without caution often creates fragile momentum. One unexpected inflation report, a central bank surprise, or a geopolitical headline can completely change market sentiment within hours.
The VIX is not flashing a sell signal.
It's sending a reminder.
The best investors don't wait for fear to return before managing risk. They build positions with discipline, protect their capital, and stay prepared while everyone else is convinced that nothing can go wrong.
When the crowd believes the road ahead is perfectly clear, that's usually when smart money checks the exits.
In investing, survival comes before profits. Because opportunities always return—but lost capital is much harder to recover.
Stay confident. Stay disciplined. But never let a calm market convince you that risk has disappeared.
#VlXFalls #VIX #stockmarket #Bitcoin #crypto #Investing #MarketAnalysis
🚨 The VIX Just Hit a January Low… And That's When Smart Money Gets Nervous🔥
📉 The Market Is Smiling Again… And That’s Exactly When Smart Money Becomes Careful.
The loudest warning in the market isn't panic—it's silence.
While most investors are celebrating, experienced traders are quietly watching one number: the VIX, and it has just fallen to its lowest level since January.
For many, that's great news. A lower VIX signals confidence, stronger risk appetite, and a market that believes the worst is behind it.
But markets have a habit of punishing comfort.
History has shown that some of the biggest price swings don't begin when fear is high—they begin when almost nobody expects them. When investors stop thinking about risk, even a small surprise can trigger a wave of profit-taking, liquidations, and sudden volatility.
This doesn't mean a crash is coming tomorrow. It means the market has entered a phase where emotions can become more dangerous than fundamentals.
For crypto investors, this matters even more.
Bitcoin and the broader crypto market thrive on liquidity and confidence. As long as optimism continues, capital can keep flowing into digital assets. But confidence without caution often creates fragile momentum. One unexpected inflation report, a central bank surprise, or a geopolitical headline can completely change market sentiment within hours.
The VIX is not flashing a sell signal.
It's sending a reminder.
The best investors don't wait for fear to return before managing risk. They build positions with discipline, protect their capital, and stay prepared while everyone else is convinced that nothing can go wrong.
When the crowd believes the road ahead is perfectly clear, that's usually when smart money checks the exits.
In investing, survival comes before profits. Because opportunities always return—but lost capital is much harder to recover.
Stay confident. Stay disciplined. But never let a calm market convince you that risk has disappeared.
#VlXFalls #VIX #stockmarket #Bitcoin #crypto #Investing #MarketAnalysis
The loudest warning in the market isn't panic—it's silence.
While most investors are celebrating, experienced traders are quietly watching one number: the VIX, and it has just fallen to its lowest level since January.
For many, that's great news. A lower VIX signals confidence, stronger risk appetite, and a market that believes the worst is behind it.
But markets have a habit of punishing comfort.
History has shown that some of the biggest price swings don't begin when fear is high—they begin when almost nobody expects them. When investors stop thinking about risk, even a small surprise can trigger a wave of profit-taking, liquidations, and sudden volatility.
This doesn't mean a crash is coming tomorrow. It means the market has entered a phase where emotions can become more dangerous than fundamentals.
For crypto investors, this matters even more.
Bitcoin and the broader crypto market thrive on liquidity and confidence. As long as optimism continues, capital can keep flowing into digital assets. But confidence without caution often creates fragile momentum. One unexpected inflation report, a central bank surprise, or a geopolitical headline can completely change market sentiment within hours.
The VIX is not flashing a sell signal.
It's sending a reminder.
The best investors don't wait for fear to return before managing risk. They build positions with discipline, protect their capital, and stay prepared while everyone else is convinced that nothing can go wrong.
When the crowd believes the road ahead is perfectly clear, that's usually when smart money checks the exits.
In investing, survival comes before profits. Because opportunities always return—but lost capital is much harder to recover.
Stay confident. Stay disciplined. But never let a calm market convince you that risk has disappeared.
#VlXFalls #VIX #stockmarket #Bitcoin #crypto #Investing #MarketAnalysis
2
14
241

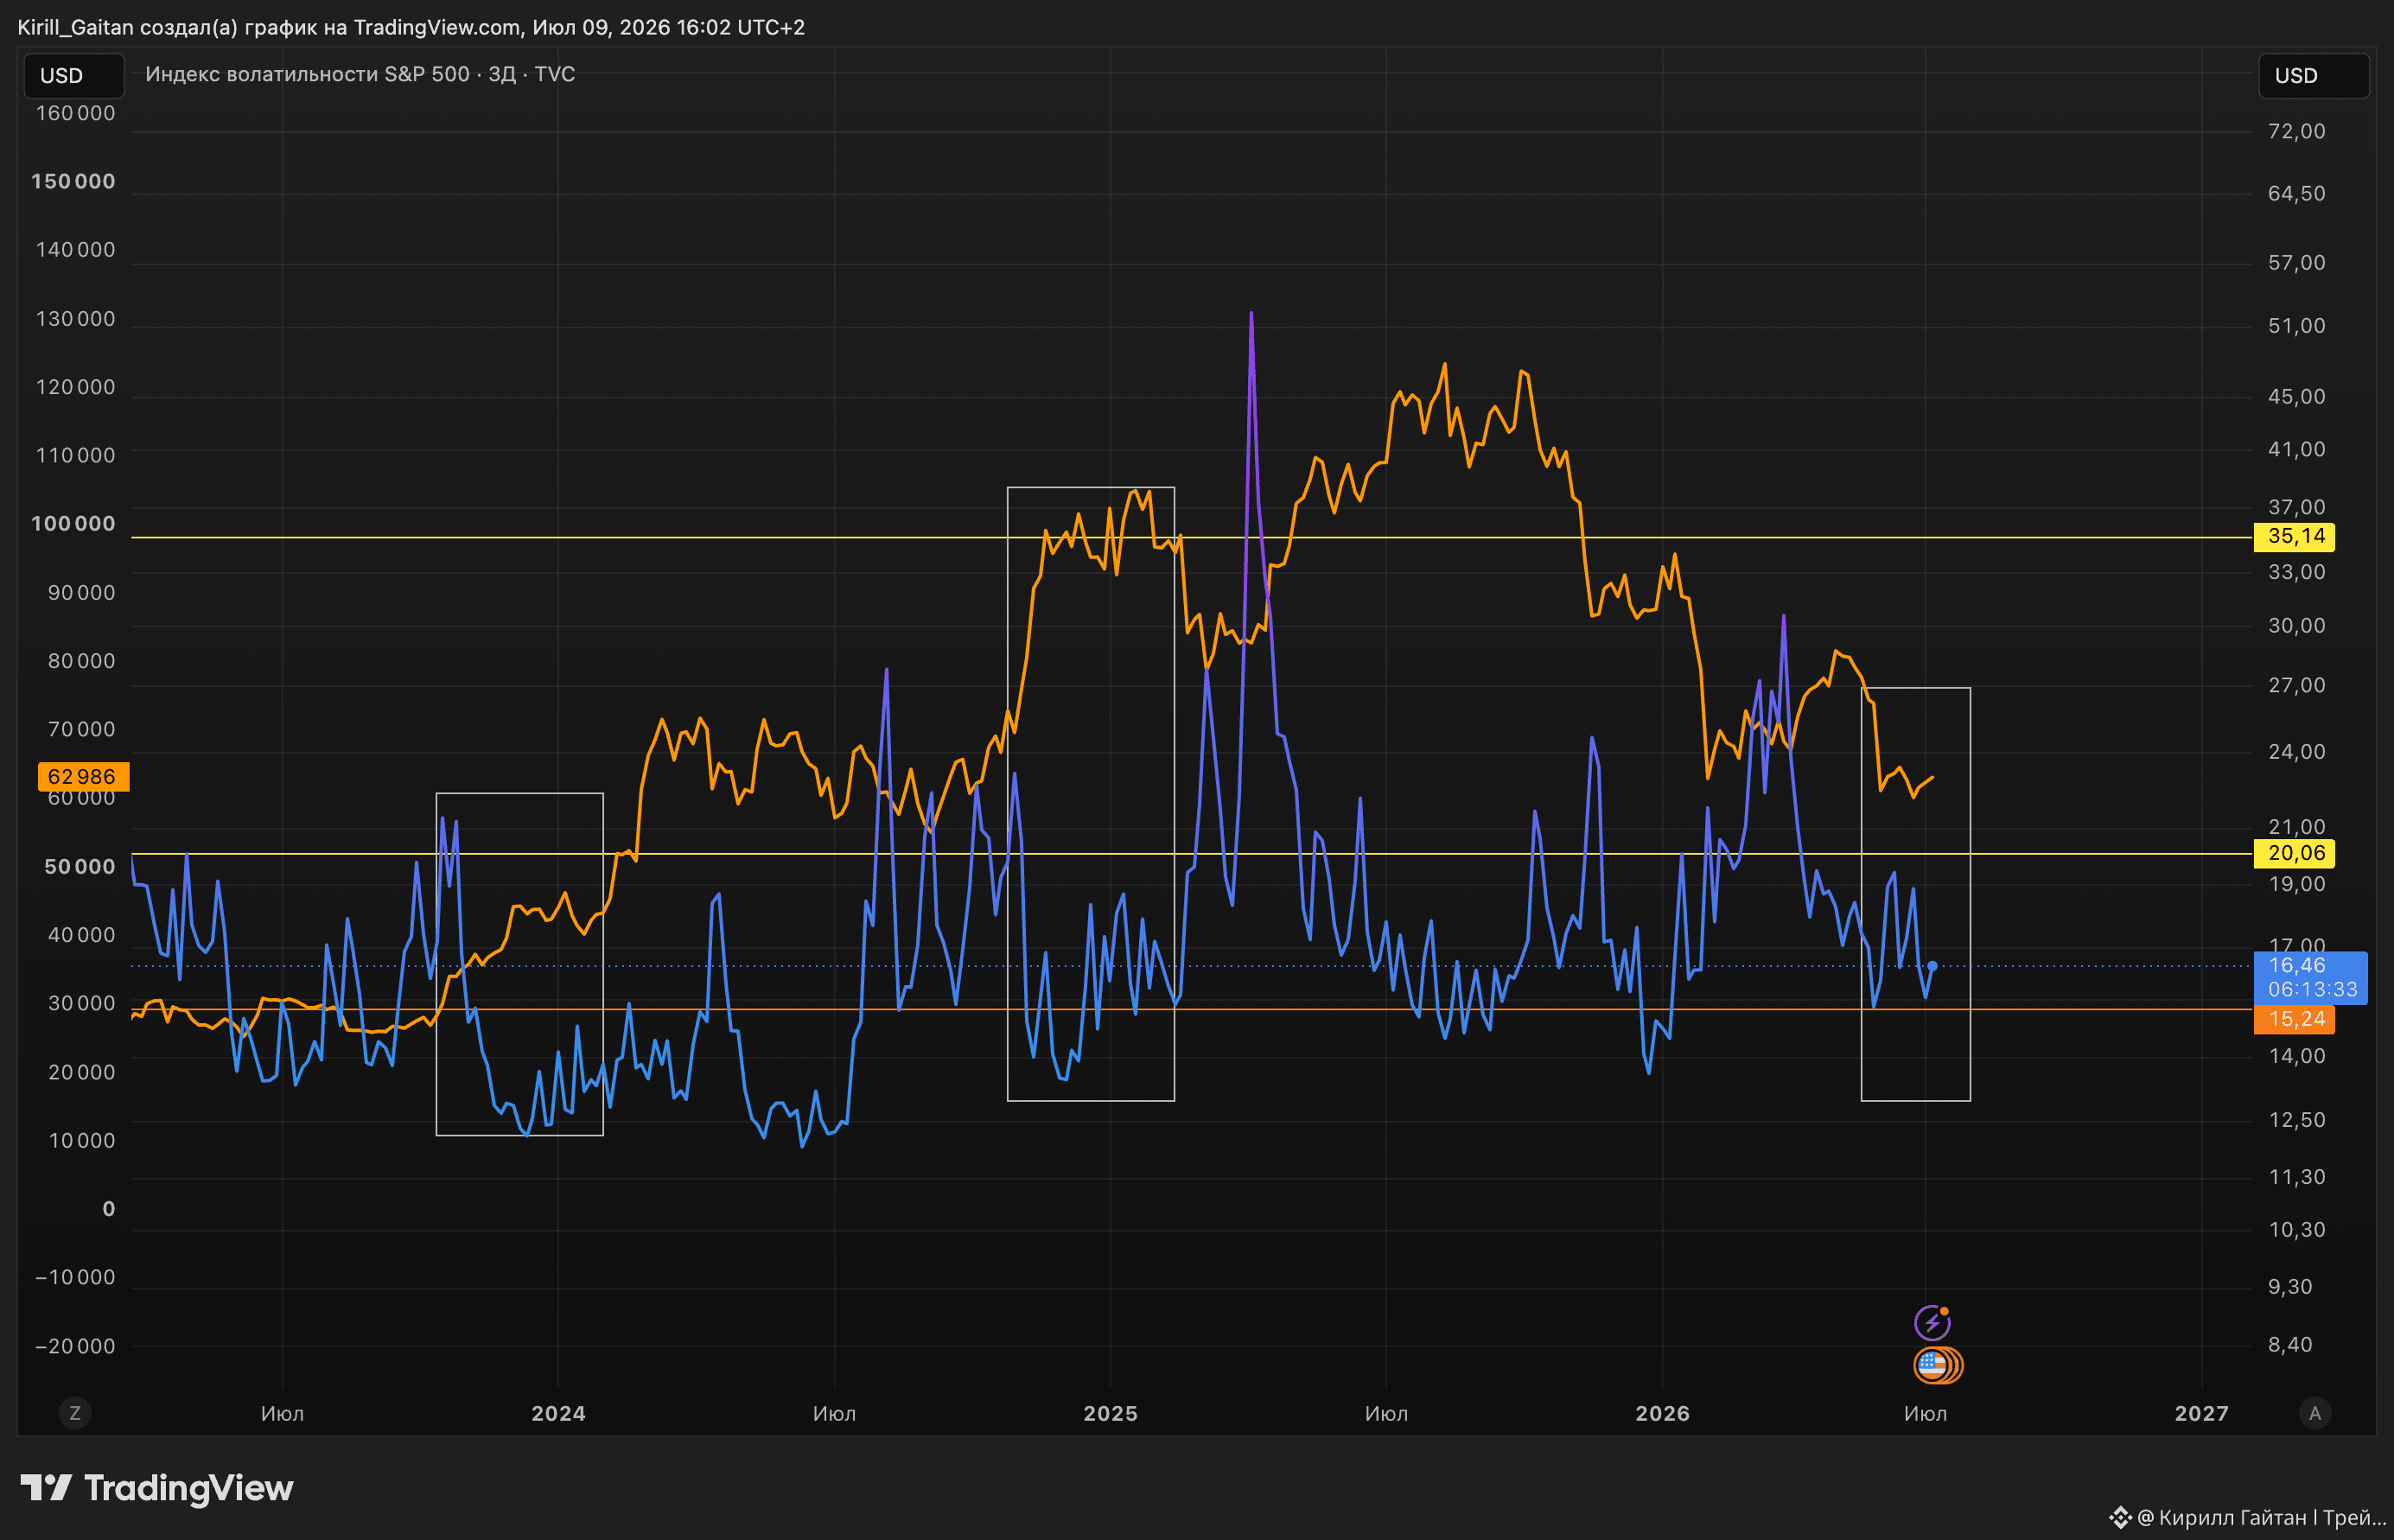

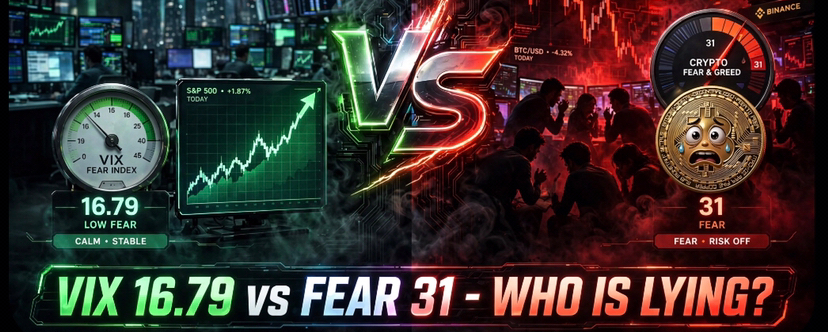
Article
🚨 Is the Fear Index lying? VIX collapses and crypto trembles.. what are the whales planning?Exclusive market snapshot right now overturns every expectation: the S&P 500 Fear Index VIX drops to 16.79, down -2.16%, while the Crypto Fear & Greed Index is stuck at 31 points in the Fear zone. A serious contradiction is happening for the first time in weeks.
At the same moment, U.S. indicators open on mixed footing: the S&P 500 at 7,530.79 up +0.21%, and the Nasdaq jumps +1.02% to 29,562, while the Dow slips -0.17%. The message is clear: fear evaporates from stocks but suffocates crypto.
🚨 Is the Fear Index lying? VIX collapses and crypto trembles.. what are the whales planning?
Exclusive market snapshot right now overturns every expectation: the S&P 500 Fear Index VIX drops to 16.79, down -2.16%, while the Crypto Fear & Greed Index is stuck at 31 points in the Fear zone. A serious contradiction is happening for the first time in weeks.
At the same moment, U.S. indicators open on mixed footing: the S&P 500 at 7,530.79 up +0.21%, and the Nasdaq jumps +1.02% to 29,562, while the Dow slips -0.17%. The message is clear: fear evaporates from stocks but suffocates crypto.
At the same moment, U.S. indicators open on mixed footing: the S&P 500 at 7,530.79 up +0.21%, and the Nasdaq jumps +1.02% to 29,562, while the Dow slips -0.17%. The message is clear: fear evaporates from stocks but suffocates crypto.
1
83
·
--
US Stocks | Knowledge Session | July 16
# VIX Fear Index: The Earthquake Detector in Your Wallet
Today, the VIX plunged 5% in a single day, hitting a intraday low of 15.67—this is a very worthwhile knowledge point to cover.
## What exactly is the VIX?
VIX stands for Volatility Index—commonly known in the streets as the “fear index.”
It doesn’t measure direction (up/down). Instead, it measures what level of volatility the market expects the S&P 500 to experience over the next 30 days.
Think of it this way:
- The VIX is like an earthquake detector. It doesn’t predict whether an earthquake will happen; it measures how intense the shaking is.
- VIX in the 15–20 range = the market thinks things are calm, “eat and sleep as usual.”
- VIX hitting 30+ = a typhoon day, everyone battening down.
- VIX suddenly breaking above 40 = doomsday mode. Numbers like this have been seen in 2008/2020/2022.
## Why is it important that the VIX fell to 15.67?
Today’s VIX was down 5.03% in a single day, meaning two things:
1. Both bulls and bears believe there won’t be big swings in the near term.
2. More people in the options market are willing to sell “insurance,” because they think nothing bad will happen.
Extremely low VIX usually corresponds to two scenarios:
- A slow bull market scenario: the best case—everyone feels comfortable.
- Calm before the storm: a danger signal—everyone gets relaxed, and when a sudden event hits, a fast “flash collapse” is more likely.
In 2017, the VIX stayed below 10 for a long time. Then in February 2018, the VIX suddenly “blew up”—a single-day surge of 115%. That snap drop wiped out many hedge funds that were short VIX.
## The link between the VIX and Crypto
The relationship between the VIX and BTC isn’t linear, but there are a few key observations:
- VIX < 20 (low fear): BTC trades more independently; money dares to go in, and the Meme season often kicks off.
- VIX 20–30: BTC follows the stock market; when the Nasdaq falls, BTC tends to fall too.
- VIX > 30: liquidity crisis—every risk asset gets dumped together, and Crypto often falls even harder.
Today, with VIX at 15.67, IBIT (BTC spot ETF) is up 0.63%, COIN is up 3.54%, and MSTR is up 3.8%—Crypto is partying together with US equities. This is a classic sign of risk appetite bouncing back.
## Practical advice
1. For spot/trend trading: low VIX is your friend. You can increase position size, but don’t use high leverage.
2. Use the VIX for risk control: if VIX jumps from 15 to 20+, be alert.
3. Hedging tools: in extreme fear, buy VIX call options or VXX; when shorting BTC, hedge.
4. Avoid shorting at low VIX levels: the VIX mean-reversion pattern is very strong.
## One-sentence summary
The VIX is the market’s mood thermometer. Today the “temperature” is 35°C (low-normal), and it feels comfortable. But don’t forget the lesson from the old guard: when the market feels the most comfortable, it’s often the moment when risk is highest.
Low VIX isn’t a signal to go all in—it’s a reminder to buckle your seatbelt before you add positions.
#VIX #BTC #美股 #加密货币 #神农笔记
US Stocks | Knowledge Session | July 16
# VIX Fear Index: The Earthquake Detector in Your Wallet
Today, the VIX plunged 5% in a single day, hitting a intraday low of 15.67—this is a very worthwhile knowledge point to cover.
## What exactly is the VIX?
VIX stands for Volatility Index—commonly known in the streets as the “fear index.”
It doesn’t measure direction (up/down). Instead, it measures what level of volatility the market expects the S&P 500 to experience over the next 30 days.
Think of it this way:
- The VIX is like an earthquake detector. It doesn’t predict whether an earthquake will happen; it measures how intense the shaking is.
- VIX in the 15–20 range = the market thinks things are calm, “eat and sleep as usual.”
- VIX hitting 30+ = a typhoon day, everyone battening down.
- VIX suddenly breaking above 40 = doomsday mode. Numbers like this have been seen in 2008/2020/2022.
## Why is it important that the VIX fell to 15.67?
Today’s VIX was down 5.03% in a single day, meaning two things:
1. Both bulls and bears believe there won’t be big swings in the near term.
2. More people in the options market are willing to sell “insurance,” because they think nothing bad will happen.
Extremely low VIX usually corresponds to two scenarios:
- A slow bull market scenario: the best case—everyone feels comfortable.
- Calm before the storm: a danger signal—everyone gets relaxed, and when a sudden event hits, a fast “flash collapse” is more likely.
In 2017, the VIX stayed below 10 for a long time. Then in February 2018, the VIX suddenly “blew up”—a single-day surge of 115%. That snap drop wiped out many hedge funds that were short VIX.
## The link between the VIX and Crypto
The relationship between the VIX and BTC isn’t linear, but there are a few key observations:
- VIX < 20 (low fear): BTC trades more independently; money dares to go in, and the Meme season often kicks off.
- VIX 20–30: BTC follows the stock market; when the Nasdaq falls, BTC tends to fall too.
- VIX > 30: liquidity crisis—every risk asset gets dumped together, and Crypto often falls even harder.
Today, with VIX at 15.67, IBIT (BTC spot ETF) is up 0.63%, COIN is up 3.54%, and MSTR is up 3.8%—Crypto is partying together with US equities. This is a classic sign of risk appetite bouncing back.
## Practical advice
1. For spot/trend trading: low VIX is your friend. You can increase position size, but don’t use high leverage.
2. Use the VIX for risk control: if VIX jumps from 15 to 20+, be alert.
3. Hedging tools: in extreme fear, buy VIX call options or VXX; when shorting BTC, hedge.
4. Avoid shorting at low VIX levels: the VIX mean-reversion pattern is very strong.
## One-sentence summary
The VIX is the market’s mood thermometer. Today the “temperature” is 35°C (low-normal), and it feels comfortable. But don’t forget the lesson from the old guard: when the market feels the most comfortable, it’s often the moment when risk is highest.
Low VIX isn’t a signal to go all in—it’s a reminder to buckle your seatbelt before you add positions.
#VIX #BTC #美股 #加密货币 #神农笔记
# VIX Fear Index: The Earthquake Detector in Your Wallet
Today, the VIX plunged 5% in a single day, hitting a intraday low of 15.67—this is a very worthwhile knowledge point to cover.
## What exactly is the VIX?
VIX stands for Volatility Index—commonly known in the streets as the “fear index.”
It doesn’t measure direction (up/down). Instead, it measures what level of volatility the market expects the S&P 500 to experience over the next 30 days.
Think of it this way:
- The VIX is like an earthquake detector. It doesn’t predict whether an earthquake will happen; it measures how intense the shaking is.
- VIX in the 15–20 range = the market thinks things are calm, “eat and sleep as usual.”
- VIX hitting 30+ = a typhoon day, everyone battening down.
- VIX suddenly breaking above 40 = doomsday mode. Numbers like this have been seen in 2008/2020/2022.
## Why is it important that the VIX fell to 15.67?
Today’s VIX was down 5.03% in a single day, meaning two things:
1. Both bulls and bears believe there won’t be big swings in the near term.
2. More people in the options market are willing to sell “insurance,” because they think nothing bad will happen.
Extremely low VIX usually corresponds to two scenarios:
- A slow bull market scenario: the best case—everyone feels comfortable.
- Calm before the storm: a danger signal—everyone gets relaxed, and when a sudden event hits, a fast “flash collapse” is more likely.
In 2017, the VIX stayed below 10 for a long time. Then in February 2018, the VIX suddenly “blew up”—a single-day surge of 115%. That snap drop wiped out many hedge funds that were short VIX.
## The link between the VIX and Crypto
The relationship between the VIX and BTC isn’t linear, but there are a few key observations:
- VIX < 20 (low fear): BTC trades more independently; money dares to go in, and the Meme season often kicks off.
- VIX 20–30: BTC follows the stock market; when the Nasdaq falls, BTC tends to fall too.
- VIX > 30: liquidity crisis—every risk asset gets dumped together, and Crypto often falls even harder.
Today, with VIX at 15.67, IBIT (BTC spot ETF) is up 0.63%, COIN is up 3.54%, and MSTR is up 3.8%—Crypto is partying together with US equities. This is a classic sign of risk appetite bouncing back.
## Practical advice
1. For spot/trend trading: low VIX is your friend. You can increase position size, but don’t use high leverage.
2. Use the VIX for risk control: if VIX jumps from 15 to 20+, be alert.
3. Hedging tools: in extreme fear, buy VIX call options or VXX; when shorting BTC, hedge.
4. Avoid shorting at low VIX levels: the VIX mean-reversion pattern is very strong.
## One-sentence summary
The VIX is the market’s mood thermometer. Today the “temperature” is 35°C (low-normal), and it feels comfortable. But don’t forget the lesson from the old guard: when the market feels the most comfortable, it’s often the moment when risk is highest.
Low VIX isn’t a signal to go all in—it’s a reminder to buckle your seatbelt before you add positions.
#VIX #BTC #美股 #加密货币 #神农笔记
80
Log in to explore more content
Join global crypto users on Binance Square
⚡️ Get latest and useful information about crypto.
💬 Trusted by the world’s largest crypto exchange.
👍 Discover real insights from verified creators.
Email / Phone number
Trending Topics
1
#AppleDebutsFoldablePhone
12,518 views
278 Discussing
2
#EUExtendsCentralContactPointToCASPs
773 views
53 Discussing
3
#US10YTreasuryYieldHitsHighestSinceNov2023
15,584 views
281 Discussing
4
#USTreasuryToBuyBackUpTo$6BLongDatedDebt
12,495 views
153 Discussing
5
#BitcoinSurpasses$79K
61,220 views
266 Discussing
6
#BrentCrudeTops$100
117,023 views
391 Discussing
7
#USADPWeeklyEmploymentRises12000
97,703 views
1,185 Discussing
8
#BankOfAmericaGroupPilotsUSBDCStablecoin
71,489 views
963 Discussing
9
#RippleLobbiesToAdvanceCLARITYActVote
106,526 views
1,241 Discussing
10
#GrayscaleZcashETFTops$500M
17,340 views
125 Discussing