
無名先生
454 Posts

無名先生
 Square Verified
Report
Block User
Cryptocurrency、金融分析師、信息搬運工 、合作DM 、主攻領域、#Airdrops
2 Following
1.1K+ Followers
346 Liked
Posts
All
Videos
·
--
#BTC
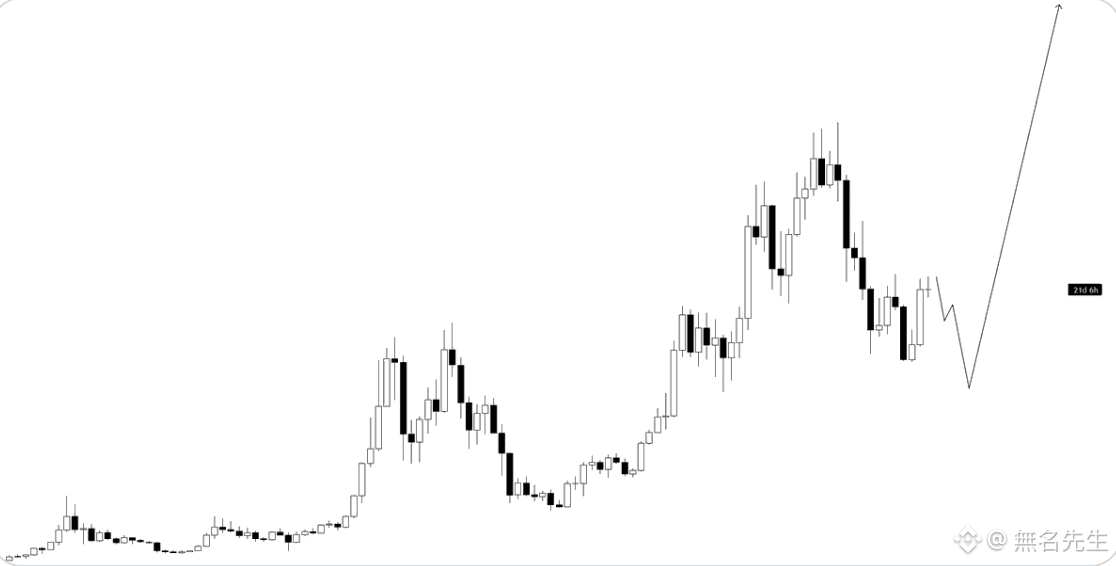
Every time it rises, they say to wait for a pullback and then buy.
When the pullback actually comes, they think it will go even lower.
By the time the price has moved too far, they finally realize they didn’t do anything.
#BTC
Every time it rises, they say to wait for a pullback and then buy.
When the pullback actually comes, they think it will go even lower.
By the time the price has moved too far, they finally realize they didn’t do anything.
Every time it rises, they say to wait for a pullback and then buy.
When the pullback actually comes, they think it will go even lower.
By the time the price has moved too far, they finally realize they didn’t do anything.
65
·
--
#BTC
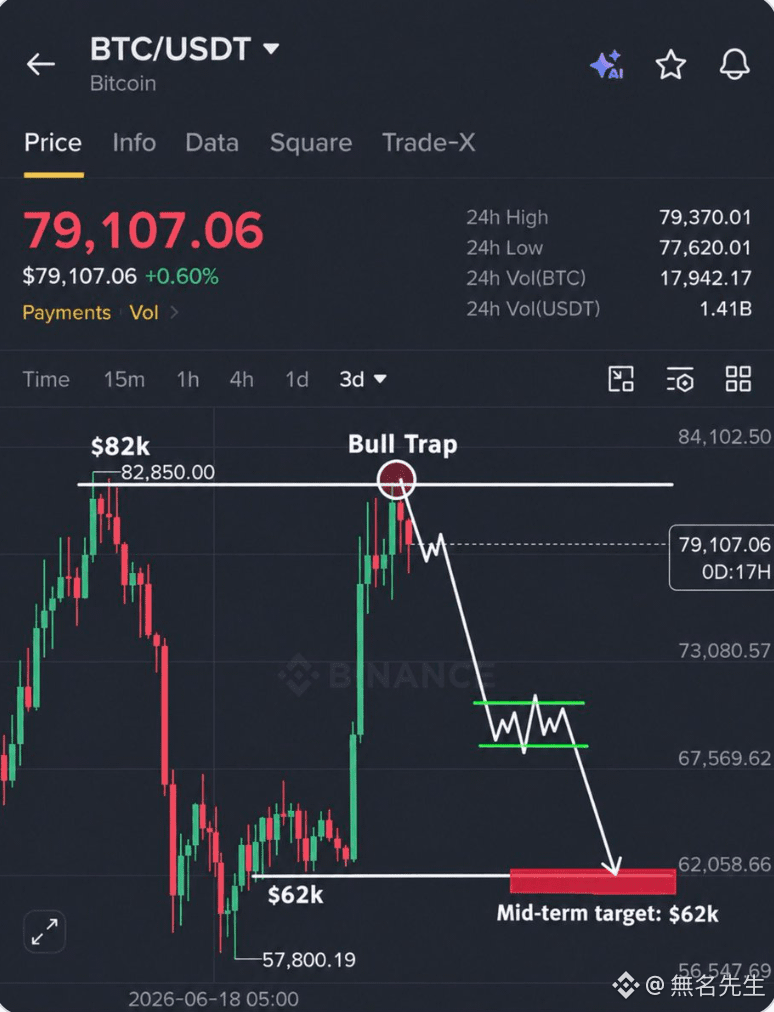
The 78K level isn’t fully established yet—the lower target hasn’t changed.
At 72K, 66K, and 62K, every step corresponds to a liquidity zone.
Only at the final level is it truly the right time to take action.
All the previous turning points were mentioned in advance—this time is the same.
#BTC
The 78K level isn’t fully established yet—the lower target hasn’t changed.
At 72K, 66K, and 62K, every step corresponds to a liquidity zone.
Only at the final level is it truly the right time to take action.
All the previous turning points were mentioned in advance—this time is the same.
The 78K level isn’t fully established yet—the lower target hasn’t changed.
At 72K, 66K, and 62K, every step corresponds to a liquidity zone.
Only at the final level is it truly the right time to take action.
All the previous turning points were mentioned in advance—this time is the same.
107
·
--
#BTC
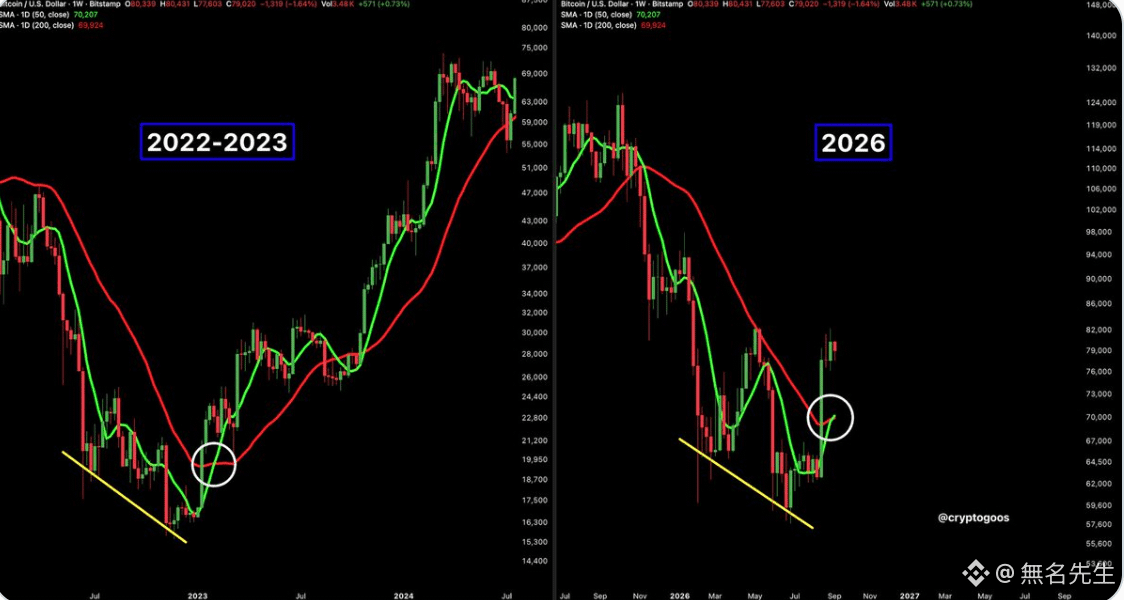
Bullish divergence plus a golden cross—both signals appeared at the same time.
Last time, this combination was in early 2023, and after that there was a whole round of a major market move.
This time, the structure really does have some similarities, but it won’t necessarily play out exactly the same every time.
As for the direction, I agree—but the timing still has to be watched.
#BTC
Bullish divergence plus a golden cross—both signals appeared at the same time.
Last time, this combination was in early 2023, and after that there was a whole round of a major market move.
This time, the structure really does have some similarities, but it won’t necessarily play out exactly the same every time.
As for the direction, I agree—but the timing still has to be watched.
Bullish divergence plus a golden cross—both signals appeared at the same time.
Last time, this combination was in early 2023, and after that there was a whole round of a major market move.
This time, the structure really does have some similarities, but it won’t necessarily play out exactly the same every time.
As for the direction, I agree—but the timing still has to be watched.
1
1.6k
·
--
#BTC
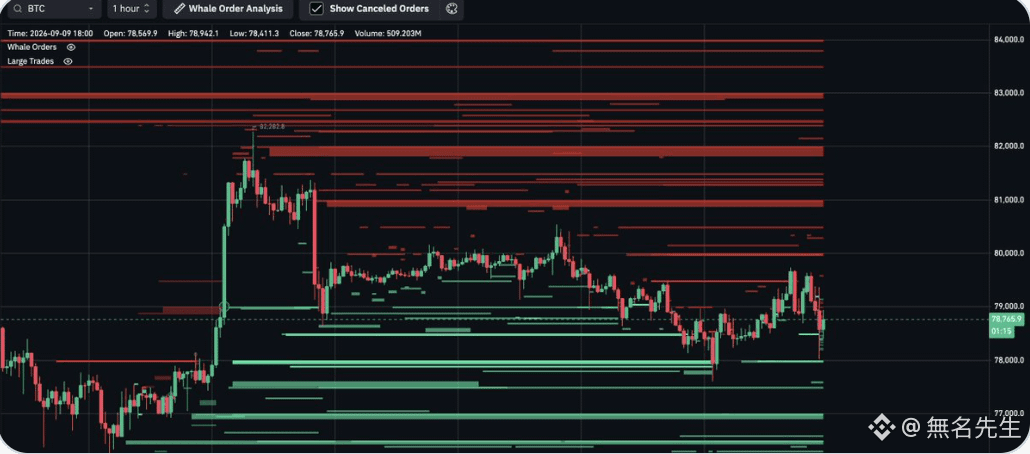
83K has large sell orders stacked above, and every time the price nears, it gets pushed back.
The whales’ defense here is obvious—they don’t want the price to break through.
But how long the line can hold is another matter. Once the sell orders are depleted, the direction may change.
Right now, it’s a matter of who runs out of support first—bulls or bears.
#BTC
83K has large sell orders stacked above, and every time the price nears, it gets pushed back.
The whales’ defense here is obvious—they don’t want the price to break through.
But how long the line can hold is another matter. Once the sell orders are depleted, the direction may change.
Right now, it’s a matter of who runs out of support first—bulls or bears.
83K has large sell orders stacked above, and every time the price nears, it gets pushed back.
The whales’ defense here is obvious—they don’t want the price to break through.
But how long the line can hold is another matter. Once the sell orders are depleted, the direction may change.
Right now, it’s a matter of who runs out of support first—bulls or bears.
76
·
--
#BTC #ETH #SOL #XRP
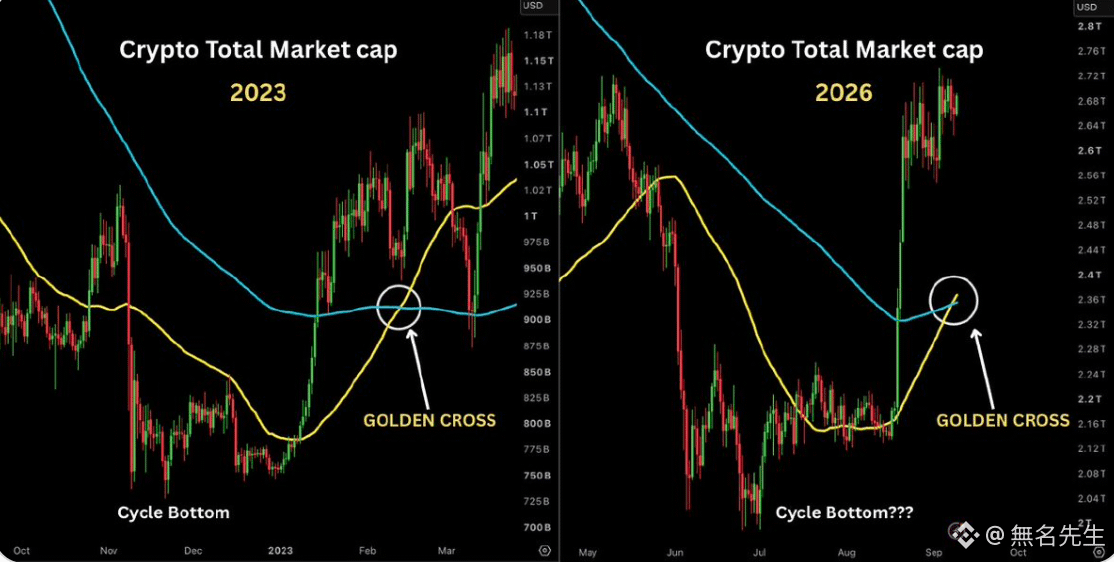
The total market cap has just formed a golden cross. Historically, this signal has appeared at nodes where a trend reversal occurs.
However, there have also been cases where after the golden cross, there was first a pullback. It doesn’t mean it will rally immediately.
First, see whether it can hold steady—then watch for what follows.
#BTC #ETH #SOL #XRP
The total market cap has just formed a golden cross. Historically, this signal has appeared at nodes where a trend reversal occurs.
However, there have also been cases where after the golden cross, there was first a pullback. It doesn’t mean it will rally immediately.
First, see whether it can hold steady—then watch for what follows.
The total market cap has just formed a golden cross. Historically, this signal has appeared at nodes where a trend reversal occurs.
However, there have also been cases where after the golden cross, there was first a pullback. It doesn’t mean it will rally immediately.
First, see whether it can hold steady—then watch for what follows.
1
370
·
--
#BTC
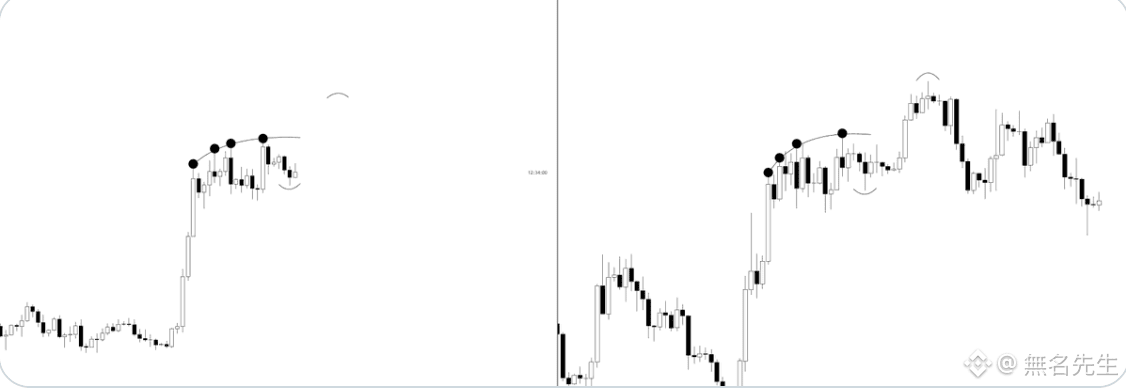
77.6KIf you can hold on and form a higher low, then the structure will look a lot like that stretch in 2022.
Once it’s confirmed, I’ll consider hedging with short positions near the upper end of the range to lock in part of the profit.
For now, I still hold the long positions. No rush—just waiting for the signal.
#BTC
77.6KIf you can hold on and form a higher low, then the structure will look a lot like that stretch in 2022.
Once it’s confirmed, I’ll consider hedging with short positions near the upper end of the range to lock in part of the profit.
For now, I still hold the long positions. No rush—just waiting for the signal.
77.6KIf you can hold on and form a higher low, then the structure will look a lot like that stretch in 2022.
Once it’s confirmed, I’ll consider hedging with short positions near the upper end of the range to lock in part of the profit.
For now, I still hold the long positions. No rush—just waiting for the signal.
209
·
--
#ETH
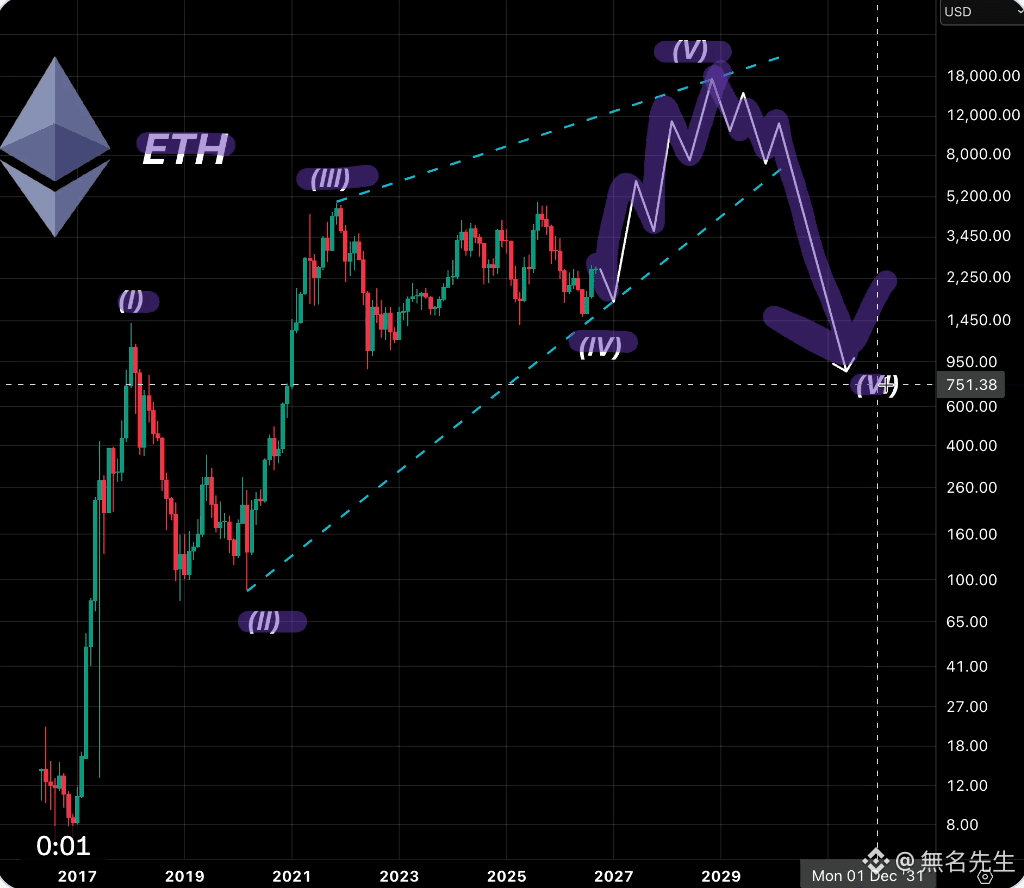
This claim is a bit too overconfident.
ETH does indeed have the potential to go through a major bull run, but nobody can predict “the biggest bull market in history” before the market actually starts moving.
Also, the wording “final stage” implies that you already know the ending in advance, which isn’t very realistic.
I prefer to look at structure and position, rather than use an absolute framework to confine the market.
#ETH
This claim is a bit too overconfident.
ETH does indeed have the potential to go through a major bull run, but nobody can predict “the biggest bull market in history” before the market actually starts moving.
Also, the wording “final stage” implies that you already know the ending in advance, which isn’t very realistic.
I prefer to look at structure and position, rather than use an absolute framework to confine the market.
This claim is a bit too overconfident.
ETH does indeed have the potential to go through a major bull run, but nobody can predict “the biggest bull market in history” before the market actually starts moving.
Also, the wording “final stage” implies that you already know the ending in advance, which isn’t very realistic.
I prefer to look at structure and position, rather than use an absolute framework to confine the market.
1
273
·
--
#BTC #ETH #SOL #XRP
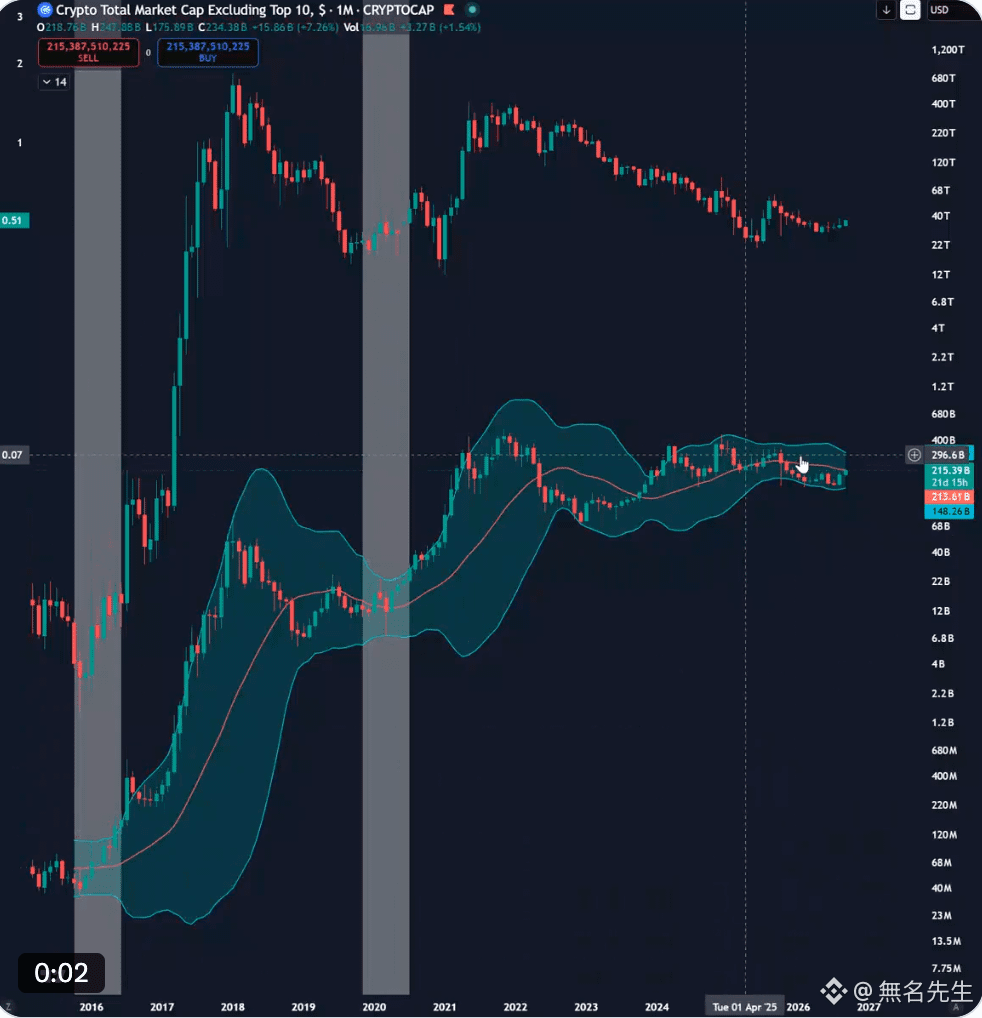
Back in 2020, the knockoffs had been going nowhere for a long time before they finally started to move.
The situation now is quite close to then, and there are similarities in terms of timing.
I’m not sure it will be an exact replication, but the odds are higher that the direction will be similar.
Enter in batches—don’t put it all on one bet.
#BTC #ETH #SOL #XRP
Back in 2020, the knockoffs had been going nowhere for a long time before they finally started to move.
The situation now is quite close to then, and there are similarities in terms of timing.
I’m not sure it will be an exact replication, but the odds are higher that the direction will be similar.
Enter in batches—don’t put it all on one bet.
Back in 2020, the knockoffs had been going nowhere for a long time before they finally started to move.
The situation now is quite close to then, and there are similarities in terms of timing.
I’m not sure it will be an exact replication, but the odds are higher that the direction will be similar.
Enter in batches—don’t put it all on one bet.
271
·
--
#LAPTOP
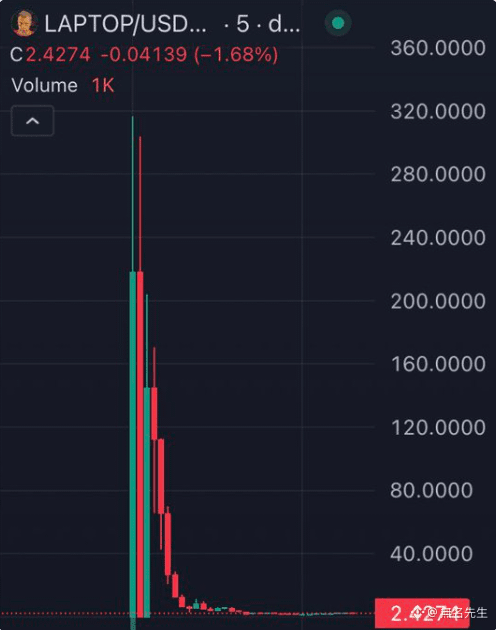
It dropped 99% in just two hours after going live.
The project team itself said in advance that it has no practical value and no roadmap, so buyers may end up losing their entire principal.
The risk warning is stated clearly.
#LAPTOP
It dropped 99% in just two hours after going live.
The project team itself said in advance that it has no practical value and no roadmap, so buyers may end up losing their entire principal.
The risk warning is stated clearly.
It dropped 99% in just two hours after going live.
The project team itself said in advance that it has no practical value and no roadmap, so buyers may end up losing their entire principal.
The risk warning is stated clearly.

318
·
--
#ETH
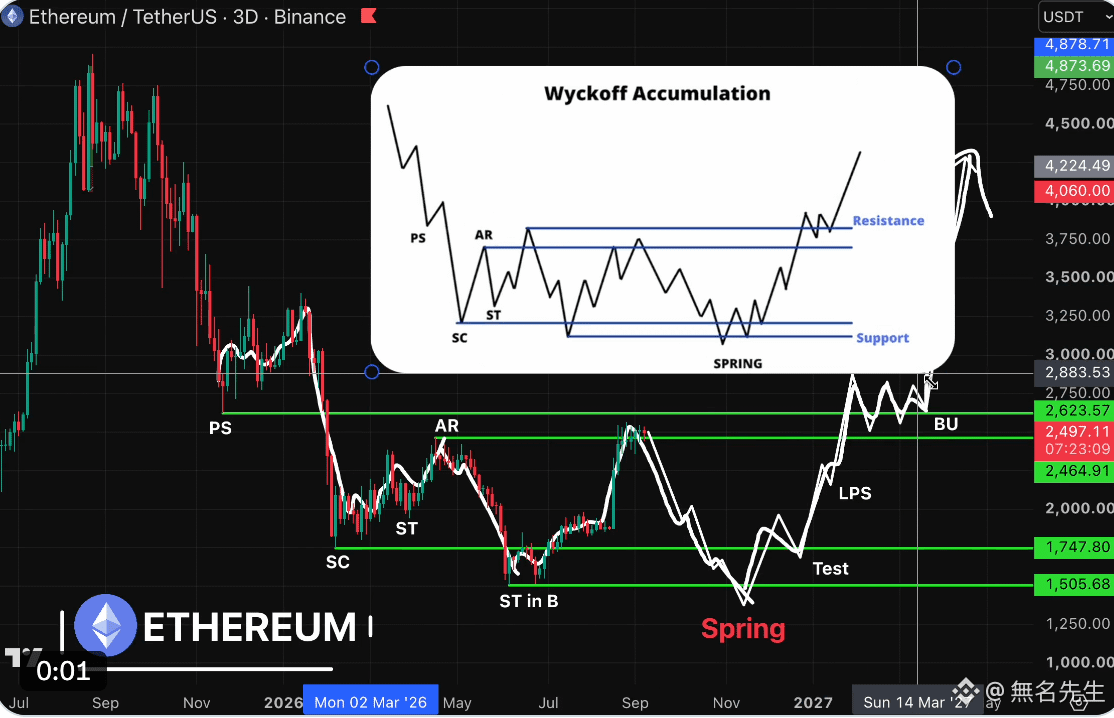
2500 is indeed the resistance testing area in the Wyckoff framework—there’s no issue with that assessment.
But then dropping straight to 1300 and pulling back to 4000 assumes the market will follow a single pattern exactly.
If this round of the macro environment is different from 2025, the bottom may never reach that level at all.
#ETH
2500 is indeed the resistance testing area in the Wyckoff framework—there’s no issue with that assessment.
But then dropping straight to 1300 and pulling back to 4000 assumes the market will follow a single pattern exactly.
If this round of the macro environment is different from 2025, the bottom may never reach that level at all.
2500 is indeed the resistance testing area in the Wyckoff framework—there’s no issue with that assessment.
But then dropping straight to 1300 and pulling back to 4000 assumes the market will follow a single pattern exactly.
If this round of the macro environment is different from 2025, the bottom may never reach that level at all.
189
·
--
#BTC #ETH #SOL #XRP
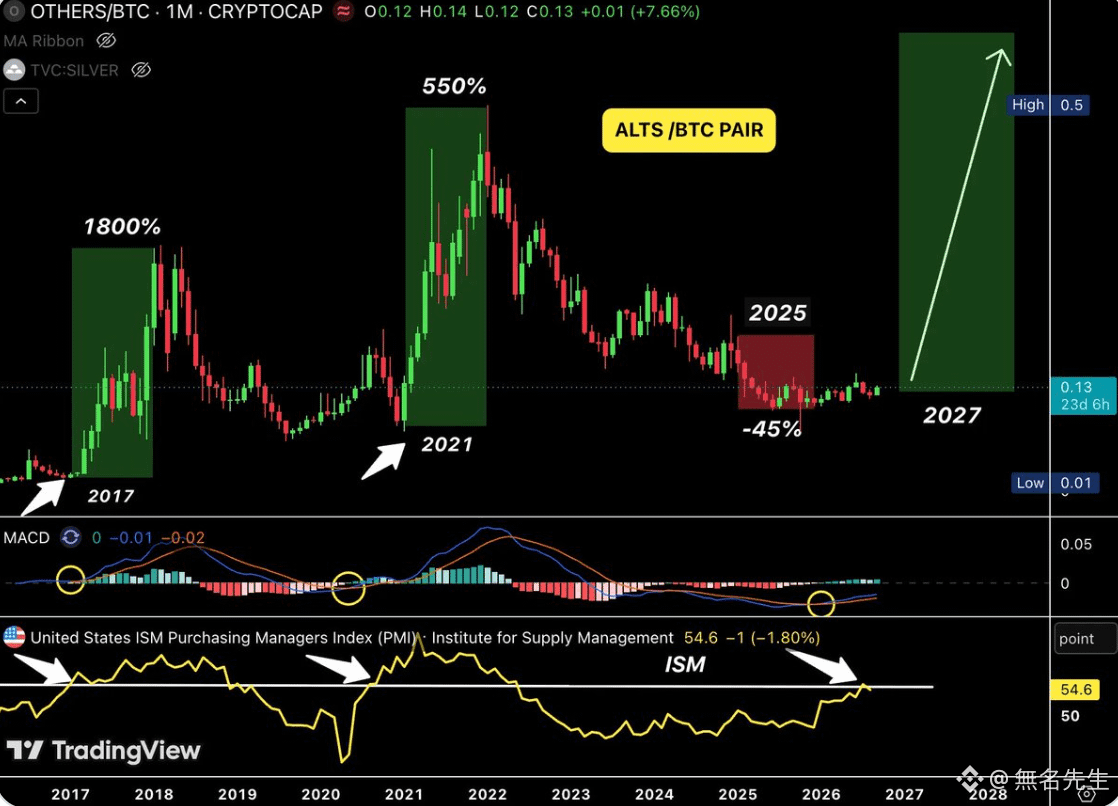
In 2025, the imitation coin didn’t break through; it’s not that the market isn’t working—ISM has been kept below 50 for a long time.
Now this indicator has returned to above 54. Historically, whenever it rises, the exchange rate between the imitation coin and Bitcoin has been able to break out into a major rally.
It rose 1,800% in 2017 and 550% in 2021. It’s not a coincidence—it’s the transmission of the liquidity cycle.
#BTC #ETH #SOL #XRP
In 2025, the imitation coin didn’t break through; it’s not that the market isn’t working—ISM has been kept below 50 for a long time.
Now this indicator has returned to above 54. Historically, whenever it rises, the exchange rate between the imitation coin and Bitcoin has been able to break out into a major rally.
It rose 1,800% in 2017 and 550% in 2021. It’s not a coincidence—it’s the transmission of the liquidity cycle.
In 2025, the imitation coin didn’t break through; it’s not that the market isn’t working—ISM has been kept below 50 for a long time.
Now this indicator has returned to above 54. Historically, whenever it rises, the exchange rate between the imitation coin and Bitcoin has been able to break out into a major rally.
It rose 1,800% in 2017 and 550% in 2021. It’s not a coincidence—it’s the transmission of the liquidity cycle.
349
·
--
#ETH
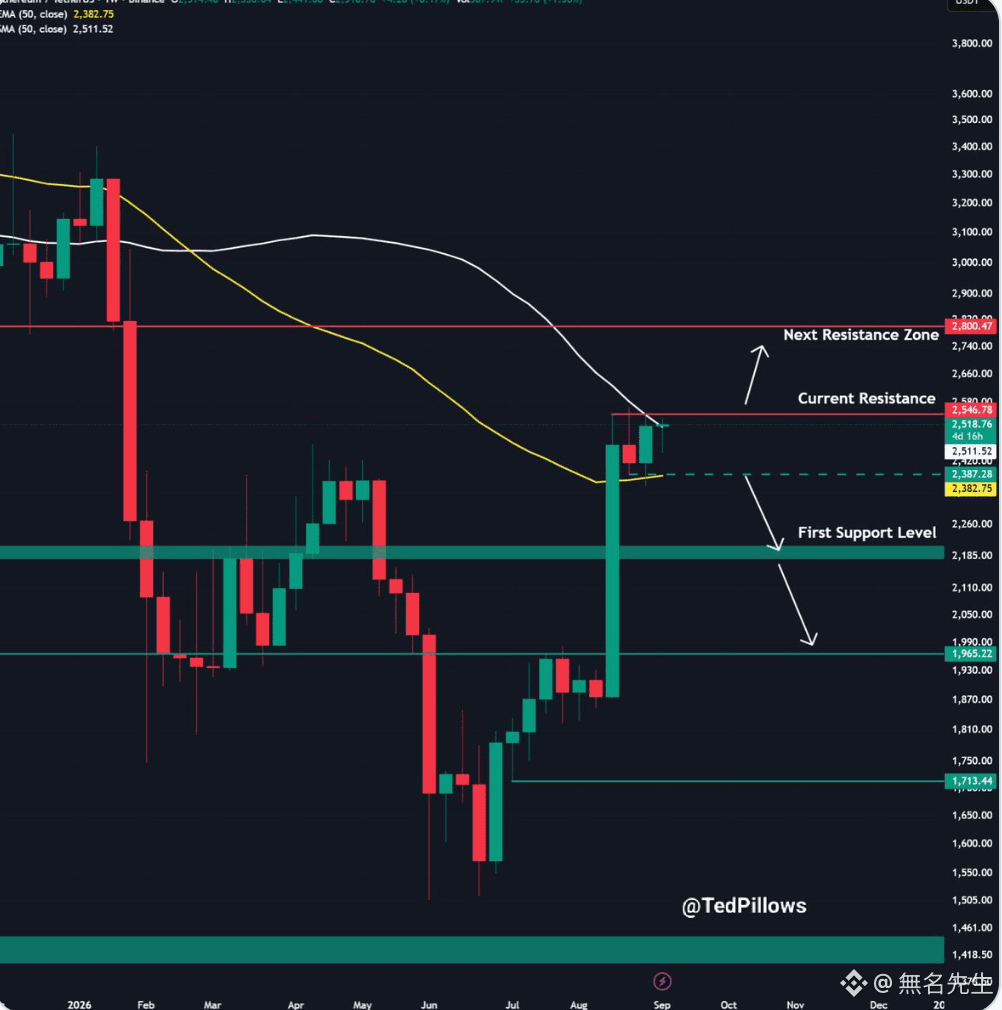
Once again testing 2550; this is the third time in the past few weeks.
Each time it reaches this level, there is selling pressure, but the lows are being pushed higher.
If this time it can close back up, the structure will change.
#ETH
Once again testing 2550; this is the third time in the past few weeks.
Each time it reaches this level, there is selling pressure, but the lows are being pushed higher.
If this time it can close back up, the structure will change.
Once again testing 2550; this is the third time in the past few weeks.
Each time it reaches this level, there is selling pressure, but the lows are being pushed higher.
If this time it can close back up, the structure will change.
237
·
--
#BTC
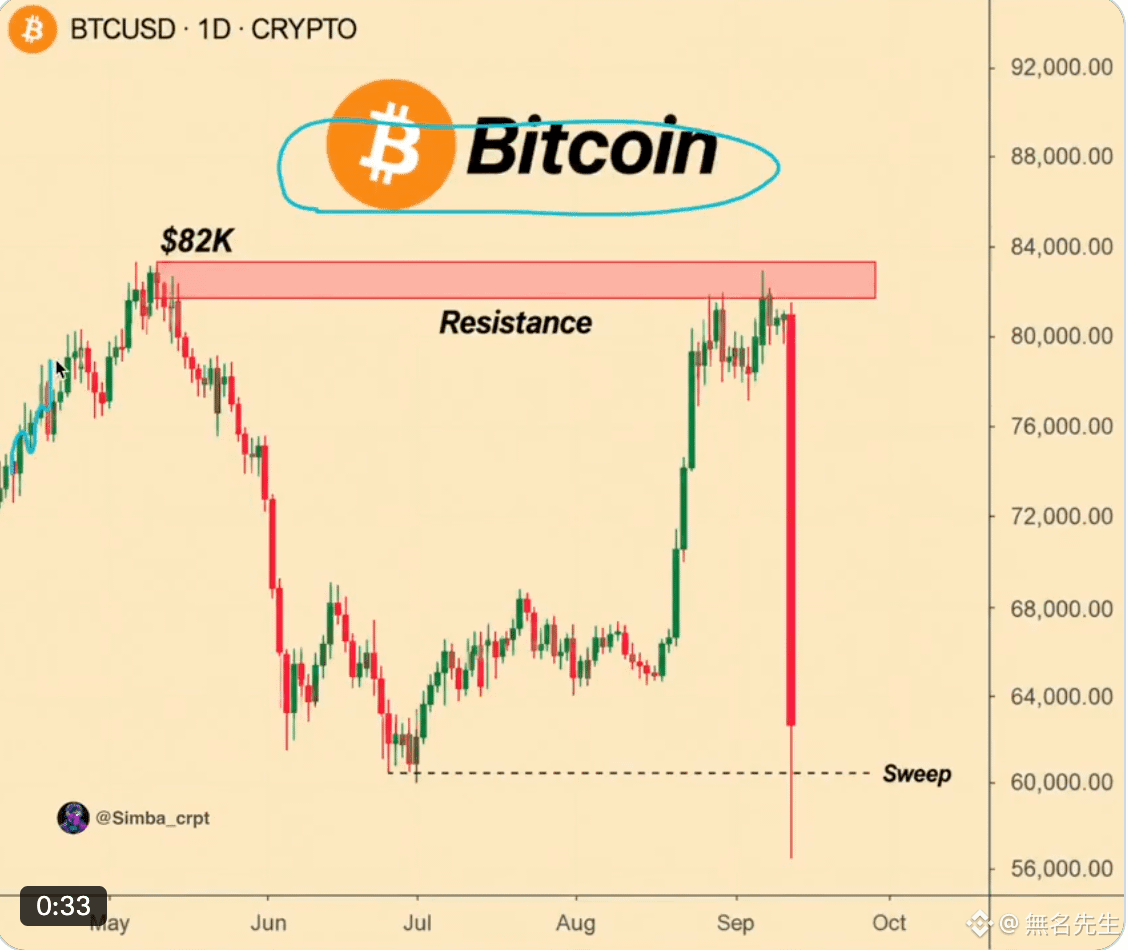
82K this segment is moving too fast. After a rapid rise, if there isn’t enough follow-through, the pullback will also happen quickly.
The price is moving sideways between 79K and 81K, and the market is waiting for direction.
But the longer it stays range-bound, the more sell pressure may build up. Once it’s triggered, it could turn into a big bullish candle.
I don’t think it will slowly drift down; more likely, there will be one move line that leaves the longs stunned.
#BTC
82K this segment is moving too fast. After a rapid rise, if there isn’t enough follow-through, the pullback will also happen quickly.
The price is moving sideways between 79K and 81K, and the market is waiting for direction.
But the longer it stays range-bound, the more sell pressure may build up. Once it’s triggered, it could turn into a big bullish candle.
I don’t think it will slowly drift down; more likely, there will be one move line that leaves the longs stunned.
82K this segment is moving too fast. After a rapid rise, if there isn’t enough follow-through, the pullback will also happen quickly.
The price is moving sideways between 79K and 81K, and the market is waiting for direction.
But the longer it stays range-bound, the more sell pressure may build up. Once it’s triggered, it could turn into a big bullish candle.
I don’t think it will slowly drift down; more likely, there will be one move line that leaves the longs stunned.
88
·
--
#BTC
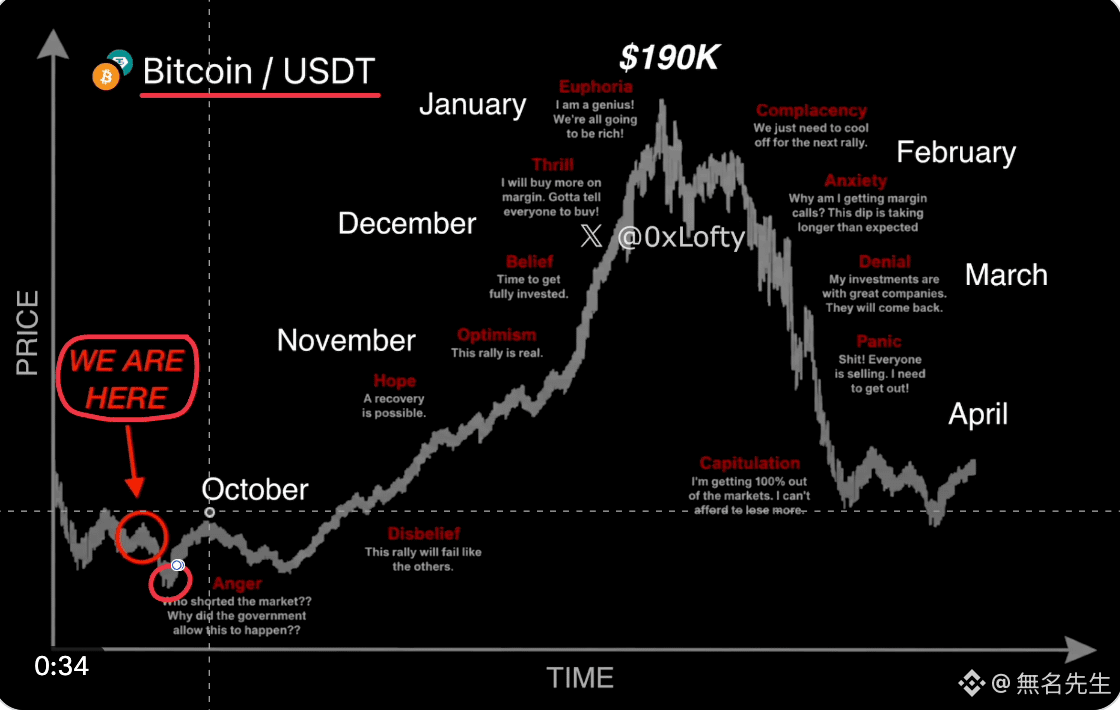
If we follow this pace, from September to October will be the final round of cleanup, and only then will we enter the true bottom area.
But I don’t think that bottom will go very deep. If institutions are entering the market gradually, the downside room for price may be more limited than expected.
The timing and magnitude don’t necessarily align exactly, but the direction—down first then up—I agree with.
#BTC
If we follow this pace, from September to October will be the final round of cleanup, and only then will we enter the true bottom area.
But I don’t think that bottom will go very deep. If institutions are entering the market gradually, the downside room for price may be more limited than expected.
The timing and magnitude don’t necessarily align exactly, but the direction—down first then up—I agree with.
If we follow this pace, from September to October will be the final round of cleanup, and only then will we enter the true bottom area.
But I don’t think that bottom will go very deep. If institutions are entering the market gradually, the downside room for price may be more limited than expected.
The timing and magnitude don’t necessarily align exactly, but the direction—down first then up—I agree with.
4
4
2.2k
·
--
#BTC
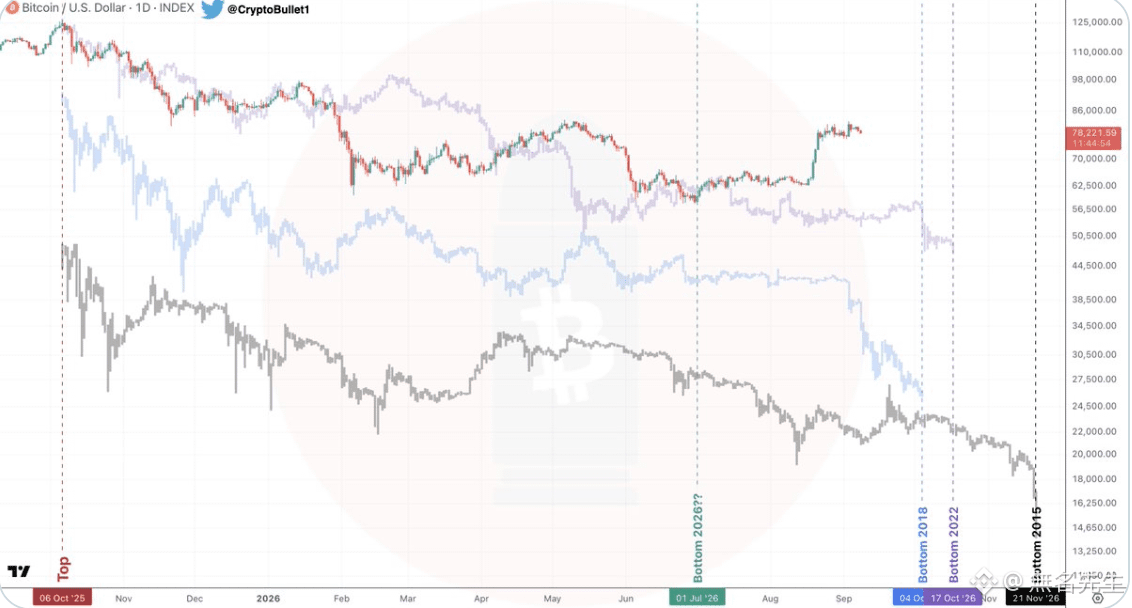
57,750 If it truly is the bottom, then this bear market would be the shortest in history.
But looking at the time window, there are corresponding historical bottom dates in October and November as well—it's not that it's certain, but structurally this possibility exists.
I’m setting December 1st as the timeline for going fully long. Until then, I will retain some flexibility.
It’s not ruled out that it could go lower, and it’s also not ruled out that it has already bottomed out—we’ll take it one step at a time.
#BTC
57,750 If it truly is the bottom, then this bear market would be the shortest in history.
But looking at the time window, there are corresponding historical bottom dates in October and November as well—it's not that it's certain, but structurally this possibility exists.
I’m setting December 1st as the timeline for going fully long. Until then, I will retain some flexibility.
It’s not ruled out that it could go lower, and it’s also not ruled out that it has already bottomed out—we’ll take it one step at a time.
57,750 If it truly is the bottom, then this bear market would be the shortest in history.
But looking at the time window, there are corresponding historical bottom dates in October and November as well—it's not that it's certain, but structurally this possibility exists.
I’m setting December 1st as the timeline for going fully long. Until then, I will retain some flexibility.
It’s not ruled out that it could go lower, and it’s also not ruled out that it has already bottomed out—we’ll take it one step at a time.
186
·
--
#BTC
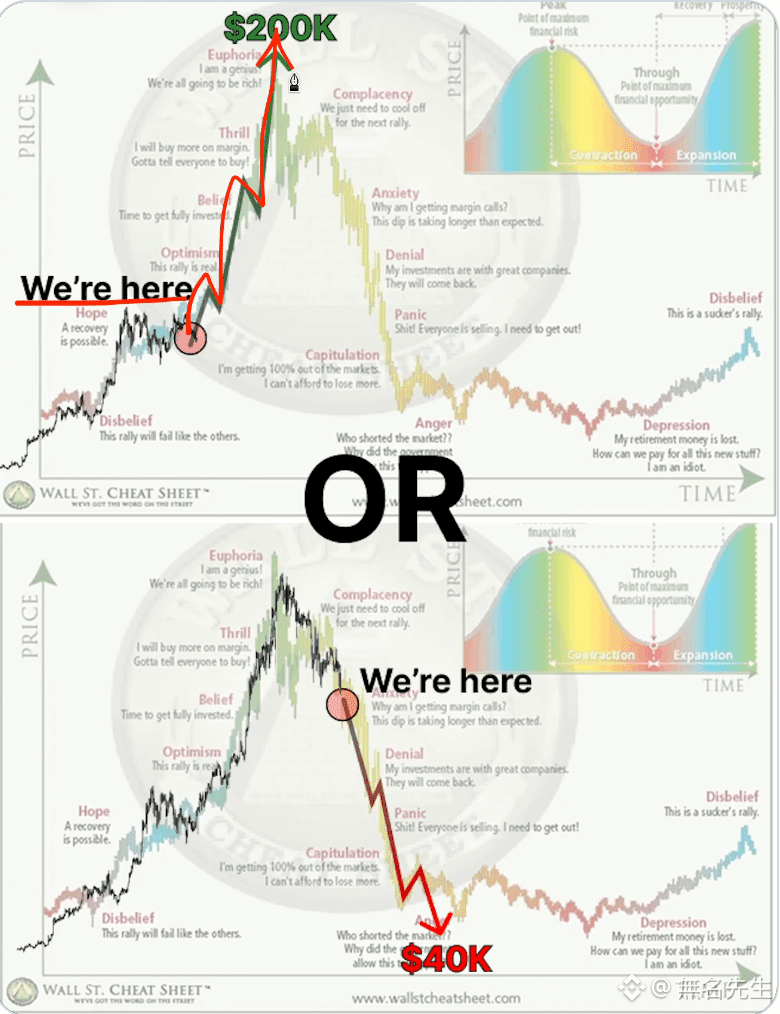
Many of the people shouting about 40K are actually the same traders who were shouting about 200K last year. The strategy hasn’t changed—only the direction.
In the short term, there really is a possibility that the structure around 82K will fail. If it’s confirmed to be rejected, then the liquidity region below will indeed pull the price downward.
However, after institutionalization, the probability of a deep bearish move is now much lower than in the previous few rounds. This 50% pullback by itself is already proof.
#BTC
Many of the people shouting about 40K are actually the same traders who were shouting about 200K last year. The strategy hasn’t changed—only the direction.
In the short term, there really is a possibility that the structure around 82K will fail. If it’s confirmed to be rejected, then the liquidity region below will indeed pull the price downward.
However, after institutionalization, the probability of a deep bearish move is now much lower than in the previous few rounds. This 50% pullback by itself is already proof.
Many of the people shouting about 40K are actually the same traders who were shouting about 200K last year. The strategy hasn’t changed—only the direction.
In the short term, there really is a possibility that the structure around 82K will fail. If it’s confirmed to be rejected, then the liquidity region below will indeed pull the price downward.
However, after institutionalization, the probability of a deep bearish move is now much lower than in the previous few rounds. This 50% pullback by itself is already proof.
138
·
--
#BTC
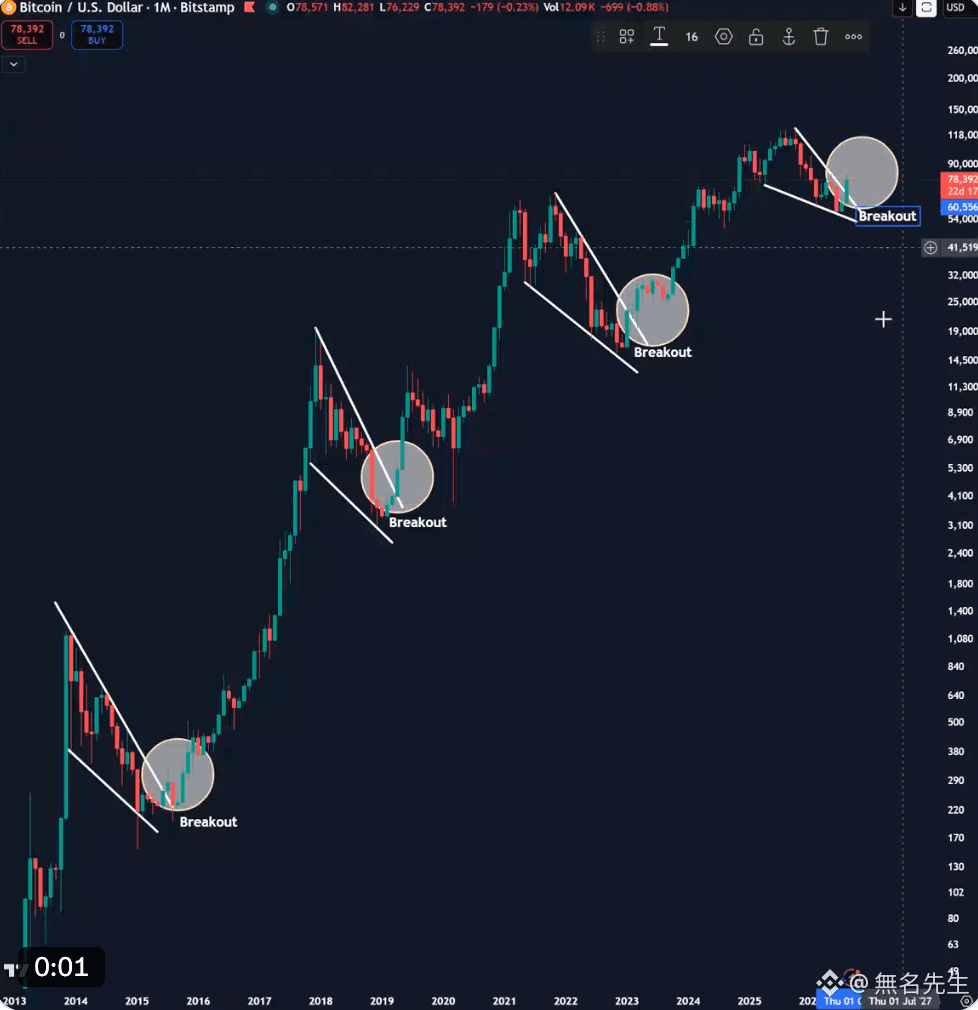
Volatility has fallen to a historical low; long-term holders are accumulating, and the weekly moving averages are converging.
When these three signals appear at the same time, it often means the direction is about to break out.
I’m bullish, but I won’t go all-in at once.
I’ll take a portion of the position first, then add more after confirmation.
#BTC
Volatility has fallen to a historical low; long-term holders are accumulating, and the weekly moving averages are converging.
When these three signals appear at the same time, it often means the direction is about to break out.
I’m bullish, but I won’t go all-in at once.
I’ll take a portion of the position first, then add more after confirmation.
Volatility has fallen to a historical low; long-term holders are accumulating, and the weekly moving averages are converging.
When these three signals appear at the same time, it often means the direction is about to break out.
I’m bullish, but I won’t go all-in at once.
I’ll take a portion of the position first, then add more after confirmation.
75
·
--
#ETH
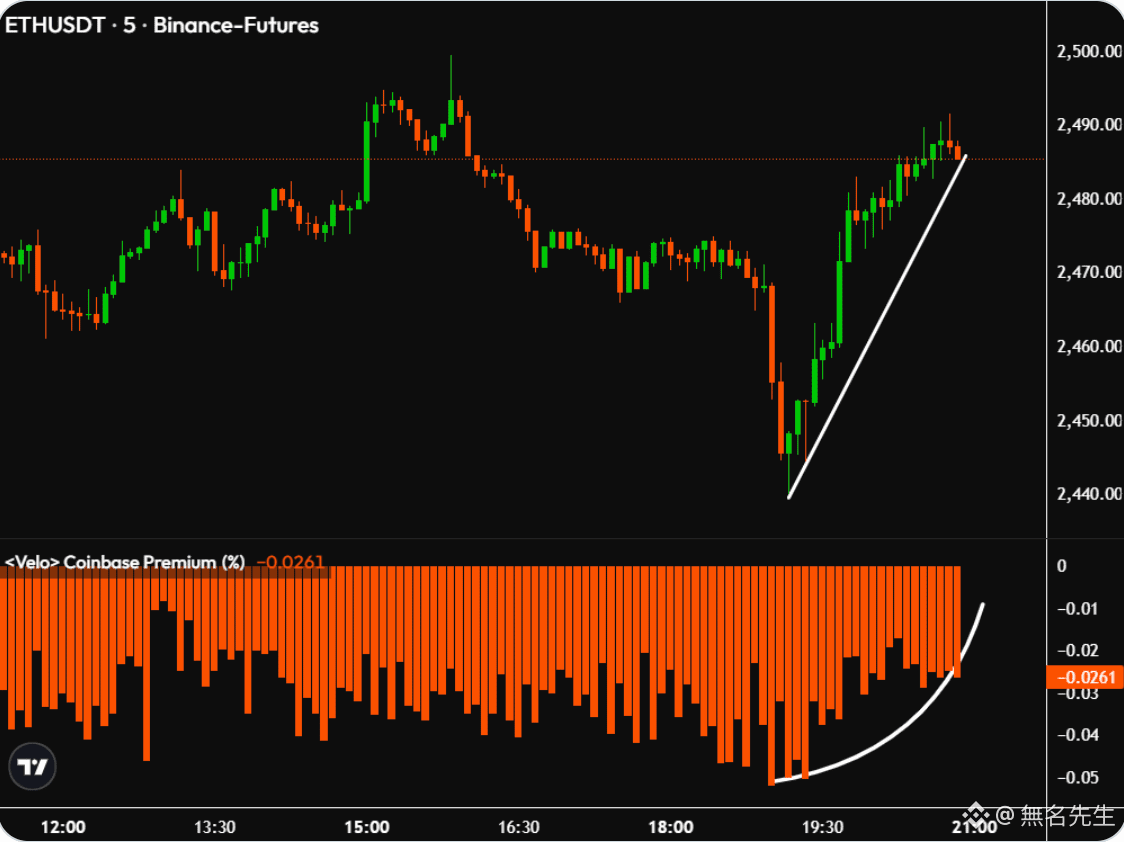
Coinbase’s ETH premium has suddenly rebounded.
Typically, when institutions buy in large quantities through Coinbase, the ETH price on Coinbase is noticeably higher than on other exchanges, creating a positive premium.
Data shows that the Coinbase ETH premium index has already returned above the zero line, indicating that U.S. institutional investors are actively buying ETH.
This suggests it’s not retail investors trying to bottom-fish—big money is making the move.
#ETH
Coinbase’s ETH premium has suddenly rebounded.
Typically, when institutions buy in large quantities through Coinbase, the ETH price on Coinbase is noticeably higher than on other exchanges, creating a positive premium.
Data shows that the Coinbase ETH premium index has already returned above the zero line, indicating that U.S. institutional investors are actively buying ETH.
This suggests it’s not retail investors trying to bottom-fish—big money is making the move.
Coinbase’s ETH premium has suddenly rebounded.
Typically, when institutions buy in large quantities through Coinbase, the ETH price on Coinbase is noticeably higher than on other exchanges, creating a positive premium.
Data shows that the Coinbase ETH premium index has already returned above the zero line, indicating that U.S. institutional investors are actively buying ETH.
This suggests it’s not retail investors trying to bottom-fish—big money is making the move.
119
·
--
#BTC
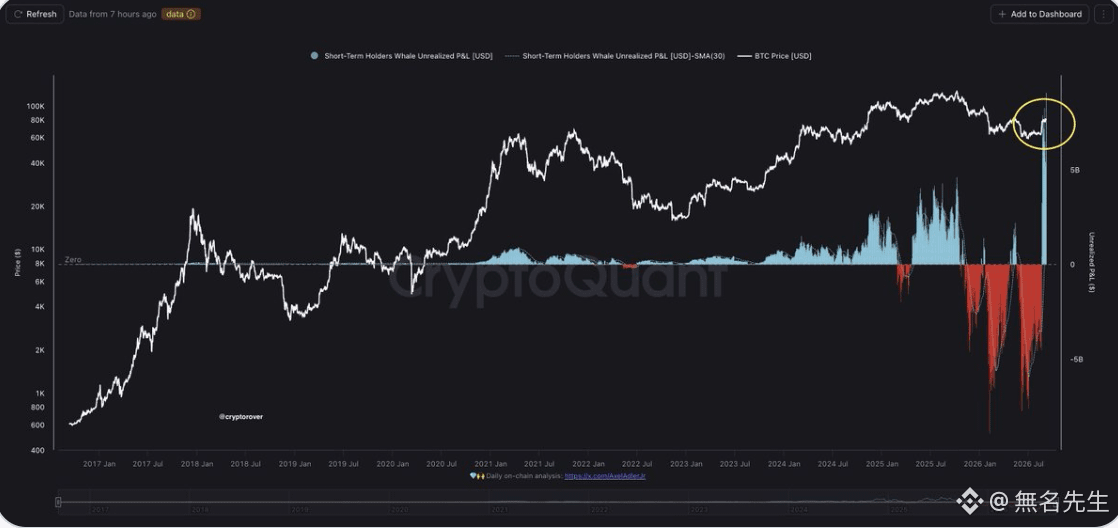
Short-term whales are taking large profits.
On-chain data shows that in the past week, addresses holding BTC for less than 6 months have reduced their holdings by tens of thousands of BTC, and 127 addresses transferred more than 38,000 BTC to exchanges in a single move.
The average cost of these addresses is in the $55,000–$65,000 range; based on the current price of $81,000, the average profit margin is 25%–47%.
Short-term coins are being distributed, and profits are being realized.
#BTC
Short-term whales are taking large profits.
On-chain data shows that in the past week, addresses holding BTC for less than 6 months have reduced their holdings by tens of thousands of BTC, and 127 addresses transferred more than 38,000 BTC to exchanges in a single move.
The average cost of these addresses is in the $55,000–$65,000 range; based on the current price of $81,000, the average profit margin is 25%–47%.
Short-term coins are being distributed, and profits are being realized.
Short-term whales are taking large profits.
On-chain data shows that in the past week, addresses holding BTC for less than 6 months have reduced their holdings by tens of thousands of BTC, and 127 addresses transferred more than 38,000 BTC to exchanges in a single move.
The average cost of these addresses is in the $55,000–$65,000 range; based on the current price of $81,000, the average profit margin is 25%–47%.
Short-term coins are being distributed, and profits are being realized.
85
Log in to explore more content
Join global crypto users on Binance Square
⚡️ Get latest and useful information about crypto.
💬 Trusted by the world’s largest crypto exchange.
👍 Discover real insights from verified creators.
Email / Phone number
Trending Topics
USAugustPPIRisesLessThanExpected
860 views
78 Discussing
🚨 US AUG PPI: Rises LESS Than Expected! Bullish for Crypto? 🚀
PPI +0.4% MoM as expected, but CORE PPI only +0.2% vs +0.3% expected - cooling!
What it means:
• Wholesale inflation softer than feared
• Fed rate hike chance now 62% - but dovish signals coming
• Core PCE revisions expected downward - bullish
• BTC usually pumps on softer PPI
Fed meeting Sep 15-16 - Market now expects pause, not hike?
Is this the green light for Q4 rally?
#Bitcoin #PPI #Fed #CryptoNews #BTC#usaugustppiriseslessthanexpected
True News
·1 Likes
·334 views
SECApprovesNasdaqTexasCommodityTrustRule
2,760 views
146 Discussing
ECBRaisesRatesSecondTimeTo2.5%
1,300 views
94 Discussing