🔻 Gold Under Pressure: Is 4,106 Next? 🔻
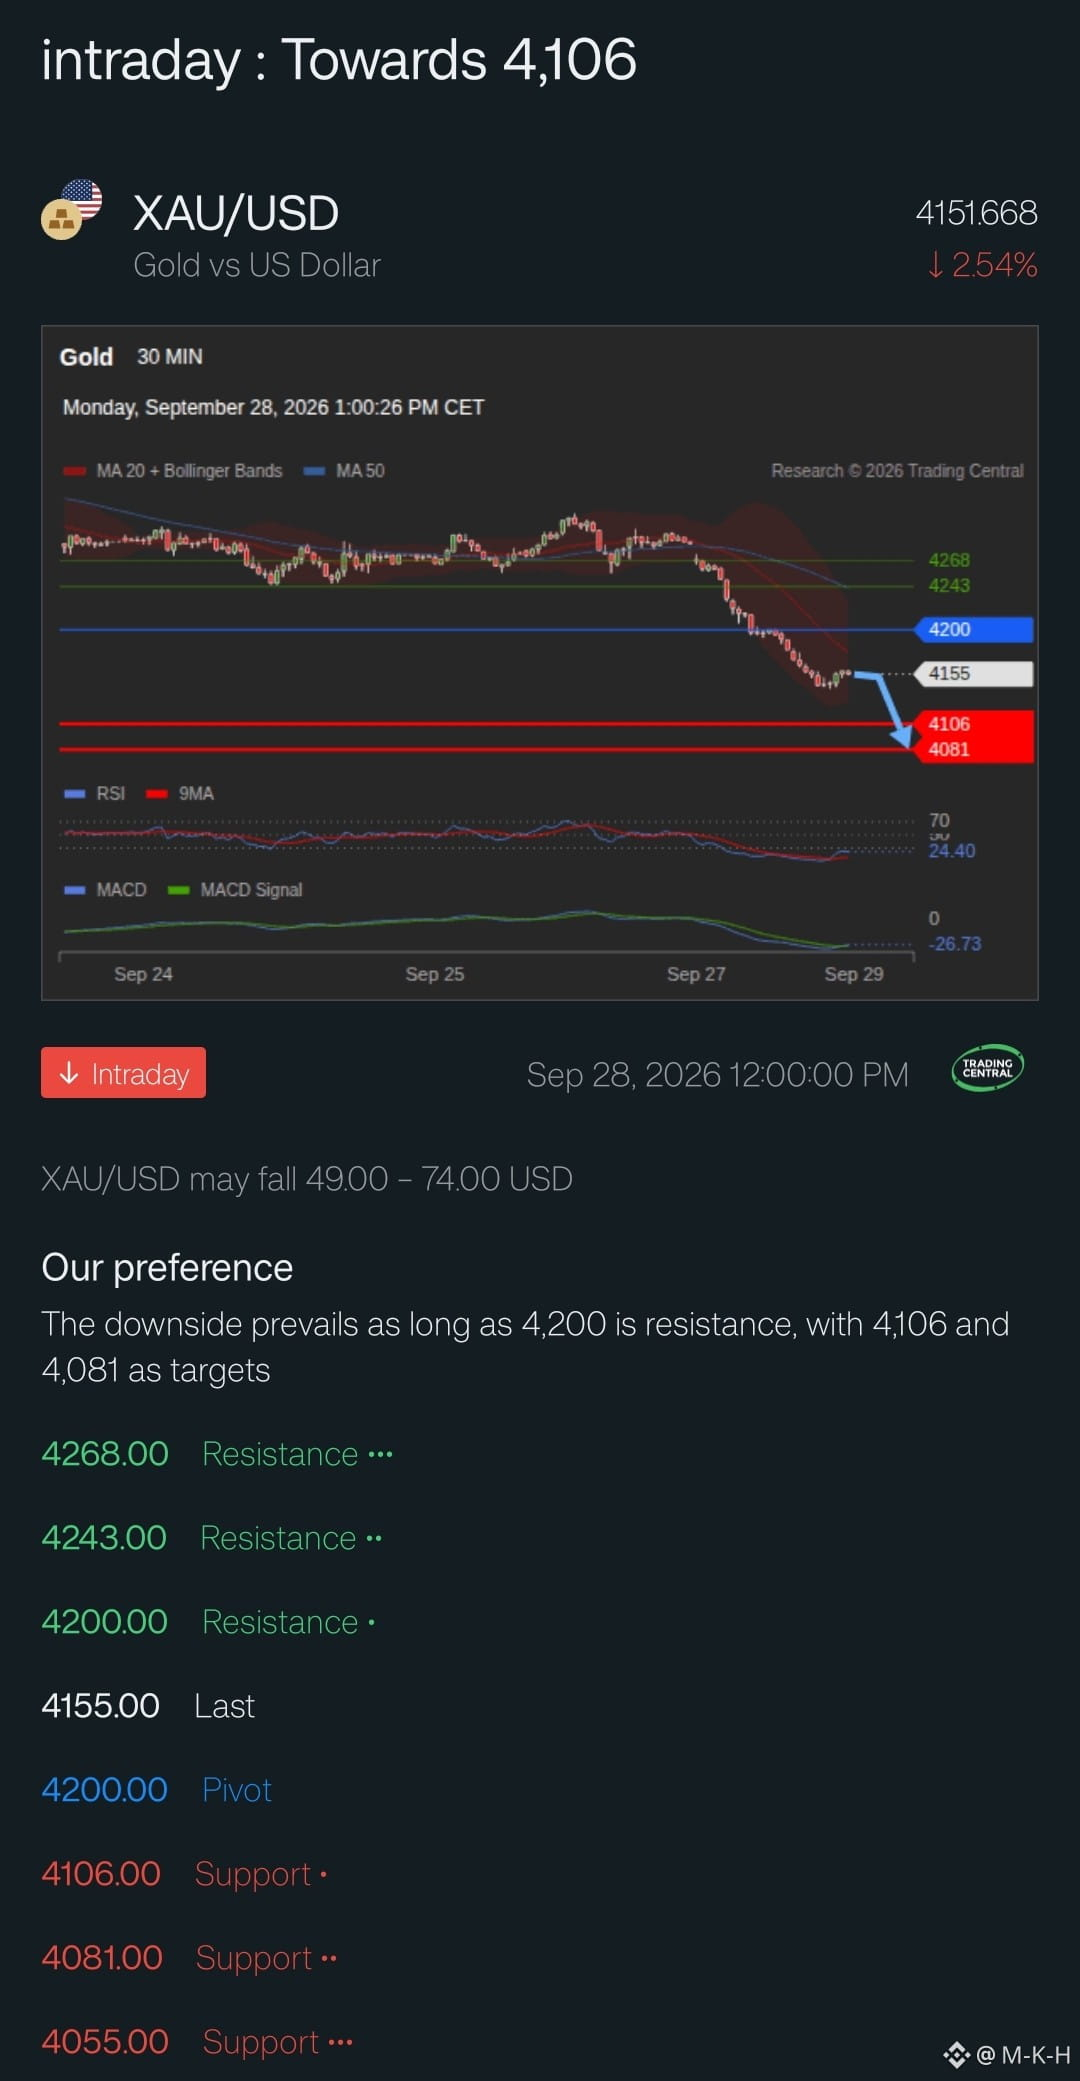
$XAU Gold is trading at $4,155, down about 2.54% today after breaking through key levels.
📊 Quick Technical Read (30-min chart):
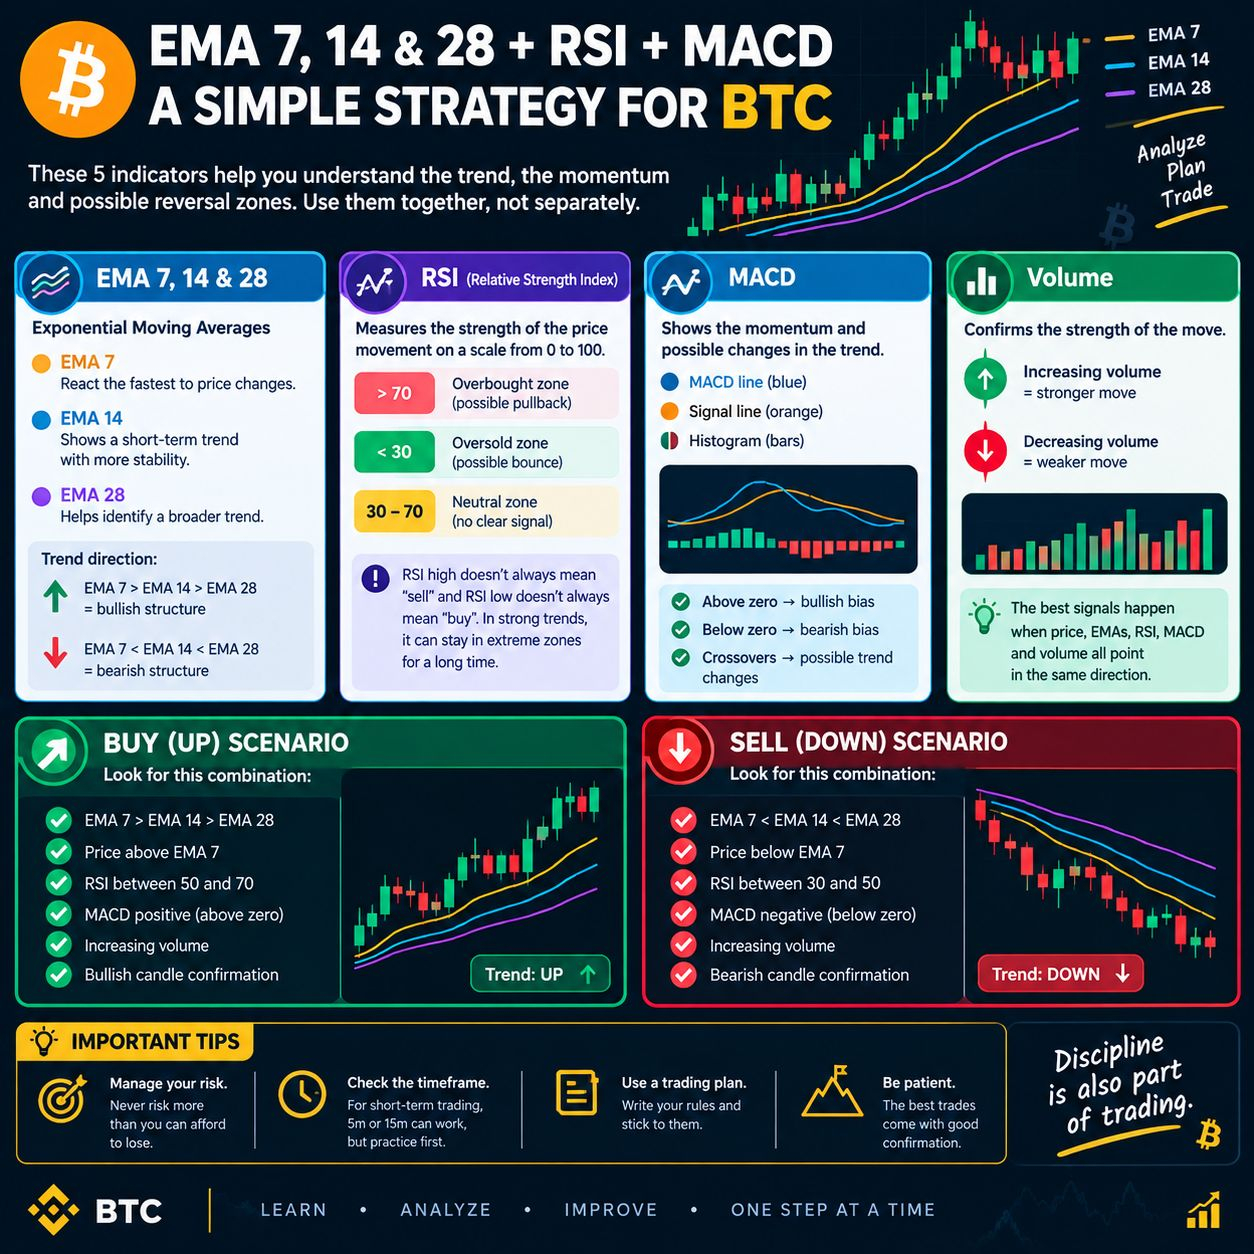
• Price is below both the MA20 and MA50
• MACD is in negative territory
• RSI is weak near 24, which is oversold and could allow a short-term bounce
🎯 Key Levels:
🔴 Resistance: 4,200 (pivot) → 4,243 → 4,268
🟢 Support: 4,106 → 4,081 → 4,055
💡 The Setup:
As long as price stays below 4,200, the bias is bearish, with targets at 4,106 and then 4,081.
A close above 4,200 invalidates this view and opens the way toward 4,243.
⚠️ This is my personal analysis, not financial advice. Always use a stop loss and manage your risk.
💬 What's your take? Do we reach 4,106, or bounce first? Drop your prediction below 👇
✅ Follow me for daily Gold and crypto analysis.
#BinanceSquareTalks #BinanceSquareFamily #writetoearn #TechnicalAnalysiss #trading