
#marscoin
marscoin
1.6M views
9,842 Discussing
Hot
Latest

·
--
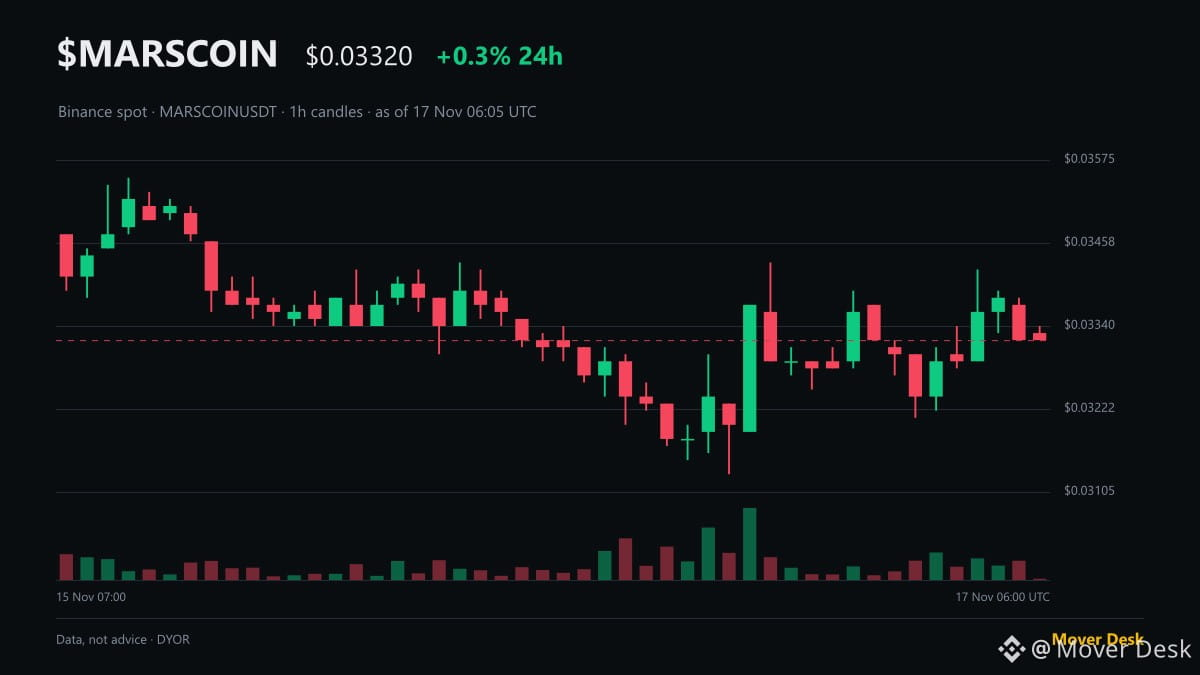
$MARSCOIN open interest grew +6% to $6.0M while spot price held at $0.03330 (+0.3%) as of 06:04 UTC: what open interest actually tells you.
Open interest is the total number of active futures contracts that have not been settled or closed.
When open interest rises, new capital is entering the market through fresh positions. When it falls, traders are closing contracts and de-risking. It does not reveal which side is winning, because every single open contract requires both a buyer and a seller.
On MARSCOIN, open interest increased +6% to $6.0M over 24 hours while price traded between $0.03130 and $0.03430, dipping -1.2% in the last hour. Longs pay shorts a modest +0.0050% funding rate, with 52% of accounts holding long positions (a 1.07 long/short ratio). The rising open interest confirms traders were actively establishing new commitments into this range rather than exiting.
Risk check: 24h spot volume is thin at $3.0M compared to $6.0M in futures open interest, leaving the order book vulnerable to fast moves if leverage unwinds.
When open interest expands while spot price stays flat, do you see that as deliberate positioning or a leverage trap?
Mover Desk · numbers, not hype
#MARSCOIN #OpenInterest #CryptoEducation #Futures
Not financial advice. DYOR.
$MARSCOIN open interest grew +6% to $6.0M while spot price held at $0.03330 (+0.3%) as of 06:04 UTC: what open interest actually tells you.
Open interest is the total number of active futures contracts that have not been settled or closed.
When open interest rises, new capital is entering the market through fresh positions. When it falls, traders are closing contracts and de-risking. It does not reveal which side is winning, because every single open contract requires both a buyer and a seller.
On MARSCOIN, open interest increased +6% to $6.0M over 24 hours while price traded between $0.03130 and $0.03430, dipping -1.2% in the last hour. Longs pay shorts a modest +0.0050% funding rate, with 52% of accounts holding long positions (a 1.07 long/short ratio). The rising open interest confirms traders were actively establishing new commitments into this range rather than exiting.
Risk check: 24h spot volume is thin at $3.0M compared to $6.0M in futures open interest, leaving the order book vulnerable to fast moves if leverage unwinds.
When open interest expands while spot price stays flat, do you see that as deliberate positioning or a leverage trap?
Mover Desk · numbers, not hype
#MARSCOIN #OpenInterest #CryptoEducation #Futures
Not financial advice. DYOR.
Open interest is the total number of active futures contracts that have not been settled or closed.
When open interest rises, new capital is entering the market through fresh positions. When it falls, traders are closing contracts and de-risking. It does not reveal which side is winning, because every single open contract requires both a buyer and a seller.
On MARSCOIN, open interest increased +6% to $6.0M over 24 hours while price traded between $0.03130 and $0.03430, dipping -1.2% in the last hour. Longs pay shorts a modest +0.0050% funding rate, with 52% of accounts holding long positions (a 1.07 long/short ratio). The rising open interest confirms traders were actively establishing new commitments into this range rather than exiting.
Risk check: 24h spot volume is thin at $3.0M compared to $6.0M in futures open interest, leaving the order book vulnerable to fast moves if leverage unwinds.
When open interest expands while spot price stays flat, do you see that as deliberate positioning or a leverage trap?
Mover Desk · numbers, not hype
#MARSCOIN #OpenInterest #CryptoEducation #Futures
Not financial advice. DYOR.
15

MARSCOIN, ONE and MEGA: Three Different Market Signals in a Selective Crypto EnvironmentThe latest spot market activity across MARSCOIN, ONE, and MEGA shows a market where attention is moving selectively rather than broadly. All three assets are active, but their price structures tell very different stories. MARSCOIN is showing modest upward momentum with solid price retention near the daily high. ONE has experienced the widest relative volatility but is currently back at its opening level. MEGA is trading with a measured positive bias and a comparatively controlled intraday range.
This distinction matters because the headline percentage move is only one part of the story. Traders are also watching how each asset behaves after testing highs and lows, whether volume supports the move, and whether buyers can retain control when short term profit taking appears. In a fast moving market, price retention and liquidity often reveal more than a single green candle.
MARSCOIN is trading around $0.0337, up +0.60% from its 24 hour open of $0.0335. The asset reached a high of $0.0343 and a low of $0.0313, creating a 9.58% trading range. MARSCOIN is currently only 1.75% below its session high, which suggests that buyers have retained most of the recovery after price explored lower levels earlier in the session.
The market has generated approximately $2.81M in quoted 24 hour volume, showing that current price action is supported by active participation. MARSCOIN’s ability to remain above the daily open and close to the session high is the strongest short term feature of its structure. It does not guarantee continuation, but it indicates that the upside move has not been immediately rejected.
At the same time, the nearly 10% daily range confirms that the market remains volatile. This is a setting where sudden expansions can attract momentum traders, but it can also produce rapid reversals if liquidity slows. The most relevant observation is whether MARSCOIN can keep holding above its opening price while volume remains consistent. Stable consolidation near the upper range would show a more orderly market than a sharp move followed by immediate selling pressure.
Harmony, trading under the ticker ONE, is currently priced around $0.001307, unchanged from its 24 hour open of $0.001307. ONE reached a high of $0.001438 and a low of $0.001274, producing the widest relative range among the three assets at 12.87%. Although the price is flat over the session, the path has been far from quiet.
ONE is currently 9.11% below its daily high, showing that sellers became active after the earlier upside test. The market traded through a meaningful intraday range and then returned to the opening level, which reflects a balance between buyers and sellers rather than a decisive directional trend. With roughly $2.70M in quoted 24 hour volume, the price movement is occurring within an active market.
ONE remains tied to the broader Layer 1 narrative, where investor attention often depends on ecosystem development, network usage, and wider appetite for higher beta assets. The current price behavior highlights caution. Buyers have shown interest near the session low, but they have not yet been able to maintain control near the high. The next phase will depend on whether price can establish a tighter, more stable structure or whether the broad range continues to dominate short term trading.
MEGA is trading near $0.04981, up +0.59% from its 24 hour open of $0.04952. It traded between $0.04845 and $0.05101, resulting in a 5.28% range. MEGA is currently 2.35% below the session high, which places it near the upper portion of its daily structure.
This is a comparatively controlled setup. MEGA has moved above the opening price, retained that gain, and stayed closer to the daily high than the low. Its quoted 24 hour volume is around $2.64M, confirming ongoing market participation. While the percentage move is modest, the quality of the structure is more important than the headline number. A measured rise with contained volatility can show a steadier balance of demand than a sharp spike that quickly fades.
MEGA’s market position is connected to blockchain infrastructure and Layer 1 themes, areas that can receive increased attention when traders begin focusing on network scalability and ecosystem growth. For now, the asset is showing a cautious positive tone. The key question is whether buyers can maintain the current range position if the broader crypto market becomes more volatile.
Across the three assets, the live structure is clear. MARSCOIN is displaying the strongest short term price retention. ONE is showing the highest intraday volatility but lacks a clear net directional move. MEGA is presenting the most orderly positive structure, with price holding above its opening level and close to the daily high.
The market is rewarding selectivity. Momentum may bring attention, but sustainable moves depend on liquidity, volume consistency, and the ability to retain gains after volatility increases. These current readings are a snapshot of active market conditions, not a guarantee of what comes next. Responsible traders will continue watching volume, range behavior, and broader market sentiment before reacting to short term price movement.
#MarsCoin #HarmonyONE #MEGA #CryptoMarket #Altcoins
$MARSCOIN
{spot}(MARSCOINUSDT)
$ONE
{spot}(ONEUSDT)
$MEGA
{spot}(MEGAUSDT)
MARSCOIN, ONE and MEGA: Three Different Market Signals in a Selective Crypto Environment
The latest spot market activity across MARSCOIN, ONE, and MEGA shows a market where attention is moving selectively rather than broadly. All three assets are active, but their price structures tell very different stories. MARSCOIN is showing modest upward momentum with solid price retention near the daily high. ONE has experienced the widest relative volatility but is currently back at its opening level. MEGA is trading with a measured positive bias and a comparatively controlled intraday range.
This distinction matters because the headline percentage move is only one part of the story. Traders are also watching how each asset behaves after testing highs and lows, whether volume supports the move, and whether buyers can retain control when short term profit taking appears. In a fast moving market, price retention and liquidity often reveal more than a single green candle.
MARSCOIN is trading around $0.0337, up +0.60% from its 24 hour open of $0.0335. The asset reached a high of $0.0343 and a low of $0.0313, creating a 9.58% trading range. MARSCOIN is currently only 1.75% below its session high, which suggests that buyers have retained most of the recovery after price explored lower levels earlier in the session.
The market has generated approximately $2.81M in quoted 24 hour volume, showing that current price action is supported by active participation. MARSCOIN’s ability to remain above the daily open and close to the session high is the strongest short term feature of its structure. It does not guarantee continuation, but it indicates that the upside move has not been immediately rejected.
At the same time, the nearly 10% daily range confirms that the market remains volatile. This is a setting where sudden expansions can attract momentum traders, but it can also produce rapid reversals if liquidity slows. The most relevant observation is whether MARSCOIN can keep holding above its opening price while volume remains consistent. Stable consolidation near the upper range would show a more orderly market than a sharp move followed by immediate selling pressure.
Harmony, trading under the ticker ONE, is currently priced around $0.001307, unchanged from its 24 hour open of $0.001307. ONE reached a high of $0.001438 and a low of $0.001274, producing the widest relative range among the three assets at 12.87%. Although the price is flat over the session, the path has been far from quiet.
ONE is currently 9.11% below its daily high, showing that sellers became active after the earlier upside test. The market traded through a meaningful intraday range and then returned to the opening level, which reflects a balance between buyers and sellers rather than a decisive directional trend. With roughly $2.70M in quoted 24 hour volume, the price movement is occurring within an active market.
ONE remains tied to the broader Layer 1 narrative, where investor attention often depends on ecosystem development, network usage, and wider appetite for higher beta assets. The current price behavior highlights caution. Buyers have shown interest near the session low, but they have not yet been able to maintain control near the high. The next phase will depend on whether price can establish a tighter, more stable structure or whether the broad range continues to dominate short term trading.
MEGA is trading near $0.04981, up +0.59% from its 24 hour open of $0.04952. It traded between $0.04845 and $0.05101, resulting in a 5.28% range. MEGA is currently 2.35% below the session high, which places it near the upper portion of its daily structure.
This is a comparatively controlled setup. MEGA has moved above the opening price, retained that gain, and stayed closer to the daily high than the low. Its quoted 24 hour volume is around $2.64M, confirming ongoing market participation. While the percentage move is modest, the quality of the structure is more important than the headline number. A measured rise with contained volatility can show a steadier balance of demand than a sharp spike that quickly fades.
MEGA’s market position is connected to blockchain infrastructure and Layer 1 themes, areas that can receive increased attention when traders begin focusing on network scalability and ecosystem growth. For now, the asset is showing a cautious positive tone. The key question is whether buyers can maintain the current range position if the broader crypto market becomes more volatile.
Across the three assets, the live structure is clear. MARSCOIN is displaying the strongest short term price retention. ONE is showing the highest intraday volatility but lacks a clear net directional move. MEGA is presenting the most orderly positive structure, with price holding above its opening level and close to the daily high.
The market is rewarding selectivity. Momentum may bring attention, but sustainable moves depend on liquidity, volume consistency, and the ability to retain gains after volatility increases. These current readings are a snapshot of active market conditions, not a guarantee of what comes next. Responsible traders will continue watching volume, range behavior, and broader market sentiment before reacting to short term price movement.
#MarsCoin #HarmonyONE #MEGA #CryptoMarket #Altcoins
$MARSCOIN
$ONE
$MEGA
This distinction matters because the headline percentage move is only one part of the story. Traders are also watching how each asset behaves after testing highs and lows, whether volume supports the move, and whether buyers can retain control when short term profit taking appears. In a fast moving market, price retention and liquidity often reveal more than a single green candle.
MARSCOIN is trading around $0.0337, up +0.60% from its 24 hour open of $0.0335. The asset reached a high of $0.0343 and a low of $0.0313, creating a 9.58% trading range. MARSCOIN is currently only 1.75% below its session high, which suggests that buyers have retained most of the recovery after price explored lower levels earlier in the session.
The market has generated approximately $2.81M in quoted 24 hour volume, showing that current price action is supported by active participation. MARSCOIN’s ability to remain above the daily open and close to the session high is the strongest short term feature of its structure. It does not guarantee continuation, but it indicates that the upside move has not been immediately rejected.
At the same time, the nearly 10% daily range confirms that the market remains volatile. This is a setting where sudden expansions can attract momentum traders, but it can also produce rapid reversals if liquidity slows. The most relevant observation is whether MARSCOIN can keep holding above its opening price while volume remains consistent. Stable consolidation near the upper range would show a more orderly market than a sharp move followed by immediate selling pressure.
Harmony, trading under the ticker ONE, is currently priced around $0.001307, unchanged from its 24 hour open of $0.001307. ONE reached a high of $0.001438 and a low of $0.001274, producing the widest relative range among the three assets at 12.87%. Although the price is flat over the session, the path has been far from quiet.
ONE is currently 9.11% below its daily high, showing that sellers became active after the earlier upside test. The market traded through a meaningful intraday range and then returned to the opening level, which reflects a balance between buyers and sellers rather than a decisive directional trend. With roughly $2.70M in quoted 24 hour volume, the price movement is occurring within an active market.
ONE remains tied to the broader Layer 1 narrative, where investor attention often depends on ecosystem development, network usage, and wider appetite for higher beta assets. The current price behavior highlights caution. Buyers have shown interest near the session low, but they have not yet been able to maintain control near the high. The next phase will depend on whether price can establish a tighter, more stable structure or whether the broad range continues to dominate short term trading.
MEGA is trading near $0.04981, up +0.59% from its 24 hour open of $0.04952. It traded between $0.04845 and $0.05101, resulting in a 5.28% range. MEGA is currently 2.35% below the session high, which places it near the upper portion of its daily structure.
This is a comparatively controlled setup. MEGA has moved above the opening price, retained that gain, and stayed closer to the daily high than the low. Its quoted 24 hour volume is around $2.64M, confirming ongoing market participation. While the percentage move is modest, the quality of the structure is more important than the headline number. A measured rise with contained volatility can show a steadier balance of demand than a sharp spike that quickly fades.
MEGA’s market position is connected to blockchain infrastructure and Layer 1 themes, areas that can receive increased attention when traders begin focusing on network scalability and ecosystem growth. For now, the asset is showing a cautious positive tone. The key question is whether buyers can maintain the current range position if the broader crypto market becomes more volatile.
Across the three assets, the live structure is clear. MARSCOIN is displaying the strongest short term price retention. ONE is showing the highest intraday volatility but lacks a clear net directional move. MEGA is presenting the most orderly positive structure, with price holding above its opening level and close to the daily high.
The market is rewarding selectivity. Momentum may bring attention, but sustainable moves depend on liquidity, volume consistency, and the ability to retain gains after volatility increases. These current readings are a snapshot of active market conditions, not a guarantee of what comes next. Responsible traders will continue watching volume, range behavior, and broader market sentiment before reacting to short term price movement.
#MarsCoin #HarmonyONE #MEGA #CryptoMarket #Altcoins
$MARSCOIN
$ONE
$MEGA
1
52

·
--
Could $MARSCOIN follow the same path as $TUT and $TST? 👀
I'm wondering if we could see another major drop, possibly pushing $MARSCOIN towards the $0.01 range before finding a stable bottom.
Is a deeper correction coming, or will buyers step in before that happens?
What's your prediction, guys? Share your thoughts! 🔥
#MARSCOIN #Crypto #Altcoins #Trading #BinanceSquare
Could $MARSCOIN follow the same path as $TUT and $TST? 👀
I'm wondering if we could see another major drop, possibly pushing $MARSCOIN towards the $0.01 range before finding a stable bottom.
Is a deeper correction coming, or will buyers step in before that happens?
What's your prediction, guys? Share your thoughts! 🔥
#MARSCOIN #Crypto #Altcoins #Trading #BinanceSquare
I'm wondering if we could see another major drop, possibly pushing $MARSCOIN towards the $0.01 range before finding a stable bottom.
Is a deeper correction coming, or will buyers step in before that happens?
What's your prediction, guys? Share your thoughts! 🔥
#MARSCOIN #Crypto #Altcoins #Trading #BinanceSquare
Life is Race
·
--
$RARE Claim A Big Gift here 🎁🎁🎁🎁🎁🧧🧧🧧🧧🧧✅✅✅✅✅✅✅
2
2k
·
--
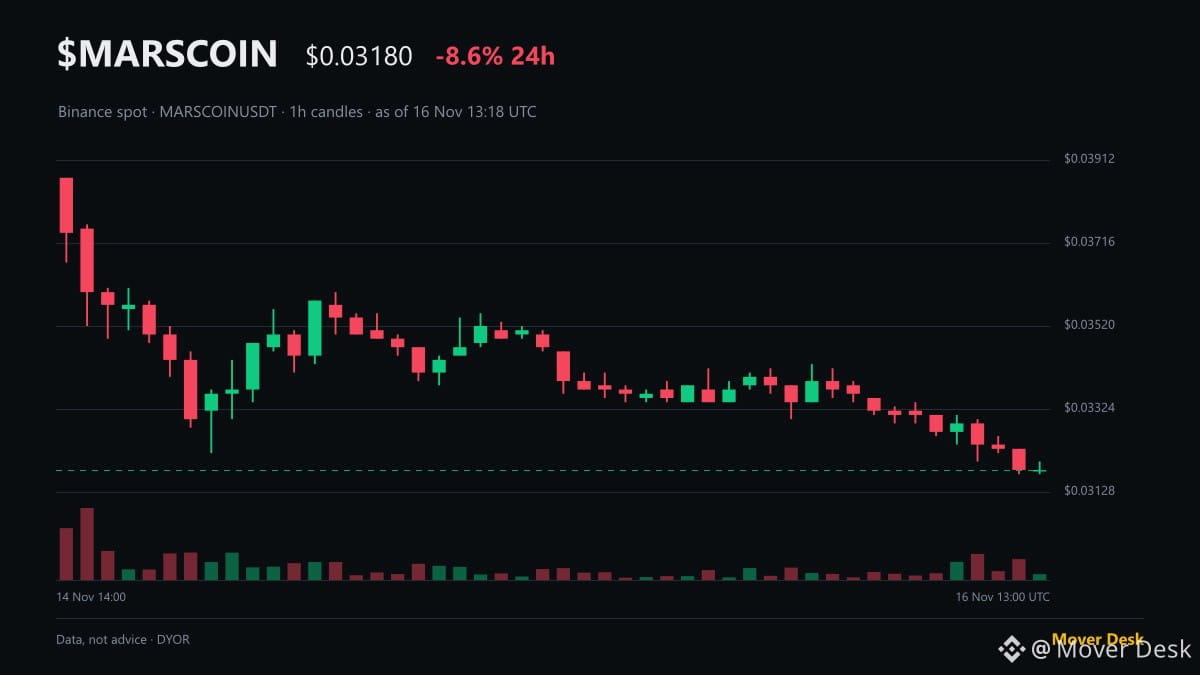
$MARSCOIN drops -8.6% to $0.03190 as of 13:16 UTC, but derivative traders are leaning in.
While price trades near the $0.03170 daily low, open interest expanded +6% to $5.6M with 53% of accounts holding long.
Spot volume sits at $2.0M against a 24h high of $0.03500, with price down another -0.9% in the last hour. There is no major headline behind the slide.
Perpetual funding holds positive at +0.0050% with a 1.12 long/short ratio, showing longs are actively paying to carry positions into weakness.
Risk factor: Open interest of $5.6M dwarfs the $2.0M spot turnover, leaving late longs exposed to liquidation if the $0.03170 floor breaks.
Are you siding with the 53% of accounts adding longs into this slide, or waiting for open interest to flush first?
Mover Desk · numbers, not hype
#MARSCOIN #Binance #Futures #CryptoTrading
Not financial advice. DYOR.
$MARSCOIN drops -8.6% to $0.03190 as of 13:16 UTC, but derivative traders are leaning in.
While price trades near the $0.03170 daily low, open interest expanded +6% to $5.6M with 53% of accounts holding long.
Spot volume sits at $2.0M against a 24h high of $0.03500, with price down another -0.9% in the last hour. There is no major headline behind the slide.
Perpetual funding holds positive at +0.0050% with a 1.12 long/short ratio, showing longs are actively paying to carry positions into weakness.
Risk factor: Open interest of $5.6M dwarfs the $2.0M spot turnover, leaving late longs exposed to liquidation if the $0.03170 floor breaks.
Are you siding with the 53% of accounts adding longs into this slide, or waiting for open interest to flush first?
Mover Desk · numbers, not hype
#MARSCOIN #Binance #Futures #CryptoTrading
Not financial advice. DYOR.
While price trades near the $0.03170 daily low, open interest expanded +6% to $5.6M with 53% of accounts holding long.
Spot volume sits at $2.0M against a 24h high of $0.03500, with price down another -0.9% in the last hour. There is no major headline behind the slide.
Perpetual funding holds positive at +0.0050% with a 1.12 long/short ratio, showing longs are actively paying to carry positions into weakness.
Risk factor: Open interest of $5.6M dwarfs the $2.0M spot turnover, leaving late longs exposed to liquidation if the $0.03170 floor breaks.
Are you siding with the 53% of accounts adding longs into this slide, or waiting for open interest to flush first?
Mover Desk · numbers, not hype
#MARSCOIN #Binance #Futures #CryptoTrading
Not financial advice. DYOR.
23

·
--
MARSCOIN & SOPH | Heavy Correction, Recovery Still Uncertain
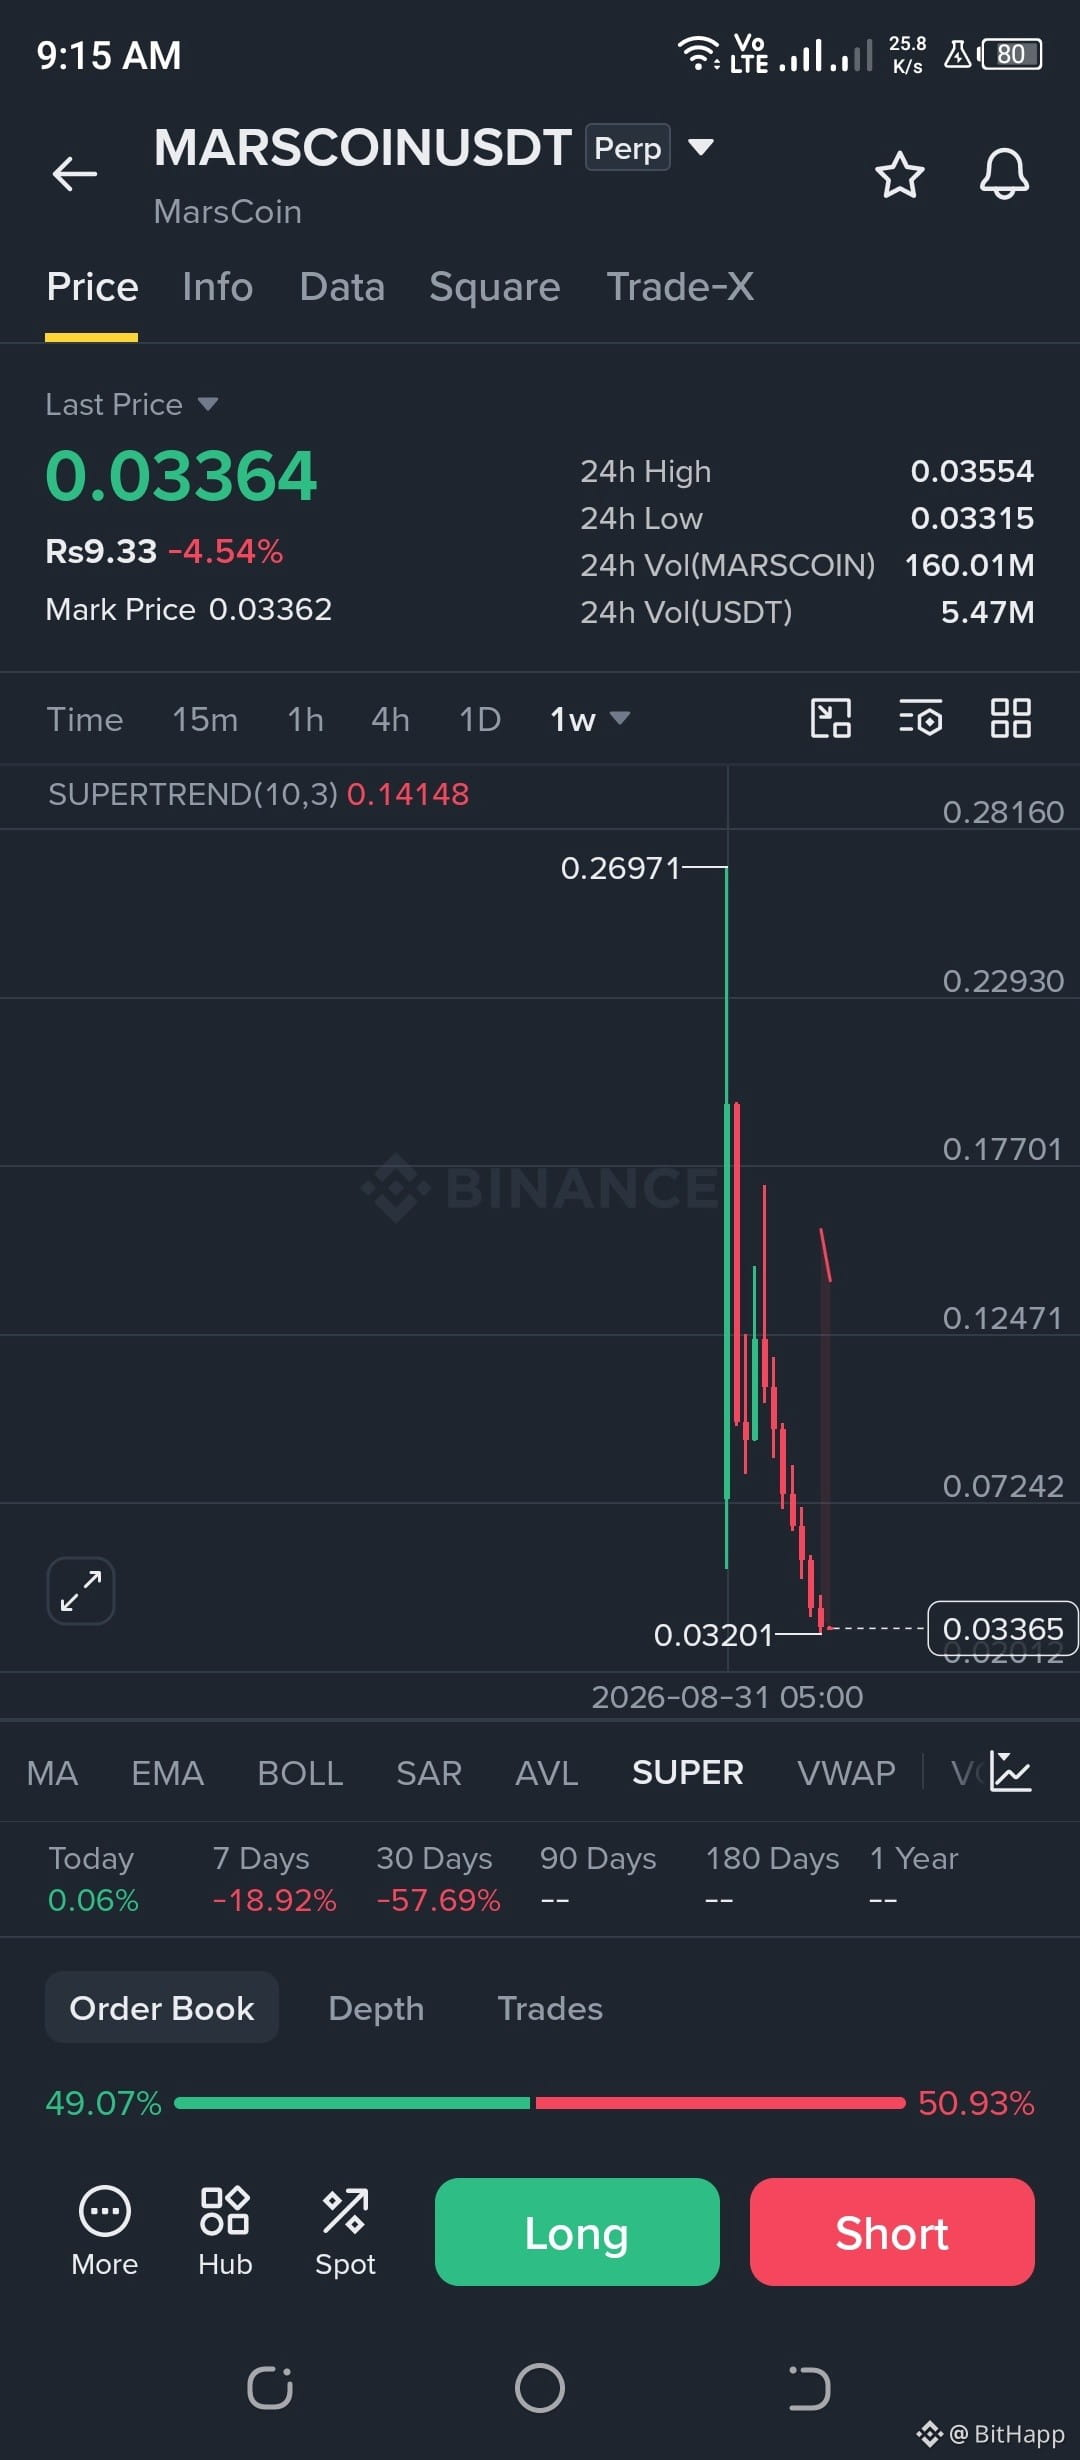
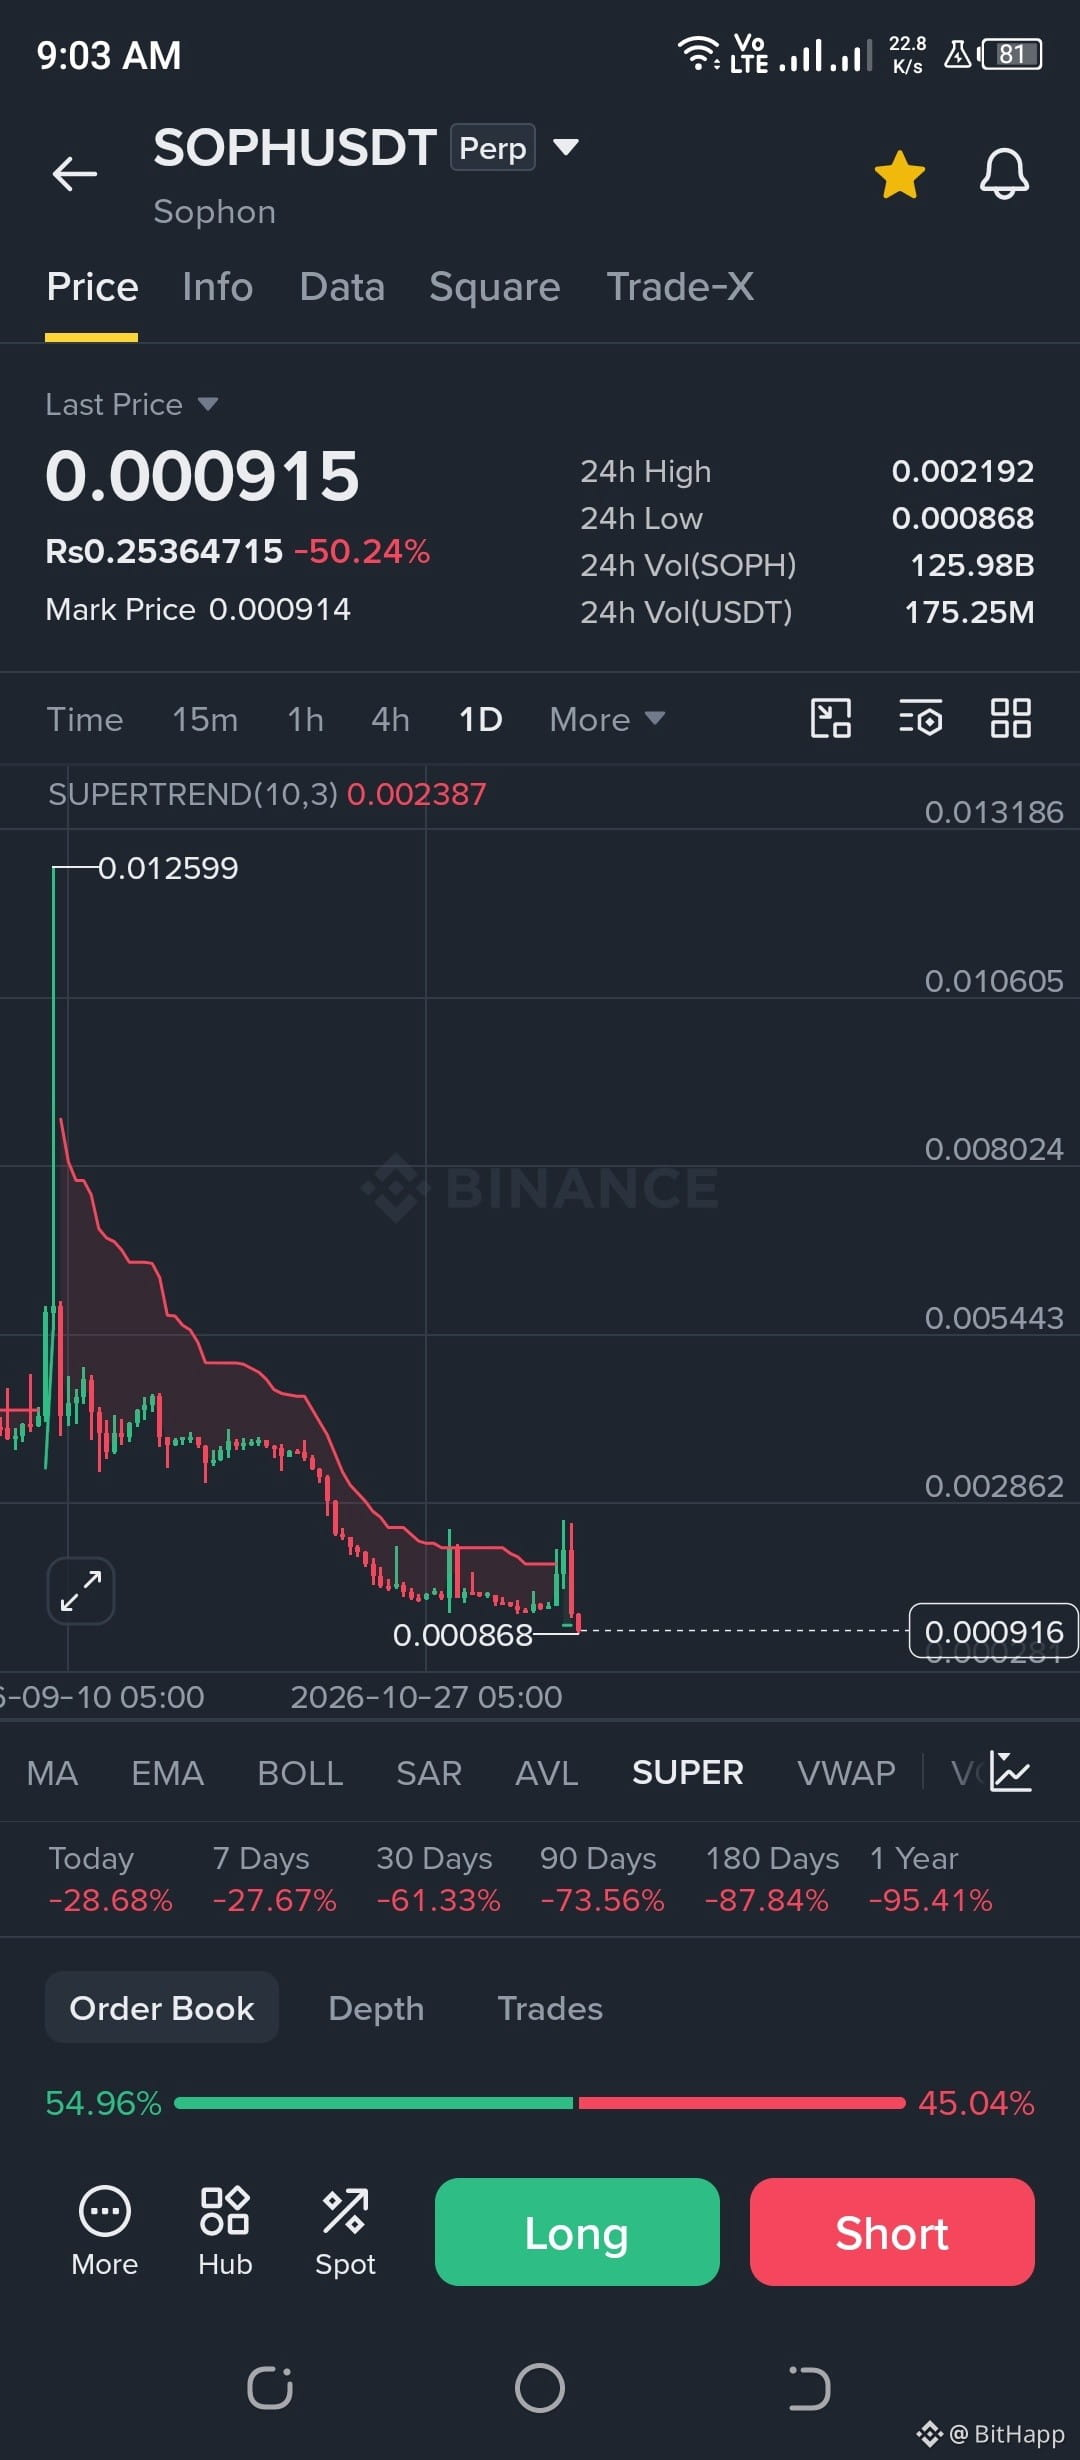
Both MARSCOIN and SOPH have experienced massive declines after their previous rallies.
$MARSCOIN : Down sharply from $0.26971.
$SOPH : Facing extreme selling pressure after falling from $0.012599.
Market Insight:
A massive price drop does not automatically mean a bullish reversal. Buyers need to demonstrate real strength before recovery can be confirmed.
My Strategy:
No blind buying. No emotional trading. Wait for confirmation and protect your capital.
Sometimes, patience is more profitable than trading.
What do you think? Recovery or further downside?
#MARSCOIN #SOPH #CryptoAnalysis #MarketUpdate
MARSCOIN & SOPH | Heavy Correction, Recovery Still Uncertain
Both MARSCOIN and SOPH have experienced massive declines after their previous rallies.
$MARSCOIN : Down sharply from $0.26971.
$SOPH : Facing extreme selling pressure after falling from $0.012599.
Market Insight:
A massive price drop does not automatically mean a bullish reversal. Buyers need to demonstrate real strength before recovery can be confirmed.
My Strategy:
No blind buying. No emotional trading. Wait for confirmation and protect your capital.
Sometimes, patience is more profitable than trading.
What do you think? Recovery or further downside?
#MARSCOIN #SOPH #CryptoAnalysis #MarketUpdate
Both MARSCOIN and SOPH have experienced massive declines after their previous rallies.
$MARSCOIN : Down sharply from $0.26971.
$SOPH : Facing extreme selling pressure after falling from $0.012599.
Market Insight:
A massive price drop does not automatically mean a bullish reversal. Buyers need to demonstrate real strength before recovery can be confirmed.
My Strategy:
No blind buying. No emotional trading. Wait for confirmation and protect your capital.
Sometimes, patience is more profitable than trading.
What do you think? Recovery or further downside?
#MARSCOIN #SOPH #CryptoAnalysis #MarketUpdate
Zeus_666:
do you still have a hope it gonna rise again man ?!!
3
4
1.6k

·
--
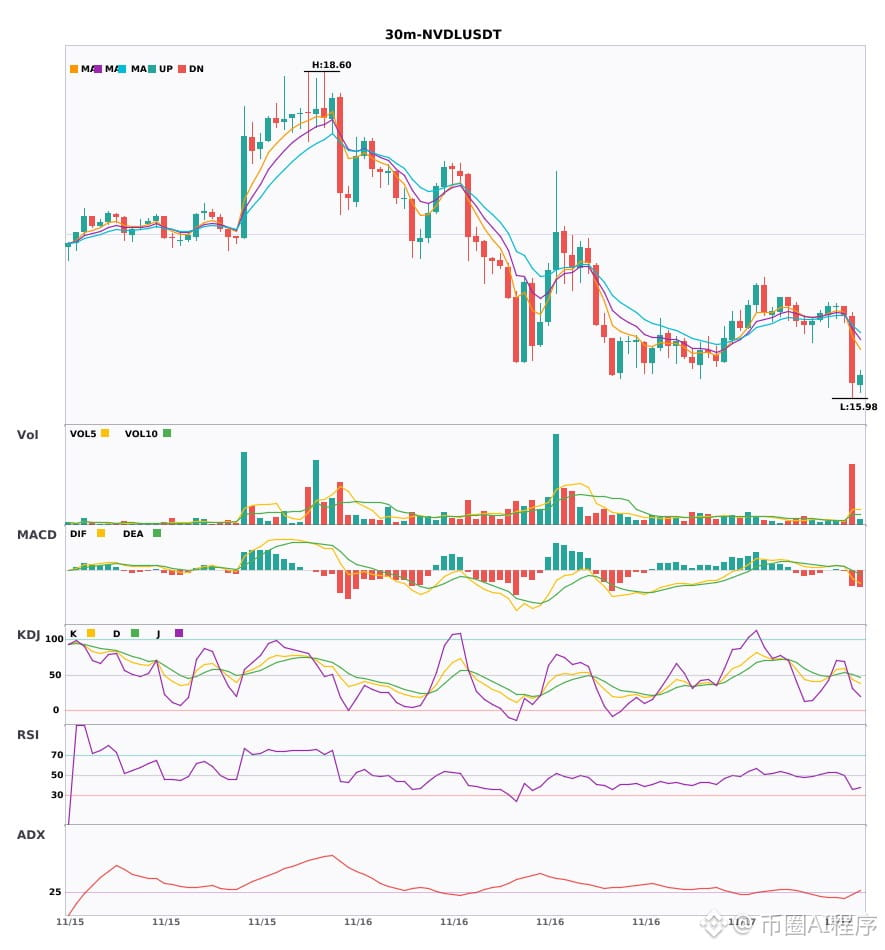
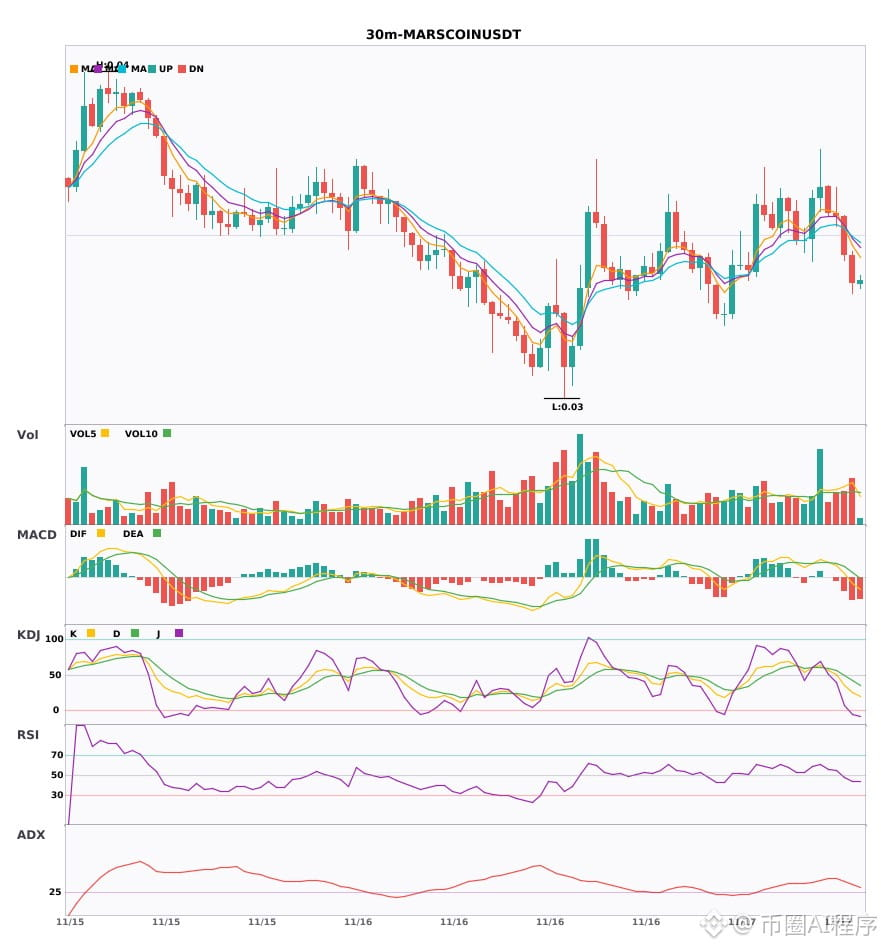
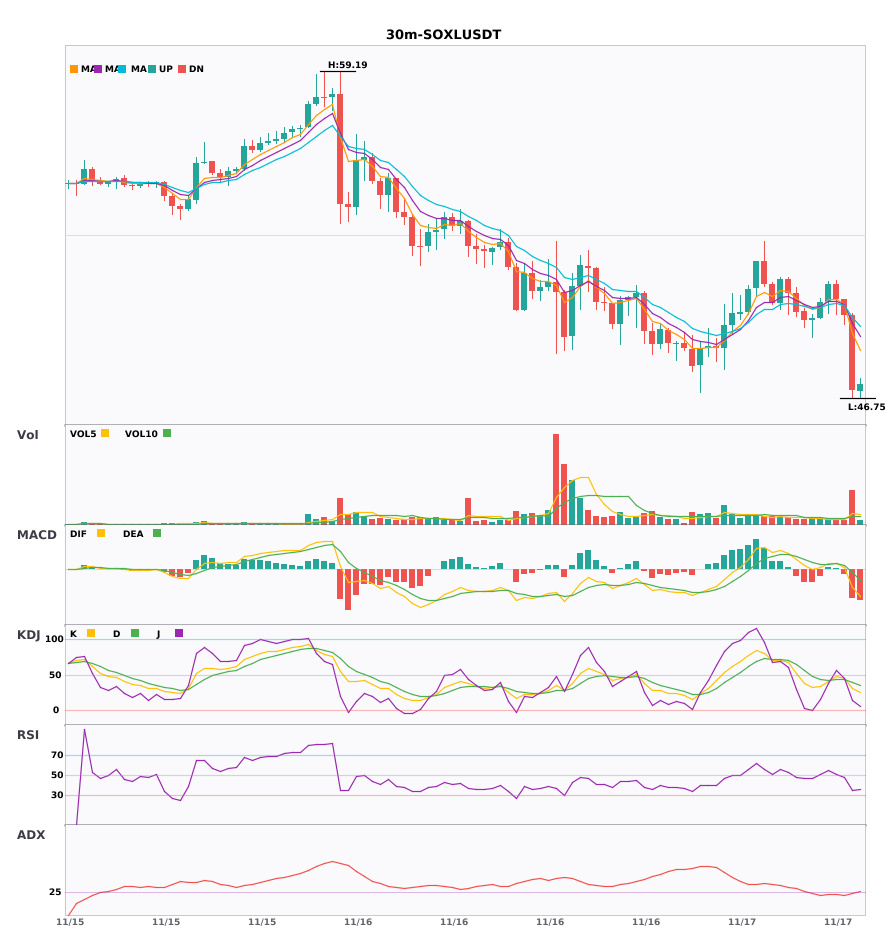
$NVDL / $MARSCOIN / $SOXL 30-minute bearish signals emerge; 4-hour bearish trend confirmed🔥
════════════════════
🟢 $NVDL 30-minute bearish signal
⚠️Technical analysis: 4-hour bearish + 30-minute confluence points down: MACD breaks below zero and turns bearish, moving averages have just formed a bearish alignment, KDJ has a death cross but is not yet oversold, and volume is up 6x.
════════════════════
🟢 $MARSCOIN 30-minute bearish signal
⚠️Technical analysis: 30-minute + 4-hour bearish confluence confirmed: MACD breaks below zero on increased volume, moving averages are bearishly aligned and diverging, KDJ is weak, and bears are in control.
════════════════════
🟢 $SOXL 30-minute bearish signal
⚠️Technical analysis: Multi-timeframe confluence: 4-hour bearish trend + confirmed 30-minute entry signal. MACD death cross breaks below zero and turns bearish, moving averages are bearishly aligned and diverging downward, KDJ has a death cross but is not oversold, and volume is up 3.9x—favoring the bearish trend.
════════════════════
🔔 Follow for first-hand market alerts 🔔
#多周期共振 #NVDL #MARSCOIN #SOXL
📌 When trading, pay attention to whether the candlestick pattern aligns.
$NVDL / $MARSCOIN / $SOXL 30-minute bearish signals emerge; 4-hour bearish trend confirmed🔥
════════════════════
🟢 $NVDL 30-minute bearish signal
⚠️Technical analysis: 4-hour bearish + 30-minute confluence points down: MACD breaks below zero and turns bearish, moving averages have just formed a bearish alignment, KDJ has a death cross but is not yet oversold, and volume is up 6x.
════════════════════
🟢 $MARSCOIN 30-minute bearish signal
⚠️Technical analysis: 30-minute + 4-hour bearish confluence confirmed: MACD breaks below zero on increased volume, moving averages are bearishly aligned and diverging, KDJ is weak, and bears are in control.
════════════════════
🟢 $SOXL 30-minute bearish signal
⚠️Technical analysis: Multi-timeframe confluence: 4-hour bearish trend + confirmed 30-minute entry signal. MACD death cross breaks below zero and turns bearish, moving averages are bearishly aligned and diverging downward, KDJ has a death cross but is not oversold, and volume is up 3.9x—favoring the bearish trend.
════════════════════
🔔 Follow for first-hand market alerts 🔔
#多周期共振 #NVDL #MARSCOIN #SOXL
📌 When trading, pay attention to whether the candlestick pattern aligns.
════════════════════
🟢 $NVDL 30-minute bearish signal
⚠️Technical analysis: 4-hour bearish + 30-minute confluence points down: MACD breaks below zero and turns bearish, moving averages have just formed a bearish alignment, KDJ has a death cross but is not yet oversold, and volume is up 6x.
════════════════════
🟢 $MARSCOIN 30-minute bearish signal
⚠️Technical analysis: 30-minute + 4-hour bearish confluence confirmed: MACD breaks below zero on increased volume, moving averages are bearishly aligned and diverging, KDJ is weak, and bears are in control.
════════════════════
🟢 $SOXL 30-minute bearish signal
⚠️Technical analysis: Multi-timeframe confluence: 4-hour bearish trend + confirmed 30-minute entry signal. MACD death cross breaks below zero and turns bearish, moving averages are bearishly aligned and diverging downward, KDJ has a death cross but is not oversold, and volume is up 3.9x—favoring the bearish trend.
════════════════════
🔔 Follow for first-hand market alerts 🔔
#多周期共振 #NVDL #MARSCOIN #SOXL
📌 When trading, pay attention to whether the candlestick pattern aligns.
47

·
--
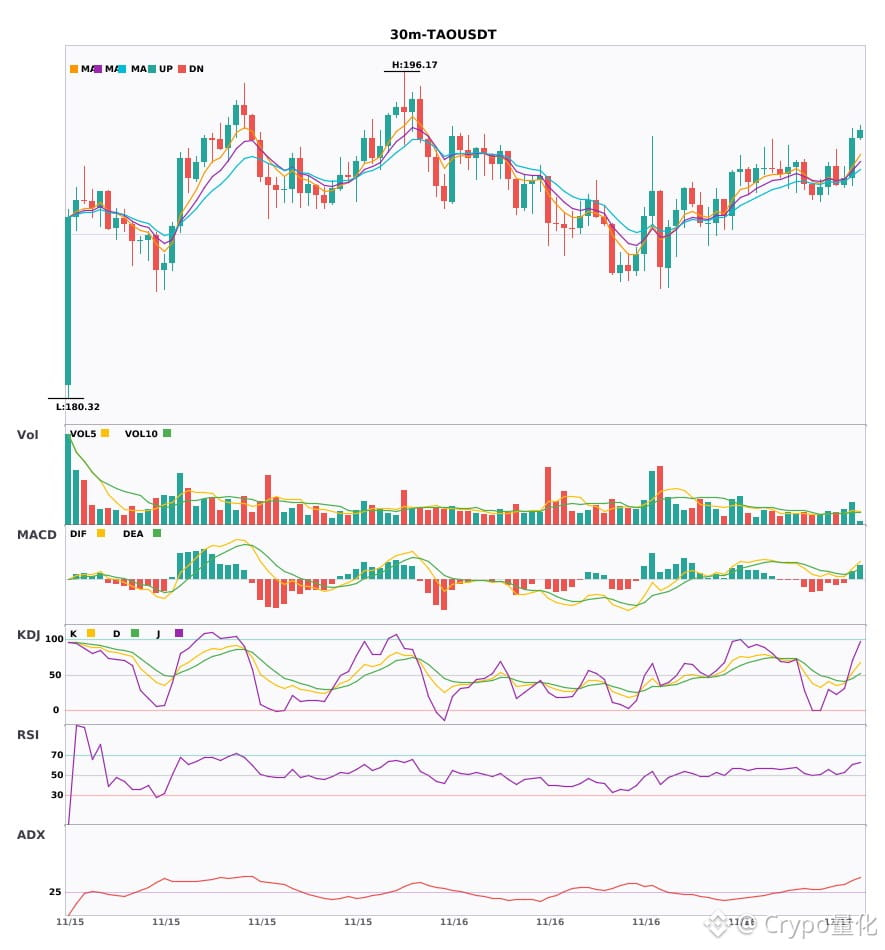
$TAO $MARSCOIN $ZAMA 30-minute bullish signals are firing across the board 🔥
════════════════════
🔴 $TAO 30-minute bullish signal
⚠️Technical analysis: ADX shows a clear trend. MACD has a bullish crossover with rising volume and steadily growing red bars. The moving averages are in a bullish alignment and spreading upward. K has crossed above D but is not yet overbought. Volume has also increased, suggesting a short-term bullish outlook.
════════════════════
🔴 $MARSCOIN 30-minute bullish signal
⚠️Technical analysis: ADX (28) shows the trend is just emerging and may continue | MACD bullish crossover with rising volume, moving above the zero line | EMA5 crossed above EMA8, signaling a short-term bullish trend | Volume up 1.5x
════════════════════
🔴 $ZAMA 30-minute bullish signal
⚠️Technical analysis: The trend is particularly strong, but beware of overheating and a pullback. MACD has a bullish crossover above zero with rising volume. The moving averages are in a bullish alignment and spreading upward. KDJ has a bullish crossover but is not yet in overbought territory. Volume is up 1.6x.
════════════════════
🔔 Follow for first-hand market alerts 🔔
#技术分析 #TAO #MARSCOIN #ZAMA
📌 When trading, check whether the K-line pattern confirms the setup
$TAO $MARSCOIN $ZAMA 30-minute bullish signals are firing across the board 🔥
════════════════════
🔴 $TAO 30-minute bullish signal
⚠️Technical analysis: ADX shows a clear trend. MACD has a bullish crossover with rising volume and steadily growing red bars. The moving averages are in a bullish alignment and spreading upward. K has crossed above D but is not yet overbought. Volume has also increased, suggesting a short-term bullish outlook.
════════════════════
🔴 $MARSCOIN 30-minute bullish signal
⚠️Technical analysis: ADX (28) shows the trend is just emerging and may continue | MACD bullish crossover with rising volume, moving above the zero line | EMA5 crossed above EMA8, signaling a short-term bullish trend | Volume up 1.5x
════════════════════
🔴 $ZAMA 30-minute bullish signal
⚠️Technical analysis: The trend is particularly strong, but beware of overheating and a pullback. MACD has a bullish crossover above zero with rising volume. The moving averages are in a bullish alignment and spreading upward. KDJ has a bullish crossover but is not yet in overbought territory. Volume is up 1.6x.
════════════════════
🔔 Follow for first-hand market alerts 🔔
#技术分析 #TAO #MARSCOIN #ZAMA
📌 When trading, check whether the K-line pattern confirms the setup
════════════════════
🔴 $TAO 30-minute bullish signal
⚠️Technical analysis: ADX shows a clear trend. MACD has a bullish crossover with rising volume and steadily growing red bars. The moving averages are in a bullish alignment and spreading upward. K has crossed above D but is not yet overbought. Volume has also increased, suggesting a short-term bullish outlook.
════════════════════
🔴 $MARSCOIN 30-minute bullish signal
⚠️Technical analysis: ADX (28) shows the trend is just emerging and may continue | MACD bullish crossover with rising volume, moving above the zero line | EMA5 crossed above EMA8, signaling a short-term bullish trend | Volume up 1.5x
════════════════════
🔴 $ZAMA 30-minute bullish signal
⚠️Technical analysis: The trend is particularly strong, but beware of overheating and a pullback. MACD has a bullish crossover above zero with rising volume. The moving averages are in a bullish alignment and spreading upward. KDJ has a bullish crossover but is not yet in overbought territory. Volume is up 1.6x.
════════════════════
🔔 Follow for first-hand market alerts 🔔
#技术分析 #TAO #MARSCOIN #ZAMA
📌 When trading, check whether the K-line pattern confirms the setup
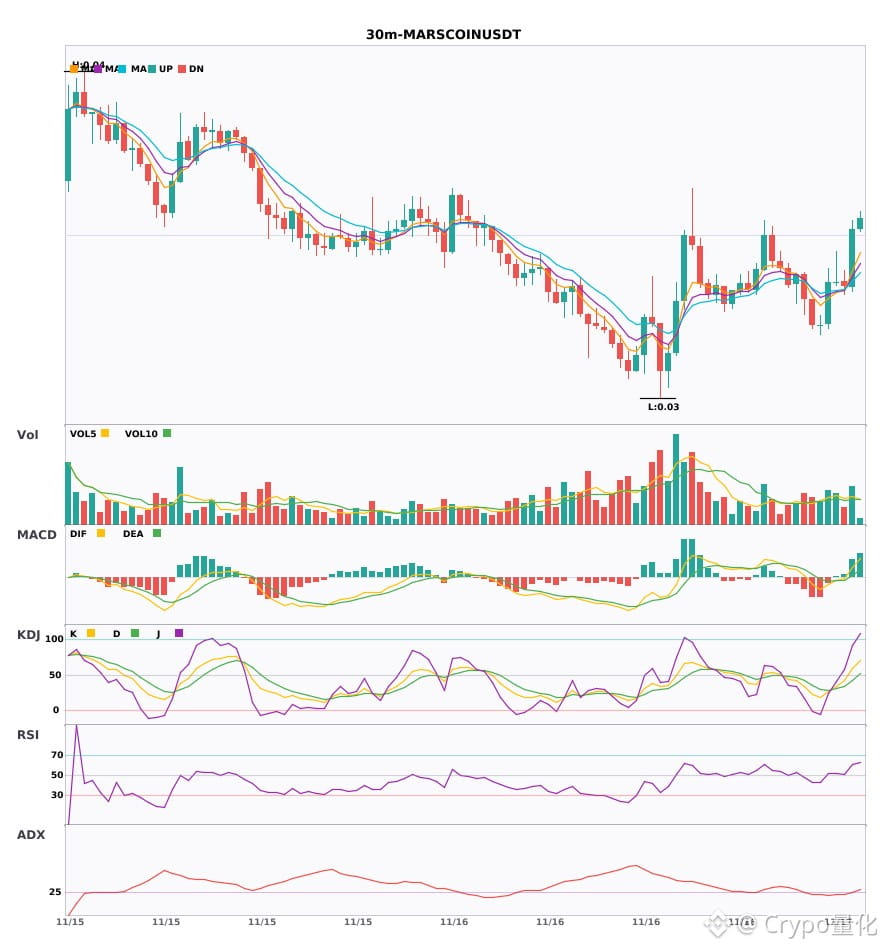
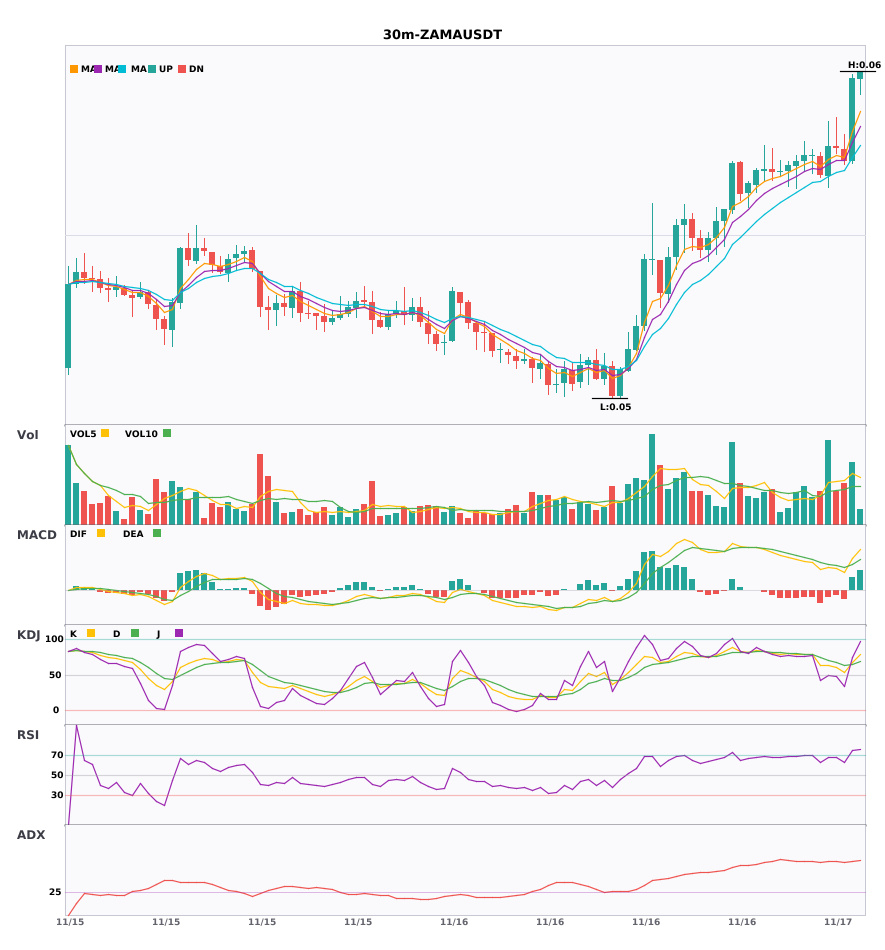
47

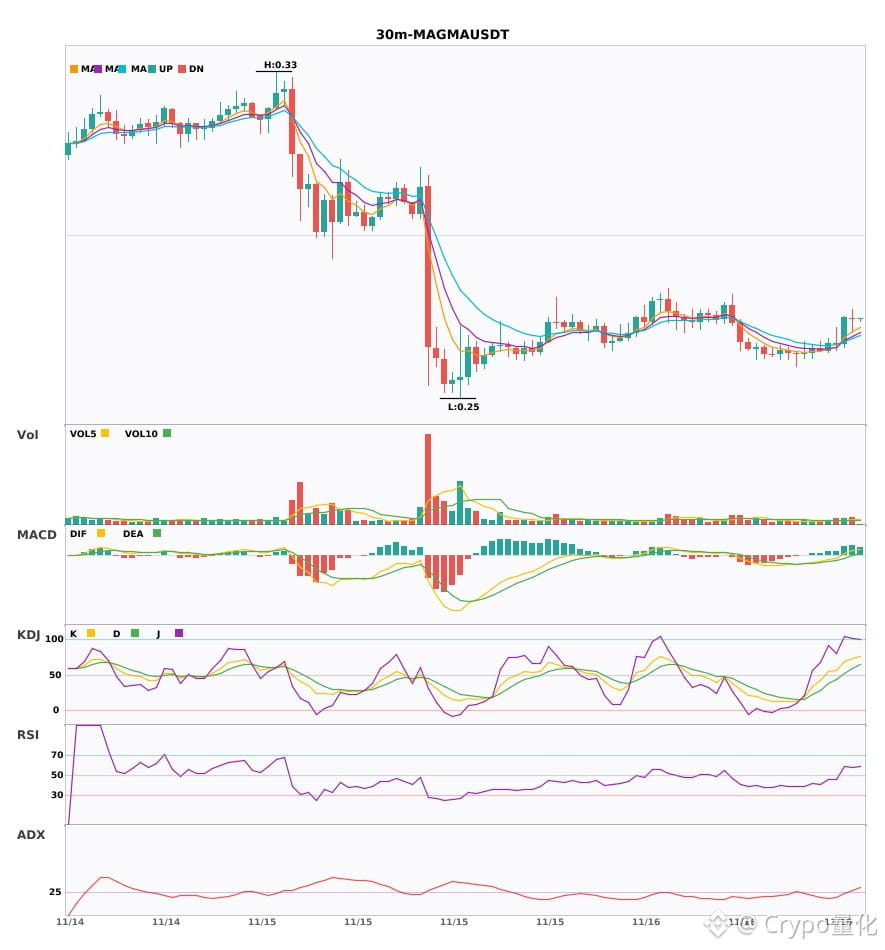
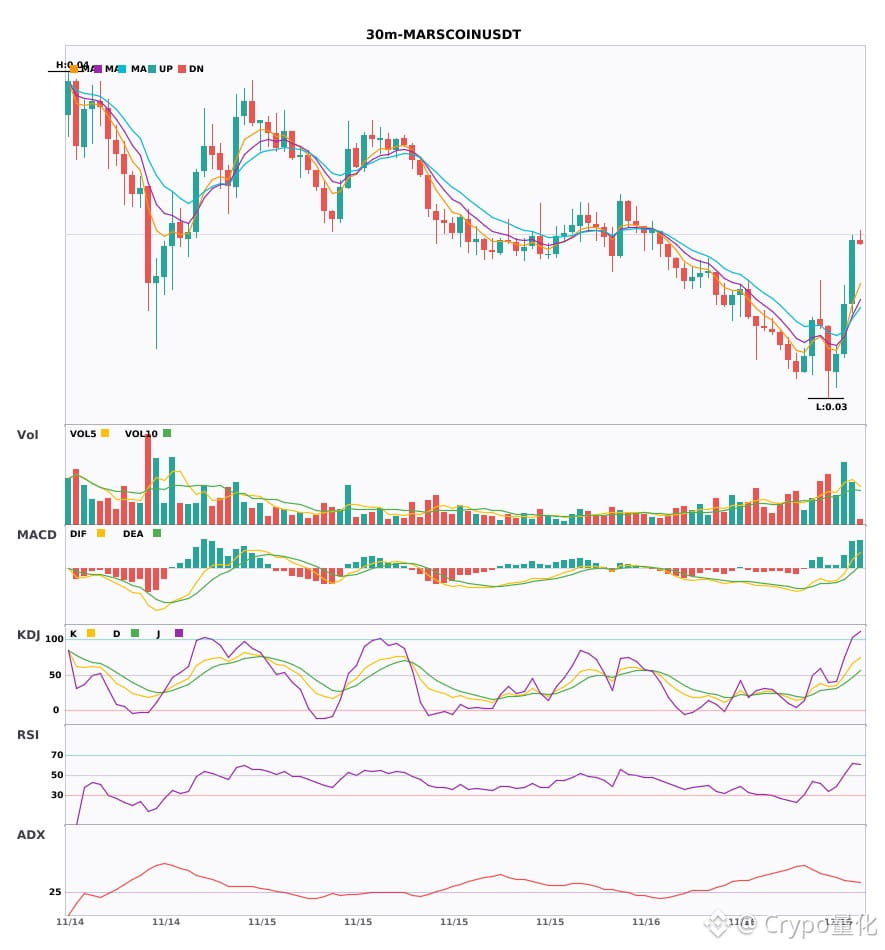
$MAGMA/$MARSCOIN minute-level bullish dual-signal confluence
📈 $MAGMA | 30-minute bullish signal
━━━━━━━━━━━━━━━━━━
Technical analysis: ADX(27) indicates a developing trend; participation is possible. MACD DIF crosses above the zero line, turning bullish. EMA5>8>13 show a bullish alignment. KDJ is strong (K69.2/D52.1). Volume increased 1.6x.
Price change: 2.4800%
📈 $MARSCOIN | 30-minute bullish signal
━━━━━━━━━━━━━━━━━━
Technical analysis: ADX(38) indicates a clear trend. MACD DIF crosses above the zero line, with momentum turning bullish. EMA5>EMA8>EMA13 show a bullish alignment. Volume increased 1.9x.
Price change: 2.9400%
━━━━━━━━━━━━━━━━━━
#技术分析 #MAGMA #MARSCOIN
📌 The above is for reference only and does not constitute investment advice
$MAGMA /$MARSCOIN minute-level bullish dual-signal confluence
📈 $MAGMA | 30-minute bullish signal
━━━━━━━━━━━━━━━━━━
Technical analysis: ADX(27) indicates a developing trend; participation is possible. MACD DIF crosses above the zero line, turning bullish. EMA5>8>13 show a bullish alignment. KDJ is strong (K69.2/D52.1). Volume increased 1.6x.
Price change: 2.4800%
📈 $MARSCOIN | 30-minute bullish signal
━━━━━━━━━━━━━━━━━━
Technical analysis: ADX(38) indicates a clear trend. MACD DIF crosses above the zero line, with momentum turning bullish. EMA5>EMA8>EMA13 show a bullish alignment. Volume increased 1.9x.
Price change: 2.9400%
━━━━━━━━━━━━━━━━━━
#技术分析 #MAGMA #MARSCOIN
📌 The above is for reference only and does not constitute investment advice
📈 $MAGMA | 30-minute bullish signal
━━━━━━━━━━━━━━━━━━
Technical analysis: ADX(27) indicates a developing trend; participation is possible. MACD DIF crosses above the zero line, turning bullish. EMA5>8>13 show a bullish alignment. KDJ is strong (K69.2/D52.1). Volume increased 1.6x.
Price change: 2.4800%
📈 $MARSCOIN | 30-minute bullish signal
━━━━━━━━━━━━━━━━━━
Technical analysis: ADX(38) indicates a clear trend. MACD DIF crosses above the zero line, with momentum turning bullish. EMA5>EMA8>EMA13 show a bullish alignment. Volume increased 1.9x.
Price change: 2.9400%
━━━━━━━━━━━━━━━━━━
#技术分析 #MAGMA #MARSCOIN
📌 The above is for reference only and does not constitute investment advice
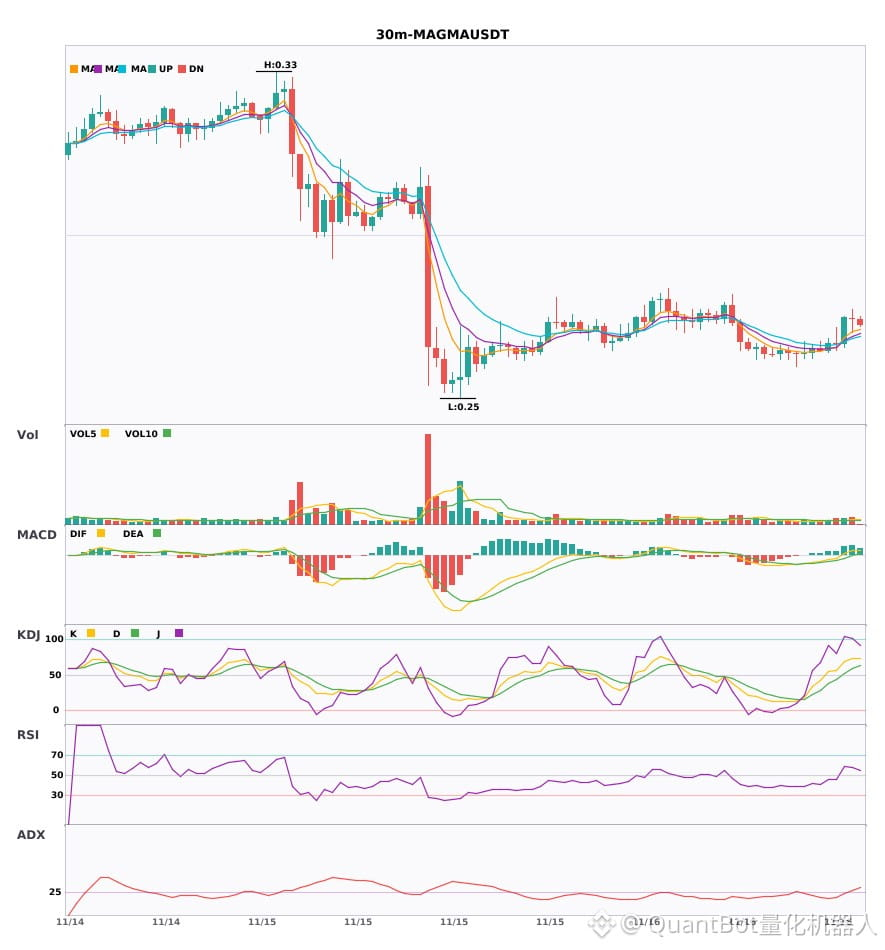
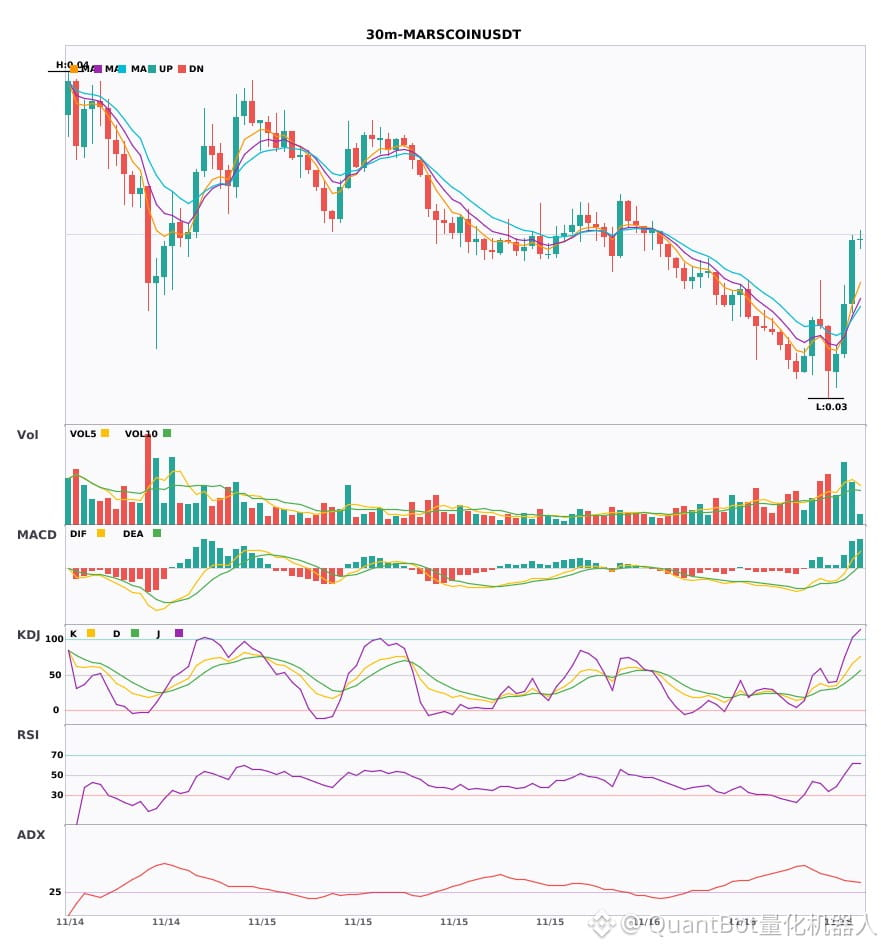
52
·
--
$MAGMA and the $MARSCOIN 30-minute bullish signals are here 🔥
════════════════════
🔴 $MAGMA 30-minute bullish signal
⚠️ Technicals: ADX 27, trend just taking shape; MACD bullish crossover above the zero line; moving averages in bullish alignment; KDJ K crossed above D without entering overbought territory; volume up 1.6x
════════════════════
🔴 $MARSCOIN 30-minute bullish signal
⚠️ Technicals: ADX 38, strong trend; MACD bullish crossover above the zero line; moving averages have just formed a bullish alignment; trading volume up 1.9x
════════════════════
🔔 Follow for first-hand market updates 🔔
#技术分析 #MAGMA #MARSCOIN
📌 When trading, check whether the candlestick pattern confirms the signal
$MAGMA and the $MARSCOIN 30-minute bullish signals are here 🔥
════════════════════
🔴 $MAGMA 30-minute bullish signal
⚠️ Technicals: ADX 27, trend just taking shape; MACD bullish crossover above the zero line; moving averages in bullish alignment; KDJ K crossed above D without entering overbought territory; volume up 1.6x
════════════════════
🔴 $MARSCOIN 30-minute bullish signal
⚠️ Technicals: ADX 38, strong trend; MACD bullish crossover above the zero line; moving averages have just formed a bullish alignment; trading volume up 1.9x
════════════════════
🔔 Follow for first-hand market updates 🔔
#技术分析 #MAGMA #MARSCOIN
📌 When trading, check whether the candlestick pattern confirms the signal
════════════════════
🔴 $MAGMA 30-minute bullish signal
⚠️ Technicals: ADX 27, trend just taking shape; MACD bullish crossover above the zero line; moving averages in bullish alignment; KDJ K crossed above D without entering overbought territory; volume up 1.6x
════════════════════
🔴 $MARSCOIN 30-minute bullish signal
⚠️ Technicals: ADX 38, strong trend; MACD bullish crossover above the zero line; moving averages have just formed a bullish alignment; trading volume up 1.9x
════════════════════
🔔 Follow for first-hand market updates 🔔
#技术分析 #MAGMA #MARSCOIN
📌 When trading, check whether the candlestick pattern confirms the signal
10
·
--
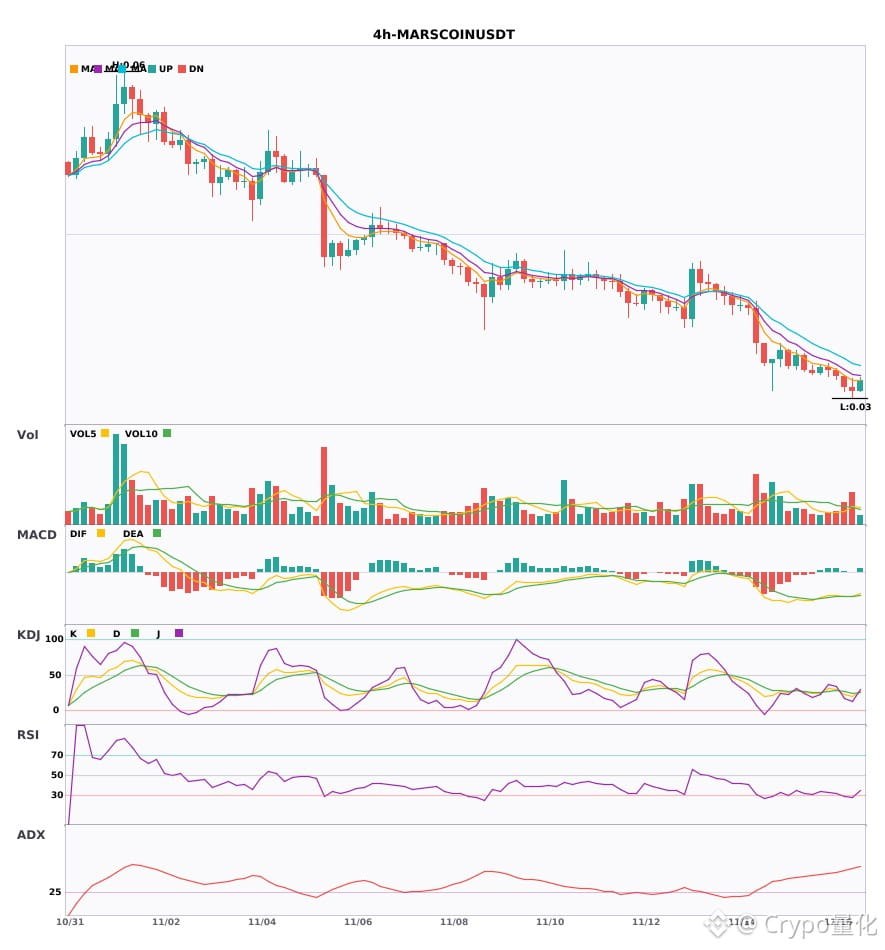
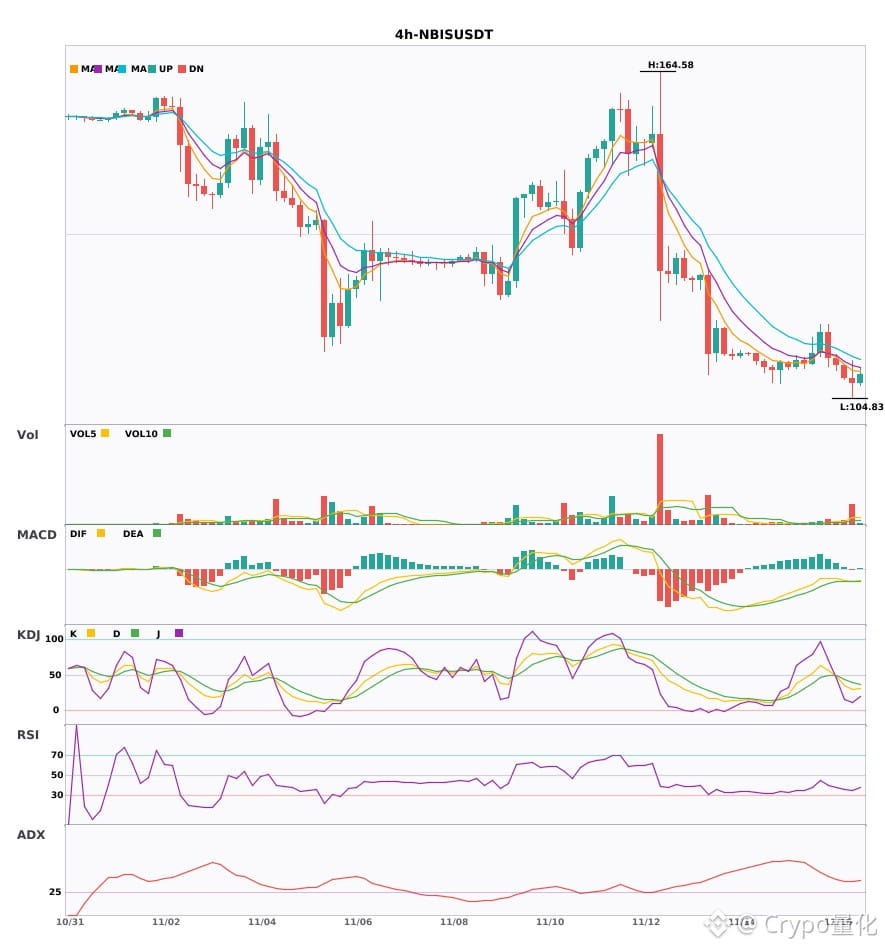
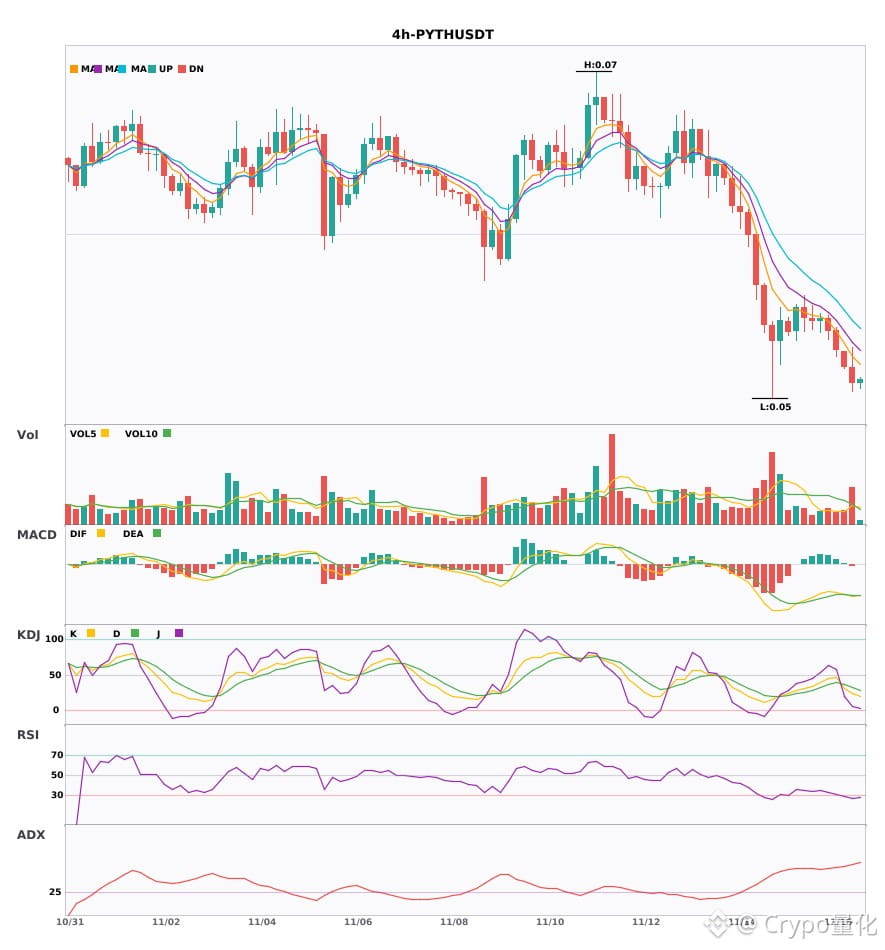
$MARSCOIN/$NBIS/$PYTH 4 4-hour short-term bearish pressure 🔥
════════════════════
🟢 $MARSCOIN 4 4-hour bearish signal
⚠️Technical analysis: ADX shows a strong trend, but beware of an overbought pullback. MACD bearish crossover is accelerating; moving averages are bearishly aligned and trending downward. KDJ is weak, with K not crossing above D. Volume is up 1.8x.
════════════════════
🟢 $NBIS 4 4-hour bearish signal
⚠️Technical analysis: ADX 36 indicates a clear trend. MACD bearish crossover below zero is accelerating; moving averages are bearishly aligned and diverging downward. KDJ is weak, with K not crossing above D (K 30.1, D 39.6). Volume has surged 4.7x.
════════════════════
🟢 $PYTH 4 4-hour bearish signal
⚠️Technical analysis: ADX indicates a very strong trend, but beware of an overbought pullback. MACD bearish crossover below zero is accelerating; moving averages are bearishly aligned. KDJ is weak, with K crossing below D. Trading volume is up 1.8x.
════════════════════
🔔 Follow for first-hand market alerts 🔔
#技术分析 #MARSCOIN #NBIS #PYTH
📌 When trading, pay attention to whether the candlestick patterns confirm the setup
$MARSCOIN /$NBIS /$PYTH 4 4-hour short-term bearish pressure 🔥
════════════════════
🟢 $MARSCOIN 4 4-hour bearish signal
⚠️Technical analysis: ADX shows a strong trend, but beware of an overbought pullback. MACD bearish crossover is accelerating; moving averages are bearishly aligned and trending downward. KDJ is weak, with K not crossing above D. Volume is up 1.8x.
════════════════════
🟢 $NBIS 4 4-hour bearish signal
⚠️Technical analysis: ADX 36 indicates a clear trend. MACD bearish crossover below zero is accelerating; moving averages are bearishly aligned and diverging downward. KDJ is weak, with K not crossing above D (K 30.1, D 39.6). Volume has surged 4.7x.
════════════════════
🟢 $PYTH 4 4-hour bearish signal
⚠️Technical analysis: ADX indicates a very strong trend, but beware of an overbought pullback. MACD bearish crossover below zero is accelerating; moving averages are bearishly aligned. KDJ is weak, with K crossing below D. Trading volume is up 1.8x.
════════════════════
🔔 Follow for first-hand market alerts 🔔
#技术分析 #MARSCOIN #NBIS #PYTH
📌 When trading, pay attention to whether the candlestick patterns confirm the setup
════════════════════
🟢 $MARSCOIN 4 4-hour bearish signal
⚠️Technical analysis: ADX shows a strong trend, but beware of an overbought pullback. MACD bearish crossover is accelerating; moving averages are bearishly aligned and trending downward. KDJ is weak, with K not crossing above D. Volume is up 1.8x.
════════════════════
🟢 $NBIS 4 4-hour bearish signal
⚠️Technical analysis: ADX 36 indicates a clear trend. MACD bearish crossover below zero is accelerating; moving averages are bearishly aligned and diverging downward. KDJ is weak, with K not crossing above D (K 30.1, D 39.6). Volume has surged 4.7x.
════════════════════
🟢 $PYTH 4 4-hour bearish signal
⚠️Technical analysis: ADX indicates a very strong trend, but beware of an overbought pullback. MACD bearish crossover below zero is accelerating; moving averages are bearishly aligned. KDJ is weak, with K crossing below D. Trading volume is up 1.8x.
════════════════════
🔔 Follow for first-hand market alerts 🔔
#技术分析 #MARSCOIN #NBIS #PYTH
📌 When trading, pay attention to whether the candlestick patterns confirm the setup
19
·
--
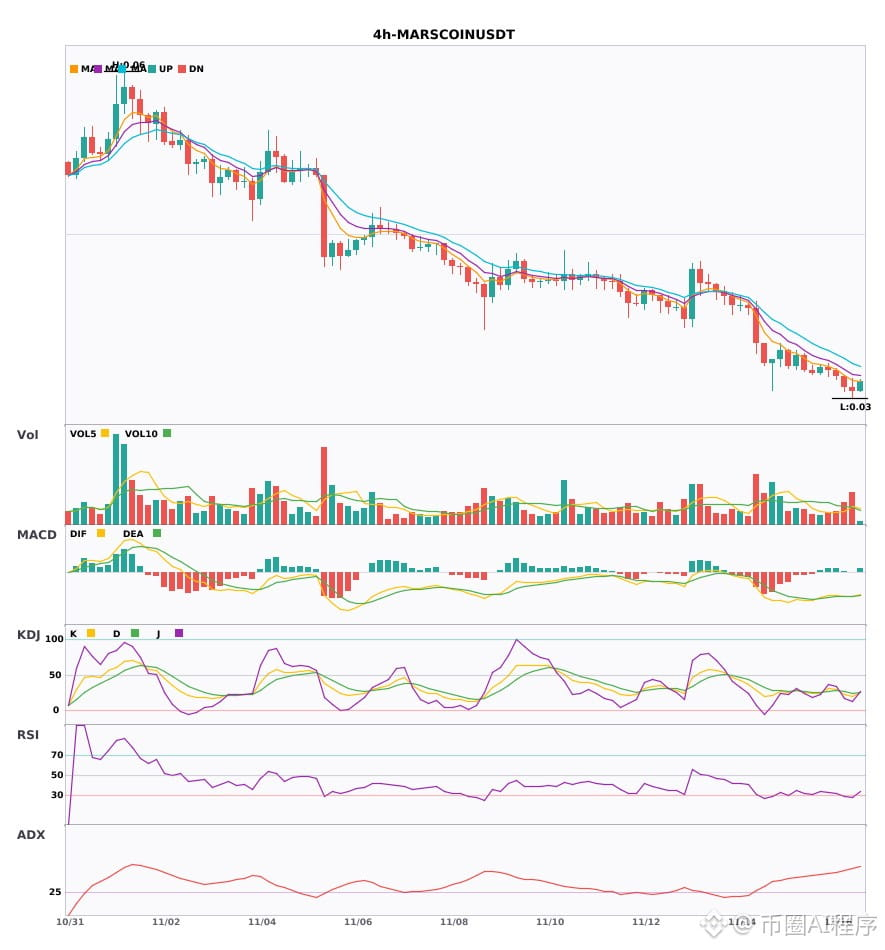
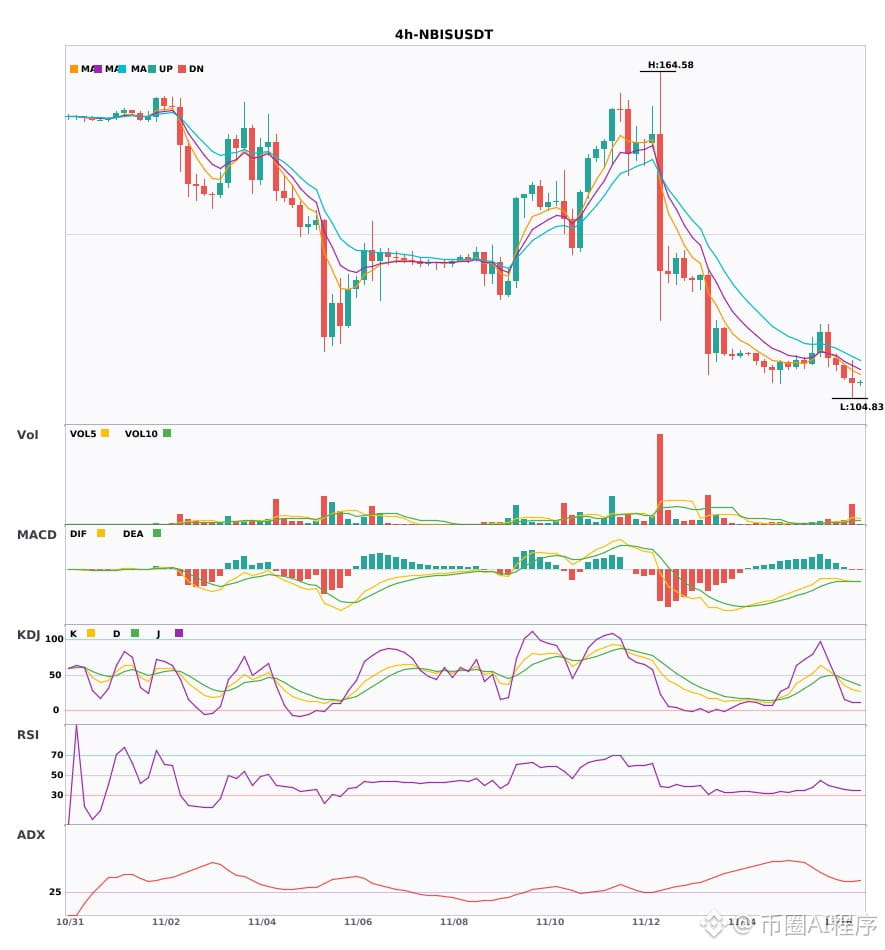
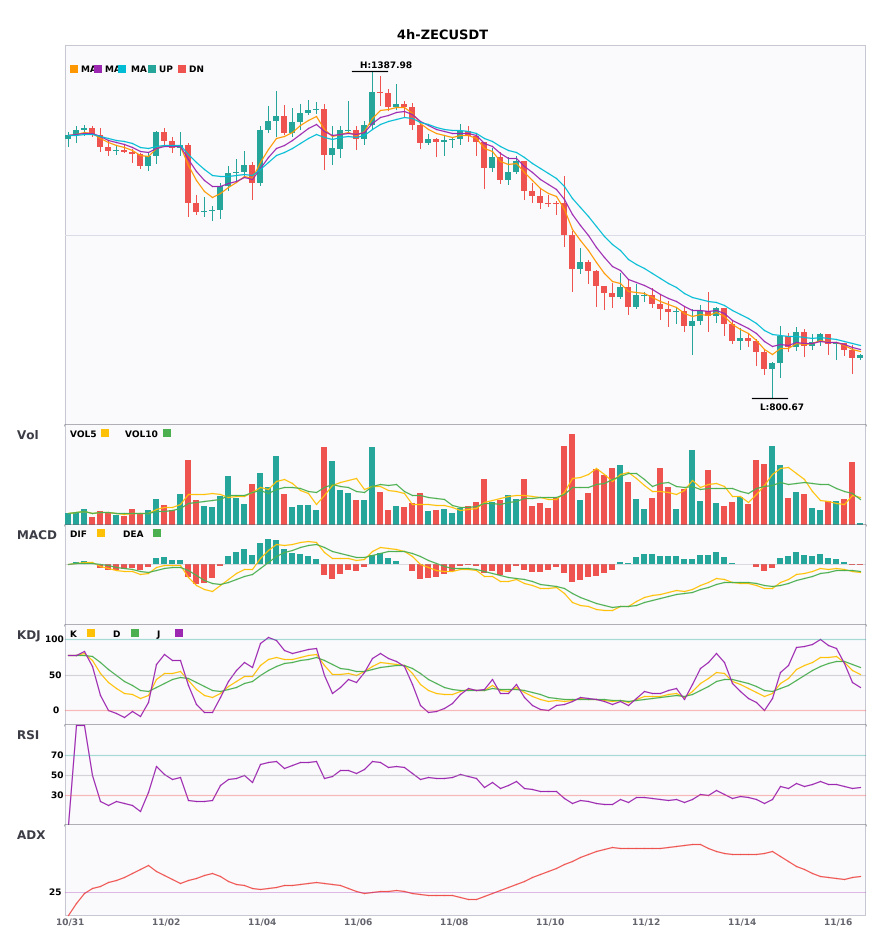
$MARSCOIN/$NBIS/$ZEC 4-hour and daily-chart bearish confluence short 🔥
════════════════════
🟢 $MARSCOIN 4-hour bearish signal
⚠️Technical analysis: 4-hour and daily-chart bearish confluence confirmed! MACD bearish crossover below zero, green bars expanding, moving averages diverging downward in bearish alignment, KDJ trending weakly with bears in control, volume up 1.8x.
════════════════════
🟢 $NBIS 4-hour bearish signal
⚠️Technical analysis: Daily and 4-hour bearish confluence confirmed: MACD bearish crossover below zero on rising volume, moving averages in a bearish alignment diverging downward, KDJ weak with K crossing below D, volume surging 4.7x, bears gaining momentum.
════════════════════
🟢 $ZEC 4-hour bearish signal
⚠️Technical analysis: Daily and 4-hour bearish confluence confirmed! MACD bearish crossover below zero accelerating, EMA5/8/13 in a bearish alignment pointing downward, volume up 2x, KDJ slightly strong in the mid-range.
════════════════════
🔔 Follow for firsthand market updates 🔔
#多周期共振 #MARSCOIN #NBIS #ZEC
📌 When trading, pay attention to whether the candlestick pattern is consistent
$MARSCOIN /$NBIS /$ZEC 4-hour and daily-chart bearish confluence short 🔥
════════════════════
🟢 $MARSCOIN 4-hour bearish signal
⚠️Technical analysis: 4-hour and daily-chart bearish confluence confirmed! MACD bearish crossover below zero, green bars expanding, moving averages diverging downward in bearish alignment, KDJ trending weakly with bears in control, volume up 1.8x.
════════════════════
🟢 $NBIS 4-hour bearish signal
⚠️Technical analysis: Daily and 4-hour bearish confluence confirmed: MACD bearish crossover below zero on rising volume, moving averages in a bearish alignment diverging downward, KDJ weak with K crossing below D, volume surging 4.7x, bears gaining momentum.
════════════════════
🟢 $ZEC 4-hour bearish signal
⚠️Technical analysis: Daily and 4-hour bearish confluence confirmed! MACD bearish crossover below zero accelerating, EMA5/8/13 in a bearish alignment pointing downward, volume up 2x, KDJ slightly strong in the mid-range.
════════════════════
🔔 Follow for firsthand market updates 🔔
#多周期共振 #MARSCOIN #NBIS #ZEC
📌 When trading, pay attention to whether the candlestick pattern is consistent
════════════════════
🟢 $MARSCOIN 4-hour bearish signal
⚠️Technical analysis: 4-hour and daily-chart bearish confluence confirmed! MACD bearish crossover below zero, green bars expanding, moving averages diverging downward in bearish alignment, KDJ trending weakly with bears in control, volume up 1.8x.
════════════════════
🟢 $NBIS 4-hour bearish signal
⚠️Technical analysis: Daily and 4-hour bearish confluence confirmed: MACD bearish crossover below zero on rising volume, moving averages in a bearish alignment diverging downward, KDJ weak with K crossing below D, volume surging 4.7x, bears gaining momentum.
════════════════════
🟢 $ZEC 4-hour bearish signal
⚠️Technical analysis: Daily and 4-hour bearish confluence confirmed! MACD bearish crossover below zero accelerating, EMA5/8/13 in a bearish alignment pointing downward, volume up 2x, KDJ slightly strong in the mid-range.
════════════════════
🔔 Follow for firsthand market updates 🔔
#多周期共振 #MARSCOIN #NBIS #ZEC
📌 When trading, pay attention to whether the candlestick pattern is consistent
18

·
--
Three coins showing multi-timeframe bearish confluence; signals triggered simultaneously on the 30-minute and 4-hour charts 🔥
════════════════════
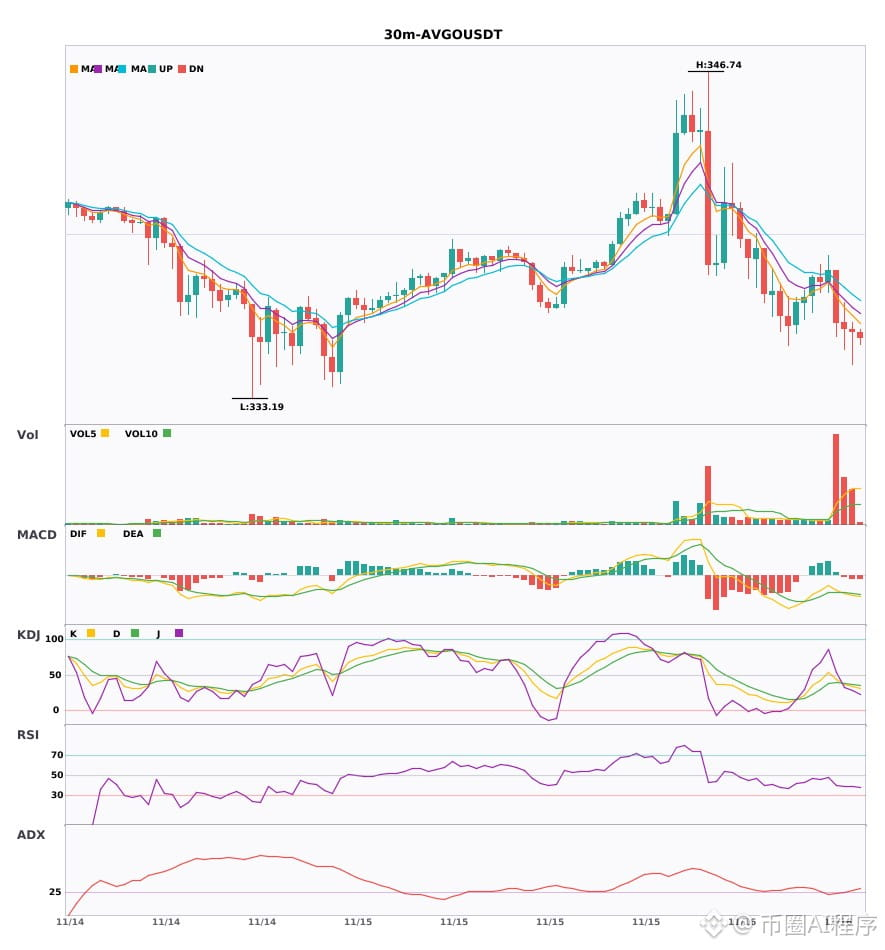
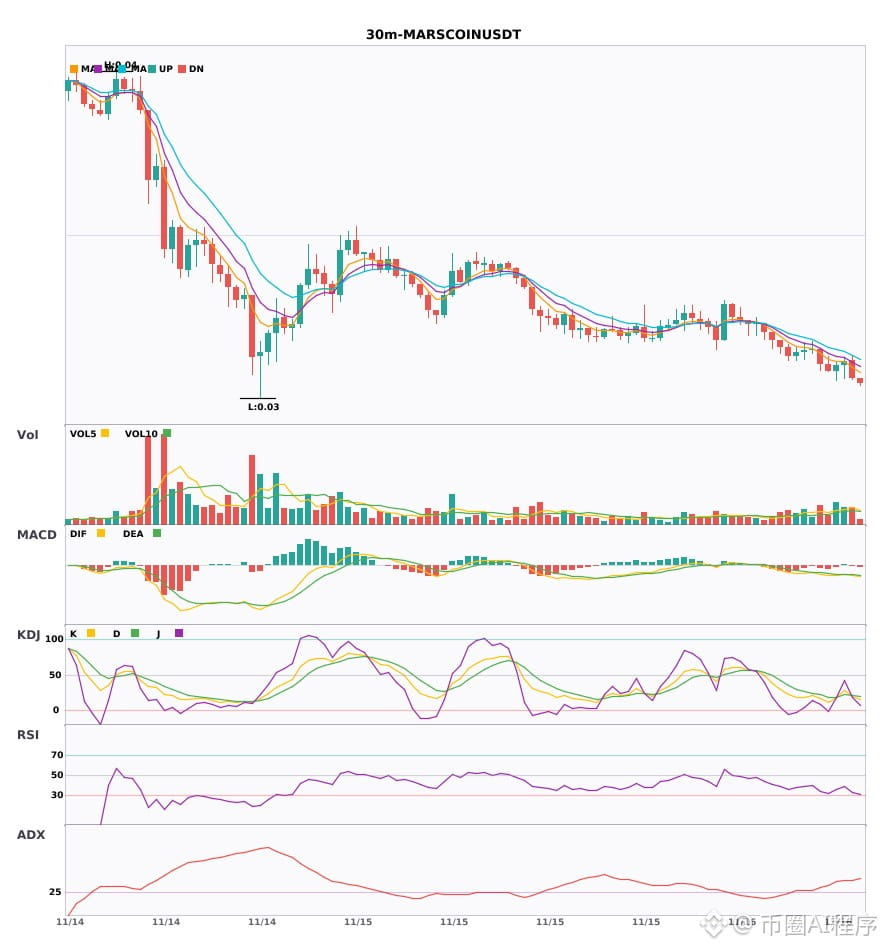
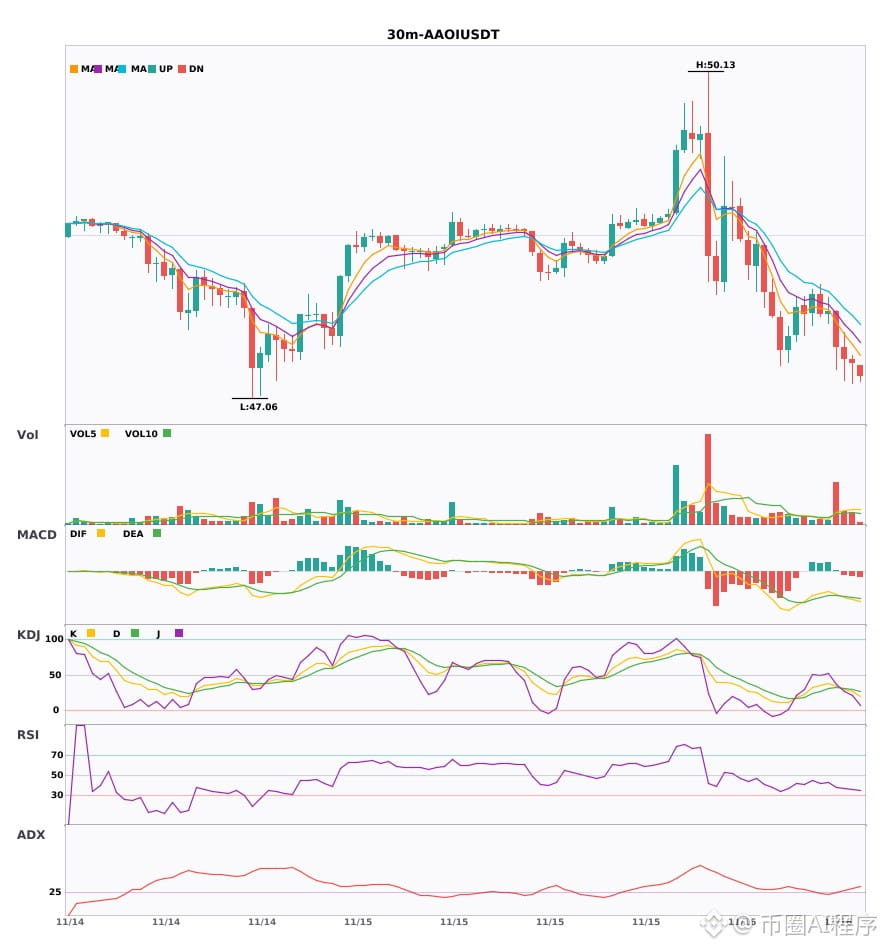
🟢 $AVGO 30-minute Short Signal
⚠️ Technical analysis: 4-hour + 30-minute bearish confluence! The 30-minute MACD has formed a bearish crossover below zero, moving averages are bearishly aligned, and the KDJ has formed a bearish crossover without being oversold. Trading volume is up 6.7x; short-term outlook is bearish.
════════════════════
🟢 $MARSCOIN 30-minute Short Signal
⚠️ Technical analysis: 4-hour bearish confluence + 30-minute entry: The MACD has formed a bearish crossover with expanding green bars, moving averages are bearishly aligned and trending downward, and the KDJ has formed a bearish crossover without being oversold. Go short.
════════════════════
🟢 $AAOI 30-minute Short Signal
⚠️ Technical analysis: 30-minute entry: The MACD has formed a bearish crossover below zero, with expanding green bars; moving averages are bearishly aligned and diverging downward; the KDJ has formed a bearish crossover without being oversold. 4-hour bearish confluence confirmed; multiple timeframes point to a bearish outlook. Trading volume is up 3.8x.
════════════════════
🔔 Follow for first-hand market movement alerts 🔔
#多周期共振 #AVGO #MARSCOIN #AAOI
📌 When trading, pay attention to whether the candlestick patterns confirm the setup
Three coins showing multi-timeframe bearish confluence; signals triggered simultaneously on the 30-minute and 4-hour charts 🔥
════════════════════
🟢 $AVGO 30-minute Short Signal
⚠️ Technical analysis: 4-hour + 30-minute bearish confluence! The 30-minute MACD has formed a bearish crossover below zero, moving averages are bearishly aligned, and the KDJ has formed a bearish crossover without being oversold. Trading volume is up 6.7x; short-term outlook is bearish.
════════════════════
🟢 $MARSCOIN 30-minute Short Signal
⚠️ Technical analysis: 4-hour bearish confluence + 30-minute entry: The MACD has formed a bearish crossover with expanding green bars, moving averages are bearishly aligned and trending downward, and the KDJ has formed a bearish crossover without being oversold. Go short.
════════════════════
🟢 $AAOI 30-minute Short Signal
⚠️ Technical analysis: 30-minute entry: The MACD has formed a bearish crossover below zero, with expanding green bars; moving averages are bearishly aligned and diverging downward; the KDJ has formed a bearish crossover without being oversold. 4-hour bearish confluence confirmed; multiple timeframes point to a bearish outlook. Trading volume is up 3.8x.
════════════════════
🔔 Follow for first-hand market movement alerts 🔔
#多周期共振 #AVGO #MARSCOIN #AAOI
📌 When trading, pay attention to whether the candlestick patterns confirm the setup
════════════════════
🟢 $AVGO 30-minute Short Signal
⚠️ Technical analysis: 4-hour + 30-minute bearish confluence! The 30-minute MACD has formed a bearish crossover below zero, moving averages are bearishly aligned, and the KDJ has formed a bearish crossover without being oversold. Trading volume is up 6.7x; short-term outlook is bearish.
════════════════════
🟢 $MARSCOIN 30-minute Short Signal
⚠️ Technical analysis: 4-hour bearish confluence + 30-minute entry: The MACD has formed a bearish crossover with expanding green bars, moving averages are bearishly aligned and trending downward, and the KDJ has formed a bearish crossover without being oversold. Go short.
════════════════════
🟢 $AAOI 30-minute Short Signal
⚠️ Technical analysis: 30-minute entry: The MACD has formed a bearish crossover below zero, with expanding green bars; moving averages are bearishly aligned and diverging downward; the KDJ has formed a bearish crossover without being oversold. 4-hour bearish confluence confirmed; multiple timeframes point to a bearish outlook. Trading volume is up 3.8x.
════════════════════
🔔 Follow for first-hand market movement alerts 🔔
#多周期共振 #AVGO #MARSCOIN #AAOI
📌 When trading, pay attention to whether the candlestick patterns confirm the setup
5

·
--
A truth that's not much to laugh about: a $MARSCOIN 24-hour low, current price 0.0327, previous low 0.0329.
Whenever a new low is reached, someone in the comments always says “one last dip,” and then the market politely dips another level.
There's no need to rush into buying the dip; it's safer to wait for a confirmed bottom.
#MARSCOIN
A truth that's not much to laugh about: a $MARSCOIN 24-hour low, current price 0.0327, previous low 0.0329.
Whenever a new low is reached, someone in the comments always says “one last dip,” and then the market politely dips another level.
There's no need to rush into buying the dip; it's safer to wait for a confirmed bottom.
#MARSCOIN
Whenever a new low is reached, someone in the comments always says “one last dip,” and then the market politely dips another level.
There's no need to rush into buying the dip; it's safer to wait for a confirmed bottom.
#MARSCOIN
16


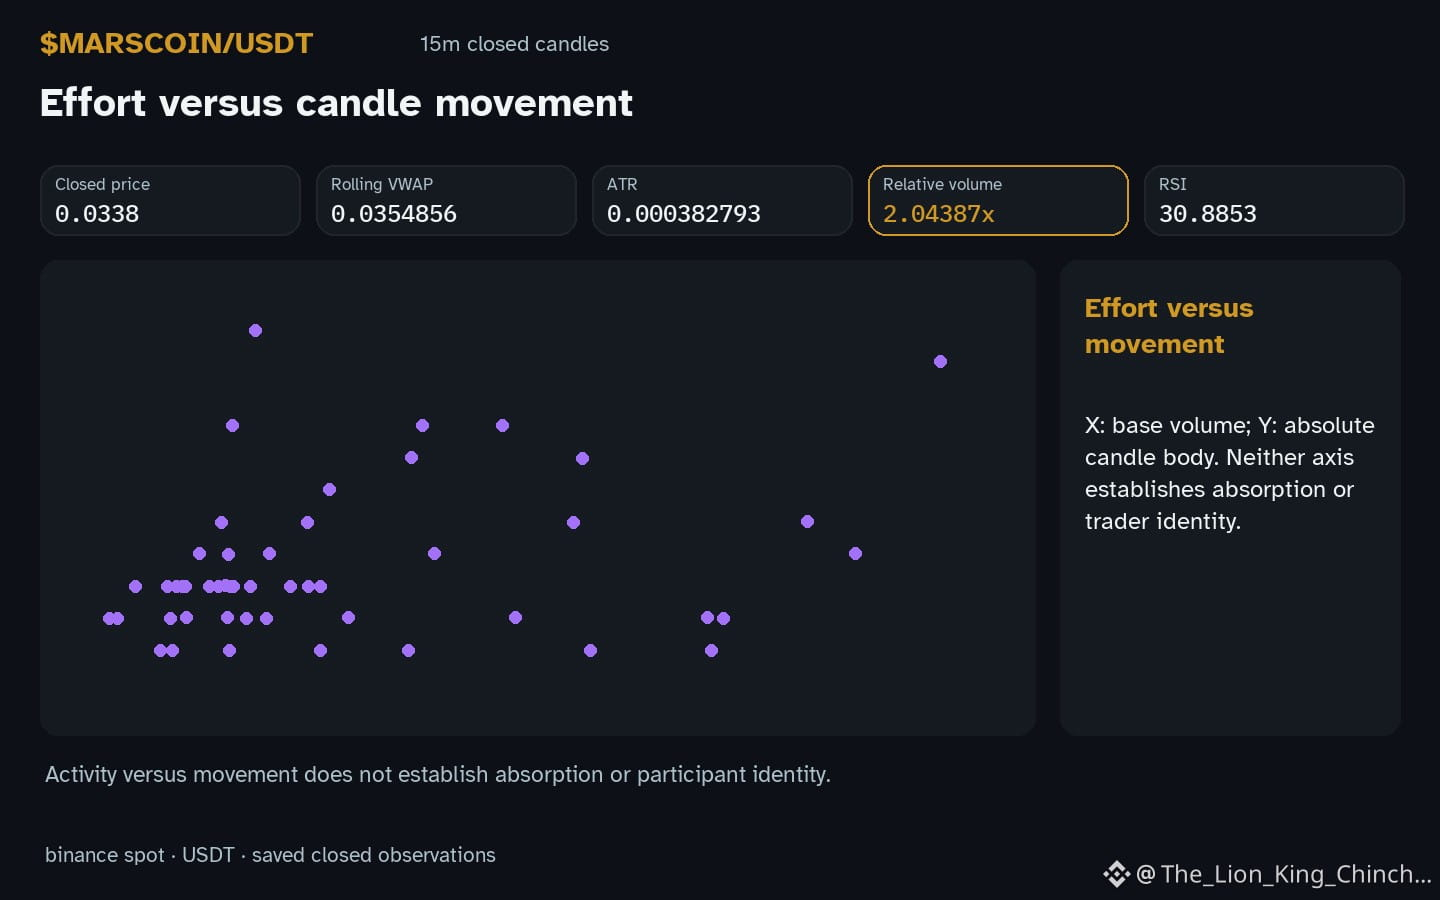
$MARSCOIN: MARSCOIN: The Quiet Library Test
$MARSCOIN price is below 0.0339 with hourly direction down.
Think of a quiet library. A loud argument changes the room. A whisper does not, yet a librarian may hear it. In markets, volume that is 2.04x baseline can feel loud. But if price stays rangebound, the move may be absorbed. This is a hypothetical mechanism, not a claim that specific traders are hiding orders. Candles show outcomes, not intentions.
The analogy breaks here. High relative volume is a ratio, not a measurement of who is buying. It does not confirm hidden accumulation or stop hunts. Imagine two scenarios. First, a large limit order absorbs selling. The range contracts. Second, market sell orders overwhelm buyers, and price drops further. Candles alone cannot distinguish these paths. Do not infer motives from the shape of the bar.
RSI at 30.9 provides context. It is an indicator reading, not a price bound. If RSI makes a new low while price holds range, that is a divergence in the indicator, not proof of reversal. Such patterns can fail. A counterexample is a slow bleed. Price stops falling, but RSI drifts lower. No breakout occurs. The "absorption" was just exhaustion. This shows why we must test the idea, not assume it.
To reassess this interpretation, watch for a closed candle. If the next candle closes back inside the prior range with volume returning to normal, the absorption idea weakens. If it breaks below 0.0339, the quiet phase may have been a pause. Keep it simple. Do not guess the end of the story before the candles close. The limit of candles is that they remove the why. Use them to state what happened, not to predict what will happen. Treat the current setup as a single data point in a larger test.
Probabilistic market research, not a recommendation or guaranteed return.
Where does this analogy help, and where does it break?
#MARSCOIN #CryptoEducation #CryptoLearning
$MARSCOIN : MARSCOIN: The Quiet Library Test
$MARSCOIN price is below 0.0339 with hourly direction down.
Think of a quiet library. A loud argument changes the room. A whisper does not, yet a librarian may hear it. In markets, volume that is 2.04x baseline can feel loud. But if price stays rangebound, the move may be absorbed. This is a hypothetical mechanism, not a claim that specific traders are hiding orders. Candles show outcomes, not intentions.
The analogy breaks here. High relative volume is a ratio, not a measurement of who is buying. It does not confirm hidden accumulation or stop hunts. Imagine two scenarios. First, a large limit order absorbs selling. The range contracts. Second, market sell orders overwhelm buyers, and price drops further. Candles alone cannot distinguish these paths. Do not infer motives from the shape of the bar.
RSI at 30.9 provides context. It is an indicator reading, not a price bound. If RSI makes a new low while price holds range, that is a divergence in the indicator, not proof of reversal. Such patterns can fail. A counterexample is a slow bleed. Price stops falling, but RSI drifts lower. No breakout occurs. The "absorption" was just exhaustion. This shows why we must test the idea, not assume it.
To reassess this interpretation, watch for a closed candle. If the next candle closes back inside the prior range with volume returning to normal, the absorption idea weakens. If it breaks below 0.0339, the quiet phase may have been a pause. Keep it simple. Do not guess the end of the story before the candles close. The limit of candles is that they remove the why. Use them to state what happened, not to predict what will happen. Treat the current setup as a single data point in a larger test.
Probabilistic market research, not a recommendation or guaranteed return.
Where does this analogy help, and where does it break?
#MARSCOIN #CryptoEducation #CryptoLearning
$MARSCOIN price is below 0.0339 with hourly direction down.
Think of a quiet library. A loud argument changes the room. A whisper does not, yet a librarian may hear it. In markets, volume that is 2.04x baseline can feel loud. But if price stays rangebound, the move may be absorbed. This is a hypothetical mechanism, not a claim that specific traders are hiding orders. Candles show outcomes, not intentions.
The analogy breaks here. High relative volume is a ratio, not a measurement of who is buying. It does not confirm hidden accumulation or stop hunts. Imagine two scenarios. First, a large limit order absorbs selling. The range contracts. Second, market sell orders overwhelm buyers, and price drops further. Candles alone cannot distinguish these paths. Do not infer motives from the shape of the bar.
RSI at 30.9 provides context. It is an indicator reading, not a price bound. If RSI makes a new low while price holds range, that is a divergence in the indicator, not proof of reversal. Such patterns can fail. A counterexample is a slow bleed. Price stops falling, but RSI drifts lower. No breakout occurs. The "absorption" was just exhaustion. This shows why we must test the idea, not assume it.
To reassess this interpretation, watch for a closed candle. If the next candle closes back inside the prior range with volume returning to normal, the absorption idea weakens. If it breaks below 0.0339, the quiet phase may have been a pause. Keep it simple. Do not guess the end of the story before the candles close. The limit of candles is that they remove the why. Use them to state what happened, not to predict what will happen. Treat the current setup as a single data point in a larger test.
Probabilistic market research, not a recommendation or guaranteed return.
Where does this analogy help, and where does it break?
#MARSCOIN #CryptoEducation #CryptoLearning
60

Friends, I need your help. I bought 20000 marscoin and held it in spot throughout October. I heard there should have been an airdrop for this at the beginning of November in #spcxb !!! But for some reason, there’s nothing! What should I do??? Please advise #marscoin
{spot}(MARSCOINUSDT)
#helpmeplease
Friends, I need your help. I bought 20000 marscoin and held it in spot throughout October. I heard there should have been an airdrop for this at the beginning of November in #spcxb !!! But for some reason, there’s nothing! What should I do??? Please advise #marscoin
#helpmeplease
#helpmeplease

500
·
--
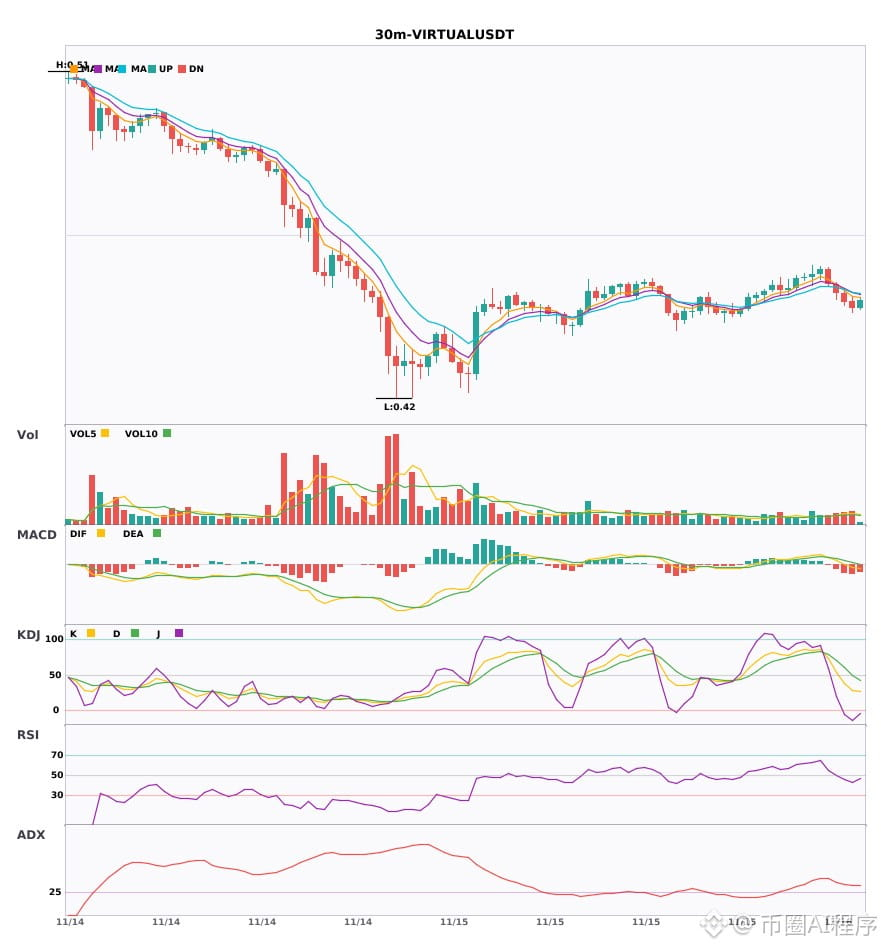
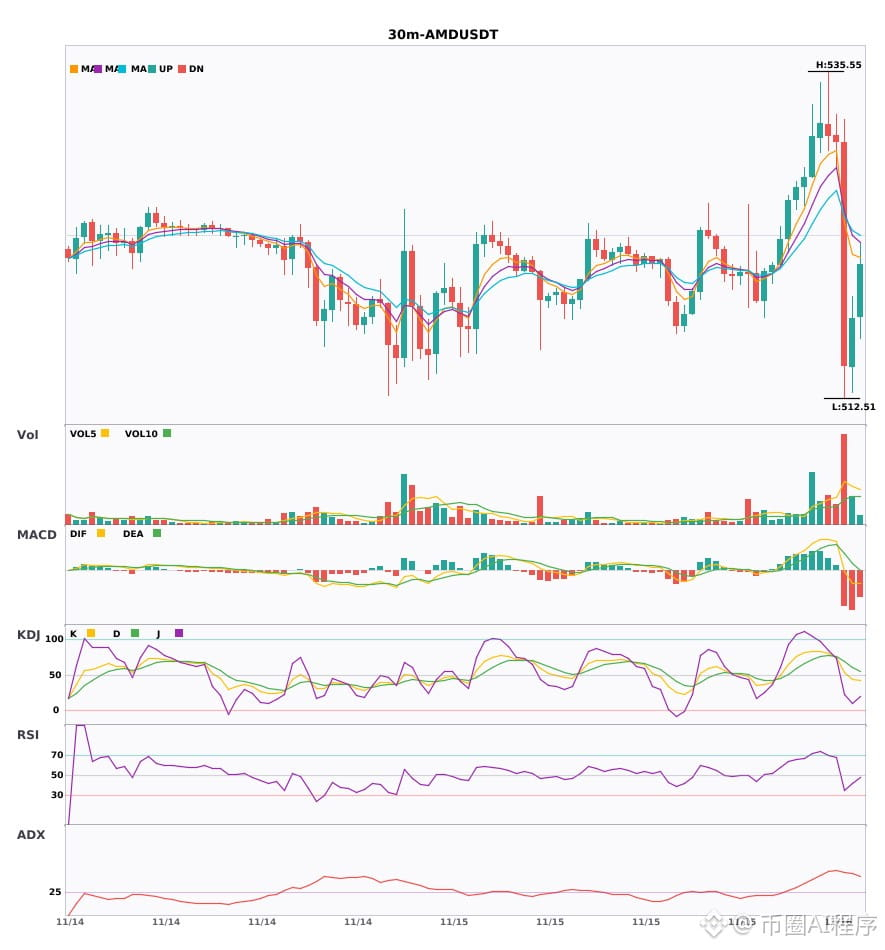
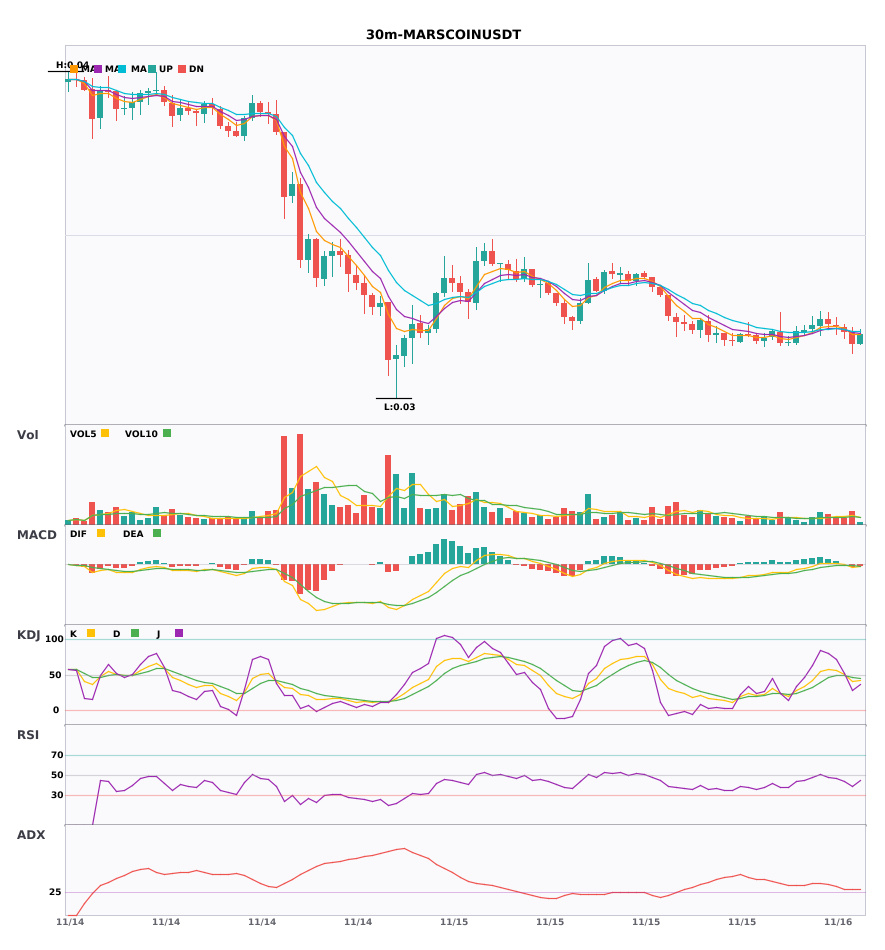
$VIRTUAL/$AMD/$MARSCOIN 30-minute weakness; 4-hour bearish trend confirmed 🔥
════════════════════
🟢 $VIRTUAL 30-minute bearish signal
⚠️ Technical analysis: Multi-timeframe confluence favors short positions: 4-hour bearish trend + 30-minute entry confirmed by confluence. MACD DIF falls below the zero line, turning the trend bearish. Moving averages are bearishly aligned and diverging downward. KDJ K crosses below D but is not oversold; volume is normal.
════════════════════
🟢 $AMD 30-minute bearish signal
⚠️ Technical analysis: 4-hour and 30-minute bearish confluence confirmed. MACD green bars continue to expand. Moving averages are bearishly aligned and diverging downward. Volume is 3.5 times higher; momentum is strengthening.
📢 Market update: AMD has secured a key partnership with Google for its next-generation TPU 8tx AI system. Its confidential computing security features could set a benchmark for cloud providers and potentially expand its market influence.
════════════════════
🟢 $MARSCOIN 30-minute bearish signal
⚠️ Technical analysis: 4-hour bearish trend + 30-minute entry confirmed by confluence! The 30-minute MACD forms a death cross below the zero line on increased volume. EMA5 crosses below EMA8, turning the alignment bearish. KDJ death cross, not yet oversold (K40.9 D46.9); trading volume is 1.6 times higher.
════════════════════
🔔 Follow for first-hand market updates 🔔
#多周期共振 #VIRTUAL #AMD #MARSCOIN
📌 When trading, check whether the candlestick pattern meets the criteria
$VIRTUAL /$AMD /$MARSCOIN 30-minute weakness; 4-hour bearish trend confirmed 🔥
════════════════════
🟢 $VIRTUAL 30-minute bearish signal
⚠️ Technical analysis: Multi-timeframe confluence favors short positions: 4-hour bearish trend + 30-minute entry confirmed by confluence. MACD DIF falls below the zero line, turning the trend bearish. Moving averages are bearishly aligned and diverging downward. KDJ K crosses below D but is not oversold; volume is normal.
════════════════════
🟢 $AMD 30-minute bearish signal
⚠️ Technical analysis: 4-hour and 30-minute bearish confluence confirmed. MACD green bars continue to expand. Moving averages are bearishly aligned and diverging downward. Volume is 3.5 times higher; momentum is strengthening.
📢 Market update: AMD has secured a key partnership with Google for its next-generation TPU 8tx AI system. Its confidential computing security features could set a benchmark for cloud providers and potentially expand its market influence.
════════════════════
🟢 $MARSCOIN 30-minute bearish signal
⚠️ Technical analysis: 4-hour bearish trend + 30-minute entry confirmed by confluence! The 30-minute MACD forms a death cross below the zero line on increased volume. EMA5 crosses below EMA8, turning the alignment bearish. KDJ death cross, not yet oversold (K40.9 D46.9); trading volume is 1.6 times higher.
════════════════════
🔔 Follow for first-hand market updates 🔔
#多周期共振 #VIRTUAL #AMD #MARSCOIN
📌 When trading, check whether the candlestick pattern meets the criteria
════════════════════
🟢 $VIRTUAL 30-minute bearish signal
⚠️ Technical analysis: Multi-timeframe confluence favors short positions: 4-hour bearish trend + 30-minute entry confirmed by confluence. MACD DIF falls below the zero line, turning the trend bearish. Moving averages are bearishly aligned and diverging downward. KDJ K crosses below D but is not oversold; volume is normal.
════════════════════
🟢 $AMD 30-minute bearish signal
⚠️ Technical analysis: 4-hour and 30-minute bearish confluence confirmed. MACD green bars continue to expand. Moving averages are bearishly aligned and diverging downward. Volume is 3.5 times higher; momentum is strengthening.
📢 Market update: AMD has secured a key partnership with Google for its next-generation TPU 8tx AI system. Its confidential computing security features could set a benchmark for cloud providers and potentially expand its market influence.
════════════════════
🟢 $MARSCOIN 30-minute bearish signal
⚠️ Technical analysis: 4-hour bearish trend + 30-minute entry confirmed by confluence! The 30-minute MACD forms a death cross below the zero line on increased volume. EMA5 crosses below EMA8, turning the alignment bearish. KDJ death cross, not yet oversold (K40.9 D46.9); trading volume is 1.6 times higher.
════════════════════
🔔 Follow for first-hand market updates 🔔
#多周期共振 #VIRTUAL #AMD #MARSCOIN
📌 When trading, check whether the candlestick pattern meets the criteria
36
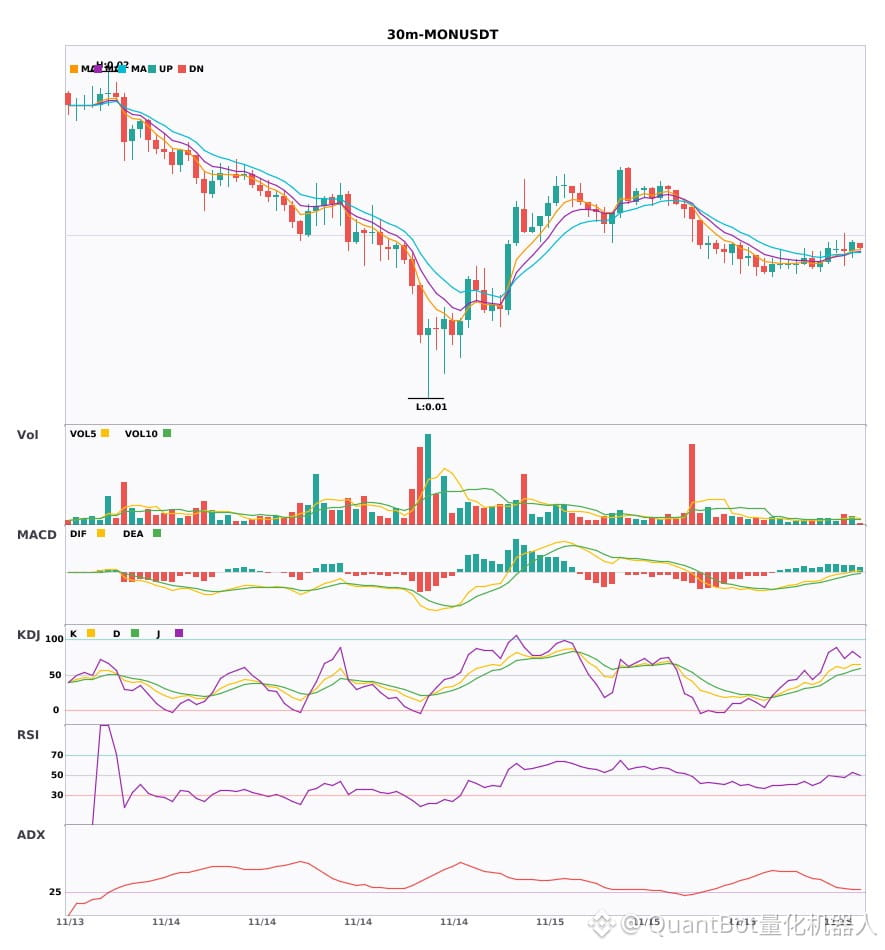
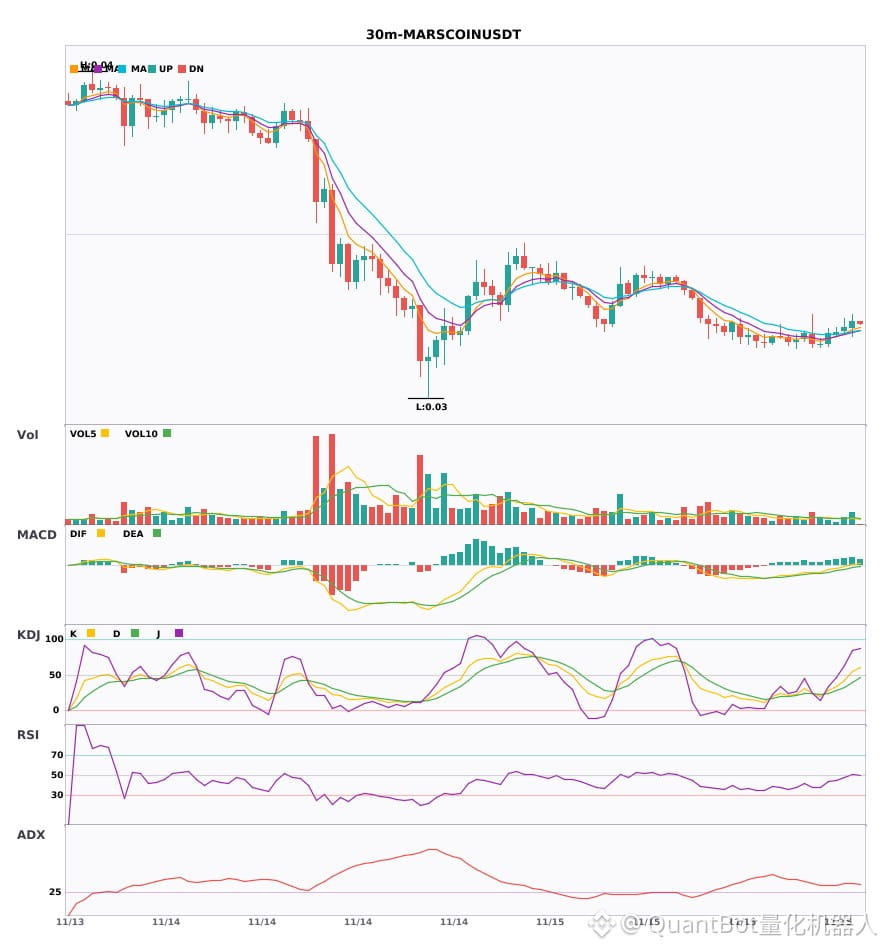
$MON/$Bull Comes/$MARSCOIN 30-minute bullish confluence signal
📈 $MON | 30-minute bullish signal
━━━━━━━━━━━━━━━━━━
Technical analysis: ADX(28) trend established; MACD DIF breaks above zero; EMA5>8>13 bullish alignment; strong KDJ (K65.3/D56.7); volume increases 1.8x.
Price change: 0.5200%
📈 $Bull Comes | 30-minute bullish signal
━━━━━━━━━━━━━━━━━━
Technical analysis: ADX(35) indicates a strong trend; MACD DIF breaks above zero and turns bullish; moving averages are tightly converged, direction pending; volume increases to 2.0x.
Price change: -0.5100%
📈 $MARSCOIN | 30-minute bullish signal
━━━━━━━━━━━━━━━━━━
Technical analysis: ADX(39) indicates a strong trend; MACD DIF crosses above zero, trend turns bullish; moving averages are tightly converged, direction selection is imminent; volume increases 1.7x.
Price change: 0.4700%
━━━━━━━━━━━━━━━━━━
#技术分析 #MON #牛来 #MARSCOIN
📌 The above content is for reference only and does not constitute investment advice
$MON /$Bull Comes/$MARSCOIN 30-minute bullish confluence signal
📈 $MON | 30-minute bullish signal
━━━━━━━━━━━━━━━━━━
Technical analysis: ADX(28) trend established; MACD DIF breaks above zero; EMA5>8>13 bullish alignment; strong KDJ (K65.3/D56.7); volume increases 1.8x.
Price change: 0.5200%
📈 $Bull Comes | 30-minute bullish signal
━━━━━━━━━━━━━━━━━━
Technical analysis: ADX(35) indicates a strong trend; MACD DIF breaks above zero and turns bullish; moving averages are tightly converged, direction pending; volume increases to 2.0x.
Price change: -0.5100%
📈 $MARSCOIN | 30-minute bullish signal
━━━━━━━━━━━━━━━━━━
Technical analysis: ADX(39) indicates a strong trend; MACD DIF crosses above zero, trend turns bullish; moving averages are tightly converged, direction selection is imminent; volume increases 1.7x.
Price change: 0.4700%
━━━━━━━━━━━━━━━━━━
#技术分析 #MON #牛来 #MARSCOIN
📌 The above content is for reference only and does not constitute investment advice
📈 $MON | 30-minute bullish signal
━━━━━━━━━━━━━━━━━━
Technical analysis: ADX(28) trend established; MACD DIF breaks above zero; EMA5>8>13 bullish alignment; strong KDJ (K65.3/D56.7); volume increases 1.8x.
Price change: 0.5200%
📈 $Bull Comes | 30-minute bullish signal
━━━━━━━━━━━━━━━━━━
Technical analysis: ADX(35) indicates a strong trend; MACD DIF breaks above zero and turns bullish; moving averages are tightly converged, direction pending; volume increases to 2.0x.
Price change: -0.5100%
📈 $MARSCOIN | 30-minute bullish signal
━━━━━━━━━━━━━━━━━━
Technical analysis: ADX(39) indicates a strong trend; MACD DIF crosses above zero, trend turns bullish; moving averages are tightly converged, direction selection is imminent; volume increases 1.7x.
Price change: 0.4700%
━━━━━━━━━━━━━━━━━━
#技术分析 #MON #牛来 #MARSCOIN
📌 The above content is for reference only and does not constitute investment advice
305
·
--
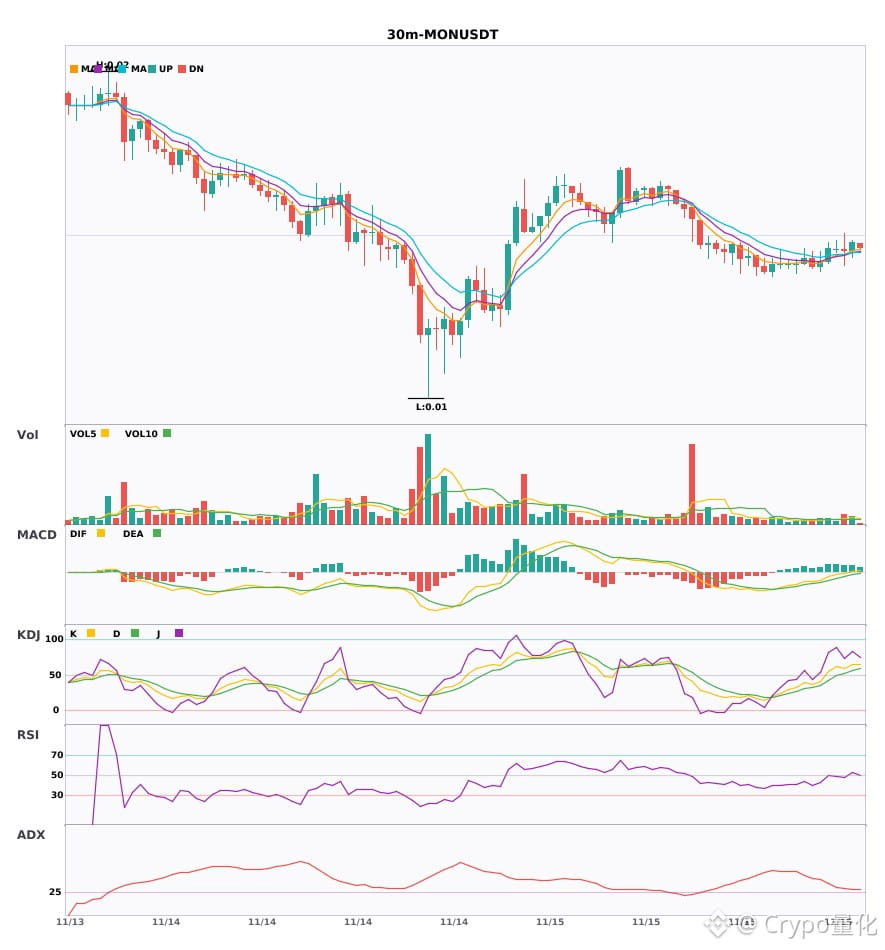
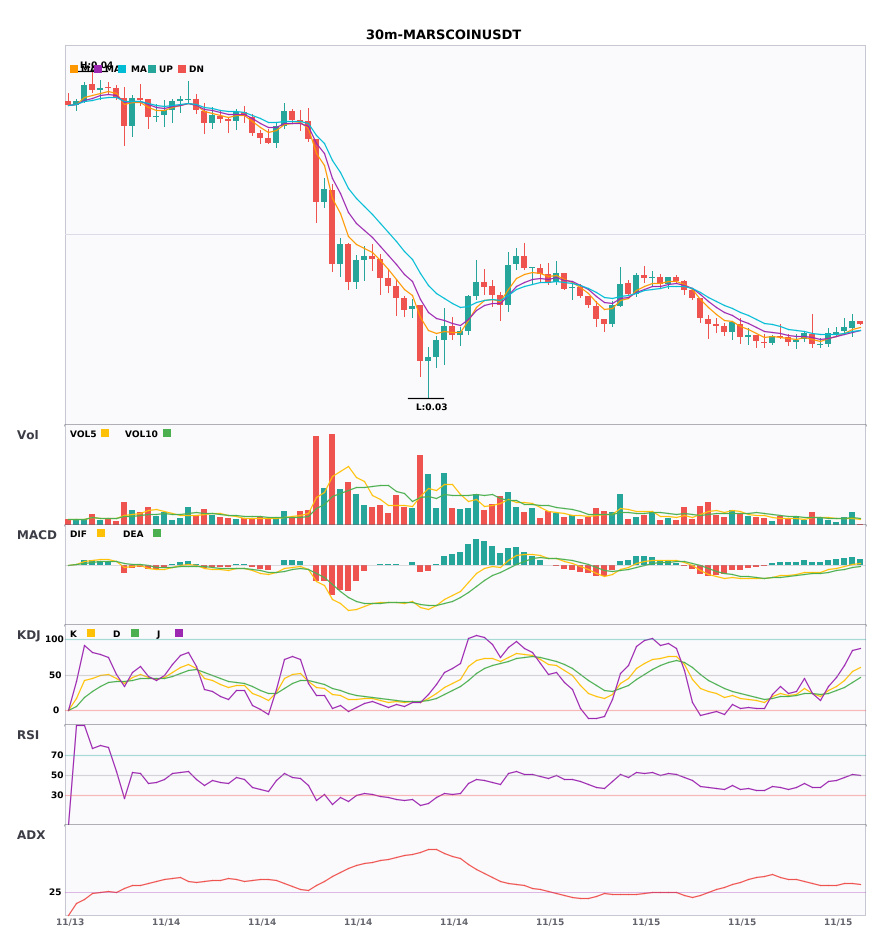
$MON $Bull is coming $MARSCOIN 30-minute bullish signals firing all at once 🔥
════════════════════
🔴 $MON 30-minute bullish signal
⚠️ Technical analysis: ADX shows the trend has just started, so it's time to enter. After the MACD golden cross, the red bars continue to grow and break above the zero line, turning bullish. The moving averages are aligned bullishly and spreading upward. K has crossed above D on the KDJ, but it hasn't reached the overbought zone yet. Trading volume has also increased 1.8 times.
════════════════════
🔴 $Bull is coming 30-minute bullish signal
⚠️ Technical analysis: ADX at 35 indicates the trend has just started. The MACD golden cross, with increased volume, has broken above the zero line, confirming a clear bullish signal. The moving averages have just aligned and started spreading upward. Trading volume has doubled, so the market is likely to move upward.
════════════════════
🔴 $MARSCOIN 30-minute bullish signal
⚠️ Technical analysis: ADX at 39 indicates a very strong trend. After the MACD golden cross, increased volume has pushed it above the zero line, turning bullish. The moving averages have just converged and are poised to spread apart. Volume has increased 1.7 times.
════════════════════
🔔 Follow for the latest market activity 🔔
#技术分析 #MON #牛来 #MARSCOIN
📌 When trading, pay attention to whether the candlestick pattern confirms the signal
$MON $Bull is coming $MARSCOIN 30-minute bullish signals firing all at once 🔥
════════════════════
🔴 $MON 30-minute bullish signal
⚠️ Technical analysis: ADX shows the trend has just started, so it's time to enter. After the MACD golden cross, the red bars continue to grow and break above the zero line, turning bullish. The moving averages are aligned bullishly and spreading upward. K has crossed above D on the KDJ, but it hasn't reached the overbought zone yet. Trading volume has also increased 1.8 times.
════════════════════
🔴 $Bull is coming 30-minute bullish signal
⚠️ Technical analysis: ADX at 35 indicates the trend has just started. The MACD golden cross, with increased volume, has broken above the zero line, confirming a clear bullish signal. The moving averages have just aligned and started spreading upward. Trading volume has doubled, so the market is likely to move upward.
════════════════════
🔴 $MARSCOIN 30-minute bullish signal
⚠️ Technical analysis: ADX at 39 indicates a very strong trend. After the MACD golden cross, increased volume has pushed it above the zero line, turning bullish. The moving averages have just converged and are poised to spread apart. Volume has increased 1.7 times.
════════════════════
🔔 Follow for the latest market activity 🔔
#技术分析 #MON #牛来 #MARSCOIN
📌 When trading, pay attention to whether the candlestick pattern confirms the signal
════════════════════
🔴 $MON 30-minute bullish signal
⚠️ Technical analysis: ADX shows the trend has just started, so it's time to enter. After the MACD golden cross, the red bars continue to grow and break above the zero line, turning bullish. The moving averages are aligned bullishly and spreading upward. K has crossed above D on the KDJ, but it hasn't reached the overbought zone yet. Trading volume has also increased 1.8 times.
════════════════════
🔴 $Bull is coming 30-minute bullish signal
⚠️ Technical analysis: ADX at 35 indicates the trend has just started. The MACD golden cross, with increased volume, has broken above the zero line, confirming a clear bullish signal. The moving averages have just aligned and started spreading upward. Trading volume has doubled, so the market is likely to move upward.
════════════════════
🔴 $MARSCOIN 30-minute bullish signal
⚠️ Technical analysis: ADX at 39 indicates a very strong trend. After the MACD golden cross, increased volume has pushed it above the zero line, turning bullish. The moving averages have just converged and are poised to spread apart. Volume has increased 1.7 times.
════════════════════
🔔 Follow for the latest market activity 🔔
#技术分析 #MON #牛来 #MARSCOIN
📌 When trading, pay attention to whether the candlestick pattern confirms the signal
247

·
--
$GRT +1.33% | $MARSCOIN +1.27% | $0G +1.10%
The Graph ($#GRT) is holding at $0.0175, nudging +1.33% with $1.2 M of volume. Its indexing protocol keeps it useful for developers, which may support the modest gain.
$#MARSCOIN trades around $0.0398, up +1.27% on a solid $2.9 M of activity. The rise feels linked to recent community pushes, though the driver isn’t crystal clear.
$#0G sits at $0.1556, climbing +1.10% with $1.8 M changing hands. Momentum is modest but steady.
👀 Watch if the volume spread among these three narrows, as that could hint at a broader short‑term rally.
#Write2Earn #Binance
$GRT +1.33% | $MARSCOIN +1.27% | $0G +1.10%
The Graph ($#GRT) is holding at $0.0175, nudging +1.33% with $1.2 M of volume. Its indexing protocol keeps it useful for developers, which may support the modest gain.
$#MARSCOIN trades around $0.0398, up +1.27% on a solid $2.9 M of activity. The rise feels linked to recent community pushes, though the driver isn’t crystal clear.
$#0G sits at $0.1556, climbing +1.10% with $1.8 M changing hands. Momentum is modest but steady.
👀 Watch if the volume spread among these three narrows, as that could hint at a broader short‑term rally.
#Write2Earn #Binance
The Graph ($#GRT) is holding at $0.0175, nudging +1.33% with $1.2 M of volume. Its indexing protocol keeps it useful for developers, which may support the modest gain.
$#MARSCOIN trades around $0.0398, up +1.27% on a solid $2.9 M of activity. The rise feels linked to recent community pushes, though the driver isn’t crystal clear.
$#0G sits at $0.1556, climbing +1.10% with $1.8 M changing hands. Momentum is modest but steady.
👀 Watch if the volume spread among these three narrows, as that could hint at a broader short‑term rally.
#Write2Earn #Binance
3
Log in to explore more content
Join global crypto users on Binance Square
⚡️ Get latest and useful information about crypto.
💬 Trusted by the world’s largest crypto exchange.
👍 Discover real insights from verified creators.
Email / Phone number
Trending Topics
1
#NvidiaEarningsTonight:AIStocks’NextMove?
64,710 views
928 Discussing
2
#A Packed Week of Earnings and Data Tests Markets
122,720 views
616 Discussing
3
#AnthropicIPOTestsInvestorAppetiteForAI
270,943 views
2,633 Discussing
4
#NvidiaBoardNotConsideringHuang’sReturnasCEO
79,330 views
785 Discussing
5
#KOSPIFalls2.59%ToLowestCloseSinceFebruary
14,513 views
194 Discussing
6
#AnthropicClearedToListOnNasdaqAsANT
15,667 views
176 Discussing
7
#WhatInvestmentSignalsDo13FFilingsReveal?
43,551 views
561 Discussing
8
#TetherCapitalMakesStrategicInvestmentInStables
5,439 views
60 Discussing
9
#EvernorthRecords$505MImpairmentOnPreListingXRP
1,235 views
19 Discussing
10
#GoldmanSachsReports$1.22BInEtherETFHoldings
965 views
15 Discussing