

#52
52
25,902 views
59 Discussing
Hot
Latest

·
--
While $BTW (rank #52) is down 32.4% in 24 h, it’s still 57.3% shy of its all‑time high. Price sits at $1.18 on $5.54 M volume. What’s your read on $BTW today? Not financial advice — do your own research. #Crypto
While $BTW (rank #52) is down 32.4% in 24 h, it’s still 57.3% shy of its all‑time high. Price sits at $1.18 on $5.54 M volume. What’s your read on $BTW today? Not financial advice — do your own research. #Crypto
1
754

·
--
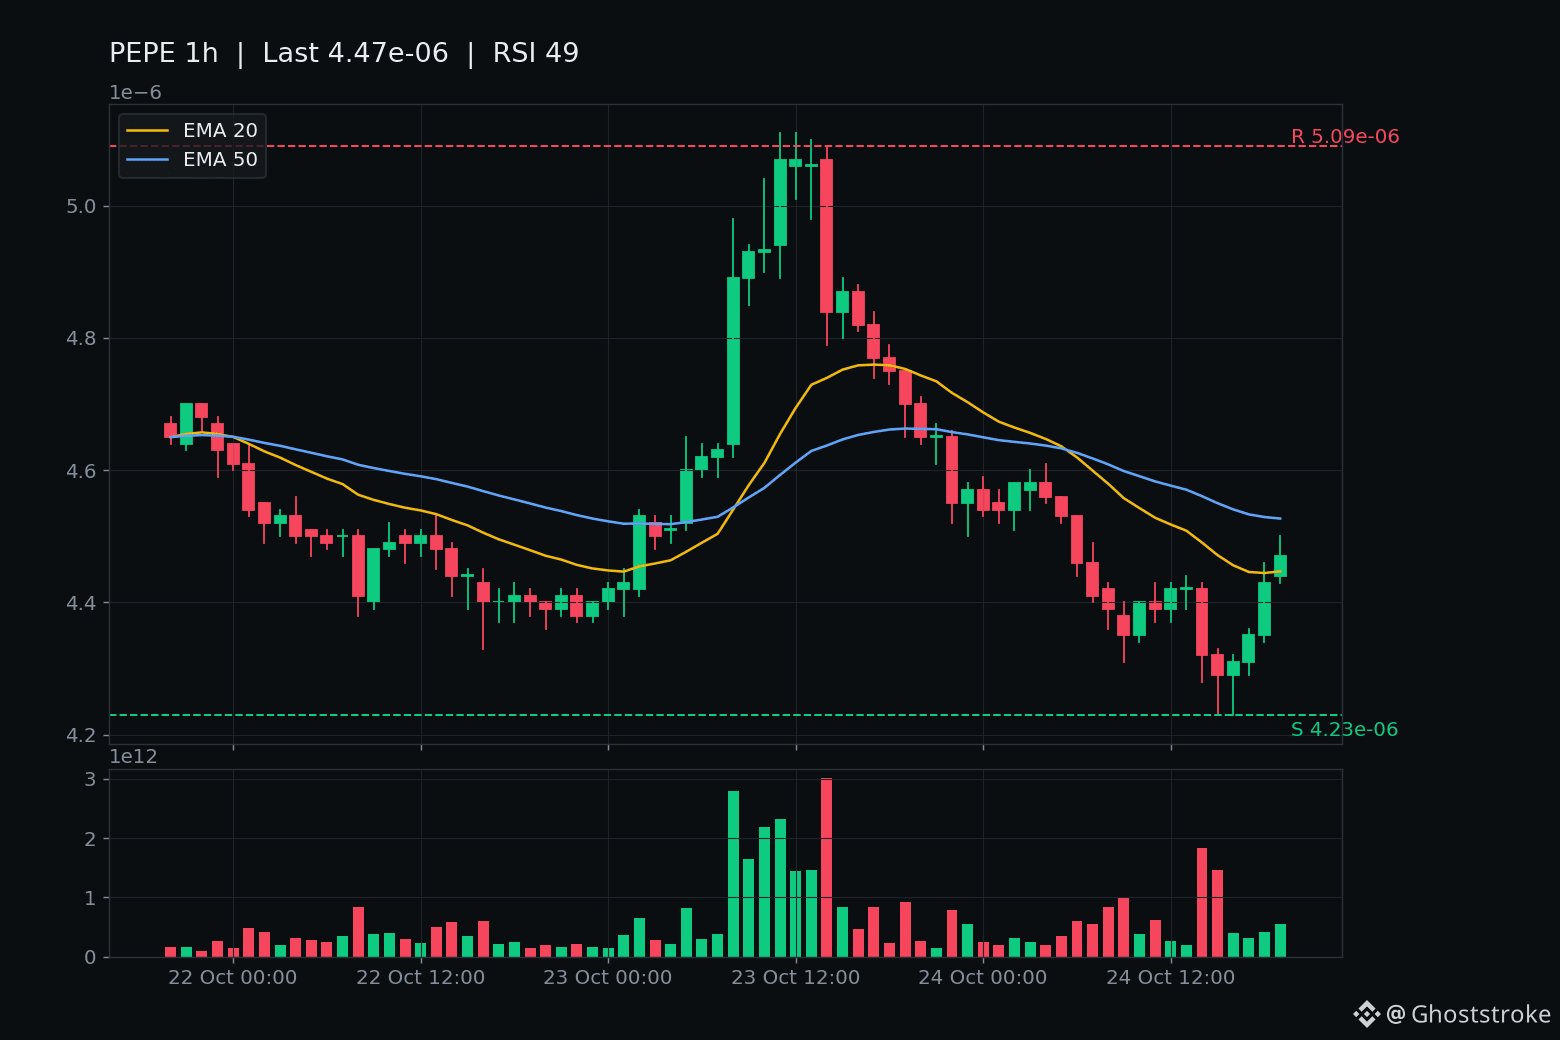
$PEPE just took its floor back — $0.00000443 closed above $0.00000436, four hours after breaking it.
The floor-break was real. Post 164's trigger: the 14:00 UTC candle closed $0.00000432 below the floor on $7.99M — the biggest hourly bar of PEPE's day — after the Oct 23 spike to $0.00000511 failed under the $0.00000479 ceiling. Then three closes under the floor: $0.00000429, $0.00000431, $0.00000435. Each one said the break was holding.
Then the 18:00 UTC candle closed $0.00000443 on $1.87M — the first closed hour back above the floor. The forming hour is still above it, unclosed, so this is a reclaim, not a confirmed trend.
The numbers around it: $PEPE $0.00000446 live, -4.9% on the day, $56.5M Binance volume. Rank #52, $1.88B market cap, $416M global volume — a large-cap meme, not a microcap wick. Seven days still +14.5% despite today's fall. Chart: RSI 49, price parked between EMA20 $0.00000445 and EMA50 $0.00000453 — no momentum extreme either way.
No fresh headline behind the reclaim — today's coverage is just price recaps of the fall itself. Tape, not news.
Levels now: the floor $0.00000436 is support again — an hourly close back below it and the fake-out is dead, the break resumes toward the Oct 20 low area $0.00000410. Above, $0.00000479 is the ceiling that killed the Oct 23 spike — a close above it reopens the breakout.
Not a call. A floor retaken after a $7.99M break bar is the market changing its mind in public — the next close decides whether it meant it.
Was the floor-break the trap, or is this reclaim the trap?
13

·
--
No. 1 at 5.53%; a sharp drop to 1.9% for Nos. 2 and 3 | 4h Gainers TOP 3
1 $GTC GTC/USDT | Price: 0.2620U | 24h trading volume: 10.28M U
Gitcoin is a platform that funds open-source software and digital public goods. It uses community donations and quadratic matching to determine how funds are allocated. GTC is its governance token.
Latest update: In mid-October, it broke out of a months-long 0.06–0.10 range on heavy volume, briefly surging to 0.37 before pulling back.
Total supply: 100M | Market cap: 23.2M U | Rank: #759
4h【+5.53%】 | 24h +2.16% | 7d +0.35%
Momentum watch: It closed at 57% of the current 4h candle’s range. Volume in the final hourly candle was 1.30 times the 24h average. It has pulled back 17.10% from the 24h high, while the previous 4h candle was -2.06%.
What this means: The close was only around the middle of the range, still 17% below the intraday high. This candle recovered only half of the previous candle’s loss, leaving holders who bought higher still underwater.
2 $DASH DASH/USDT | Price: 52.35U | 24h trading volume: 6.53M U
Dash is one of the oldest public blockchains built for “digital cash.” Transfers confirm in seconds, and the network offers optional privacy and governance through masternode voting. Its focus has shifted to payments.
Latest update: Private transactions on the Evolution mainnet went live on October 20, and Dash Platform 5.0 is scheduled for release on October 26.
Total supply: 12.877M | Market cap: 674M U | Rank: #90
4h【+1.90%】 | 24h +3.66% | 7d +6.23%
Momentum watch: It closed at 85% of the current 4h candle’s range. Volume in the final hourly candle was 1.06 times the average, and it has pulled back 1.10% from the 24h high. The previous 4h candle was -1.62%.
What this means: The close is near the top of the range, just 1% below the intraday high. The previous candle’s loss was fully recovered, with buying support keeping the price near its highs.
3 $PEPE PEPE/USDT | Price: 0.00000448U | 24h trading volume: 41.89M U
PEPE is a frog-meme coin on Ethereum with no practical use case; its price is driven by community sentiment and liquidity. It is one of the largest meme coins by market cap.
Latest update: Meme coins rotated into favor this week. PEPE briefly rose 14% in a single day, and its weekly gain widened to 23%, with no clear catalyst in sight.
Total supply: 420.69T | Market cap: 1.878B U | Rank: #52
4h【+1.82%】 | 24h +2.52% | 7d +14.58%
Momentum watch: It closed at 88% of the current 4h candle’s range. Volume in the final hourly candle was 0.89 times the average, and it has pulled back 1.75% from the 24h high. The previous 4h candle was -2.23%.
What this means: The close was near the top of the range, but volume in the final stretch was below average, so participation did not keep pace with the price rise.
Summary: GTC had the strongest 4h move but gave back 17% from its high; DASH closed closest to its high; PEPE leads on the 7d timeframe at +14.58%, and just turned positive on the 4h.
Which matters more to you: 4h momentum or the 7d trend?
This is not investment advice. DYOR.
1
1
676

·
--
$APR This 15m drop isn’t particularly severe at -1.58%, but volume surged to 2.48x and the Z-score is 2.94. That’s not normal volatility.
OI fell 0.94% over 1h, or -163K in notional value, alongside the price drop—a textbook sign of longs deleveraging. The anomaly percentile is 94.4%, ranking #6 across the pool, while the notional change ranks only #52. That suggests this coin isn’t very large: with just 11M in 24h trading volume, even a small ripple can put it on the leaderboard.
The closing price broke below the lower end of the recent 20-candle 5m range. Aggressive order flow was -46.5%, and the buy/sell ratio was 0.36, so sellers are in control. But this structure looks more like stop-losses getting flushed out than a straightforward short attack—OI is shrinking, not growing as positions pile in to drive the price down.
We’re nearing historically extreme levels. Keep an eye on it for now; don’t rush to buy the dip.
4

·
--
$TRUMP This round of long liquidations is pretty brutal.
The 15m price is down just 0.92%, but OI plunged 38.69% in an hour, wiping out 4.21M USDT in notional value. This isn't just a sell-off—positions are contracting continuously and stop-losses are being triggered.
Trading volume surged to 5.84x, aggressive trade imbalance was -16.2%, and the buy/sell ratio was 0.72, showing that selling pressure was clearly more aggressive. The OI anomaly percentile was 92.9%, ranking #52 for anomalies across the entire pool and #44 for notional change, with depth confirming the move.
Price down + OI down: a classic long deleveraging pattern. It's not new shorts entering; longs are getting out.
2

Article
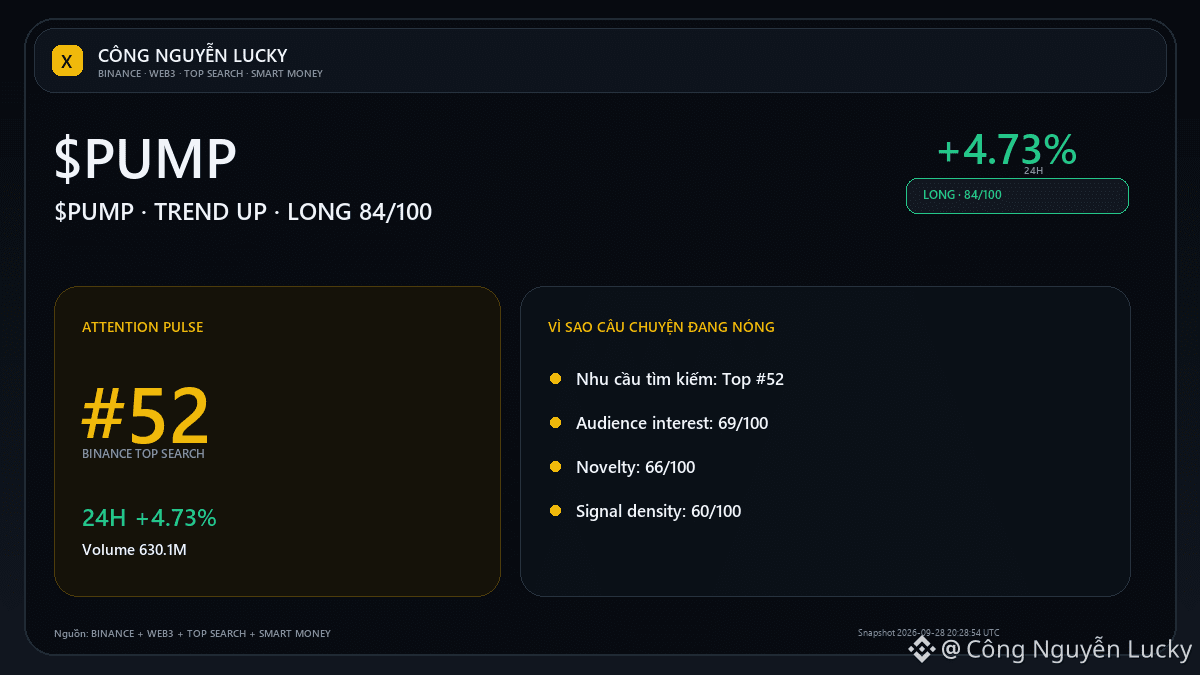
$PUMP · TREND UP: real breakout or just a 24h fluctuation?$PUMP is hovering around 0.005182. If you only look at the current price, you’re still missing the most important part: what confirms or refutes the thesis? Market: 0.005182 · 24h +4.73% · volume ~630.1M USDT · 2,901,494 trades.
Social context: PUMP Price Surge, Long Position Gains, Buyback and Burn. Social attention can move the price, but it can also be a crowd that comes in late.
Confirm: Exceeding 0.005562 with the extended volume will make the scenario continuation more credible.
$PUMP · TREND UP: real breakout or just a 24h fluctuation?
$PUMP is hovering around 0.005182. If you only look at the current price, you’re still missing the most important part: what confirms or refutes the thesis? Market: 0.005182 · 24h +4.73% · volume ~630.1M USDT · 2,901,494 trades.
Social context: PUMP Price Surge, Long Position Gains, Buyback and Burn. Social attention can move the price, but it can also be a crowd that comes in late.
Confirm: Exceeding 0.005562 with the extended volume will make the scenario continuation more credible.
Social context: PUMP Price Surge, Long Position Gains, Buyback and Burn. Social attention can move the price, but it can also be a crowd that comes in late.
Confirm: Exceeding 0.005562 with the extended volume will make the scenario continuation more credible.
2
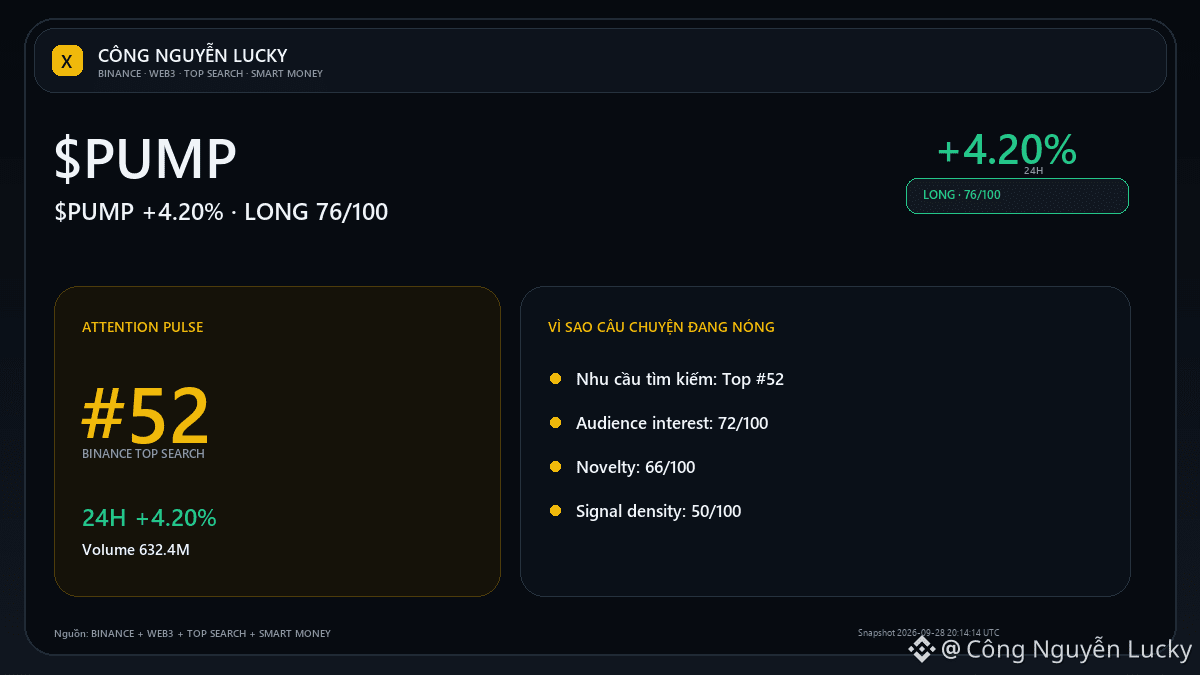
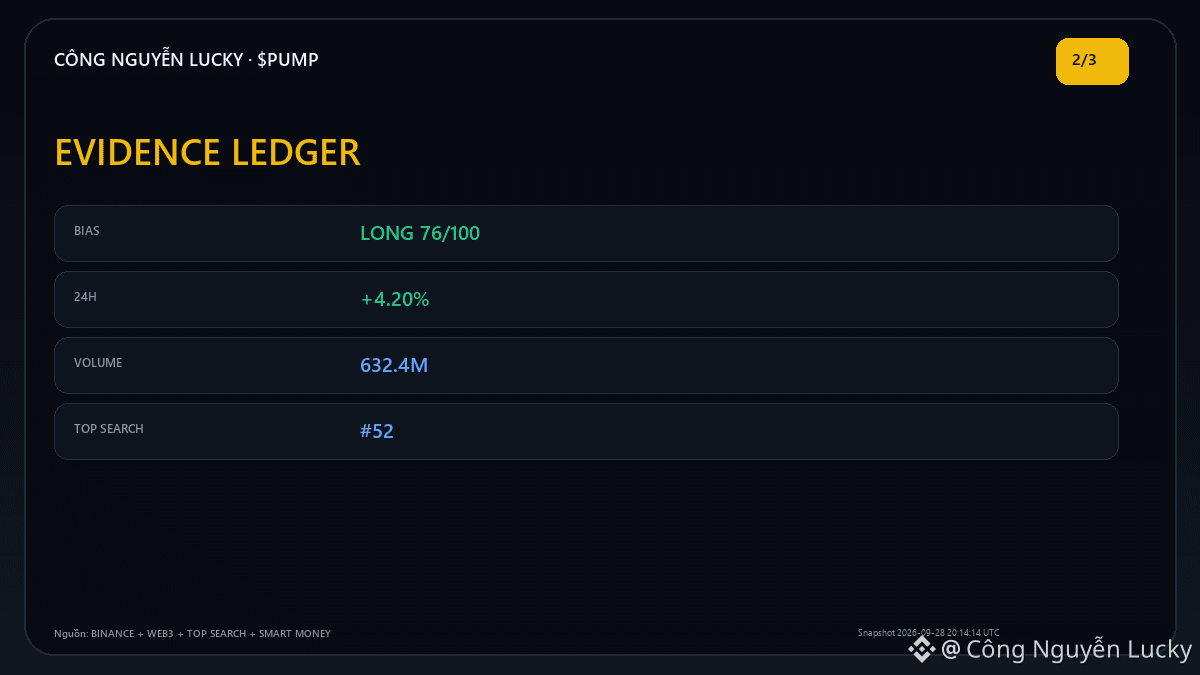
$PUMP does not lack participants. The question is: is participation absorbing or just pushing short-term prices? 0.005191 · 24h +4.20% · volume ~632.4M USDT · 2,906,891 trades.
Market-focus participation score: 98/100.
Range position: 55/100. Positive signs: Breaking above 0.005562 with increased open volume would make the continuation scenario more credible.
Warning signs: If it fails to hold the upper zone and falls back below the midpoint 0.005149, the downside cooling becomes more evident. 📌 LONG/SHORT outlook: **LONG · MODERATE · 76/100**.
Key basis: 24h price +4.20%; Smart Money records money inflows; stronger than BTC by +5.65 percentage points.
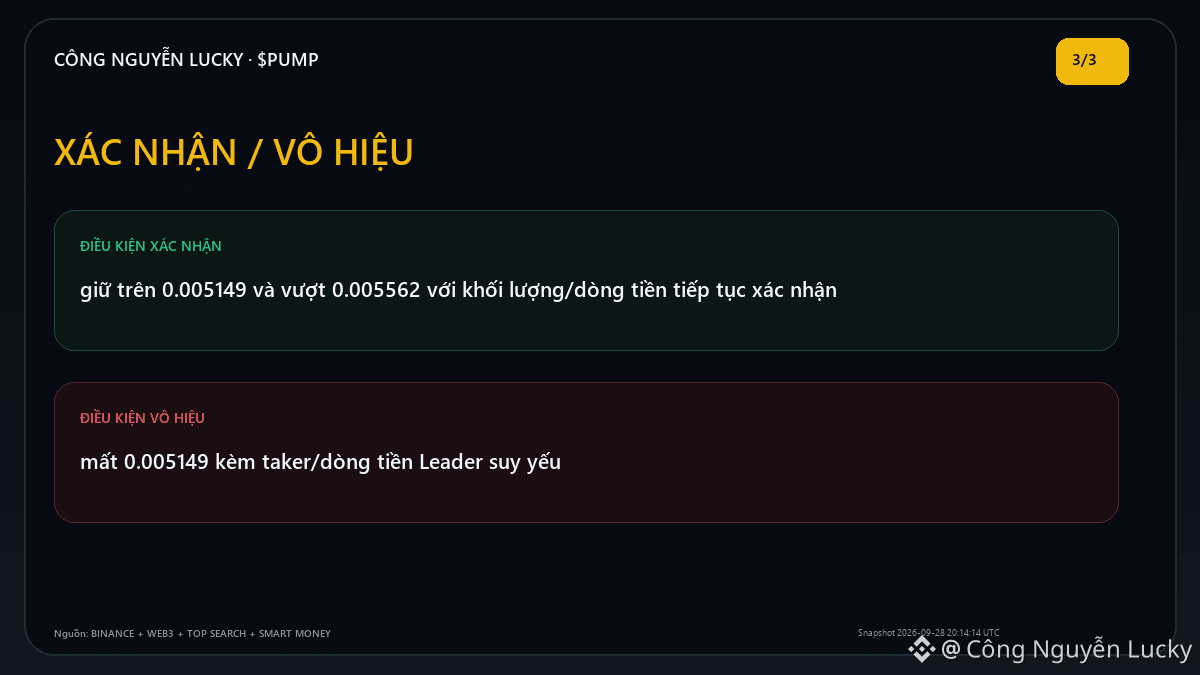
Additional confirmation when: holding above 0.005149 and breaking above 0.005562 with volume/flow continuing to confirm.
Invalidate/neutralize the direction if: losing 0.005149 along with weakening taker/Leader flow. 📌 If you’re tracking $PUMP, open the cashtag to check the price, liquidity, and the current market context before making a decision. 🔎 **Evidence check — LONG 76/100**
• Price 0.005191; 24h +4.20%; volume 632.4M.
• Binance Top Search #52. 🧭 **Key levels to watch:** confirmation: hold above 0.005149 and break above 0.005562 with volume/flow continuing to confirm · invalidation: lose 0.005149 with weakening taker/Leader flow
Reference sources: Binance Futures Market + Binance Web3 Trending + Binance Top Search + Binance Social Hype + Binance Smart Money Inflow · snapshot 2026-09-28 20:14:14 UTC
💬 **Discussion angle:** What confirmation signals do you need before you consider this $PUMP move to be real rather than noise?
Follow to see the next updates of $PUMP when the current thesis has additional market evidence.
⚠️ This market analysis is for reference only and not a profit commitment. Everyone should do their own research (DYOR), manage their own risk, and take responsibility for their trading decisions. $PUMP $BTC
$PUMP does not lack participants. The question is: is participation absorbing or just pushing short-term prices? 0.005191 · 24h +4.20% · volume ~632.4M USDT · 2,906,891 trades.
Market-focus participation score: 98/100.
Range position: 55/100. Positive signs: Breaking above 0.005562 with increased open volume would make the continuation scenario more credible.
Warning signs: If it fails to hold the upper zone and falls back below the midpoint 0.005149, the downside cooling becomes more evident. 📌 LONG/SHORT outlook: **LONG · MODERATE · 76/100**.
Key basis: 24h price +4.20%; Smart Money records money inflows; stronger than BTC by +5.65 percentage points.
Additional confirmation when: holding above 0.005149 and breaking above 0.005562 with volume/flow continuing to confirm.
Invalidate/neutralize the direction if: losing 0.005149 along with weakening taker/Leader flow. 📌 If you’re tracking $PUMP , open the cashtag to check the price, liquidity, and the current market context before making a decision. 🔎 **Evidence check — LONG 76/100**
• Price 0.005191; 24h +4.20%; volume 632.4M.
• Binance Top Search #52. 🧭 **Key levels to watch:** confirmation: hold above 0.005149 and break above 0.005562 with volume/flow continuing to confirm · invalidation: lose 0.005149 with weakening taker/Leader flow
Reference sources: Binance Futures Market + Binance Web3 Trending + Binance Top Search + Binance Social Hype + Binance Smart Money Inflow · snapshot 2026-09-28 20:14:14 UTC
💬 **Discussion angle:** What confirmation signals do you need before you consider this $PUMP move to be real rather than noise?
Follow to see the next updates of $PUMP when the current thesis has additional market evidence.
⚠️ This market analysis is for reference only and not a profit commitment. Everyone should do their own research (DYOR), manage their own risk, and take responsibility for their trading decisions. $PUMP $BTC

·
--
$PUMP Surges 22%: Meme Launchpad Narrative Back in Focus
$PUMP is capturing the spotlight again, climbing to the #6 spot on the trending list with a massive 22.25% gain over the last 24 hours. The volume is absolutely massive, clocking in at over $347 million. ⚡
As the premier launchpad ecosystem narrative regains momentum, traders are flocking back to $PUMP as a high-beta play on retail meme activity. The token is showing intense relative strength, outperforming the broader market today. With market cap ranking sitting at #52, the liquidity and attention flowing into this asset suggest that the community is positioning for a broader ecosystem expansion. Keep an eye on this volume spike to see if the momentum sustains. 📊👀
Follow for daily crypto updates.
#DeGenYuv #PumpFun

72

·
--
$DOT quick research note, not a hype thread.
Polkadot is being priced like a narrative reset, not just a candle trade.
Price: $0.8230
Market cap: $1.39B
Rank: #52
FDV: $0.0000
7d / 30d: +7.6% / -0.5%
The part I care about:
Circulating ratio is about 100.0%, so supply pressure belongs in the valuation debate.
Daily trend: Neutral/Consolidating ↔️
RSI: 49.8
Support: $0.7400
Resistance: $0.8700
My read: if $DOT reclaims resistance, the market starts paying for the story again. Lose support, and I would rather wait than be early. NFA.
Is $DOT undervalued here, or just another bounce trap?
96
·
--
$AAVE Today I’m making a quick fundamental note—no call-outs.
Aave’s current pricing looks less like it’s driven purely by candle colors, and more like the market is reassessing the strength of its narrative.
Current price: $89
Market cap: $1.37B
Rank: #52
FDV: $0.0000
7D / 30D: +0.6% / -10.5%
What I care about most is the supply structure:
Circulating supply is about 96.4%—any subsequent unlocks/supply pressure must be factored into the valuation.
Daily trend: Bearish 📉
RSI: 44.9
Support: $86
Resistance: $103
My read: $AAVE If it reclaims resistance, the market may start assigning it narrative premium; if it breaks support, that would suggest capital still isn’t willing to buy this story. NFA.
Do you think $AAVE is undervalued, or just another rebound trap?
1
85

·
--
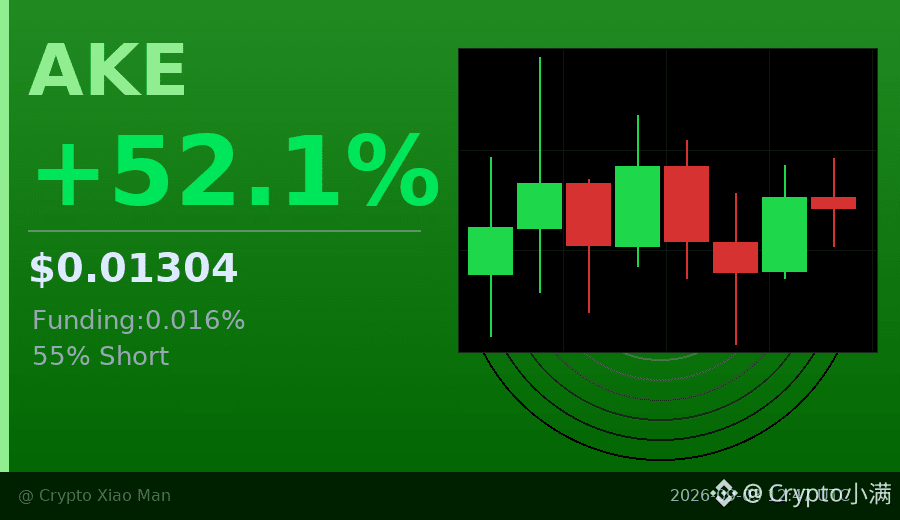
52% single-day increase, but the funding rate is only 0.016%—this is a bit unusual.
Today, AKE’s trading volume surged to 1.23 billion USDT. The price moved from 0.0076 to 0.013, and the long/short ratio shows that 55% of participants are shorting. Usually, such a rally attracts a lot of chasing longs, but here the shorts are dominant.
In the last 8 candlesticks, price has been ranging and consolidating in the 0.0124–0.0138 area, suggesting that the bulls are absorbing profit-taking, while the shorts aren’t rushing to dump. Once this balance breaks, the direction will become much clearer.
What I’m watching is: if volume can stay above 1 billion and the funding rate doesn’t turn negative, there may still be momentum for a short-term push higher. Conversely, if the funding rate turns negative and price breaks below 0.0124, it could pull back toward around 0.01.
$AKE #资金费率异常 #52%涨幅
Click the small card below to quickly check the market👇
81

What if the future of finance isn’t built on code, but on something older - paper, contracts, and real-world value? This week, Binance is making moves that could change how we think about tokenized securities - and the way real-world assets are integrated into the blockchain.
So what does this mean for the future of DeFi? It means we’re no longer just talking about decentralized finance - we’re talking about a decentralized financial system, one that integrates with the real world. And that could be the next frontier.
Could the way we trade real-world assets through tokenization be the next frontier for DeFi?
—
For educational purposes only. Not financial advice.
📌 Crypto 101 · #52 · #CryptoEducation #CryptoSighted
52
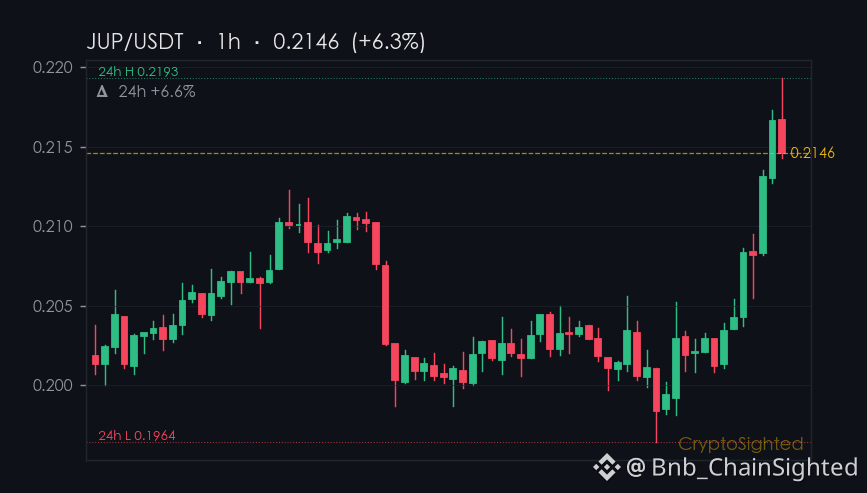
$JUP surged 6.6% in 24 hours - that’s the sharp move.
But here’s the twist: over the past seven days, JUP is down 8.2%.
That’s the kind of split that makes you pause.
The move doesn’t feel crowded. Not yet.
JUP’s futures open interest has climbed 11.3% in the same period, but the price hasn’t followed.
That’s not normal. Usually, rising leverage and rising price go hand in hand.
Here, they’re moving in opposite directions.
Flat funding, rising open interest - that’s the kind of setup that can get messy.
It suggests someone’s buying without conviction, or worse, someone’s hedging.
This isn’t a call to buy or sell. It’s a read on the tension between price and leverage.
One that’s worth watching.
Is the recent 6.6% rally just a short-term bounce, or is it the start of something more?
—
📊 12 directional calls in the last 30d, every one auto-settled against price. Direction only — no buy/sell calls.
Not financial advice. DYOR.
📌 Funding Pulse · #52 · #FundingRate #CryptoSighted $JUP
252

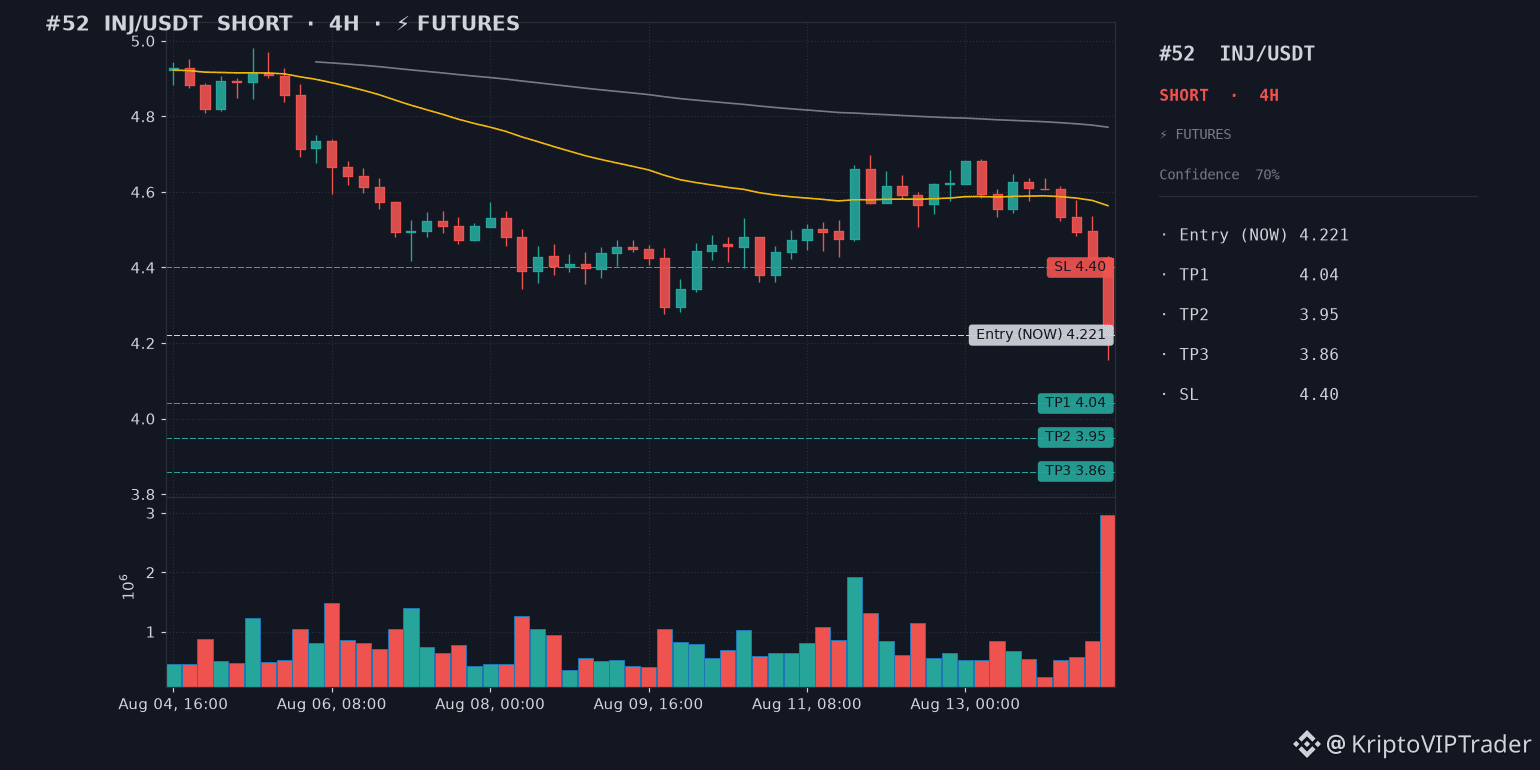
🔖 #52 · 14.08.26 20:02
🔴 SHORT 🐻 | $INJ
{future}(INJUSDT)
💰 | ⏱ Candle: 4H · ⚡️ FUTURES
❗️ Duration: up to 5 days
📊 Entry: 4.221 (Enter NOW)
🎯 TP1: 4.040 (+4.3%)
🎯 TP2: 3.950 (+6.4%)
🎯 TP3: 3.860 (+8.6%) — wait for additional profit
🛡 SL: 4.400 (-4.2%)
⚖️ R/R 1:1.0-2.0
⚡️ Leverage: 3x-5x (isolated)
🧠 Breakdown below EMA200/EMA50 on 4x volume, RSI 30, MACD hist negative, ADX 22
⚠️ Max 5% position · Max 10% stop-loss risk
Not financial advice — personal analysis only.
#INJUSDT #short #futures
🔖 #52 · 14.08.26 20:02
🔴 SHORT 🐻 | $INJ
💰 | ⏱ Candle: 4H · ⚡️ FUTURES
❗️ Duration: up to 5 days
📊 Entry: 4.221 (Enter NOW)
🎯 TP1: 4.040 (+4.3%)
🎯 TP2: 3.950 (+6.4%)
🎯 TP3: 3.860 (+8.6%) — wait for additional profit
🛡 SL: 4.400 (-4.2%)
⚖️ R/R 1:1.0-2.0
⚡️ Leverage: 3x-5x (isolated)
🧠 Breakdown below EMA200/EMA50 on 4x volume, RSI 30, MACD hist negative, ADX 22
⚠️ Max 5% position · Max 10% stop-loss risk
Not financial advice — personal analysis only.
#INJUSDT #short #futures
1
48

·
--
.45 UNI Stuns: This Week’s Biggest Alpha Isn’t in BTC!Pump.fun (PUMPUSDT) is trending right now!
Rank: #52
What if I told you the biggest alpha this week isn’t coming from but from a .45 token that just ripped 7.3% higher? 🤯 UNI USDT surged from .016 to .455 in the last 24 hours, moving 4.4 M in volume and trading 215 k ticks. While the Bitcoin chart has been eerily flat (no data reported), the real action lives in the mid‑cap arena. Let’s break it down: - **UNI**: +7.297% / price .455 / quote volume 4,421,472. The weighted‑average price sat at .327, and the order book is tight—124 UNI on the bid at .455 vs 55 UNI on the ask at .456. That spread suggests a bullish imbalance. I’m seeing a classic “pump‑and‑hold” pattern; the token broke its 24‑hour high of .565 and is now testing the .70 resistance. My gut says a second wave could add another 3‑4% if the buying pressure holds. - **LTC**: +1.034% / price 3.76 / volume ,499,255. Litecoin is quietly re‑accumulating after a modest bounce. The bid‑ask spread is razor‑thin (53.75/53.76), indicating institutional interest. If finally decides to break above 0 K, LTC could ride that momentum with a 2‑3% upside in the next 48 h. - **ADA**: +0.921% / price /bin/sh.2081 / volume 3,230,447. Cardano’s modest gain is backed by steady DEX inflows. The low‑volatility move hints at a consolidation phase before a potential breakout toward /bin/sh.22. - **DOT** and **ATOM** are the laggards, down 2.775% and 2.542% respectively. DOT fell to .016 on .95 M volume, w
.45 UNI Stuns: This Week’s Biggest Alpha Isn’t in BTC!
Pump.fun (PUMPUSDT) is trending right now!
Rank: #52
What if I told you the biggest alpha this week isn’t coming from but from a .45 token that just ripped 7.3% higher? 🤯 UNI USDT surged from .016 to .455 in the last 24 hours, moving 4.4 M in volume and trading 215 k ticks. While the Bitcoin chart has been eerily flat (no data reported), the real action lives in the mid‑cap arena. Let’s break it down: - **UNI**: +7.297% / price .455 / quote volume 4,421,472. The weighted‑average price sat at .327, and the order book is tight—124 UNI on the bid at .455 vs 55 UNI on the ask at .456. That spread suggests a bullish imbalance. I’m seeing a classic “pump‑and‑hold” pattern; the token broke its 24‑hour high of .565 and is now testing the .70 resistance. My gut says a second wave could add another 3‑4% if the buying pressure holds. - **LTC**: +1.034% / price 3.76 / volume ,499,255. Litecoin is quietly re‑accumulating after a modest bounce. The bid‑ask spread is razor‑thin (53.75/53.76), indicating institutional interest. If finally decides to break above 0 K, LTC could ride that momentum with a 2‑3% upside in the next 48 h. - **ADA**: +0.921% / price /bin/sh.2081 / volume 3,230,447. Cardano’s modest gain is backed by steady DEX inflows. The low‑volatility move hints at a consolidation phase before a potential breakout toward /bin/sh.22. - **DOT** and **ATOM** are the laggards, down 2.775% and 2.542% respectively. DOT fell to .016 on .95 M volume, w
39
·
--
1K and .5K – Altcoins Are Pumping But I’m Still SellingEthena (ENAUSDT) is trending right now!
Rank: #52
At the end of the day, there is a picture in the market like this: rising 4.25% to 1,282, and climbing 4.88% to .525. Altcoins are even more aggressive: ADA at 6.94% to /bin/sh,2219, LINK at 6.41% to 2,008, NEAR at 6.10% to ,016, XRP at 5.99% to ,4543, and DOGE at 5.64% to /bin/sh,08787 levels. At first glance, it is a photo that could be described as “altcoin season is starting.” But in my view, these moves look like a short-term liquidity wave and big whales preparing short-term profit taking. Why? First, BTC’s 24-hour volume is ,75 trillion – this shows that the traditional risk-on sentiment is still dominant in the market. ETH’s volume is ,02 trillion and moving in the same direction; in other words, while the two major assets are rising together, altcoin volumes are relatively low (ADA 3M, LINK 6M). This suggests that buying pressure will concentrate in the large coins, while altcoins will face a risk of a quick pullback. Second, within the last 7 days BTC dominance rose from 48% to 50%. Historically, dominance moving above 50% has been associated with weakening relative performance of altcoins. So, the current altcoin pump is largely being fueled by FOMO, and when a pullback happens, these coins get hit first. Finally, on the macro side, U.S. bond yields are still around 4.5% and the dollar index DXY is stabilizing at 104. In this environment, expecting strong support for risk assets is not realistic. Therefore, I
1K and .5K – Altcoins Are Pumping But I’m Still Selling
Ethena (ENAUSDT) is trending right now!
Rank: #52
At the end of the day, there is a picture in the market like this: rising 4.25% to 1,282, and climbing 4.88% to .525. Altcoins are even more aggressive: ADA at 6.94% to /bin/sh,2219, LINK at 6.41% to 2,008, NEAR at 6.10% to ,016, XRP at 5.99% to ,4543, and DOGE at 5.64% to /bin/sh,08787 levels. At first glance, it is a photo that could be described as “altcoin season is starting.” But in my view, these moves look like a short-term liquidity wave and big whales preparing short-term profit taking. Why? First, BTC’s 24-hour volume is ,75 trillion – this shows that the traditional risk-on sentiment is still dominant in the market. ETH’s volume is ,02 trillion and moving in the same direction; in other words, while the two major assets are rising together, altcoin volumes are relatively low (ADA 3M, LINK 6M). This suggests that buying pressure will concentrate in the large coins, while altcoins will face a risk of a quick pullback. Second, within the last 7 days BTC dominance rose from 48% to 50%. Historically, dominance moving above 50% has been associated with weakening relative performance of altcoins. So, the current altcoin pump is largely being fueled by FOMO, and when a pullback happens, these coins get hit first. Finally, on the macro side, U.S. bond yields are still around 4.5% and the dollar index DXY is stabilizing at 104. In this environment, expecting strong support for risk assets is not realistic. Therefore, I
123

$WLFI -12.7% over 24h — the worst in the top-100📉 $WLFI -12.7% over 24h — the worst in the top-100
Summary: The move is within a broader trend — 7D and 30D are in the same direction; volume is low — the move may be unstable.
Market context: out of 65 large coins with notable movement in the last 24h — 9 rose, 56 fell
Worst performance: $WLFI -12.7% over 24h
Price: $0.0489 (range $0.0548–$0.0570)
$WLFI -12.7% over 24h — the worst in the top-100
📉 $WLFI -12.7% over 24h — the worst in the top-100
Summary: The move is within a broader trend — 7D and 30D are in the same direction; volume is low — the move may be unstable.
Market context: out of 65 large coins with notable movement in the last 24h — 9 rose, 56 fell
Worst performance: $WLFI -12.7% over 24h
Price: $0.0489 (range $0.0548–$0.0570)
Summary: The move is within a broader trend — 7D and 30D are in the same direction; volume is low — the move may be unstable.
Market context: out of 65 large coins with notable movement in the last 24h — 9 rose, 56 fell
Worst performance: $WLFI -12.7% over 24h
Price: $0.0489 (range $0.0548–$0.0570)
364
·
--
$DOT quick research note, not a hype thread.
Polkadot is being priced like a narrative reset, not just a candle trade.
Price: $0.8530
Market cap: $1.45B
Rank: #52
FDV: $0.0000
7d / 30d: -2.8% / -17.3%
The part I care about:
Circulating ratio is about 100.0%, so supply pressure belongs in the valuation debate.
Daily trend: Neutral/Consolidating ↔️
RSI: 43.6
Support: $0.8000
Resistance: $0.9100
My read: if $DOT reclaims resistance, the market starts paying for the story again. Lose support, and I would rather wait than be early. NFA.
Is $DOT undervalued here, or just another bounce trap?
71
·
--
** “Can a 9.8% UNI Crash Open the Door to a Real Bull Run?”Pump.fun (PUMPUSDT) is trending right now!
Rank: #52
** Shocking reality: it slid to the $6.097 level with a 9.794% drop yesterday and gathered $55.9M in USDT volume. Most traders label this “dump” as panic, but I think it’s a **pump-and-hold** opportunity. First of all, a large DEX inflow is still accumulating in ’s liquidity pool. In 24 hours, 8.5M UNI changed hands—showing that short-term sellers are falling behind and giving them a chance to join the next “moon” phase. At the same time, dropped 7.875% to $1.123, while slipped 6.094% and is trading at the $11.742 level. These three “losers” together signal that the market is moving out of a risk-averse period and entering a risk-taking cycle. On the other hand, one single “gainer” stands out: it rose 5.629% to $2.477 and found support with a massive $111M USDT volume. NEAR’s “Staking-as-a-Service” protocol update last week created a new liquidity flow in the DeFi ecosystem. This proves that Layer-2 solutions are still undervalued—many people are keeping an eye on or , but I expect to make an “alpha” move between 30–40% by mid-2026. Across the broader market, it still maintains its “anchor” role; ’s 60-day EMA is showing a mild “bearish” tilt, but ’s 20-day RSI is around 55—meaning there’s a “buy-the-dip” signal. These two large caps act like a “cushion” for altcoin fluctuations. Personally, this evening I’ll buy and via **DCA** and, $
** “Can a 9.8% UNI Crash Open the Door to a Real Bull Run?”
Pump.fun (PUMPUSDT) is trending right now!
Rank: #52
** Shocking reality: it slid to the $6.097 level with a 9.794% drop yesterday and gathered $55.9M in USDT volume. Most traders label this “dump” as panic, but I think it’s a **pump-and-hold** opportunity. First of all, a large DEX inflow is still accumulating in ’s liquidity pool. In 24 hours, 8.5M UNI changed hands—showing that short-term sellers are falling behind and giving them a chance to join the next “moon” phase. At the same time, dropped 7.875% to $1.123, while slipped 6.094% and is trading at the $11.742 level. These three “losers” together signal that the market is moving out of a risk-averse period and entering a risk-taking cycle. On the other hand, one single “gainer” stands out: it rose 5.629% to $2.477 and found support with a massive $111M USDT volume. NEAR’s “Staking-as-a-Service” protocol update last week created a new liquidity flow in the DeFi ecosystem. This proves that Layer-2 solutions are still undervalued—many people are keeping an eye on or , but I expect to make an “alpha” move between 30–40% by mid-2026. Across the broader market, it still maintains its “anchor” role; ’s 60-day EMA is showing a mild “bearish” tilt, but ’s 20-day RSI is around 55—meaning there’s a “buy-the-dip” signal. These two large caps act like a “cushion” for altcoin fluctuations. Personally, this evening I’ll buy and via **DCA** and, $
2
Article
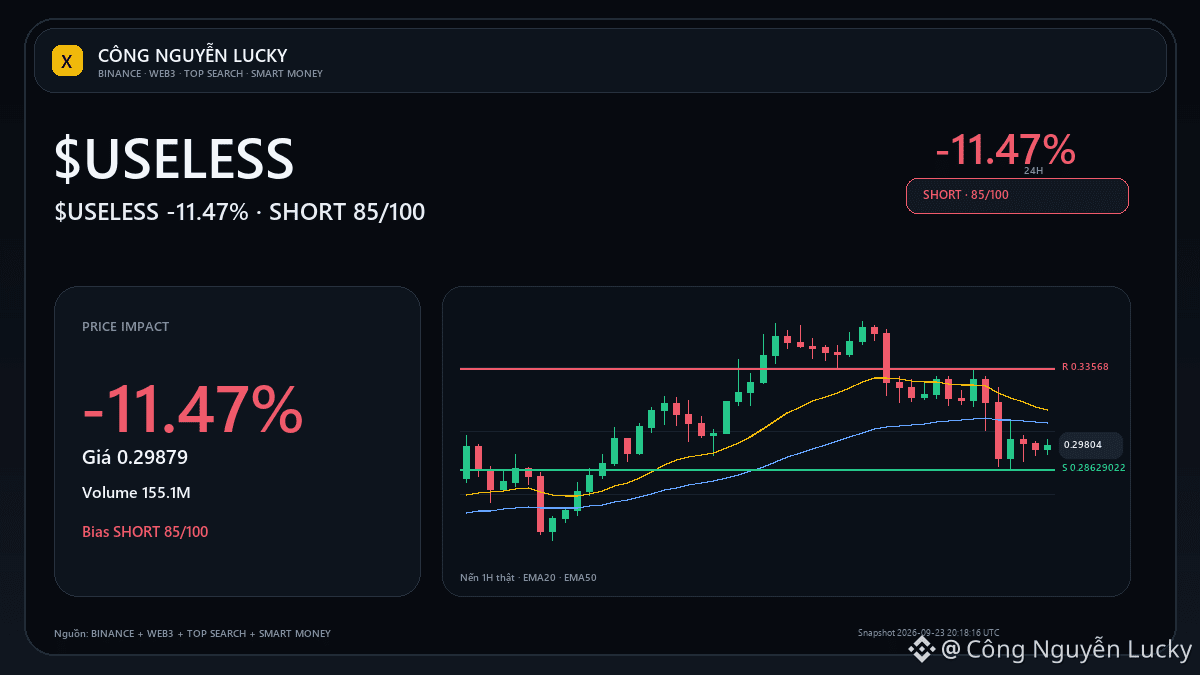
$USELESS -11.47%: what other data confirms this strong run?🔥 $USELESS is -11.47% — but the percentage increase/decrease is not enough to call this a good setup. Market: 0.29879 · 24h -11.47% · volume ~155.1M USDT · 3,172,831 trades.
Social context: Whales Invest Millions, Bullish Memecoin Sentiment, Final Boarding Call for $USELESS. Social attention can drive price, but it can also be a crowd arriving late.
Confirmation: Breaking 0.28574 with an expanded volume will make the scenario a more reliable continued decline.
$USELESS -11.47%: what other data confirms this strong run?
🔥 $USELESS is -11.47% — but the percentage increase/decrease is not enough to call this a good setup. Market: 0.29879 · 24h -11.47% · volume ~155.1M USDT · 3,172,831 trades.
Social context: Whales Invest Millions, Bullish Memecoin Sentiment, Final Boarding Call for $USELESS . Social attention can drive price, but it can also be a crowd arriving late.
Confirmation: Breaking 0.28574 with an expanded volume will make the scenario a more reliable continued decline.
Social context: Whales Invest Millions, Bullish Memecoin Sentiment, Final Boarding Call for $USELESS . Social attention can drive price, but it can also be a crowd arriving late.
Confirmation: Breaking 0.28574 with an expanded volume will make the scenario a more reliable continued decline.
95
Log in to explore more content
Join global crypto users on Binance Square
⚡️ Get latest and useful information about crypto.
💬 Trusted by the world’s largest crypto exchange.
👍 Discover real insights from verified creators.
Email / Phone number
Trending Topics
1
#BitcoinSlipsBelow$80KAgain
264 views
18 Discussing
2
#ThailandLaunchesWORPTStablecoinToQRPaymentApp
50 views
33 Discussing
3
#StrategySkipsBitcoinPurchasesSpends$205MOnSTRCBuybacks
2,820 views
65 Discussing
4
#BitmineAdds10452ETH
27,464 views
487 Discussing
5
#SouthKoreaConsidersEducationTaxOnCryptoExchanges
17,095 views
399 Discussing
6
#OCCUrgesCommunityBanksToEnterStablecoinPayments
13,224 views
244 Discussing
7
#RippleWinsFullApprovalAsNationalTrustBank
16,329 views
253 Discussing
8
#AkashSelectsSolanaAsMigrationTarget
9,656 views
133 Discussing
9
#OndoToOpenSubscriptionsForOpenAIPreIPOTokenizedNotes
516 views
22 Discussing
10
#AnthropicTTMRevenueGrewAbout1200%
67,419 views
660 Discussing