
#21
21
33,786 views
144 Discussing
Hot
Latest

·
--
See translation
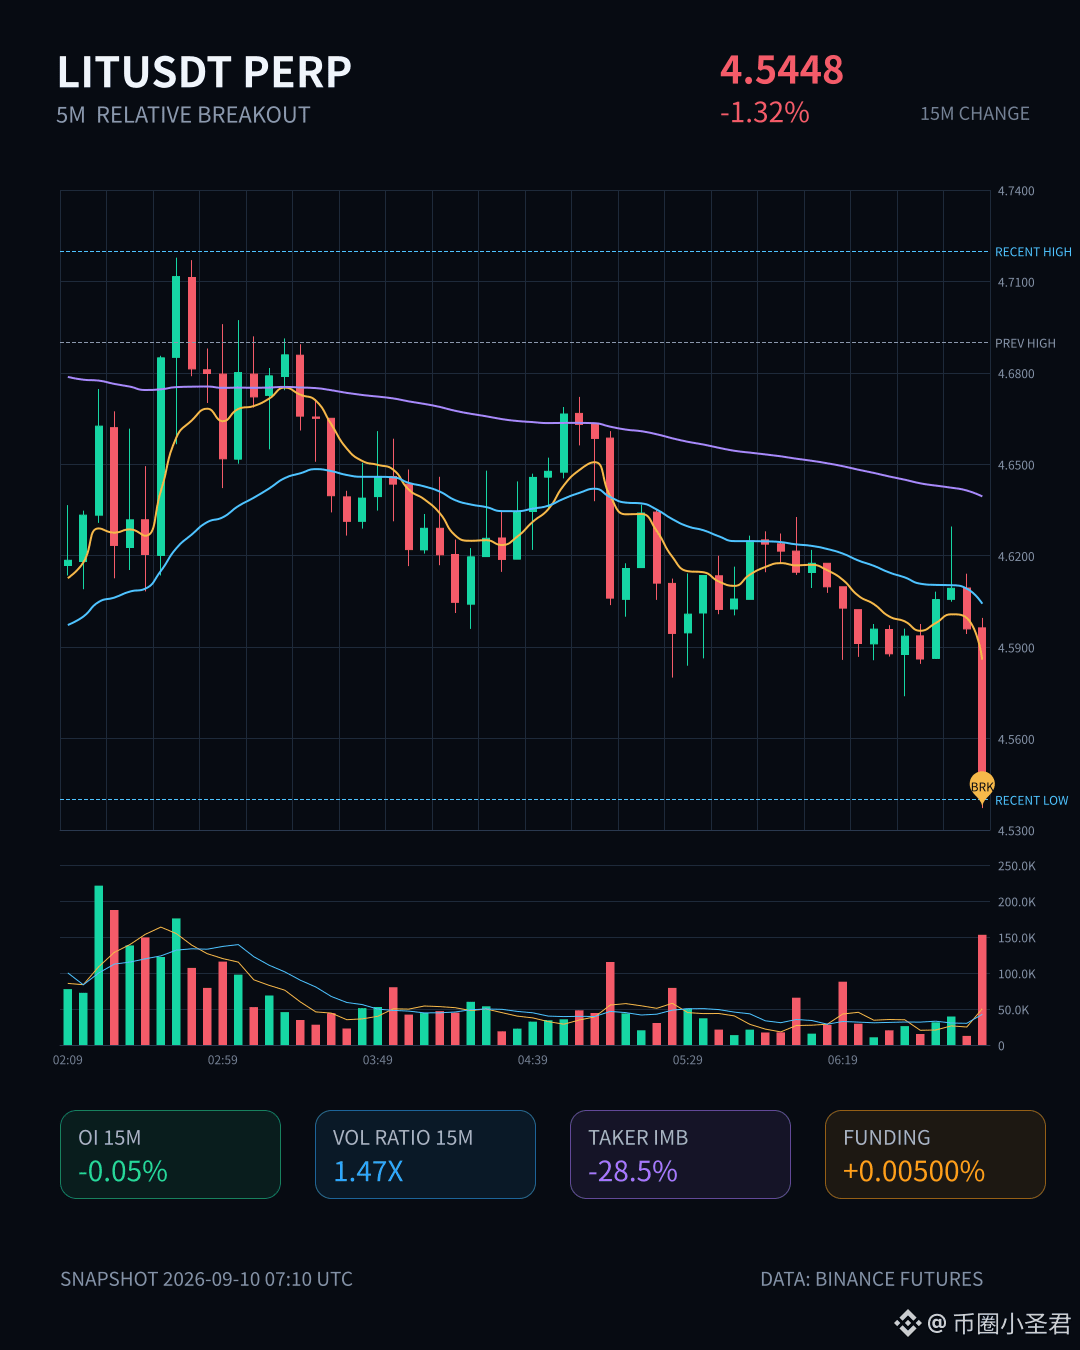
LIT 这波跌得不太像恐慌盘,更像多头自己先撤了。
15m 跌 1.32%,量放出来 1.47x,收盘价直接跌破近 20 根 5m K 的下沿。主动成交差 -28.5%,买卖比 0.56,卖压在主导,但真正有意思的是 OI——15m -0.05%,1h -0.27%,名义变化 -1.45M。价格跌 + OI 降,这不是新空进场砸盘,是多头去杠杆、止损或者仓位收缩。简单说,杠杆先跑,价格才跟着滑。
OI 异常分位 84.9%,全池异常 #21,名义变化 #9。24h 成交额还有 159M,深度不算差,所以这个位置更像一次区间边界的试探,而不是流动性塌方。接下来看两点:跌破后能不能快速收回下沿,还是 OI 继续掉、价格贴着下沿磨。前者是洗盘,后者才是真的转弱。
$LIT
LIT 这波跌得不太像恐慌盘,更像多头自己先撤了。
15m 跌 1.32%,量放出来 1.47x,收盘价直接跌破近 20 根 5m K 的下沿。主动成交差 -28.5%,买卖比 0.56,卖压在主导,但真正有意思的是 OI——15m -0.05%,1h -0.27%,名义变化 -1.45M。价格跌 + OI 降,这不是新空进场砸盘,是多头去杠杆、止损或者仓位收缩。简单说,杠杆先跑,价格才跟着滑。
OI 异常分位 84.9%,全池异常 #21,名义变化 #9。24h 成交额还有 159M,深度不算差,所以这个位置更像一次区间边界的试探,而不是流动性塌方。接下来看两点:跌破后能不能快速收回下沿,还是 OI 继续掉、价格贴着下沿磨。前者是洗盘,后者才是真的转弱。
$LIT
15m 跌 1.32%,量放出来 1.47x,收盘价直接跌破近 20 根 5m K 的下沿。主动成交差 -28.5%,买卖比 0.56,卖压在主导,但真正有意思的是 OI——15m -0.05%,1h -0.27%,名义变化 -1.45M。价格跌 + OI 降,这不是新空进场砸盘,是多头去杠杆、止损或者仓位收缩。简单说,杠杆先跑,价格才跟着滑。
OI 异常分位 84.9%,全池异常 #21,名义变化 #9。24h 成交额还有 159M,深度不算差,所以这个位置更像一次区间边界的试探,而不是流动性塌方。接下来看两点:跌破后能不能快速收回下沿,还是 OI 继续掉、价格贴着下沿磨。前者是洗盘,后者才是真的转弱。
$LIT
8


·
--
BTR Anomaly AnalysisWhen the BTR alarm pops up, first look at the data: 24h is only -1.9%, but 5m is -5.8% and 1h is -11.2%, with the volume ratio reaching 25.5x. What does that tell us? For the short term, it’s a sell-off with heavy volume, not a slow, grindy decline. A 25.5x volume paired with a 5.8% drop in five minutes means someone is dumping and distributing, not a low-volume pullback.
Look at the position: the current price is $0.05151, down 11.2% in one hour—basically spitting back the recent gains quickly. The most taboo thing in this kind of move is "buying the dip because it dropped too much". After a sudden sell-off, there’s often a second leg down, and catching the falling knife can easily land you in the middle of the mountain.
The emotional side is more interesting. Social activity isn’t actually low—there are 43 discussions in 1h, but there are 0 KOLs and BSQ 248 ranks at #21. Translate this: retail traders are arguing, big names haven’t stepped in, and discussions are still in a "disagreement" state. This kind of structure usually means chips are being exchanged, the direction hasn’t been decided, so no one pretend they can see clearly.
BTR Anomaly Analysis
When the BTR alarm pops up, first look at the data: 24h is only -1.9%, but 5m is -5.8% and 1h is -11.2%, with the volume ratio reaching 25.5x. What does that tell us? For the short term, it’s a sell-off with heavy volume, not a slow, grindy decline. A 25.5x volume paired with a 5.8% drop in five minutes means someone is dumping and distributing, not a low-volume pullback.
Look at the position: the current price is $0.05151, down 11.2% in one hour—basically spitting back the recent gains quickly. The most taboo thing in this kind of move is "buying the dip because it dropped too much". After a sudden sell-off, there’s often a second leg down, and catching the falling knife can easily land you in the middle of the mountain.
The emotional side is more interesting. Social activity isn’t actually low—there are 43 discussions in 1h, but there are 0 KOLs and BSQ 248 ranks at #21. Translate this: retail traders are arguing, big names haven’t stepped in, and discussions are still in a "disagreement" state. This kind of structure usually means chips are being exchanged, the direction hasn’t been decided, so no one pretend they can see clearly.
Look at the position: the current price is $0.05151, down 11.2% in one hour—basically spitting back the recent gains quickly. The most taboo thing in this kind of move is "buying the dip because it dropped too much". After a sudden sell-off, there’s often a second leg down, and catching the falling knife can easily land you in the middle of the mountain.
The emotional side is more interesting. Social activity isn’t actually low—there are 43 discussions in 1h, but there are 0 KOLs and BSQ 248 ranks at #21. Translate this: retail traders are arguing, big names haven’t stepped in, and discussions are still in a "disagreement" state. This kind of structure usually means chips are being exchanged, the direction hasn’t been decided, so no one pretend they can see clearly.
83

·
--
$BULLA 15 minutes, it surged by almost 3%, and the trading volume is 3.68 times the usual. OI is also still rising in sync. With this kind of move where both volume and price are going up together, it’s basically safe to say that new long leverage has entered and is taking over—not a “bullish” spike from short covering. 💪
Just now, it directly broke above the highs of the last 20 consecutive 5-minute K-lines. The percentage of aggressive buy orders is 14.2%, with buy:sell as high as 1.33—which is the kind of real, hard money that pushes prices higher.
Now the abnormal percentile of OI is already 98.4%, ranking #4 in the whole pool. Within 30 minutes, the nominal change jumped to #21. In this situation, continuing to push higher isn’t really an issue—but the closer you get to the historical extreme zone, the more you need to plan your defensive levels in advance. Don’t wait until the wind stops and you’re still running around without protection.
$BULLA 15 minutes, it surged by almost 3%, and the trading volume is 3.68 times the usual. OI is also still rising in sync. With this kind of move where both volume and price are going up together, it’s basically safe to say that new long leverage has entered and is taking over—not a “bullish” spike from short covering. 💪
Just now, it directly broke above the highs of the last 20 consecutive 5-minute K-lines. The percentage of aggressive buy orders is 14.2%, with buy:sell as high as 1.33—which is the kind of real, hard money that pushes prices higher.
Now the abnormal percentile of OI is already 98.4%, ranking #4 in the whole pool. Within 30 minutes, the nominal change jumped to #21. In this situation, continuing to push higher isn’t really an issue—but the closer you get to the historical extreme zone, the more you need to plan your defensive levels in advance. Don’t wait until the wind stops and you’re still running around without protection.
Just now, it directly broke above the highs of the last 20 consecutive 5-minute K-lines. The percentage of aggressive buy orders is 14.2%, with buy:sell as high as 1.33—which is the kind of real, hard money that pushes prices higher.
Now the abnormal percentile of OI is already 98.4%, ranking #4 in the whole pool. Within 30 minutes, the nominal change jumped to #21. In this situation, continuing to push higher isn’t really an issue—but the closer you get to the historical extreme zone, the more you need to plan your defensive levels in advance. Don’t wait until the wind stops and you’re still running around without protection.
38

·
--
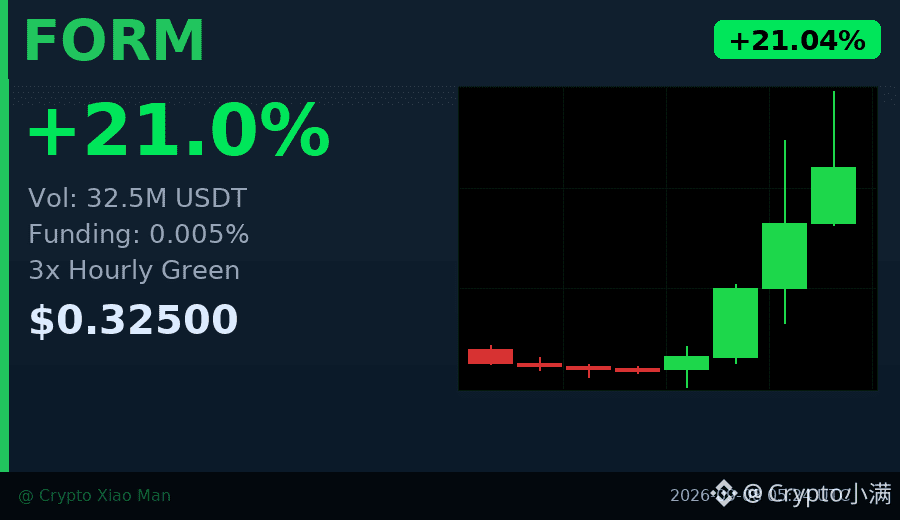
Behind the 21% price jump, trading volume quietly swelled to 32.5 million USDT—this is not the kind of market that spikes in a second and then quickly fades.
FORM has climbed from 0.2474 all the way to 0.3523, and it’s now holding around 0.325. The hourly K-line has printed three consecutive bullish candles, and the bid is truly there.
More importantly, the funding rate is only 0.005%, and the longs haven’t crowded together. With 55% of positions long and 45% short, divergence still exists—which is actually healthy.
Many people see a big rally and chase it, but I care more about whether the volume can hold up. This wave’s volume—at the very least—suggests that large capital is seriously building positions.
$FORM #成交量验证 #21%
Click the small card below to quickly check the market 👇
Behind the 21% price jump, trading volume quietly swelled to 32.5 million USDT—this is not the kind of market that spikes in a second and then quickly fades.
FORM has climbed from 0.2474 all the way to 0.3523, and it’s now holding around 0.325. The hourly K-line has printed three consecutive bullish candles, and the bid is truly there.
More importantly, the funding rate is only 0.005%, and the longs haven’t crowded together. With 55% of positions long and 45% short, divergence still exists—which is actually healthy.
Many people see a big rally and chase it, but I care more about whether the volume can hold up. This wave’s volume—at the very least—suggests that large capital is seriously building positions.
$FORM #成交量验证 #21%
Click the small card below to quickly check the market 👇
FORM has climbed from 0.2474 all the way to 0.3523, and it’s now holding around 0.325. The hourly K-line has printed three consecutive bullish candles, and the bid is truly there.
More importantly, the funding rate is only 0.005%, and the longs haven’t crowded together. With 55% of positions long and 45% short, divergence still exists—which is actually healthy.
Many people see a big rally and chase it, but I care more about whether the volume can hold up. This wave’s volume—at the very least—suggests that large capital is seriously building positions.
$FORM #成交量验证 #21%
Click the small card below to quickly check the market 👇
23
·
--
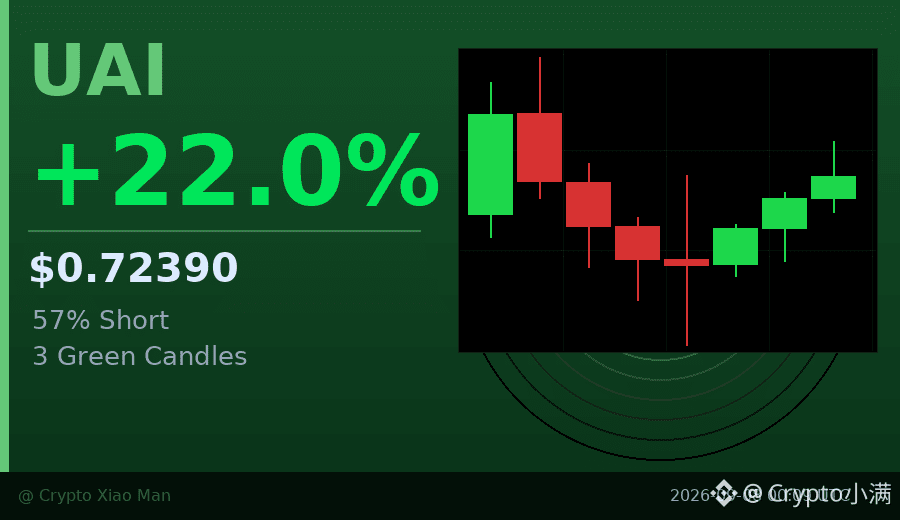
Behind the 21% surge, are shorts still adding positions?
UAI is up 21.95% today, with the price reaching 0.7239 and volume at 207 million U. But interestingly, in the futures market, 57% of participants are still shorting, while only 43% are going long.
The hourly chart has already closed three consecutive bullish candles, with buy-side demand continuously absorbing. In this kind of market, the more the shorts get squeezed, the more uncomfortable it becomes— as the price moves upward, stop-loss orders will accelerate the push higher.
Volume of 207 million isn’t small, suggesting real money is coming in. The funding rate is 0.036%, which is still relatively mild and not at an extreme level.
In the short term, if it holds above 0.72, the next move may test around 0.76 near today’s high.
$UAI #AI concept #21% surge
Click the small card below to quickly check the market 👇
Behind the 21% surge, are shorts still adding positions?
UAI is up 21.95% today, with the price reaching 0.7239 and volume at 207 million U. But interestingly, in the futures market, 57% of participants are still shorting, while only 43% are going long.
The hourly chart has already closed three consecutive bullish candles, with buy-side demand continuously absorbing. In this kind of market, the more the shorts get squeezed, the more uncomfortable it becomes— as the price moves upward, stop-loss orders will accelerate the push higher.
Volume of 207 million isn’t small, suggesting real money is coming in. The funding rate is 0.036%, which is still relatively mild and not at an extreme level.
In the short term, if it holds above 0.72, the next move may test around 0.76 near today’s high.
$UAI #AI concept #21% surge
Click the small card below to quickly check the market 👇
UAI is up 21.95% today, with the price reaching 0.7239 and volume at 207 million U. But interestingly, in the futures market, 57% of participants are still shorting, while only 43% are going long.
The hourly chart has already closed three consecutive bullish candles, with buy-side demand continuously absorbing. In this kind of market, the more the shorts get squeezed, the more uncomfortable it becomes— as the price moves upward, stop-loss orders will accelerate the push higher.
Volume of 207 million isn’t small, suggesting real money is coming in. The funding rate is 0.036%, which is still relatively mild and not at an extreme level.
In the short term, if it holds above 0.72, the next move may test around 0.76 near today’s high.
$UAI #AI concept #21% surge
Click the small card below to quickly check the market 👇
262
·
--
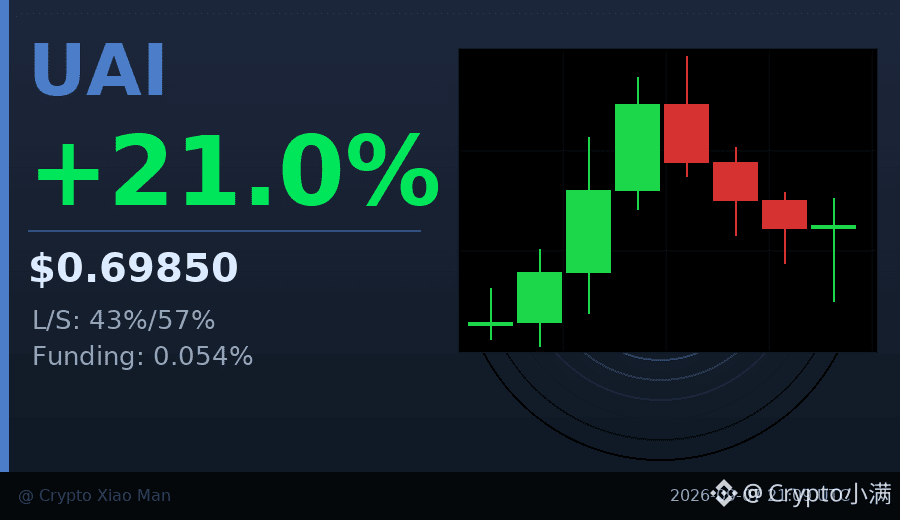
Behind the 21% surge, have the shorts actually increased their positions?
Today, UAI is up 20.97%. The price moved from 0.51 to a high of 0.76, with trading volume nearing 200 million U. But interestingly, in the current positions, 57% are short positions, and only 43% are long positions.
Usually after a big rally, longs take the upper hand—yet here it’s the opposite. There are two possible explanations: one is that experienced traders are trying to short at a high level, believing there’s enough pressure around 0.76; the other is that someone is betting on a pullback and is ready to pick up cheaper shares.
The last 8 hours’ trend does show a steady strengthening, but the final candlestick dropped from 0.72 to 0.6985, suggesting profit-taking is happening at higher levels. If the market can hold above 0.68 next, longs may get another chance to test 0.75. If it breaks below 0.65, the group that chased the price earlier may be forced to cut losses.
I personally prefer to act once the direction becomes clearer. At this point, where longs and shorts are split, it’s easy to get slapped back and forth.
$UAI #多空分歧 #21%涨幅
Click the card below to quickly view the market 👇
Behind the 21% surge, have the shorts actually increased their positions?
Today, UAI is up 20.97%. The price moved from 0.51 to a high of 0.76, with trading volume nearing 200 million U. But interestingly, in the current positions, 57% are short positions, and only 43% are long positions.
Usually after a big rally, longs take the upper hand—yet here it’s the opposite. There are two possible explanations: one is that experienced traders are trying to short at a high level, believing there’s enough pressure around 0.76; the other is that someone is betting on a pullback and is ready to pick up cheaper shares.
The last 8 hours’ trend does show a steady strengthening, but the final candlestick dropped from 0.72 to 0.6985, suggesting profit-taking is happening at higher levels. If the market can hold above 0.68 next, longs may get another chance to test 0.75. If it breaks below 0.65, the group that chased the price earlier may be forced to cut losses.
I personally prefer to act once the direction becomes clearer. At this point, where longs and shorts are split, it’s easy to get slapped back and forth.
$UAI #多空分歧 #21%涨幅
Click the card below to quickly view the market 👇
Today, UAI is up 20.97%. The price moved from 0.51 to a high of 0.76, with trading volume nearing 200 million U. But interestingly, in the current positions, 57% are short positions, and only 43% are long positions.
Usually after a big rally, longs take the upper hand—yet here it’s the opposite. There are two possible explanations: one is that experienced traders are trying to short at a high level, believing there’s enough pressure around 0.76; the other is that someone is betting on a pullback and is ready to pick up cheaper shares.
The last 8 hours’ trend does show a steady strengthening, but the final candlestick dropped from 0.72 to 0.6985, suggesting profit-taking is happening at higher levels. If the market can hold above 0.68 next, longs may get another chance to test 0.75. If it breaks below 0.65, the group that chased the price earlier may be forced to cut losses.
I personally prefer to act once the direction becomes clearer. At this point, where longs and shorts are split, it’s easy to get slapped back and forth.
$UAI #多空分歧 #21%涨幅
Click the card below to quickly view the market 👇
181
·
--
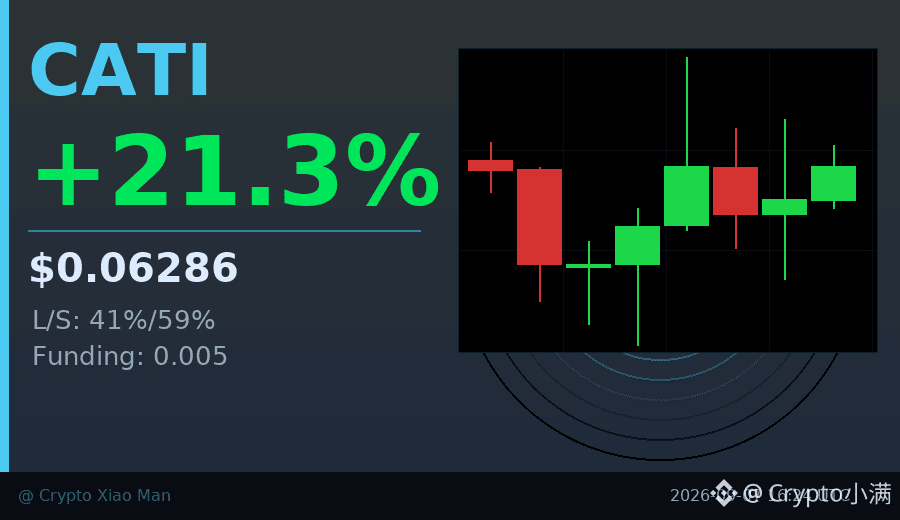
There’s an interesting contradiction behind the 21% surge: Today, CATI saw a breakout with increased volume, pushing up to 0.06583, with trading volume of 65.60 million USDT—but shorts are still in control.
Position data shows 59% are short orders, with only 41% long. The price has closed green for three consecutive hourly candles, yet the funding rate is only 0.005, indicating that longs haven’t gone crazy with leverage.
This kind of situation—price rising but shorts don’t get wiped out—often suggests there’s still room to move. When shorts are forced to close, it can further push the price up.
The key is whether the high at 0.06583 can be broken; the trading volume has already sent a signal.
$CATI #猫咪币 #21%涨幅
Click the small card below to quickly check the market👇
There’s an interesting contradiction behind the 21% surge: Today, CATI saw a breakout with increased volume, pushing up to 0.06583, with trading volume of 65.60 million USDT—but shorts are still in control.
Position data shows 59% are short orders, with only 41% long. The price has closed green for three consecutive hourly candles, yet the funding rate is only 0.005, indicating that longs haven’t gone crazy with leverage.
This kind of situation—price rising but shorts don’t get wiped out—often suggests there’s still room to move. When shorts are forced to close, it can further push the price up.
The key is whether the high at 0.06583 can be broken; the trading volume has already sent a signal.
$CATI #猫咪币 #21%涨幅
Click the small card below to quickly check the market👇
Position data shows 59% are short orders, with only 41% long. The price has closed green for three consecutive hourly candles, yet the funding rate is only 0.005, indicating that longs haven’t gone crazy with leverage.
This kind of situation—price rising but shorts don’t get wiped out—often suggests there’s still room to move. When shorts are forced to close, it can further push the price up.
The key is whether the high at 0.06583 can be broken; the trading volume has already sent a signal.
$CATI #猫咪币 #21%涨幅
Click the small card below to quickly check the market👇
11
·
--
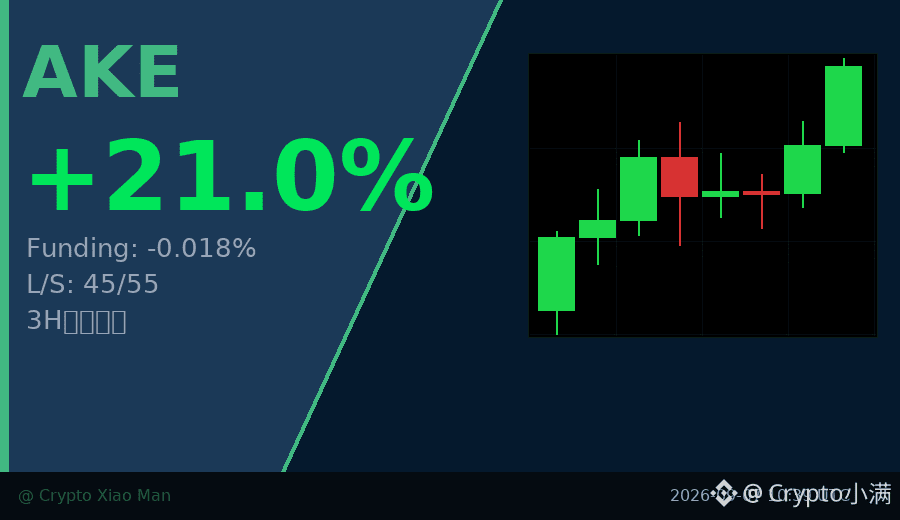
Can negative funding rates still rise 21%? AKE today delivered a counterintuitive script.
The price moved from 0.0113 to 0.0173, with trading volume of 152 million USDT, yet the funding rate was -0.0176%.
This means shorts are paying longs, but the price somehow doesn’t fall.
The hourly chart has been closing in green for consecutive candles; the last one clearly surged in volume—buy orders are absorbing all sell pressure.
The long-vs-short ratio is 45% to 55%, with shorts slightly in the lead, but the market is voting with its feet—price tells the whole story.
This kind of divergence usually has two possible outcomes: either shorts get squeezed and liquidation accelerates the rally,
or whales take the opportunity to distribute.
I’ll follow the trend first, but I’ll keep a close watch on changes in trading volume.
$AKE #资金费率背离 #21%
Click the small card below to quickly check the行情👇
Can negative funding rates still rise 21%? AKE today delivered a counterintuitive script.
The price moved from 0.0113 to 0.0173, with trading volume of 152 million USDT, yet the funding rate was -0.0176%.
This means shorts are paying longs, but the price somehow doesn’t fall.
The hourly chart has been closing in green for consecutive candles; the last one clearly surged in volume—buy orders are absorbing all sell pressure.
The long-vs-short ratio is 45% to 55%, with shorts slightly in the lead, but the market is voting with its feet—price tells the whole story.
This kind of divergence usually has two possible outcomes: either shorts get squeezed and liquidation accelerates the rally,
or whales take the opportunity to distribute.
I’ll follow the trend first, but I’ll keep a close watch on changes in trading volume.
$AKE #资金费率背离 #21%
Click the small card below to quickly check the行情👇
The price moved from 0.0113 to 0.0173, with trading volume of 152 million USDT, yet the funding rate was -0.0176%.
This means shorts are paying longs, but the price somehow doesn’t fall.
The hourly chart has been closing in green for consecutive candles; the last one clearly surged in volume—buy orders are absorbing all sell pressure.
The long-vs-short ratio is 45% to 55%, with shorts slightly in the lead, but the market is voting with its feet—price tells the whole story.
This kind of divergence usually has two possible outcomes: either shorts get squeezed and liquidation accelerates the rally,
or whales take the opportunity to distribute.
I’ll follow the trend first, but I’ll keep a close watch on changes in trading volume.
$AKE #资金费率背离 #21%
Click the small card below to quickly check the行情👇
22

·
--
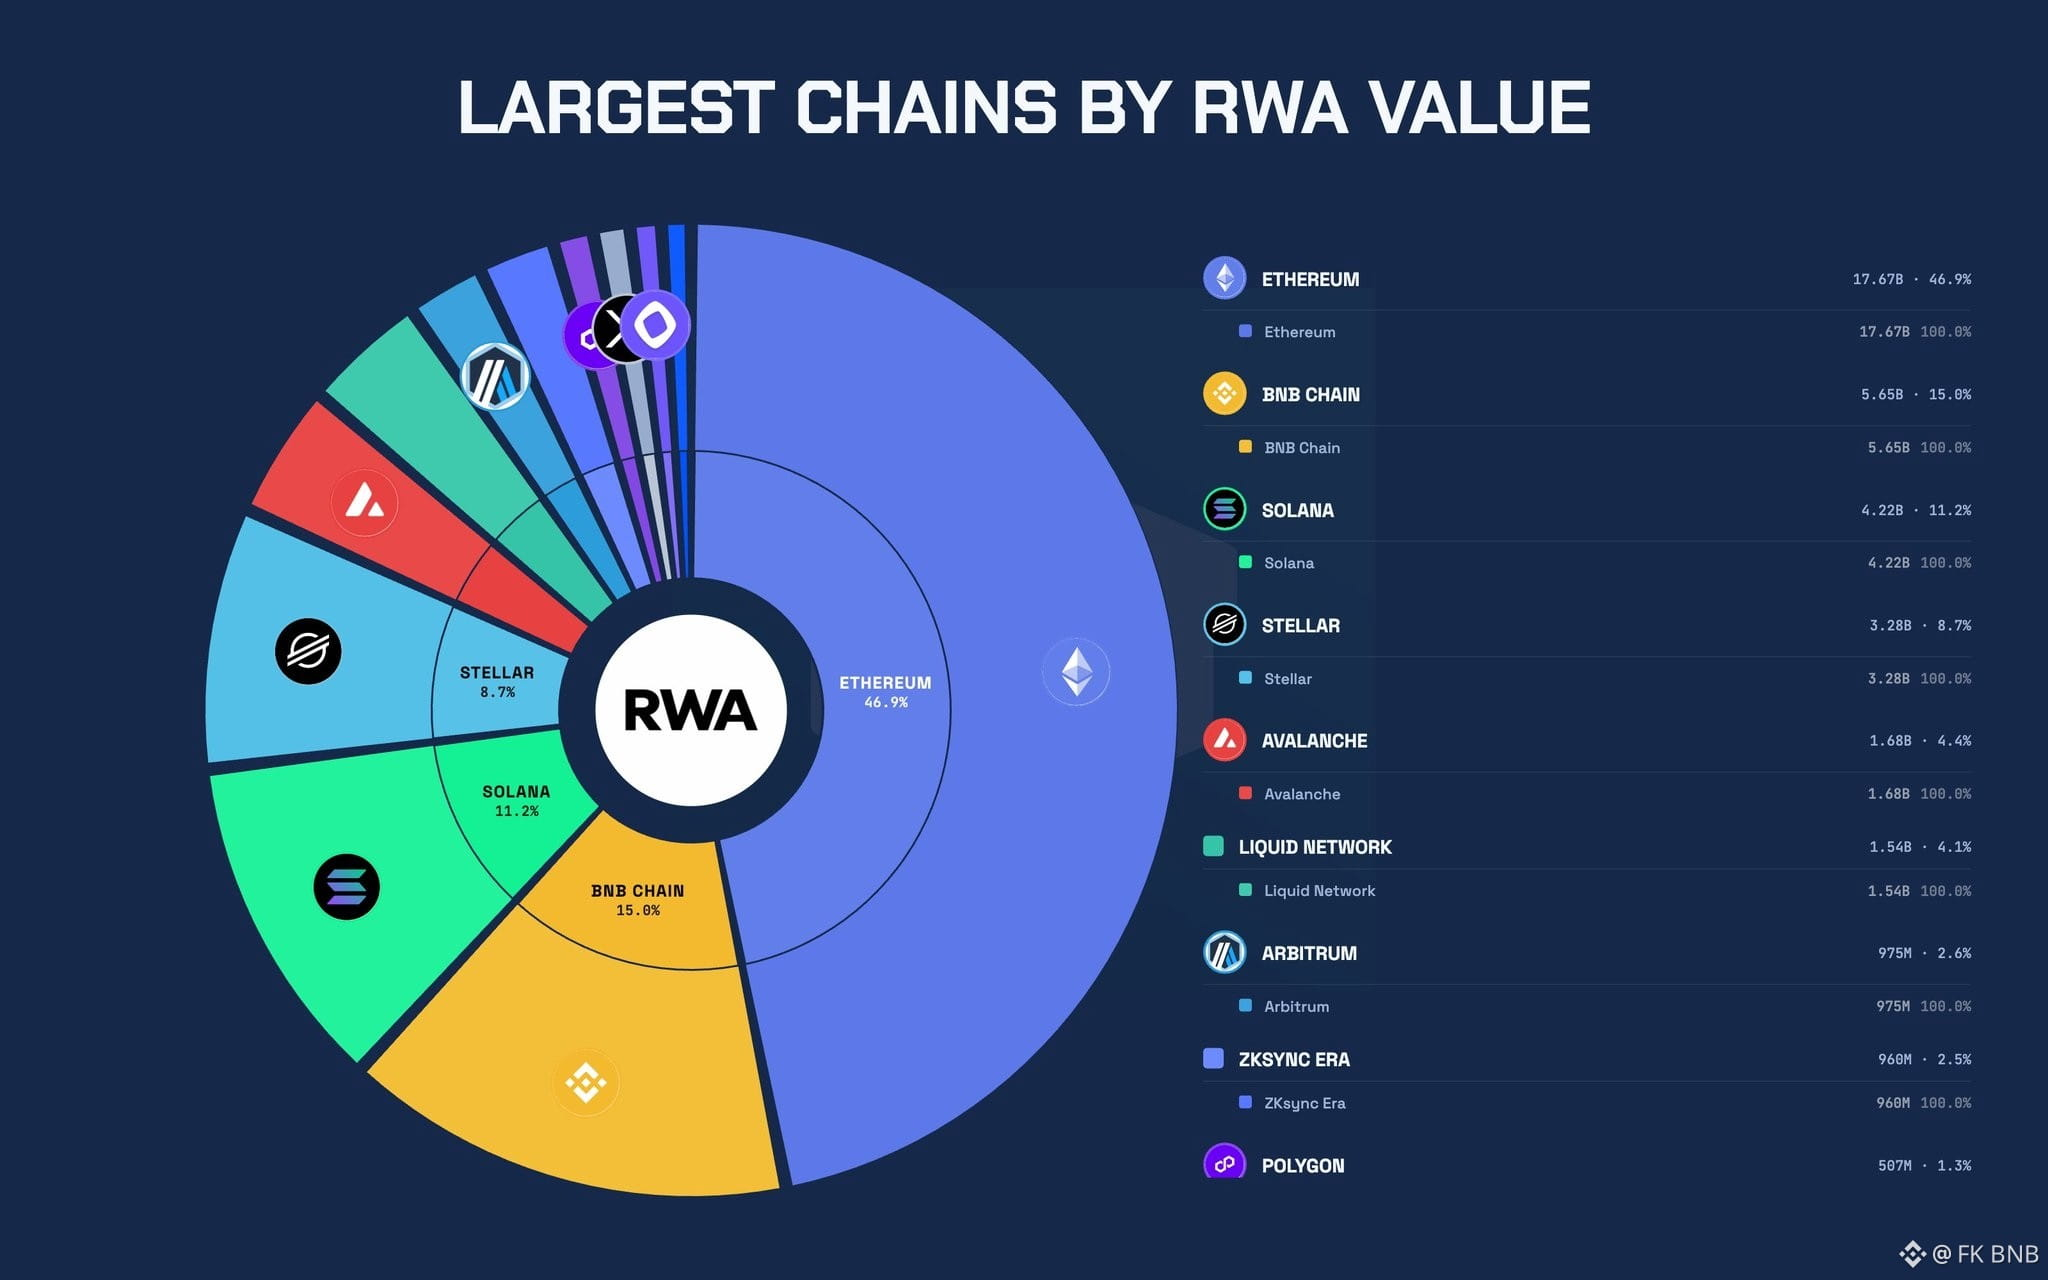
On-chain RWAs just crossed ~$37B in active market cap.
Top 10 chains by REAL distributed RWA value:
→ Ethereum: $17.67B (99.4% distributed)
→ $BNB Chain: $5.65B (100%)
→ $SOL : $4.23B (97.1%), 400K holders, most of any chain
→ Stellar: $3.28B (97.7%)
→ Avalanche: $1.68B (only 12.8% distributed, the $13B "total" is mostly represented)
→ Liquid Network: $1.54B (100%, just 62 holders)
→ Arbitrum: $975M (97.5%)
→ ZKsync Era: $960M (32.6%)
→ Polygon: $507M (40.6%)
→ XRP Ledger: $458M (10.2% distributed, $4.5B "total" is 90% bookkeeping)
✦ Points to note from the info:
- Ethereum still owns ~46%. Its share is only shrinking because the pie is growing, not because assets are leaving. Most RWA volume is still on $ETH despite the Sol and RH hype lately.
- Solana has the highest number of RWA holders at 400,084.
- Avalanche and XRP Ledger look top-5 until you separate transferable tokens from chain records on assets held the old way. On distributed value XRP barely makes the list, and Avalanche drops from an apparent 3rd to 5th.
- Some important projects outside the top 10 are:
→ SEI : #13
→ Mantle : #14
→ Robinhood : #16
→ Algorand : #21
→ SUI : #23
{future}(ETHUSDT)
{future}(BNBUSDT)
{future}(SOLUSDT)
On-chain RWAs just crossed ~$37B in active market cap.
Top 10 chains by REAL distributed RWA value:
→ Ethereum: $17.67B (99.4% distributed)
→ $BNB Chain: $5.65B (100%)
→ $SOL : $4.23B (97.1%), 400K holders, most of any chain
→ Stellar: $3.28B (97.7%)
→ Avalanche: $1.68B (only 12.8% distributed, the $13B "total" is mostly represented)
→ Liquid Network: $1.54B (100%, just 62 holders)
→ Arbitrum: $975M (97.5%)
→ ZKsync Era: $960M (32.6%)
→ Polygon: $507M (40.6%)
→ XRP Ledger: $458M (10.2% distributed, $4.5B "total" is 90% bookkeeping)
✦ Points to note from the info:
- Ethereum still owns ~46%. Its share is only shrinking because the pie is growing, not because assets are leaving. Most RWA volume is still on $ETH despite the Sol and RH hype lately.
- Solana has the highest number of RWA holders at 400,084.
- Avalanche and XRP Ledger look top-5 until you separate transferable tokens from chain records on assets held the old way. On distributed value XRP barely makes the list, and Avalanche drops from an apparent 3rd to 5th.
- Some important projects outside the top 10 are:
→ SEI : #13
→ Mantle : #14
→ Robinhood : #16
→ Algorand : #21
→ SUI : #23
Top 10 chains by REAL distributed RWA value:
→ Ethereum: $17.67B (99.4% distributed)
→ $BNB Chain: $5.65B (100%)
→ $SOL : $4.23B (97.1%), 400K holders, most of any chain
→ Stellar: $3.28B (97.7%)
→ Avalanche: $1.68B (only 12.8% distributed, the $13B "total" is mostly represented)
→ Liquid Network: $1.54B (100%, just 62 holders)
→ Arbitrum: $975M (97.5%)
→ ZKsync Era: $960M (32.6%)
→ Polygon: $507M (40.6%)
→ XRP Ledger: $458M (10.2% distributed, $4.5B "total" is 90% bookkeeping)
✦ Points to note from the info:
- Ethereum still owns ~46%. Its share is only shrinking because the pie is growing, not because assets are leaving. Most RWA volume is still on $ETH despite the Sol and RH hype lately.
- Solana has the highest number of RWA holders at 400,084.
- Avalanche and XRP Ledger look top-5 until you separate transferable tokens from chain records on assets held the old way. On distributed value XRP barely makes the list, and Avalanche drops from an apparent 3rd to 5th.
- Some important projects outside the top 10 are:
→ SEI : #13
→ Mantle : #14
→ Robinhood : #16
→ Algorand : #21
→ SUI : #23
28
·
--
$B this 15-minute line sold off pretty decisively, -2.78%, with volume shooting up to 5x, and by the close it had also fallen below the lower bound of the recent 20 five-minute candles’ range. Structurally, this is indeed a concentrated release of bearish momentum in this move.
But the interesting part is on the derivatives side:
The 15-minute OI dropped 0.59%, the 1-hour cumulative drop was 1.16%, and notional open interest contracted by more than 5%. Meanwhile, this abnormal OI percentile is already at 93.3%, and it has stayed elevated across several consecutive periods.
This is key — if this were purely incremental short selling, you’d expect OI to rise. But positions are now falling, which suggests that more longs are being stopped out or deleveraging out of the market, rather than a large amount of new shorts entering to press the price down. The active selling bias is still strong, though: buy/sell ratio is 0.64, and trade imbalance is -22.2%.
The current structure looks more like price and positions are being flushed out together, with longs being forced to capitulate and push price into an extreme zone, close to a historical range boundary. The all-pool abnormal ranking is also relatively high (#21), and notional change is near the top as well.
The combination of a price breakdown plus a sharp drop in open interest has historically tended to create a brief vacuum after an oversold move. But for a pure left-side trade, it really comes down to whether you’re willing to catch it. For now, I’d stay put and watch whether OI on the 1-hour level can hold after this 15-minute lower wick. If positions keep falling even while price rebounds, then there’s a good chance of a relatively clean repair. Otherwise, if OI starts building again during the rebound, then it’s still just a weak bounce and needs another round of validation.
$B this 15-minute line sold off pretty decisively, -2.78%, with volume shooting up to 5x, and by the close it had also fallen below the lower bound of the recent 20 five-minute candles’ range. Structurally, this is indeed a concentrated release of bearish momentum in this move.
But the interesting part is on the derivatives side:
The 15-minute OI dropped 0.59%, the 1-hour cumulative drop was 1.16%, and notional open interest contracted by more than 5%. Meanwhile, this abnormal OI percentile is already at 93.3%, and it has stayed elevated across several consecutive periods.
This is key — if this were purely incremental short selling, you’d expect OI to rise. But positions are now falling, which suggests that more longs are being stopped out or deleveraging out of the market, rather than a large amount of new shorts entering to press the price down. The active selling bias is still strong, though: buy/sell ratio is 0.64, and trade imbalance is -22.2%.
The current structure looks more like price and positions are being flushed out together, with longs being forced to capitulate and push price into an extreme zone, close to a historical range boundary. The all-pool abnormal ranking is also relatively high (#21), and notional change is near the top as well.
The combination of a price breakdown plus a sharp drop in open interest has historically tended to create a brief vacuum after an oversold move. But for a pure left-side trade, it really comes down to whether you’re willing to catch it. For now, I’d stay put and watch whether OI on the 1-hour level can hold after this 15-minute lower wick. If positions keep falling even while price rebounds, then there’s a good chance of a relatively clean repair. Otherwise, if OI starts building again during the rebound, then it’s still just a weak bounce and needs another round of validation.
But the interesting part is on the derivatives side:
The 15-minute OI dropped 0.59%, the 1-hour cumulative drop was 1.16%, and notional open interest contracted by more than 5%. Meanwhile, this abnormal OI percentile is already at 93.3%, and it has stayed elevated across several consecutive periods.
This is key — if this were purely incremental short selling, you’d expect OI to rise. But positions are now falling, which suggests that more longs are being stopped out or deleveraging out of the market, rather than a large amount of new shorts entering to press the price down. The active selling bias is still strong, though: buy/sell ratio is 0.64, and trade imbalance is -22.2%.
The current structure looks more like price and positions are being flushed out together, with longs being forced to capitulate and push price into an extreme zone, close to a historical range boundary. The all-pool abnormal ranking is also relatively high (#21), and notional change is near the top as well.
The combination of a price breakdown plus a sharp drop in open interest has historically tended to create a brief vacuum after an oversold move. But for a pure left-side trade, it really comes down to whether you’re willing to catch it. For now, I’d stay put and watch whether OI on the 1-hour level can hold after this 15-minute lower wick. If positions keep falling even while price rebounds, then there’s a good chance of a relatively clean repair. Otherwise, if OI starts building again during the rebound, then it’s still just a weak bounce and needs another round of validation.
18
·
--
$CHIP 15 suddenly saw a sharp volume surge on the 1-minute level, rising 2.25%, with trading volume more than 4 times normal, directly breaking above the recent consolidation range. Active buying on the order book was clearly dominant, and the buy-sell ratio reached 1.37.
Interestingly, 15-minute futures open interest and price were rising at the same time, while 1-hour-level futures positions were actually edging down slightly. This suggests the move was not driven by old long holders adding to positions, but more likely by a concentrated influx of short-term leveraged funds. Funding rates are already at a recent high, and once sentiment reverses on a name like this, the unwind can be very fast.
The pool’s anomaly score ranks #21, and nominal change is also near the top, so CHIP will probably be on a lot of people’s radar tonight. It can be watched for short-term trading opportunities, but be careful not to force a position when funding is this high.
$CHIP 15 suddenly saw a sharp volume surge on the 1-minute level, rising 2.25%, with trading volume more than 4 times normal, directly breaking above the recent consolidation range. Active buying on the order book was clearly dominant, and the buy-sell ratio reached 1.37.
Interestingly, 15-minute futures open interest and price were rising at the same time, while 1-hour-level futures positions were actually edging down slightly. This suggests the move was not driven by old long holders adding to positions, but more likely by a concentrated influx of short-term leveraged funds. Funding rates are already at a recent high, and once sentiment reverses on a name like this, the unwind can be very fast.
The pool’s anomaly score ranks #21, and nominal change is also near the top, so CHIP will probably be on a lot of people’s radar tonight. It can be watched for short-term trading opportunities, but be careful not to force a position when funding is this high.
Interestingly, 15-minute futures open interest and price were rising at the same time, while 1-hour-level futures positions were actually edging down slightly. This suggests the move was not driven by old long holders adding to positions, but more likely by a concentrated influx of short-term leveraged funds. Funding rates are already at a recent high, and once sentiment reverses on a name like this, the unwind can be very fast.
The pool’s anomaly score ranks #21, and nominal change is also near the top, so CHIP will probably be on a lot of people’s radar tonight. It can be watched for short-term trading opportunities, but be careful not to force a position when funding is this high.
59
·
--
$ROBO 15-minute interval directly pumped 1.47%, with volume expanding to 4.8 times the usual level, and the volatility Z-score hitting 4.2. This is far from normal fluctuation; it is clearly someone aggressively pushing with leverage. 📈
The key is not that it rose, but that OI and price moved up together. Open interest in 15-minute contracts increased by 1.75%, and in the 1-hour period it rose by 2.68%. This structure means real new long positions are entering, not a false rally from short covering. The most extreme part is that ROBO's abnormal OI percentile has already reached 99.4%, ranking #1 in the entire pool—meaning this thing has become an extremely abnormal island in the whole derivatives sea.
Aggressive trading imbalance was -32.1%, and the buy/sell ratio was 1.95. In other words, for every 1 sell order placed, 2 buy orders are taking it. This is no longer simple optimism; someone is making a heavy bet on one direction.
24-hour trading volume was only 9.99 million U, so the market cap is not large, but the notional change can still rank #21 in the whole pool, showing that funds have set their sights on it. Near the threshold of historical extreme levels, with OI continuing to extend and both volume and price rising together, this is a leveraged bulldozer—but it is only a few steps away from a cliff. Bulls and bears, good luck. ⚠️
$ROBO 15-minute interval directly pumped 1.47%, with volume expanding to 4.8 times the usual level, and the volatility Z-score hitting 4.2. This is far from normal fluctuation; it is clearly someone aggressively pushing with leverage. 📈
The key is not that it rose, but that OI and price moved up together. Open interest in 15-minute contracts increased by 1.75%, and in the 1-hour period it rose by 2.68%. This structure means real new long positions are entering, not a false rally from short covering. The most extreme part is that ROBO's abnormal OI percentile has already reached 99.4%, ranking #1 in the entire pool—meaning this thing has become an extremely abnormal island in the whole derivatives sea.
Aggressive trading imbalance was -32.1%, and the buy/sell ratio was 1.95. In other words, for every 1 sell order placed, 2 buy orders are taking it. This is no longer simple optimism; someone is making a heavy bet on one direction.
24-hour trading volume was only 9.99 million U, so the market cap is not large, but the notional change can still rank #21 in the whole pool, showing that funds have set their sights on it. Near the threshold of historical extreme levels, with OI continuing to extend and both volume and price rising together, this is a leveraged bulldozer—but it is only a few steps away from a cliff. Bulls and bears, good luck. ⚠️
The key is not that it rose, but that OI and price moved up together. Open interest in 15-minute contracts increased by 1.75%, and in the 1-hour period it rose by 2.68%. This structure means real new long positions are entering, not a false rally from short covering. The most extreme part is that ROBO's abnormal OI percentile has already reached 99.4%, ranking #1 in the entire pool—meaning this thing has become an extremely abnormal island in the whole derivatives sea.
Aggressive trading imbalance was -32.1%, and the buy/sell ratio was 1.95. In other words, for every 1 sell order placed, 2 buy orders are taking it. This is no longer simple optimism; someone is making a heavy bet on one direction.
24-hour trading volume was only 9.99 million U, so the market cap is not large, but the notional change can still rank #21 in the whole pool, showing that funds have set their sights on it. Near the threshold of historical extreme levels, with OI continuing to extend and both volume and price rising together, this is a leveraged bulldozer—but it is only a few steps away from a cliff. Bulls and bears, good luck. ⚠️
20

·
--
After dinner, I leaned on the couch, and my phone was still playing the kids’ animated show. I casually swiped to Binance’s US stock perpetual futures ranking, and $GOOGL was sitting at the front of that row.
Today, this coin isn’t exactly lively—down 0.18% over the last 24 hours. The price has been hovering around $336.35, and the day’s high-low range is only from $339.75 to $333.43.
But precisely because it hasn’t really put on a show, I’m actually more willing to take a couple more looks.
I’m bullish—not because I think the chart looks particularly good today.
It’s because I’ve always believed that for a company like Alphabet, what it holds are some of the least replaceable entry points on the internet.
No matter how market themes rotate—from ads, to search, to the AI track—the broader direction still stays within the scope of what it can catch.
If you’ve been trading crypto for long enough, you develop a habit: you always want the one with the most leverage.
But once you really put money in, many times the thing you can actually sleep at night with is still a business with thick fundamentals and a long runway.
AI is loud right now, but whether it can ultimately tie traffic, products, and monetization into one cohesive force—big platforms naturally have an edge over smaller companies.
On the order book, it’s not like nobody’s watching.
It ranks #14 on Binance’s US stock perpetual futures gains leaderboard, #21 on the volume leaderboard, and clocked $65.94M USDT in the last 24 hours.
The funding rate is only +0.0040%, with an open position of 205,535 contracts. That “flavor” feels more like someone is steadily squatting here, not like a panic-driven stampede fueled by emotion.
For my own part, I’d treat a coin like this as the kind you can research during a pullback—not the kind you charge into at the daily limit-up.
This sideways grind right now actually makes me more comfortable than suddenly getting one big bullish candle.
That said, even a company like $GOOGL can’t be without variables.
If the market cools down on AI expectations next, or risk appetite in the broader market drops, it will still get dragged along.
And for a company of this size, expecting it to sprint out some exaggerated slope just based on a few days of sentiment is, frankly, unrealistic.
If I were you—I mean, if it were me—I’d rather keep watching these kinds of coins that aren’t overly hyped, but where the money hasn’t left, and take them in slowly.
If you can’t hold up, don’t board. Anyway, I’m speaking from experience that I’ve already lost money from.
$GOOGL #US Stocks
I might be wrong too. I’m just making my own judgment.
After dinner, I leaned on the couch, and my phone was still playing the kids’ animated show. I casually swiped to Binance’s US stock perpetual futures ranking, and $GOOGL was sitting at the front of that row.
Today, this coin isn’t exactly lively—down 0.18% over the last 24 hours. The price has been hovering around $336.35, and the day’s high-low range is only from $339.75 to $333.43.
But precisely because it hasn’t really put on a show, I’m actually more willing to take a couple more looks.
I’m bullish—not because I think the chart looks particularly good today.
It’s because I’ve always believed that for a company like Alphabet, what it holds are some of the least replaceable entry points on the internet.
No matter how market themes rotate—from ads, to search, to the AI track—the broader direction still stays within the scope of what it can catch.
If you’ve been trading crypto for long enough, you develop a habit: you always want the one with the most leverage.
But once you really put money in, many times the thing you can actually sleep at night with is still a business with thick fundamentals and a long runway.
AI is loud right now, but whether it can ultimately tie traffic, products, and monetization into one cohesive force—big platforms naturally have an edge over smaller companies.
On the order book, it’s not like nobody’s watching.
It ranks #14 on Binance’s US stock perpetual futures gains leaderboard, #21 on the volume leaderboard, and clocked $65.94M USDT in the last 24 hours.
The funding rate is only +0.0040%, with an open position of 205,535 contracts. That “flavor” feels more like someone is steadily squatting here, not like a panic-driven stampede fueled by emotion.
For my own part, I’d treat a coin like this as the kind you can research during a pullback—not the kind you charge into at the daily limit-up.
This sideways grind right now actually makes me more comfortable than suddenly getting one big bullish candle.
That said, even a company like $GOOGL can’t be without variables.
If the market cools down on AI expectations next, or risk appetite in the broader market drops, it will still get dragged along.
And for a company of this size, expecting it to sprint out some exaggerated slope just based on a few days of sentiment is, frankly, unrealistic.
If I were you—I mean, if it were me—I’d rather keep watching these kinds of coins that aren’t overly hyped, but where the money hasn’t left, and take them in slowly.
If you can’t hold up, don’t board. Anyway, I’m speaking from experience that I’ve already lost money from.
$GOOGL #US Stocks
I might be wrong too. I’m just making my own judgment.
Today, this coin isn’t exactly lively—down 0.18% over the last 24 hours. The price has been hovering around $336.35, and the day’s high-low range is only from $339.75 to $333.43.
But precisely because it hasn’t really put on a show, I’m actually more willing to take a couple more looks.
I’m bullish—not because I think the chart looks particularly good today.
It’s because I’ve always believed that for a company like Alphabet, what it holds are some of the least replaceable entry points on the internet.
No matter how market themes rotate—from ads, to search, to the AI track—the broader direction still stays within the scope of what it can catch.
If you’ve been trading crypto for long enough, you develop a habit: you always want the one with the most leverage.
But once you really put money in, many times the thing you can actually sleep at night with is still a business with thick fundamentals and a long runway.
AI is loud right now, but whether it can ultimately tie traffic, products, and monetization into one cohesive force—big platforms naturally have an edge over smaller companies.
On the order book, it’s not like nobody’s watching.
It ranks #14 on Binance’s US stock perpetual futures gains leaderboard, #21 on the volume leaderboard, and clocked $65.94M USDT in the last 24 hours.
The funding rate is only +0.0040%, with an open position of 205,535 contracts. That “flavor” feels more like someone is steadily squatting here, not like a panic-driven stampede fueled by emotion.
For my own part, I’d treat a coin like this as the kind you can research during a pullback—not the kind you charge into at the daily limit-up.
This sideways grind right now actually makes me more comfortable than suddenly getting one big bullish candle.
That said, even a company like $GOOGL can’t be without variables.
If the market cools down on AI expectations next, or risk appetite in the broader market drops, it will still get dragged along.
And for a company of this size, expecting it to sprint out some exaggerated slope just based on a few days of sentiment is, frankly, unrealistic.
If I were you—I mean, if it were me—I’d rather keep watching these kinds of coins that aren’t overly hyped, but where the money hasn’t left, and take them in slowly.
If you can’t hold up, don’t board. Anyway, I’m speaking from experience that I’ve already lost money from.
$GOOGL #US Stocks
I might be wrong too. I’m just making my own judgment.
48
·
--
On this consumer electronics line, I’ve been finding it more and more appealing lately.
It’s not that it’s going to suddenly become the most ferocious theme stock. It’s more like a big-cap that everyone actually uses, whose replacement cycle is slow and gradual—so when market sentiment isn’t that wildly excited, it can move more steadily. When rotation is fast, small caps can look different day to day. But when the funds really want something that can accommodate their position size, in the end they still circle back to a name like this.
$AAPL —right now I’m slightly bullish on it.
At first glance, it hasn’t looked overly dramatic today either. In the past 24 hours it’s up 1.83%, trading at $321.3, with a range of $315.26 to $322.48. But oddly, I actually like this kind of price action. It doesn’t feel like a stock that shoots straight up and lights people’s emotions on fire. It feels more like someone is willing to keep picking it up slowly near the highs.
There’s also a detail that really hits my taste.
On Binance’s US stock perpetual futures, it ranks #12 on the upside gainers list and #21 on the trading volume list. In the last 24 hours, it has $44.92M USDT in turnover. The funding rate is still +0.0000%, and the open interest is 59,783 contracts. This vibe clearly isn’t the kind of market where longs are piling into the same side and getting overheated. Yes, the heat is there, but the sentiment hasn’t spun out of control. Anyone who’s done futures knows: the worst is when a bunch of people crowd into the same direction, and then one last needle takes you out.
I’m bullish on it—not just based on the chart.
The strongest part of a company like this is that its brand, ecosystem, and user habits are tied together extremely deeply. You can dislike that it’s expensive, or complain that it doesn’t bring surprises. But when consumption picks back up and capital wants certainty, the market always seems to bring its attention back to companies like this—ones that can keep selling products consistently and also integrate services and hardware into a single loop. To put it simply: a lot of tech stocks are fueled by stories, while $AAPL is built on long-term habits.
Of course, it’s not blind optimism.
With a stock of this size, it’s hard to surge like a small-cap. If the market suddenly switches back to high-volatility theme plays, it may end up looking a bit dull. Also, the price is already sitting close to the 24-hour high. If you chase too aggressively, the short term can also easily turn into a roller coaster.
If it were me, I’d keep standing on the slightly bullish side—but I’d rather wait until it pulls back and stabilizes. If you can’t handle volatility, don’t force it. Honestly, I’m the kind of stubborn-mouth, scared-hand person—there have been plenty of losses for me from chasing highs.
$AAPL #USstocks
These are my thoughts. Your money—your call.
On this consumer electronics line, I’ve been finding it more and more appealing lately.
It’s not that it’s going to suddenly become the most ferocious theme stock. It’s more like a big-cap that everyone actually uses, whose replacement cycle is slow and gradual—so when market sentiment isn’t that wildly excited, it can move more steadily. When rotation is fast, small caps can look different day to day. But when the funds really want something that can accommodate their position size, in the end they still circle back to a name like this.
$AAPL —right now I’m slightly bullish on it.
At first glance, it hasn’t looked overly dramatic today either. In the past 24 hours it’s up 1.83%, trading at $321.3, with a range of $315.26 to $322.48. But oddly, I actually like this kind of price action. It doesn’t feel like a stock that shoots straight up and lights people’s emotions on fire. It feels more like someone is willing to keep picking it up slowly near the highs.
There’s also a detail that really hits my taste.
On Binance’s US stock perpetual futures, it ranks #12 on the upside gainers list and #21 on the trading volume list. In the last 24 hours, it has $44.92M USDT in turnover. The funding rate is still +0.0000%, and the open interest is 59,783 contracts. This vibe clearly isn’t the kind of market where longs are piling into the same side and getting overheated. Yes, the heat is there, but the sentiment hasn’t spun out of control. Anyone who’s done futures knows: the worst is when a bunch of people crowd into the same direction, and then one last needle takes you out.
I’m bullish on it—not just based on the chart.
The strongest part of a company like this is that its brand, ecosystem, and user habits are tied together extremely deeply. You can dislike that it’s expensive, or complain that it doesn’t bring surprises. But when consumption picks back up and capital wants certainty, the market always seems to bring its attention back to companies like this—ones that can keep selling products consistently and also integrate services and hardware into a single loop. To put it simply: a lot of tech stocks are fueled by stories, while $AAPL is built on long-term habits.
Of course, it’s not blind optimism.
With a stock of this size, it’s hard to surge like a small-cap. If the market suddenly switches back to high-volatility theme plays, it may end up looking a bit dull. Also, the price is already sitting close to the 24-hour high. If you chase too aggressively, the short term can also easily turn into a roller coaster.
If it were me, I’d keep standing on the slightly bullish side—but I’d rather wait until it pulls back and stabilizes. If you can’t handle volatility, don’t force it. Honestly, I’m the kind of stubborn-mouth, scared-hand person—there have been plenty of losses for me from chasing highs.
$AAPL #USstocks
These are my thoughts. Your money—your call.
It’s not that it’s going to suddenly become the most ferocious theme stock. It’s more like a big-cap that everyone actually uses, whose replacement cycle is slow and gradual—so when market sentiment isn’t that wildly excited, it can move more steadily. When rotation is fast, small caps can look different day to day. But when the funds really want something that can accommodate their position size, in the end they still circle back to a name like this.
$AAPL —right now I’m slightly bullish on it.
At first glance, it hasn’t looked overly dramatic today either. In the past 24 hours it’s up 1.83%, trading at $321.3, with a range of $315.26 to $322.48. But oddly, I actually like this kind of price action. It doesn’t feel like a stock that shoots straight up and lights people’s emotions on fire. It feels more like someone is willing to keep picking it up slowly near the highs.
There’s also a detail that really hits my taste.
On Binance’s US stock perpetual futures, it ranks #12 on the upside gainers list and #21 on the trading volume list. In the last 24 hours, it has $44.92M USDT in turnover. The funding rate is still +0.0000%, and the open interest is 59,783 contracts. This vibe clearly isn’t the kind of market where longs are piling into the same side and getting overheated. Yes, the heat is there, but the sentiment hasn’t spun out of control. Anyone who’s done futures knows: the worst is when a bunch of people crowd into the same direction, and then one last needle takes you out.
I’m bullish on it—not just based on the chart.
The strongest part of a company like this is that its brand, ecosystem, and user habits are tied together extremely deeply. You can dislike that it’s expensive, or complain that it doesn’t bring surprises. But when consumption picks back up and capital wants certainty, the market always seems to bring its attention back to companies like this—ones that can keep selling products consistently and also integrate services and hardware into a single loop. To put it simply: a lot of tech stocks are fueled by stories, while $AAPL is built on long-term habits.
Of course, it’s not blind optimism.
With a stock of this size, it’s hard to surge like a small-cap. If the market suddenly switches back to high-volatility theme plays, it may end up looking a bit dull. Also, the price is already sitting close to the 24-hour high. If you chase too aggressively, the short term can also easily turn into a roller coaster.
If it were me, I’d keep standing on the slightly bullish side—but I’d rather wait until it pulls back and stabilizes. If you can’t handle volatility, don’t force it. Honestly, I’m the kind of stubborn-mouth, scared-hand person—there have been plenty of losses for me from chasing highs.
$AAPL #USstocks
These are my thoughts. Your money—your call.
1
42
·
--
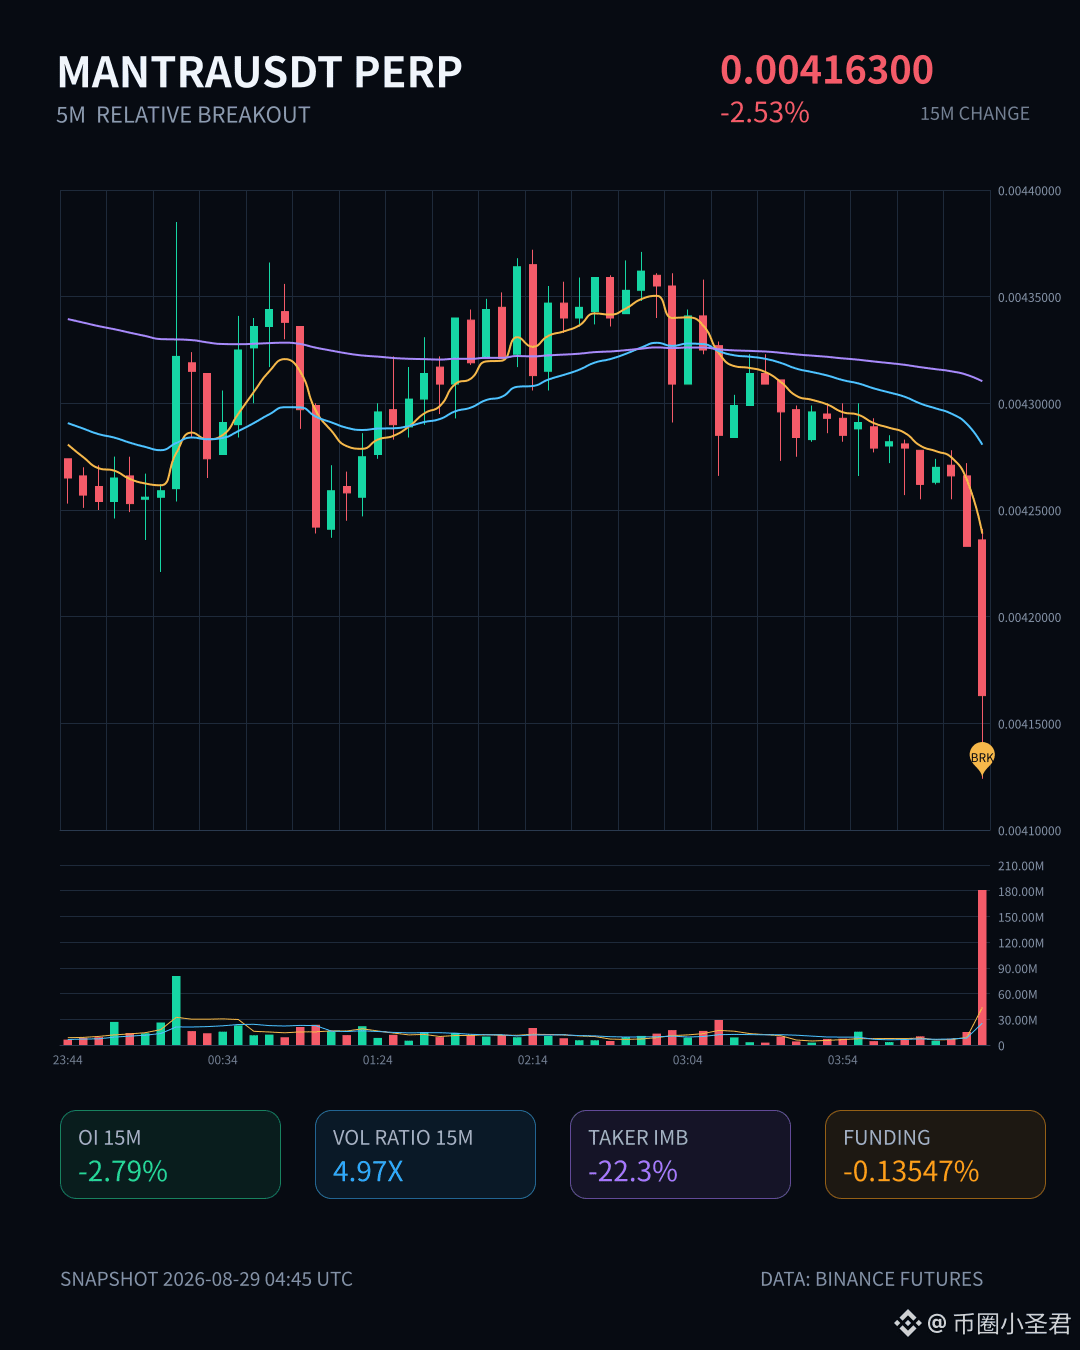
$MANTRA This sell-off is clean and decisive.
In just 15 minutes, it’s down -2.53%, with volume up to 4.97x, and the volatility Z reaching 3.36—this is a classic “high-volume breakdown” move. The key point is that OI also dropped a lot: 15m -2.79%, with nominal change -199K. This combination looks more like longs being forced to cut positions rather than new shorts rushing in to hammer the market.
The active trade spread is -22.3%, the buy/sell ratio is 0.64, and the closing price also confirms it has broken below the lower bound of the last ~20 consecutive 5m K-bars. The funding rate is still in a high percentile, which suggests the people who were long are now very uncomfortable.
The order book data is also not simple: the abnormality level in the whole pool ranks #6, and the nominal change ranks #21—neither is a small move. Moreover, this abnormal percentile is 95.6%, which puts it in a very extreme range recently.
Honestly, this setup—“high volume down + OI contraction + funding rate high”—looks more like leverage clearing than a genuine trend reversal. But the chart still has some things hanging in the air. Don’t rush to bottom-fish; first see whether it can hold the prior support zone.
$MANTRA This sell-off is clean and decisive.
In just 15 minutes, it’s down -2.53%, with volume up to 4.97x, and the volatility Z reaching 3.36—this is a classic “high-volume breakdown” move. The key point is that OI also dropped a lot: 15m -2.79%, with nominal change -199K. This combination looks more like longs being forced to cut positions rather than new shorts rushing in to hammer the market.
The active trade spread is -22.3%, the buy/sell ratio is 0.64, and the closing price also confirms it has broken below the lower bound of the last ~20 consecutive 5m K-bars. The funding rate is still in a high percentile, which suggests the people who were long are now very uncomfortable.
The order book data is also not simple: the abnormality level in the whole pool ranks #6, and the nominal change ranks #21—neither is a small move. Moreover, this abnormal percentile is 95.6%, which puts it in a very extreme range recently.
Honestly, this setup—“high volume down + OI contraction + funding rate high”—looks more like leverage clearing than a genuine trend reversal. But the chart still has some things hanging in the air. Don’t rush to bottom-fish; first see whether it can hold the prior support zone.
In just 15 minutes, it’s down -2.53%, with volume up to 4.97x, and the volatility Z reaching 3.36—this is a classic “high-volume breakdown” move. The key point is that OI also dropped a lot: 15m -2.79%, with nominal change -199K. This combination looks more like longs being forced to cut positions rather than new shorts rushing in to hammer the market.
The active trade spread is -22.3%, the buy/sell ratio is 0.64, and the closing price also confirms it has broken below the lower bound of the last ~20 consecutive 5m K-bars. The funding rate is still in a high percentile, which suggests the people who were long are now very uncomfortable.
The order book data is also not simple: the abnormality level in the whole pool ranks #6, and the nominal change ranks #21—neither is a small move. Moreover, this abnormal percentile is 95.6%, which puts it in a very extreme range recently.
Honestly, this setup—“high volume down + OI contraction + funding rate high”—looks more like leverage clearing than a genuine trend reversal. But the chart still has some things hanging in the air. Don’t rush to bottom-fish; first see whether it can hold the prior support zone.
14

·
--
🎓 Every day a coin — understand the market, don’t just buy and done
Today: Bitcoin Cash ($BCH) — #21 at market value
🏗️ It split from Bitcoin in 2017 over block-size disagreements—raising transaction capacity so it could become a cheap daily electronic cash.
💪 Truly low fees + a community that believes in daily electronic cash.
⚠️ Lost the battle for liquidity and adoption to the original Bitcoin by a huge margin.
📊 Price: $269.01 · Market cap: $5.4 billion
7 days: +31.6% · 30 days: +26.6%
📈 Resistances: $354.66 | Supports: $204.58 · $199.88
(Historical stopping zones from 90-day candles — not targets or recommendations)
What caught your attention most in Bitcoin Cash? Share your opinion 👇 $BCH
💛 Join Abu Malk’s team: register on Binance with code ABOMALAK — permanent discount on trading fees and benefit from our services and offers
#21 #BCH #Altcoins
⚠️ Educational content — not investment advice
🎓 Every day a coin — understand the market, don’t just buy and done
Today: Bitcoin Cash ($BCH ) — #21 at market value
🏗️ It split from Bitcoin in 2017 over block-size disagreements—raising transaction capacity so it could become a cheap daily electronic cash.
💪 Truly low fees + a community that believes in daily electronic cash.
⚠️ Lost the battle for liquidity and adoption to the original Bitcoin by a huge margin.
📊 Price: $269.01 · Market cap: $5.4 billion
7 days: +31.6% · 30 days: +26.6%
📈 Resistances: $354.66 | Supports: $204.58 · $199.88
(Historical stopping zones from 90-day candles — not targets or recommendations)
What caught your attention most in Bitcoin Cash? Share your opinion 👇 $BCH
💛 Join Abu Malk’s team: register on Binance with code ABOMALAK — permanent discount on trading fees and benefit from our services and offers
#21 #BCH #Altcoins
⚠️ Educational content — not investment advice
Today: Bitcoin Cash ($BCH ) — #21 at market value
🏗️ It split from Bitcoin in 2017 over block-size disagreements—raising transaction capacity so it could become a cheap daily electronic cash.
💪 Truly low fees + a community that believes in daily electronic cash.
⚠️ Lost the battle for liquidity and adoption to the original Bitcoin by a huge margin.
📊 Price: $269.01 · Market cap: $5.4 billion
7 days: +31.6% · 30 days: +26.6%
📈 Resistances: $354.66 | Supports: $204.58 · $199.88
(Historical stopping zones from 90-day candles — not targets or recommendations)
What caught your attention most in Bitcoin Cash? Share your opinion 👇 $BCH
💛 Join Abu Malk’s team: register on Binance with code ABOMALAK — permanent discount on trading fees and benefit from our services and offers
#21 #BCH #Altcoins
⚠️ Educational content — not investment advice

1
596

·
--
$ONDO This 15-minute move has some substance.
The volume of liquidity was directly pulled to 3.46x, and the price conveniently broke through the upper bound of the range on the past ~20 five-minute K-lines. OI is also increasing; the notional change is ranked #21 in the whole pool. This structure—“price rising + leveraged longs entering”—is sturdier than simply expanding volume. The funding rate is also in a high percentile recently, suggesting market sentiment is hot, but not to the point where FOMO has completely run wild.
On the data side, the abnormality level of the whole pool is #24, and it has been continuing for several consecutive cycles—not a one-off pulse buy/sell. Active trading spread is down 8.3%, and the buy/sell ratio is 1.18. The longs are really doing the work. How much it can rise is hard to say, but if this kind of persistence holds, don’t rush to get off.
Just keep an eye on the volume/flow: if it shrinks, run.
$ONDO This 15-minute move has some substance.
The volume of liquidity was directly pulled to 3.46x, and the price conveniently broke through the upper bound of the range on the past ~20 five-minute K-lines. OI is also increasing; the notional change is ranked #21 in the whole pool. This structure—“price rising + leveraged longs entering”—is sturdier than simply expanding volume. The funding rate is also in a high percentile recently, suggesting market sentiment is hot, but not to the point where FOMO has completely run wild.
On the data side, the abnormality level of the whole pool is #24, and it has been continuing for several consecutive cycles—not a one-off pulse buy/sell. Active trading spread is down 8.3%, and the buy/sell ratio is 1.18. The longs are really doing the work. How much it can rise is hard to say, but if this kind of persistence holds, don’t rush to get off.
Just keep an eye on the volume/flow: if it shrinks, run.
The volume of liquidity was directly pulled to 3.46x, and the price conveniently broke through the upper bound of the range on the past ~20 five-minute K-lines. OI is also increasing; the notional change is ranked #21 in the whole pool. This structure—“price rising + leveraged longs entering”—is sturdier than simply expanding volume. The funding rate is also in a high percentile recently, suggesting market sentiment is hot, but not to the point where FOMO has completely run wild.
On the data side, the abnormality level of the whole pool is #24, and it has been continuing for several consecutive cycles—not a one-off pulse buy/sell. Active trading spread is down 8.3%, and the buy/sell ratio is 1.18. The longs are really doing the work. How much it can rise is hard to say, but if this kind of persistence holds, don’t rush to get off.
Just keep an eye on the volume/flow: if it shrinks, run.
34
·
--
$HYPE This downward breakout is kind of interesting.
In the last 15 minutes, it’s down 1.1%. Volume surged straight to 2.76x, and the price has also broken through the lower bound of the recent 20 five-minute K-bars. But what’s interesting is that during the drop, contract OI is still only slightly up—shorts are adding positions, yet the notional value is shrinking. In plain terms: this is new leveraged shorting that’s being used to slam the price, not a cascading liquidation.
Aggressive trades are down 31.7%, and the buy/sell ratio is 0.52—selling pressure direction is very clear. The anomaly level across the whole pool ranks at #21, and the change in notional value is even in the top three. The move by the funds on HYPE isn’t something retail investors can stir up.
Don’t rush to bottom-fish. If the shorts are actively adding and breaking support, this kind of decline usually has momentum. Unless you clearly see aggressive buying returning, don’t be the contrarian. $HYPE
$HYPE This downward breakout is kind of interesting.
In the last 15 minutes, it’s down 1.1%. Volume surged straight to 2.76x, and the price has also broken through the lower bound of the recent 20 five-minute K-bars. But what’s interesting is that during the drop, contract OI is still only slightly up—shorts are adding positions, yet the notional value is shrinking. In plain terms: this is new leveraged shorting that’s being used to slam the price, not a cascading liquidation.
Aggressive trades are down 31.7%, and the buy/sell ratio is 0.52—selling pressure direction is very clear. The anomaly level across the whole pool ranks at #21, and the change in notional value is even in the top three. The move by the funds on HYPE isn’t something retail investors can stir up.
Don’t rush to bottom-fish. If the shorts are actively adding and breaking support, this kind of decline usually has momentum. Unless you clearly see aggressive buying returning, don’t be the contrarian. $HYPE
In the last 15 minutes, it’s down 1.1%. Volume surged straight to 2.76x, and the price has also broken through the lower bound of the recent 20 five-minute K-bars. But what’s interesting is that during the drop, contract OI is still only slightly up—shorts are adding positions, yet the notional value is shrinking. In plain terms: this is new leveraged shorting that’s being used to slam the price, not a cascading liquidation.
Aggressive trades are down 31.7%, and the buy/sell ratio is 0.52—selling pressure direction is very clear. The anomaly level across the whole pool ranks at #21, and the change in notional value is even in the top three. The move by the funds on HYPE isn’t something retail investors can stir up.
Don’t rush to bottom-fish. If the shorts are actively adding and breaking support, this kind of decline usually has momentum. Unless you clearly see aggressive buying returning, don’t be the contrarian. $HYPE
26
·
--
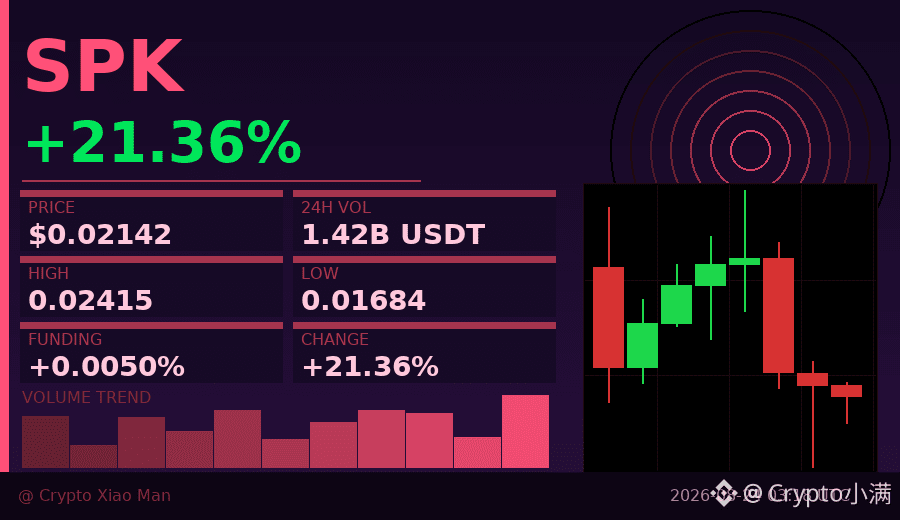
I just took a look at the trend of $SPK —it’s kind of interesting.
Today’s high hit 0.02415, and the gain briefly exceeded 21%, but now it has clearly pulled back from the peak. Three consecutive hourly candlesticks have closed bearish, and the price has shrunk to around 0.0214.
Right now, bulls and bears are almost a 50/50 split—bulls 50.4%, bears 49.6%—and there’s no clear direction consensus. At times like this, things are often the most dangerous, because once either side starts concentrating stop-losses, the price can jump around quickly.
What’s interesting is that the funding rate is only 0.005%, which is very low. This suggests that leveraged longs aren’t rushing in wildly, and chasing higher prices is still fairly restrained. With such a big move up, there hasn’t been any obvious buildup of leverage—in fact, it’s a relatively healthy signal.
However, the drop from the peak is already nearly 12%. If you chased in today, you may already feel the pressure. In the short term, after three straight bearish candles, we need to watch whether it can stabilize. If volume doesn’t keep up, it wouldn’t be surprising to see further probing downward.
Everyone can pay attention to whether the 0.020–0.021 range can hold up; if it breaks, there may be another period of consolidation/adjustment in the short run.
$SPK #加密行情 #21% surge and then pullback
Click the small card below to quickly check the market👇
I just took a look at the trend of $SPK —it’s kind of interesting.
Today’s high hit 0.02415, and the gain briefly exceeded 21%, but now it has clearly pulled back from the peak. Three consecutive hourly candlesticks have closed bearish, and the price has shrunk to around 0.0214.
Right now, bulls and bears are almost a 50/50 split—bulls 50.4%, bears 49.6%—and there’s no clear direction consensus. At times like this, things are often the most dangerous, because once either side starts concentrating stop-losses, the price can jump around quickly.
What’s interesting is that the funding rate is only 0.005%, which is very low. This suggests that leveraged longs aren’t rushing in wildly, and chasing higher prices is still fairly restrained. With such a big move up, there hasn’t been any obvious buildup of leverage—in fact, it’s a relatively healthy signal.
However, the drop from the peak is already nearly 12%. If you chased in today, you may already feel the pressure. In the short term, after three straight bearish candles, we need to watch whether it can stabilize. If volume doesn’t keep up, it wouldn’t be surprising to see further probing downward.
Everyone can pay attention to whether the 0.020–0.021 range can hold up; if it breaks, there may be another period of consolidation/adjustment in the short run.
$SPK #加密行情 #21% surge and then pullback
Click the small card below to quickly check the market👇
Today’s high hit 0.02415, and the gain briefly exceeded 21%, but now it has clearly pulled back from the peak. Three consecutive hourly candlesticks have closed bearish, and the price has shrunk to around 0.0214.
Right now, bulls and bears are almost a 50/50 split—bulls 50.4%, bears 49.6%—and there’s no clear direction consensus. At times like this, things are often the most dangerous, because once either side starts concentrating stop-losses, the price can jump around quickly.
What’s interesting is that the funding rate is only 0.005%, which is very low. This suggests that leveraged longs aren’t rushing in wildly, and chasing higher prices is still fairly restrained. With such a big move up, there hasn’t been any obvious buildup of leverage—in fact, it’s a relatively healthy signal.
However, the drop from the peak is already nearly 12%. If you chased in today, you may already feel the pressure. In the short term, after three straight bearish candles, we need to watch whether it can stabilize. If volume doesn’t keep up, it wouldn’t be surprising to see further probing downward.
Everyone can pay attention to whether the 0.020–0.021 range can hold up; if it breaks, there may be another period of consolidation/adjustment in the short run.
$SPK #加密行情 #21% surge and then pullback
Click the small card below to quickly check the market👇
55

·
--
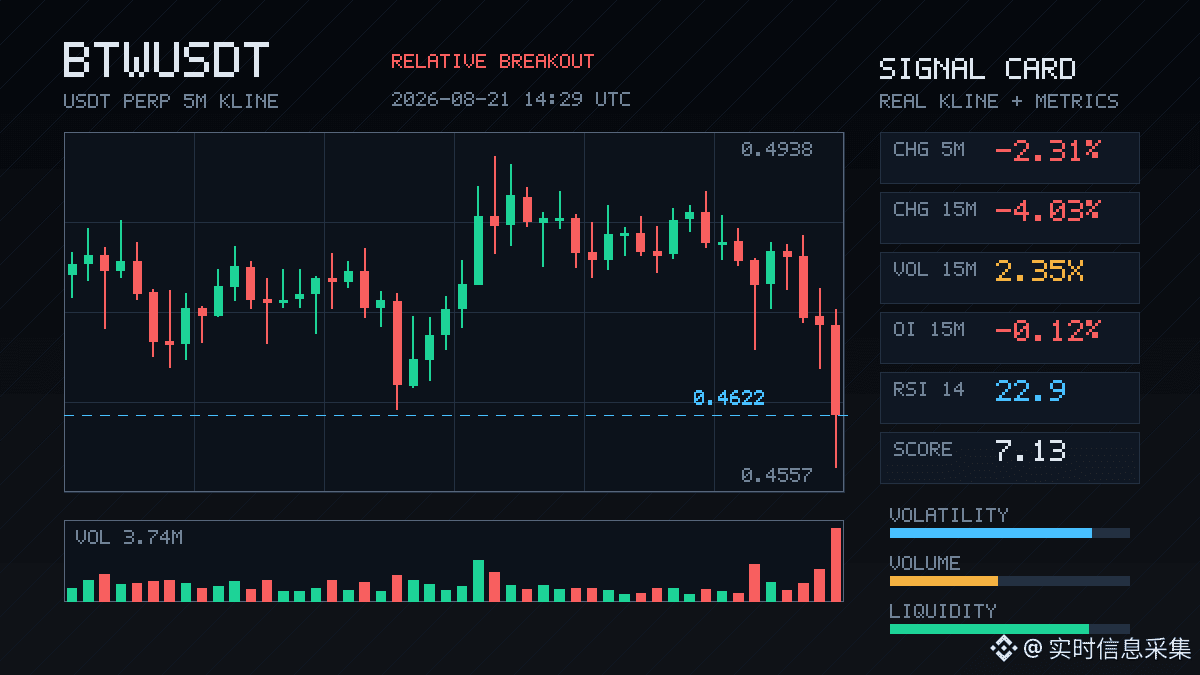
$BTW In this 15-minute move, it dropped directly by -4%. The volume increased to 2.35x, the volatility z-score is 3.36—this is a typical volume-spike dumping/hammering.
What’s interesting is that the contract open interest didn’t really move much (both 15m and 1h only fell slightly by 0.12%), but the notional value was instantly cut by nearly 4 million U. This indicates active profit-taking/stop-loss exits—not the opening of new short positions. The active trade imbalance is -6.7%, and the sell pressure is clear.
The closing price smashed through the lows of nearly 20 consecutive 5-minute K-lines. The whole pool’s abnormal ranking is #21, and the notional change surged to #3. This kind of volume-price divergence actually carries more signaling value than a simple straight selloff.
After clearing the leverage, the short-term upside elasticity may even increase. Keep an eye on whether the volume after this dump starts to contract—if it does, there may be a repair/rebound. Over the next 24h, there’s still about 300 million in turnover propping things up; the market isn’t dead—the key is that the sentiment needs to be washed out first.
$BTW In this 15-minute move, it dropped directly by -4%. The volume increased to 2.35x, the volatility z-score is 3.36—this is a typical volume-spike dumping/hammering.
What’s interesting is that the contract open interest didn’t really move much (both 15m and 1h only fell slightly by 0.12%), but the notional value was instantly cut by nearly 4 million U. This indicates active profit-taking/stop-loss exits—not the opening of new short positions. The active trade imbalance is -6.7%, and the sell pressure is clear.
The closing price smashed through the lows of nearly 20 consecutive 5-minute K-lines. The whole pool’s abnormal ranking is #21, and the notional change surged to #3. This kind of volume-price divergence actually carries more signaling value than a simple straight selloff.
After clearing the leverage, the short-term upside elasticity may even increase. Keep an eye on whether the volume after this dump starts to contract—if it does, there may be a repair/rebound. Over the next 24h, there’s still about 300 million in turnover propping things up; the market isn’t dead—the key is that the sentiment needs to be washed out first.
What’s interesting is that the contract open interest didn’t really move much (both 15m and 1h only fell slightly by 0.12%), but the notional value was instantly cut by nearly 4 million U. This indicates active profit-taking/stop-loss exits—not the opening of new short positions. The active trade imbalance is -6.7%, and the sell pressure is clear.
The closing price smashed through the lows of nearly 20 consecutive 5-minute K-lines. The whole pool’s abnormal ranking is #21, and the notional change surged to #3. This kind of volume-price divergence actually carries more signaling value than a simple straight selloff.
After clearing the leverage, the short-term upside elasticity may even increase. Keep an eye on whether the volume after this dump starts to contract—if it does, there may be a repair/rebound. Over the next 24h, there’s still about 300 million in turnover propping things up; the market isn’t dead—the key is that the sentiment needs to be washed out first.
80
Log in to explore more content
Join global crypto users on Binance Square
⚡️ Get latest and useful information about crypto.
💬 Trusted by the world’s largest crypto exchange.
👍 Discover real insights from verified creators.
Email / Phone number
Trending Topics
1
#AppleDebutsFoldablePhone
21,058 views
433 Discussing
2
#IranSaysReadyToEscalateWarWithUS
1,071 views
54 Discussing
3
#EUExtendsCentralContactPointToCASPs
5,167 views
155 Discussing
4
#US10YTreasuryYieldHitsHighestSinceNov2023
22,674 views
373 Discussing
5
#USTreasuryToBuyBackUpTo$6BLongDatedDebt
15,948 views
161 Discussing
6
#BitcoinSurpasses$79K
65,458 views
276 Discussing
7
#BrentCrudeTops$100
122,532 views
399 Discussing
8
#USADPWeeklyEmploymentRises12000
106,134 views
1,274 Discussing
9
#BankOfAmericaGroupPilotsUSBDCStablecoin
77,540 views
1,020 Discussing
10
#RippleLobbiesToAdvanceCLARITYActVote
113,026 views
1,295 Discussing