

Crypto Signals and Analysis
61 Beiträge
Crypto Signals and Analysis
Melden
Nutzer blockieren
Crypto trading signals and market analysis. We identify key levels, clear entry points, and defined targets with a disciplined focus on risk management.
Trade eröffnen
Regelmäßiger Trader
3.4 Jahre
2 Following
37 Follower
55 Like gegeben
Beiträge
Portfolio
·
--
Bärisch
Übersetzung ansehen
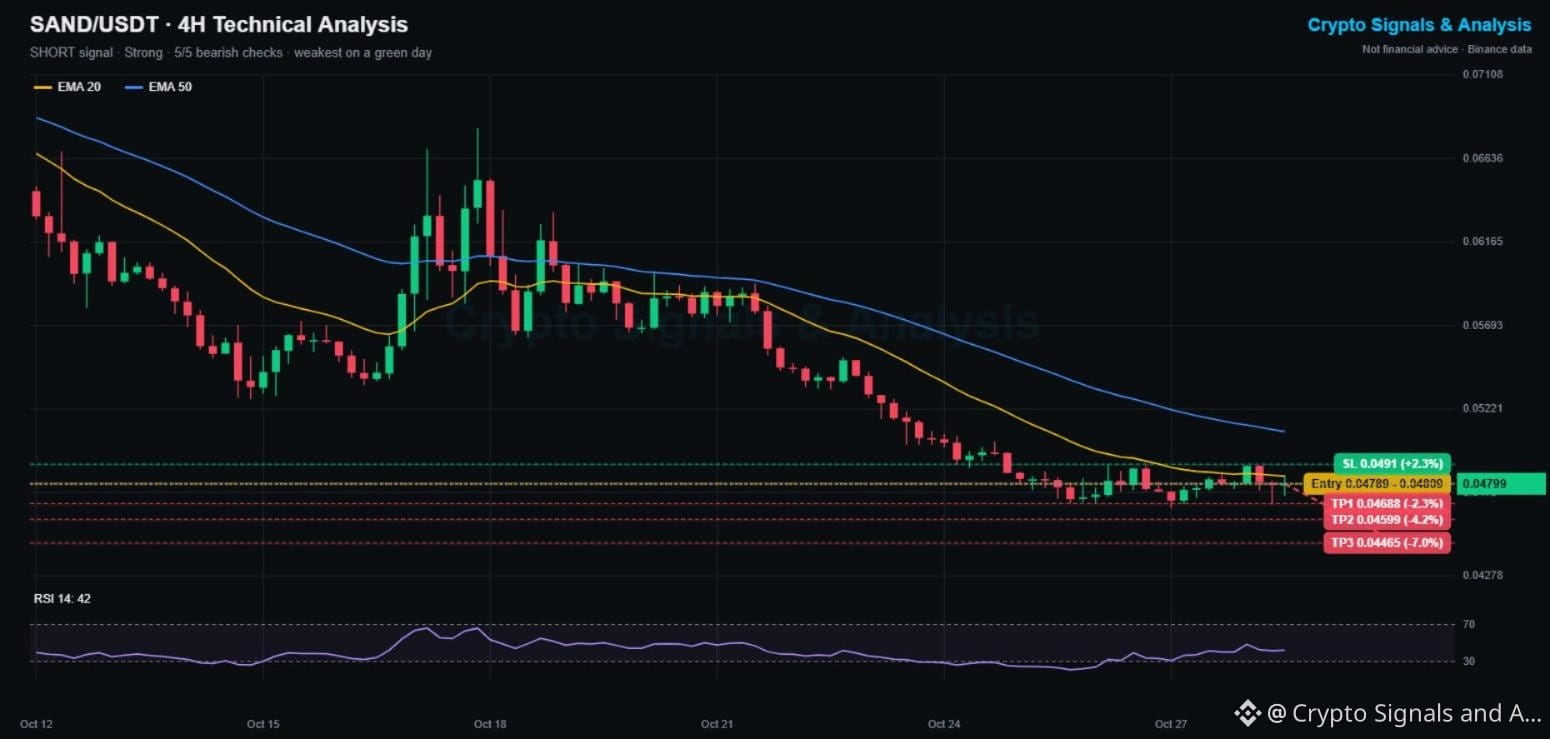
$SAND Price Prediction Today (Oct 28, Night Update): The Sandbox Crypto Signal & Technical Analysis 📊
🔴 SHORT | Entry 0.04789 - 0.04809 | TP1 0.04688 | SL 0.0491
👉 Tap $SAND to place your trade fast
🕒 Updated: Oct 28, 21:45 UTC · price 0.04799
While most altcoins are green tonight, The Sandbox is red (-0.5%) and down 16.9% this week. It has slid from 0.068 on Oct 18 to a fresh low at 0.04662 and still can't hold above its 4H EMA20.
📌 THE SANDBOX TRADING SIGNAL (Strong, 5/5 signals agree)
Entry: 0.04789 - 0.04809
Take profit 1: 0.04688 (-2.3%)
Take profit 2: 0.04599 (-4.2%)
Take profit 3: 0.04465 (-7.0%)
Stop loss: 0.0491 (+2.3%)
📊 SAND TECHNICAL ANALYSIS (4H CHART)
Price is below the EMA20 (0.04842) and EMA50 (0.05094), both sloping down. RSI 42. Price has gone sideways near the lows for 3 days, so this is a tight-stop trade: a break of 0.04662 is what sends it lower.
🔑 KEY LEVELS
Support: 0.04662, then 0.0446
Resistance: 0.04842 (EMA20), then 0.0491
📉 Bearish scenario: a 4H close under 0.04662 opens TP2 and TP3.
📈 Bullish scenario: a close above 0.0491 cancels this signal and points to the EMA50 near 0.051.
💡 Bottom line: trend is down, but the range is tight. Small size, strict stop.
👉 Tap $SAND
to open the live chart. NFA
🔥 TRADE WITH LOWER FEES
✅ Get a 10% kickback on your Binance Futures trading fees
👇👇👇
{spot}(SANDUSDT)
[Claim your 10% Futures fee kickback here](https://www.binance.com/join?ref=SQUAREGINOS)
━━━━━━━━━━
Are metaverse coins done, or is this the bottom zone? 👇
Follow Crypto Signals and Analysis for daily signals.
#cryptosignals #SAND #FOMCWatch
⚠️ Crypto is volatile: risk only what you can afford to lose.
$SAND Price Prediction Today (Oct 28, Night Update): The Sandbox Crypto Signal & Technical Analysis 📊
🔴 SHORT | Entry 0.04789 - 0.04809 | TP1 0.04688 | SL 0.0491
👉 Tap $SAND to place your trade fast
🕒 Updated: Oct 28, 21:45 UTC · price 0.04799
While most altcoins are green tonight, The Sandbox is red (-0.5%) and down 16.9% this week. It has slid from 0.068 on Oct 18 to a fresh low at 0.04662 and still can't hold above its 4H EMA20.
📌 THE SANDBOX TRADING SIGNAL (Strong, 5/5 signals agree)
Entry: 0.04789 - 0.04809
Take profit 1: 0.04688 (-2.3%)
Take profit 2: 0.04599 (-4.2%)
Take profit 3: 0.04465 (-7.0%)
Stop loss: 0.0491 (+2.3%)
📊 SAND TECHNICAL ANALYSIS (4H CHART)
Price is below the EMA20 (0.04842) and EMA50 (0.05094), both sloping down. RSI 42. Price has gone sideways near the lows for 3 days, so this is a tight-stop trade: a break of 0.04662 is what sends it lower.
🔑 KEY LEVELS
Support: 0.04662, then 0.0446
Resistance: 0.04842 (EMA20), then 0.0491
📉 Bearish scenario: a 4H close under 0.04662 opens TP2 and TP3.
📈 Bullish scenario: a close above 0.0491 cancels this signal and points to the EMA50 near 0.051.
💡 Bottom line: trend is down, but the range is tight. Small size, strict stop.
👉 Tap $SAND
to open the live chart. NFA
🔥 TRADE WITH LOWER FEES
✅ Get a 10% kickback on your Binance Futures trading fees
👇👇👇
Claim your 10% Futures fee kickback here
━━━━━━━━━━
Are metaverse coins done, or is this the bottom zone? 👇
Follow Crypto Signals and Analysis for daily signals.
#cryptosignals #SAND #FOMCWatch
⚠️ Crypto is volatile: risk only what you can afford to lose.
3
·
--
Bullisch
Übersetzung ansehen
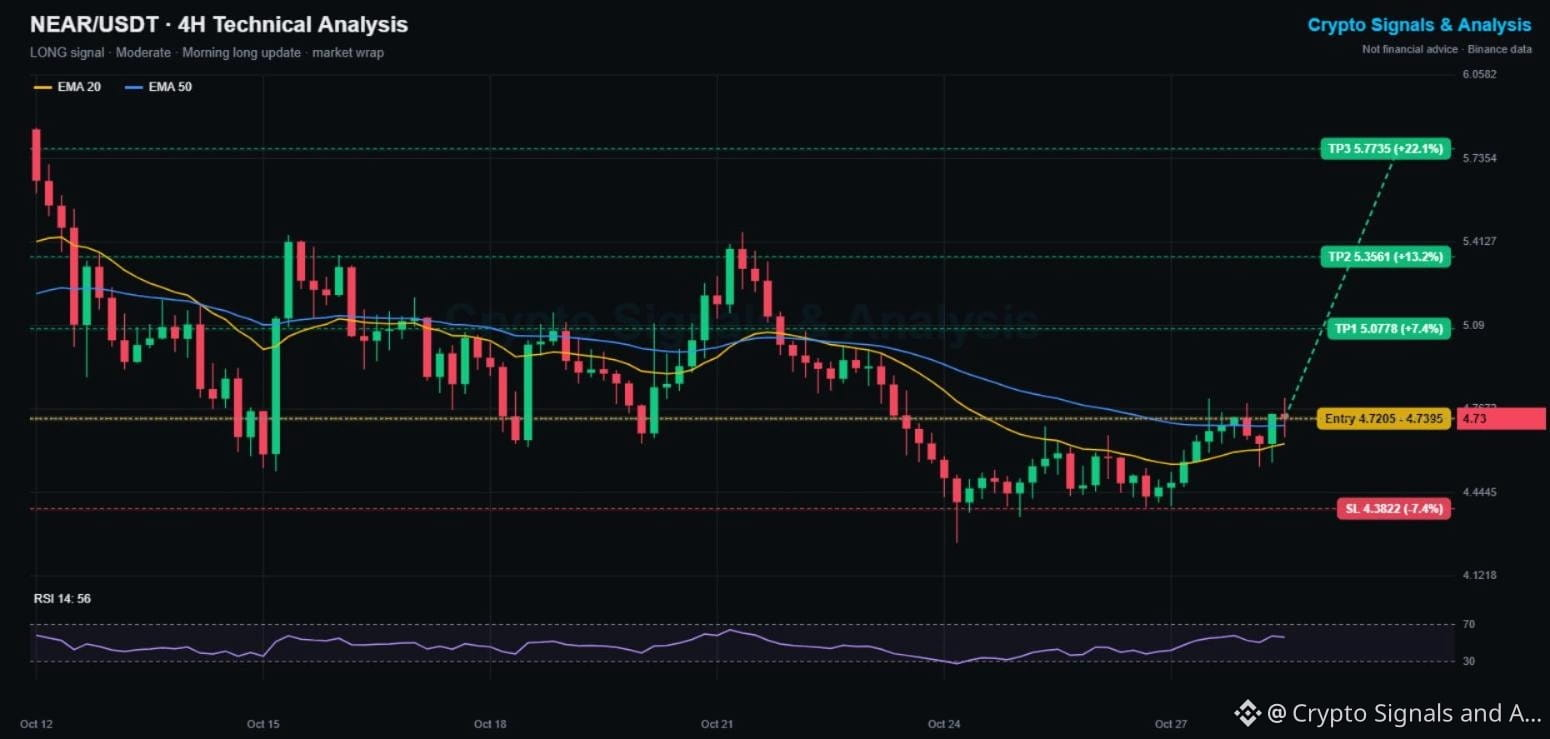
$NEAR Price Prediction Today (Oct 28, Night Update): 39 of 49 Top Coins Green After the Fed, NEAR Signal Update 📰
🟢 LONG | Entry 4.7205 - 4.7395 | TP1 5.0778 | SL 4.3822
👉 Tap $NEAR to place your trade fast
🕒 Updated: Oct 28, 21:30 UTC · price 4.73
📰 MARKET WRAP
The day after the Fed hold, 39 of the 49 most traded coins on Binance spot are green. Bitcoin is up 0.9% near 81,350 and Ethereum 1.0%. Initia (+22.8%) and PEPE (+12.9%) lead the gainers. NEAR Protocol is the 8th most traded coin today with about 85M USDT in volume.
⏳ MORNING NEAR SIGNAL UPDATE
This morning's long from 4.614 is still open and in profit (+2.5%). The high so far is 4.81, just short of TP1 at 4.882. The low was 4.544, well above the 4.346 stop.
📌 NEW NEAR SETUP (Moderate, 4/5 signals agree)
Entry: 4.7205 - 4.7395
Take profit 1: 5.0778 (+7.4%)
Take profit 2: 5.3561 (+13.2%)
Take profit 3: 5.7735 (+22.1%)
Stop loss: 4.3822 (-7.4%)
📊 4H CHART
Price is back above the EMA20 (4.633) and EMA50 (4.704), and the EMA20 is turning up. RSI 56. The weak spot: still down 10% on the week.
🔑 KEY LEVELS
Support: 4.70 (EMA50), then 4.39
Resistance: 4.81, then 5.08
💡 Bottom line: a 4H close above 4.81 confirms the breakout. Losing 4.70 means wait.
👉 Tap $NEAR
to open the live chart. NFA
🔥 TRADE WITH LOWER FEES
✅ Get a 10% kickback on your Binance Futures trading fees
👇👇👇
{spot}(NEARUSDT)
[Claim your 10% Futures fee kickback here](https://www.binance.com/join?ref=SQUAREGINOS)
━━━━━━━━━━
Is this a real altcoin recovery or just a relief bounce? 👇
Follow Crypto Signals and Analysis for daily signals.
#cryptosignals #NEAR #FOMCWatch
⚠️ Crypto is volatile: risk only what you can afford to lose.
$NEAR Price Prediction Today (Oct 28, Night Update): 39 of 49 Top Coins Green After the Fed, NEAR Signal Update 📰
🟢 LONG | Entry 4.7205 - 4.7395 | TP1 5.0778 | SL 4.3822
👉 Tap $NEAR to place your trade fast
🕒 Updated: Oct 28, 21:30 UTC · price 4.73
📰 MARKET WRAP
The day after the Fed hold, 39 of the 49 most traded coins on Binance spot are green. Bitcoin is up 0.9% near 81,350 and Ethereum 1.0%. Initia (+22.8%) and PEPE (+12.9%) lead the gainers. NEAR Protocol is the 8th most traded coin today with about 85M USDT in volume.
⏳ MORNING NEAR SIGNAL UPDATE
This morning's long from 4.614 is still open and in profit (+2.5%). The high so far is 4.81, just short of TP1 at 4.882. The low was 4.544, well above the 4.346 stop.
📌 NEW NEAR SETUP (Moderate, 4/5 signals agree)
Entry: 4.7205 - 4.7395
Take profit 1: 5.0778 (+7.4%)
Take profit 2: 5.3561 (+13.2%)
Take profit 3: 5.7735 (+22.1%)
Stop loss: 4.3822 (-7.4%)
📊 4H CHART
Price is back above the EMA20 (4.633) and EMA50 (4.704), and the EMA20 is turning up. RSI 56. The weak spot: still down 10% on the week.
🔑 KEY LEVELS
Support: 4.70 (EMA50), then 4.39
Resistance: 4.81, then 5.08
💡 Bottom line: a 4H close above 4.81 confirms the breakout. Losing 4.70 means wait.
👉 Tap $NEAR
to open the live chart. NFA
🔥 TRADE WITH LOWER FEES
✅ Get a 10% kickback on your Binance Futures trading fees
👇👇👇
Claim your 10% Futures fee kickback here
━━━━━━━━━━
Is this a real altcoin recovery or just a relief bounce? 👇
Follow Crypto Signals and Analysis for daily signals.
#cryptosignals #NEAR #FOMCWatch
⚠️ Crypto is volatile: risk only what you can afford to lose.
84
·
--
Bärisch
Übersetzung ansehen
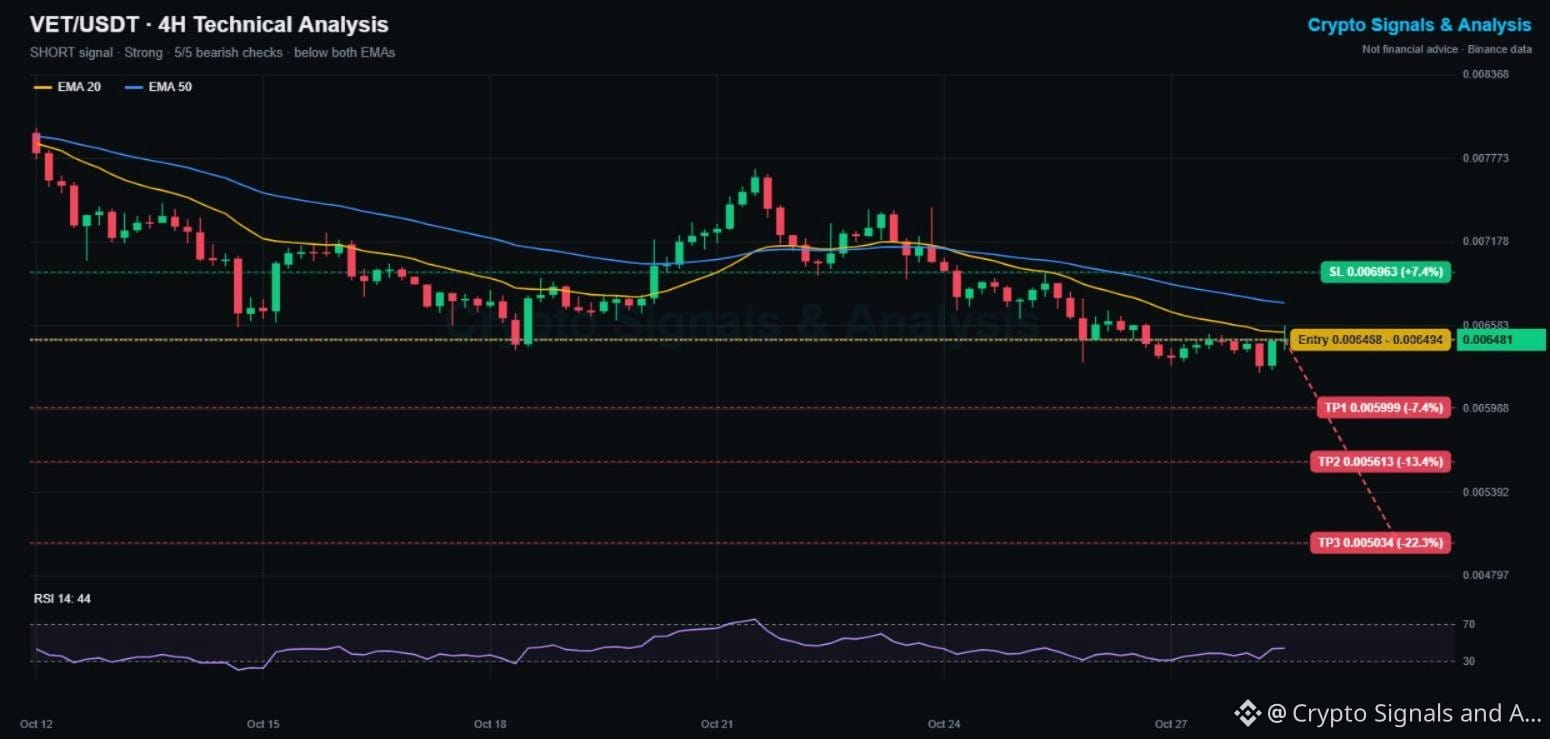
$VET Price Prediction Today (Oct 28, Evening Update): VeChain Crypto Signal & Technical Analysis 📊
🔴 SHORT | Entry 0.006468 - 0.006494 | TP1 0.005999 | SL 0.006963
👉 Tap $VET to place your trade fast
🕒 Updated: Oct 28, 21:10 UTC · price 0.006481
VeChain is down 15.2% this week and printed a fresh 2-week low at 0.006247 yesterday. Tonight's bounce is running straight into the falling 4H EMA20, the same line that has capped it since Oct 24.
📌 VECHAIN TRADING SIGNAL (Strong, 5/5 signals agree)
Entry: 0.006468 - 0.006494
Take profit 1: 0.005999 (-7.4%)
Take profit 2: 0.005613 (-13.4%)
Take profit 3: 0.005034 (-22.3%)
Stop loss: 0.006963 (+7.4%)
📊 VET TECHNICAL ANALYSIS (4H CHART)
Price is below the EMA20 (0.006534) and EMA50 (0.006743), both sloping down. RSI at 44 keeps sellers in control. Lower highs since the Oct 21 peak near 0.0078 define the trend.
🔑 KEY LEVELS
Support: 0.006247 (2-week low), then 0.0060
Resistance: 0.006534 (EMA20), then 0.006743
📉 Bearish scenario: losing 0.006247 opens TP1 near 0.0060.
📈 Bullish scenario: a 4H close above the EMA50 flips the bias. A close above 0.006963 cancels this signal.
💡 Bottom line: rejection at the EMA20 is the trigger. Wait for it, keep the stop.
👉 Tap $VET
to open the live chart. NFA
🔥 TRADE WITH LOWER FEES
✅ Get a 10% kickback on your Binance Futures trading fees
👇👇👇
{spot}(VETUSDT)
[Claim your 10% Futures fee kickback here](https://www.binance.com/join?ref=SQUAREGINOS)
━━━━━━━━━━
Does VeChain hold 0.006247 or break lower? 👇
Follow Crypto Signals and Analysis for daily signals.
#cryptosignals #VeChain #FOMCWatch
⚠️ Crypto is volatile: risk only what you can afford to lose.
$VET Price Prediction Today (Oct 28, Evening Update): VeChain Crypto Signal & Technical Analysis 📊
🔴 SHORT | Entry 0.006468 - 0.006494 | TP1 0.005999 | SL 0.006963
👉 Tap $VET to place your trade fast
🕒 Updated: Oct 28, 21:10 UTC · price 0.006481
VeChain is down 15.2% this week and printed a fresh 2-week low at 0.006247 yesterday. Tonight's bounce is running straight into the falling 4H EMA20, the same line that has capped it since Oct 24.
📌 VECHAIN TRADING SIGNAL (Strong, 5/5 signals agree)
Entry: 0.006468 - 0.006494
Take profit 1: 0.005999 (-7.4%)
Take profit 2: 0.005613 (-13.4%)
Take profit 3: 0.005034 (-22.3%)
Stop loss: 0.006963 (+7.4%)
📊 VET TECHNICAL ANALYSIS (4H CHART)
Price is below the EMA20 (0.006534) and EMA50 (0.006743), both sloping down. RSI at 44 keeps sellers in control. Lower highs since the Oct 21 peak near 0.0078 define the trend.
🔑 KEY LEVELS
Support: 0.006247 (2-week low), then 0.0060
Resistance: 0.006534 (EMA20), then 0.006743
📉 Bearish scenario: losing 0.006247 opens TP1 near 0.0060.
📈 Bullish scenario: a 4H close above the EMA50 flips the bias. A close above 0.006963 cancels this signal.
💡 Bottom line: rejection at the EMA20 is the trigger. Wait for it, keep the stop.
👉 Tap $VET
to open the live chart. NFA
🔥 TRADE WITH LOWER FEES
✅ Get a 10% kickback on your Binance Futures trading fees
👇👇👇
Claim your 10% Futures fee kickback here
━━━━━━━━━━
Does VeChain hold 0.006247 or break lower? 👇
Follow Crypto Signals and Analysis for daily signals.
#cryptosignals #VeChain #FOMCWatch
⚠️ Crypto is volatile: risk only what you can afford to lose.
6
·
--
Bullisch
Übersetzung ansehen
$TRUMP Price Prediction Today (Oct 28, Evening Update): Official Trump Crypto Signal & Technical Analysis 📊
🟢 LONG | Entry 1.7235 - 1.7305 | TP1 1.8382 | SL 1.6158
👉 Tap $TRUMP to place your trade fast
🕒 Updated: Oct 28, 20:52 UTC · price 1.727
Official Trump bounced off 1.618 (its lowest level in over two weeks) and just reclaimed both 4H moving averages. With memes leading tonight, this is its first real trend shift since Oct 22.
📌 OFFICIAL TRUMP TRADING SIGNAL (Moderate, 4/5 signals agree)
Entry: 1.7235 - 1.7305
Take profit 1: 1.8382 (+6.4%)
Take profit 2: 1.9271 (+11.6%)
Take profit 3: 2.0605 (+19.3%)
Stop loss: 1.6158 (-6.4%)
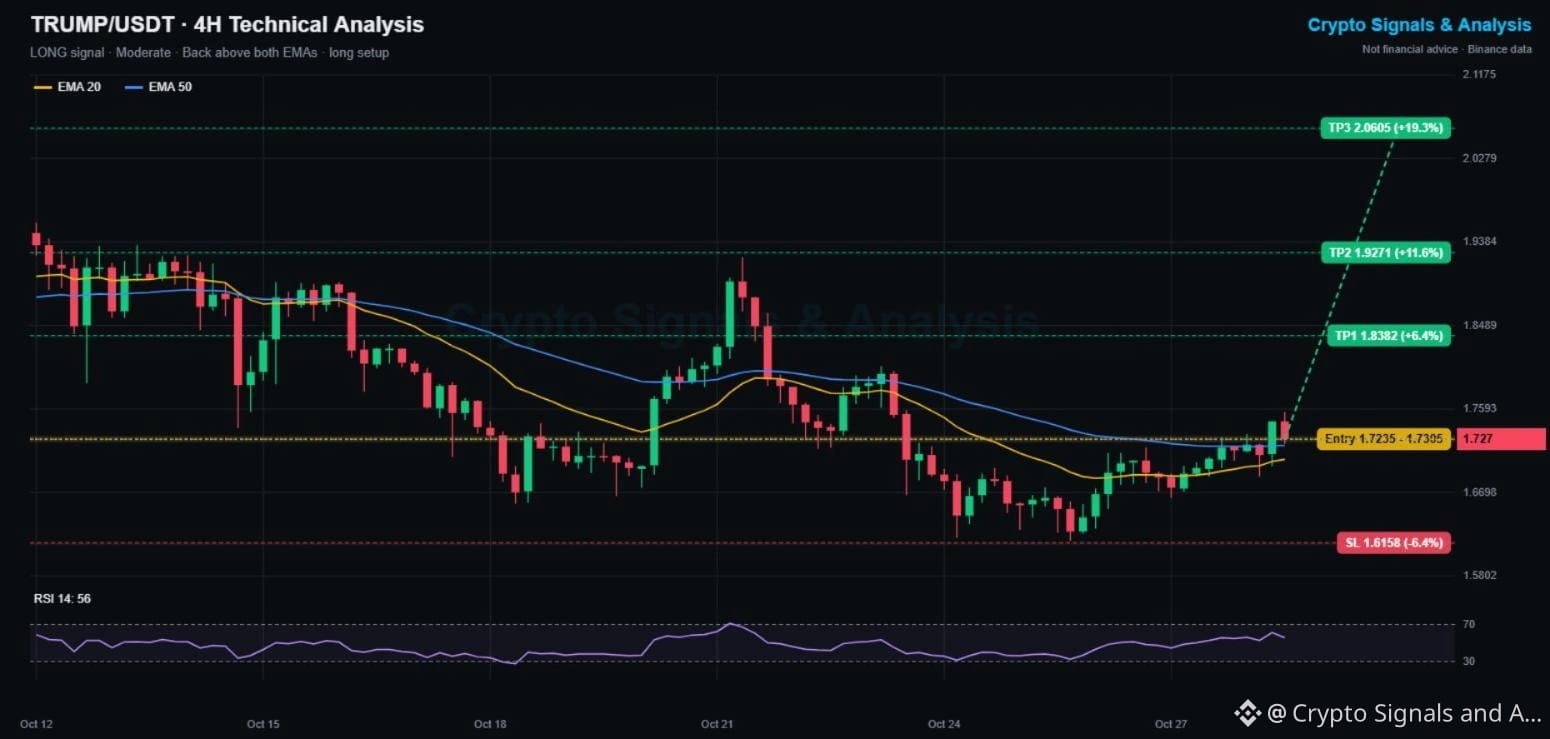
📊 TRUMP TECHNICAL ANALYSIS (4H CHART)
Price is above the EMA20 (1.705) and EMA50 (1.720), and the EMA20 has turned up. RSI at 56 favors buyers. The one bearish check: it is still down 6.5% on the week, so this is an early reversal, not a confirmed trend.
🔑 KEY LEVELS
Support: 1.705 (EMA20), then 1.618
Resistance: 1.756, then 1.84 and 1.93
📈 Bullish scenario: a 4H close above 1.756 opens TP1 at 1.838.
📉 Bearish scenario: losing 1.70 puts the 1.618 low back in play. A close under 1.6158 cancels this signal.
💡 Bottom line: good risk/reward off a fresh low, but size small until 1.756 breaks.
👉 Tap $TRUMP
to open the live chart. NFA
🔥 TRADE WITH LOWER FEES
✅ Get a 10% kickback on your Binance Futures trading fees
👇👇👇
{spot}(TRUMPUSDT)
[Claim your 10% Futures fee kickback here](https://www.binance.com/join?ref=SQUAREGINOS)
━━━━━━━━━━
Real reversal or just a dead-cat bounce? Vote below 👇
Follow Crypto Signals and Analysis for daily signals.
#cryptosignals #TRUMP #FOMCWatch
⚠️ Crypto is volatile: risk only what you can afford to lose.
$TRUMP Price Prediction Today (Oct 28, Evening Update): Official Trump Crypto Signal & Technical Analysis 📊
🟢 LONG | Entry 1.7235 - 1.7305 | TP1 1.8382 | SL 1.6158
👉 Tap $TRUMP to place your trade fast
🕒 Updated: Oct 28, 20:52 UTC · price 1.727
Official Trump bounced off 1.618 (its lowest level in over two weeks) and just reclaimed both 4H moving averages. With memes leading tonight, this is its first real trend shift since Oct 22.
📌 OFFICIAL TRUMP TRADING SIGNAL (Moderate, 4/5 signals agree)
Entry: 1.7235 - 1.7305
Take profit 1: 1.8382 (+6.4%)
Take profit 2: 1.9271 (+11.6%)
Take profit 3: 2.0605 (+19.3%)
Stop loss: 1.6158 (-6.4%)
📊 TRUMP TECHNICAL ANALYSIS (4H CHART)
Price is above the EMA20 (1.705) and EMA50 (1.720), and the EMA20 has turned up. RSI at 56 favors buyers. The one bearish check: it is still down 6.5% on the week, so this is an early reversal, not a confirmed trend.
🔑 KEY LEVELS
Support: 1.705 (EMA20), then 1.618
Resistance: 1.756, then 1.84 and 1.93
📈 Bullish scenario: a 4H close above 1.756 opens TP1 at 1.838.
📉 Bearish scenario: losing 1.70 puts the 1.618 low back in play. A close under 1.6158 cancels this signal.
💡 Bottom line: good risk/reward off a fresh low, but size small until 1.756 breaks.
👉 Tap $TRUMP
to open the live chart. NFA
🔥 TRADE WITH LOWER FEES
✅ Get a 10% kickback on your Binance Futures trading fees
👇👇👇
Claim your 10% Futures fee kickback here
━━━━━━━━━━
Real reversal or just a dead-cat bounce? Vote below 👇
Follow Crypto Signals and Analysis for daily signals.
#cryptosignals #TRUMP #FOMCWatch
⚠️ Crypto is volatile: risk only what you can afford to lose.
67
·
--
Bärisch
Übersetzung ansehen
$CRV Price Prediction Today (Oct 28, Evening Update): Curve DAO Crypto Signal & Technical Analysis 📊
🔴 SHORT | Entry 0.3385 - 0.3399 | TP1 0.3234 | SL 0.3550
👉 Tap $CRV to place your trade fast
🕒 Updated: Oct 28, 20:35 UTC · price 0.3392
Curve DAO is one of the weakest large DeFi tokens this week: down 15.8% in 7 days and flat today while memes rally. Since the Oct 21 rejection near 0.41, every 4H bounce has made a lower high.
📌 CURVE DAO TRADING SIGNAL (Strong, 5/5 signals agree)
Entry: 0.3385 - 0.3399
Take profit 1: 0.3234 (-4.7%)
Take profit 2: 0.3107 (-8.4%)
Take profit 3: 0.2918 (-14.0%)
Stop loss: 0.3550 (+4.7%)
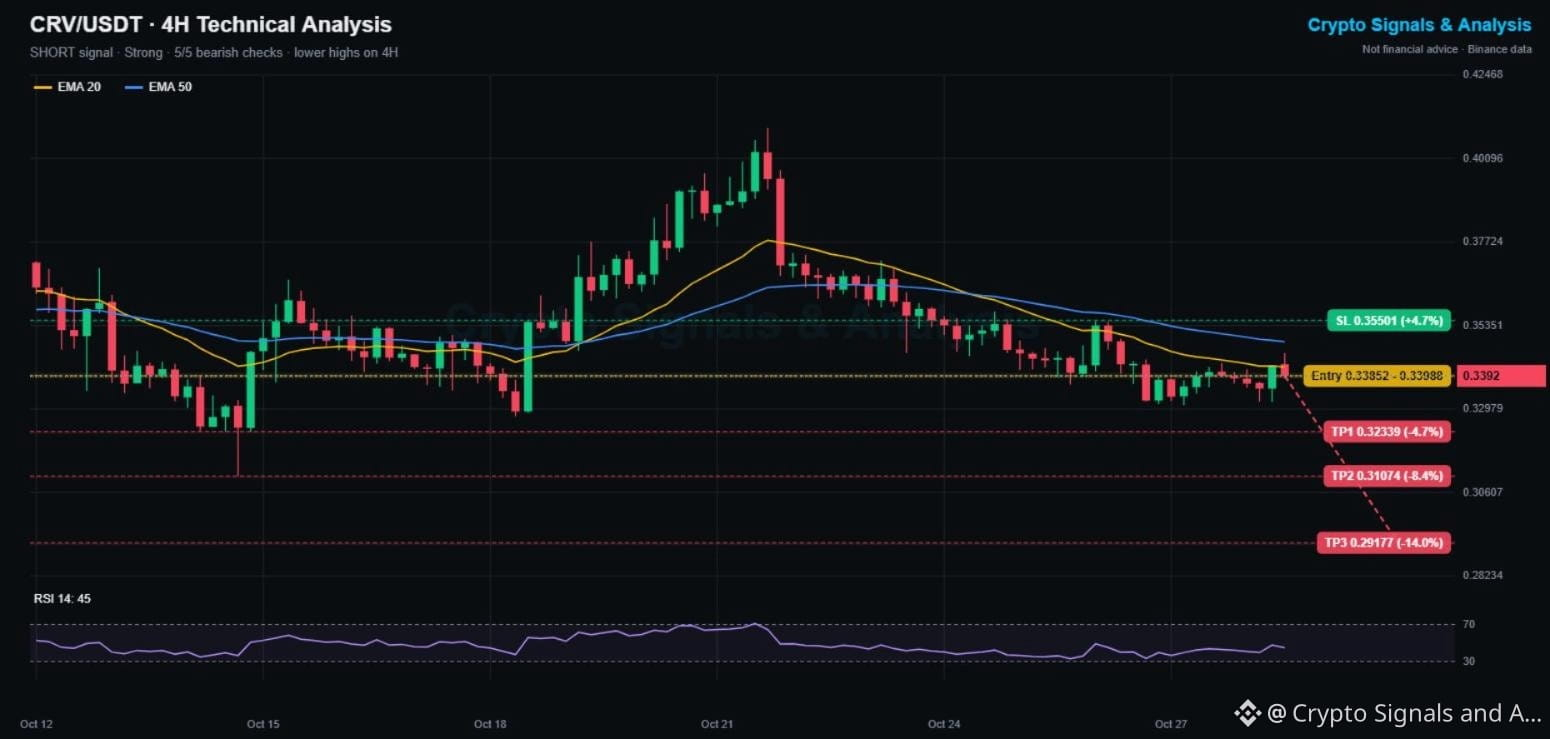
📊 CRV TECHNICAL ANALYSIS (4H CHART)
Price is below the EMA20 (0.3417) and EMA50 (0.3489), and both are sloping down. RSI at 45 shows sellers in control without being oversold. The latest bounce died right at the EMA20.
🔑 KEY LEVELS
Support: 0.331, then 0.311 (Oct 18 low)
Resistance: 0.342 (EMA20), then 0.355
📉 Bearish scenario: a 4H close under 0.331 opens TP1 and the 0.311 low.
📈 Bullish scenario: reclaiming 0.349 (EMA50) flips the bias. A close above 0.3550 cancels this signal.
💡 Bottom line: trend, momentum and weekly change all point down. Respect the stop.
👉 Tap $CRV
to open the live chart. NFA
🔥 TRADE WITH LOWER FEES
✅ Get a 10% kickback on your Binance Futures trading fees
👇👇👇
{spot}(CRVUSDT)
[Claim your 10% Futures fee kickback here](https://www.binance.com/join?ref=SQUAREGINOS)
━━━━━━━━━━
Is DeFi bleeding out, or is Curve DAO close to a bottom? 👇
Follow Crypto Signals and Analysis for daily signals.
#cryptosignals #CRV #FOMCWatch
⚠️ Crypto is volatile: risk only what you can afford to lose.
$CRV Price Prediction Today (Oct 28, Evening Update): Curve DAO Crypto Signal & Technical Analysis 📊
🔴 SHORT | Entry 0.3385 - 0.3399 | TP1 0.3234 | SL 0.3550
👉 Tap $CRV to place your trade fast
🕒 Updated: Oct 28, 20:35 UTC · price 0.3392
Curve DAO is one of the weakest large DeFi tokens this week: down 15.8% in 7 days and flat today while memes rally. Since the Oct 21 rejection near 0.41, every 4H bounce has made a lower high.
📌 CURVE DAO TRADING SIGNAL (Strong, 5/5 signals agree)
Entry: 0.3385 - 0.3399
Take profit 1: 0.3234 (-4.7%)
Take profit 2: 0.3107 (-8.4%)
Take profit 3: 0.2918 (-14.0%)
Stop loss: 0.3550 (+4.7%)
📊 CRV TECHNICAL ANALYSIS (4H CHART)
Price is below the EMA20 (0.3417) and EMA50 (0.3489), and both are sloping down. RSI at 45 shows sellers in control without being oversold. The latest bounce died right at the EMA20.
🔑 KEY LEVELS
Support: 0.331, then 0.311 (Oct 18 low)
Resistance: 0.342 (EMA20), then 0.355
📉 Bearish scenario: a 4H close under 0.331 opens TP1 and the 0.311 low.
📈 Bullish scenario: reclaiming 0.349 (EMA50) flips the bias. A close above 0.3550 cancels this signal.
💡 Bottom line: trend, momentum and weekly change all point down. Respect the stop.
👉 Tap $CRV
to open the live chart. NFA
🔥 TRADE WITH LOWER FEES
✅ Get a 10% kickback on your Binance Futures trading fees
👇👇👇
Claim your 10% Futures fee kickback here
━━━━━━━━━━
Is DeFi bleeding out, or is Curve DAO close to a bottom? 👇
Follow Crypto Signals and Analysis for daily signals.
#cryptosignals #CRV #FOMCWatch
⚠️ Crypto is volatile: risk only what you can afford to lose.
5
·
--
Bullisch
Übersetzung ansehen
$PEPE Price Prediction Today (Oct 28, Evening Update): PEPE Leads Binance Gainers +12%, Morning Signal Hits TP1 🚀
🟢 LONG | Entry 0.00000510 - 0.00000512 | TP1 0.00000552 | SL 0.00000470
👉 Tap $PEPE to place your trade fast
🕒 Updated: Oct 28, 20:20 UTC · price 0.00000511
📰 MARKET UPDATE
PEPE is the top gainer among high-volume coins on Binance spot tonight: +12.4% in 24 hours on about 102M USDT volume. Bitcoin is up only 0.6% after the Fed hold, so memes are leading this bounce.
✅ MORNING SIGNAL RESULT
This morning we posted a PEPE long from 0.00000484. In the last hour price tagged 0.00000523, which was TP1 (+8%). The stop at 0.00000445 was never touched. TP2 and TP3 are still open.
📌 NEW PEPE SETUP (Strong, 5/5 signals agree)
Entry: 0.00000510 - 0.00000512
Take profit 1: 0.00000552 (+8%)
Take profit 2: 0.00000585 (+14%)
Take profit 3: 0.00000634 (+24%)
Stop loss: 0.00000470 (-8%)
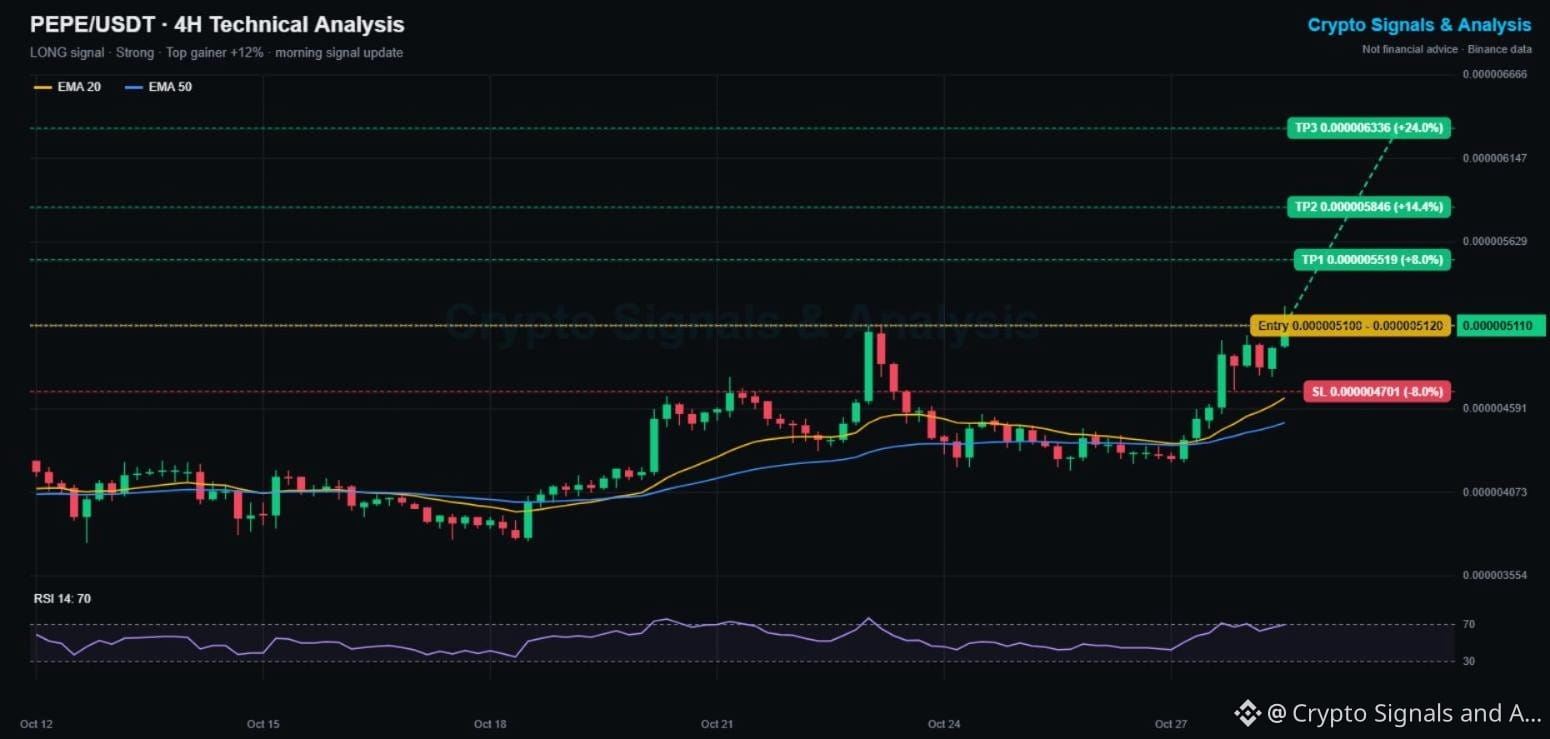
📊 4H CHART
Price is far above the EMA20 (0.00000466) and EMA50 (0.00000451). RSI is 70, so momentum is strong but stretched. Chasing here is riskier than this morning; a dip to 0.00000497 - 0.00000500 would be a better fill.
🔑 KEY LEVELS
Support: 0.00000500, then 0.00000470
Resistance: 0.00000523 (today's high), then 0.00000552
💡 Bottom line: trend is up, but take partial profit at targets and keep the stop.
👉 Tap $PEPE
to open the live chart. NFA
🔥 TRADE WITH LOWER FEES
✅ Get a 10% kickback on your Binance Futures trading fees
👇👇👇
{spot}(PEPEUSDT)
[Claim your 10% Futures fee kickback here](https://www.binance.com/join?ref=SQUAREGINOS)
━━━━━━━━━━
Did you catch the PEPE move or are you waiting for a dip? 👇
Follow Crypto Signals and Analysis for daily signals.
#cryptosignals #PEPE #FOMCWatch
⚠️ Crypto is volatile: risk only what you can afford to lose.
$PEPE Price Prediction Today (Oct 28, Evening Update): PEPE Leads Binance Gainers +12%, Morning Signal Hits TP1 🚀
🟢 LONG | Entry 0.00000510 - 0.00000512 | TP1 0.00000552 | SL 0.00000470
👉 Tap $PEPE to place your trade fast
🕒 Updated: Oct 28, 20:20 UTC · price 0.00000511
📰 MARKET UPDATE
PEPE is the top gainer among high-volume coins on Binance spot tonight: +12.4% in 24 hours on about 102M USDT volume. Bitcoin is up only 0.6% after the Fed hold, so memes are leading this bounce.
✅ MORNING SIGNAL RESULT
This morning we posted a PEPE long from 0.00000484. In the last hour price tagged 0.00000523, which was TP1 (+8%). The stop at 0.00000445 was never touched. TP2 and TP3 are still open.
📌 NEW PEPE SETUP (Strong, 5/5 signals agree)
Entry: 0.00000510 - 0.00000512
Take profit 1: 0.00000552 (+8%)
Take profit 2: 0.00000585 (+14%)
Take profit 3: 0.00000634 (+24%)
Stop loss: 0.00000470 (-8%)
📊 4H CHART
Price is far above the EMA20 (0.00000466) and EMA50 (0.00000451). RSI is 70, so momentum is strong but stretched. Chasing here is riskier than this morning; a dip to 0.00000497 - 0.00000500 would be a better fill.
🔑 KEY LEVELS
Support: 0.00000500, then 0.00000470
Resistance: 0.00000523 (today's high), then 0.00000552
💡 Bottom line: trend is up, but take partial profit at targets and keep the stop.
👉 Tap $PEPE
to open the live chart. NFA
🔥 TRADE WITH LOWER FEES
✅ Get a 10% kickback on your Binance Futures trading fees
👇👇👇
Claim your 10% Futures fee kickback here
━━━━━━━━━━
Did you catch the PEPE move or are you waiting for a dip? 👇
Follow Crypto Signals and Analysis for daily signals.
#cryptosignals #PEPE #FOMCWatch
⚠️ Crypto is volatile: risk only what you can afford to lose.
44
·
--
Bärisch
Übersetzung ansehen
$RUNE Price Prediction Today (Oct 28, Evening Update): THORChain Crypto Signal & Technical Analysis 📊
🔴 SHORT | Entry 0.6267 - 0.6293 | TP1 0.6168 | SL 0.6392
👉 Tap $RUNE to place your trade fast
🕒 Updated: Oct 28, 20:00 UTC · price 0.628
While Bitcoin bounced after the Fed hold, THORChain did not join in. It is down 8.5% this week and keeps getting rejected under its 4H moving averages.
📌 THORCHAIN TRADING SIGNAL (Strong, 4/5 signals agree)
Entry: 0.6267 - 0.6293
Take profit 1: 0.6168 (-1.8%)
Take profit 2: 0.6078 (-3.2%)
Take profit 3: 0.5943 (-5.4%)
Stop loss: 0.6392 (+1.8%)
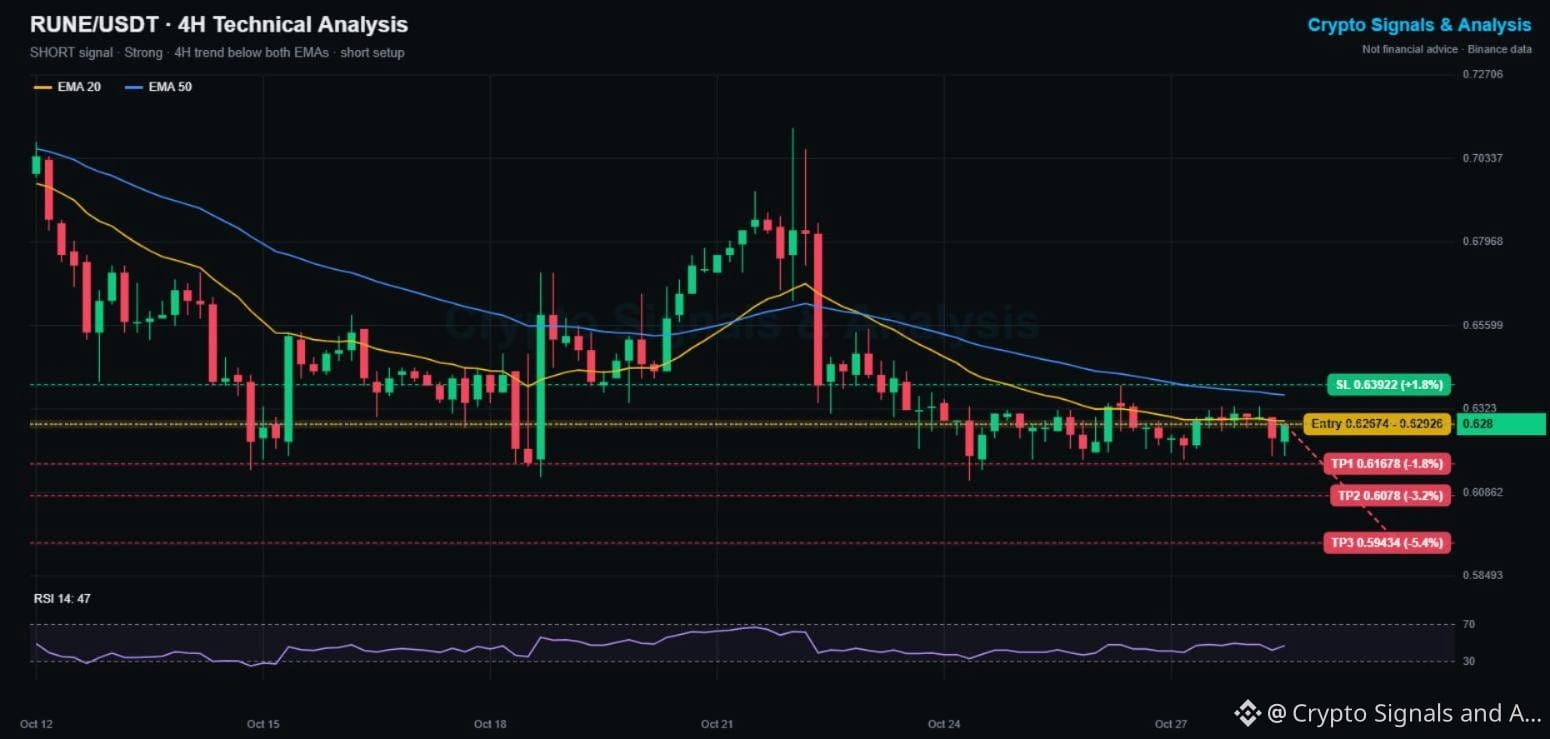
📊 RUNE TECHNICAL ANALYSIS (4H CHART)
Price sits below the EMA20 (0.6289) and the EMA50 (0.6363), and the EMA20 is sloping down. Every bounce since Oct 23 has stalled near 0.639. RSI at 47 leaves room to fall before oversold.
🔑 KEY LEVELS
Support: 0.618, then 0.612 (100-candle low)
Resistance: 0.636 (EMA50), then 0.639
📉 Bearish scenario: a 4H close under 0.618 opens TP2 and a retest of 0.612.
📈 Bullish scenario: reclaiming the EMA50 flips the bias. A close above 0.6392 cancels this signal.
💡 Bottom line: weak relative strength on a green day is a warning sign. Tight stop, small size.
👉 Tap $RUNE
to open the live chart. NFA
🔥 TRADE WITH LOWER FEES
✅ Get a 10% kickback on your Binance Futures trading fees
👇👇👇
{spot}(RUNEUSDT)
[Claim your 10% Futures fee kickback here](https://www.binance.com/join?ref=SQUAREGINOS)
━━━━━━━━━━
Does THORChain lose 0.618 this week, or bounce first? 👇
Follow Crypto Signals and Analysis for daily signals.
#cryptosignals #RUNE #FOMCWatch
⚠️ Crypto is volatile: risk only what you can afford to lose.
$RUNE Price Prediction Today (Oct 28, Evening Update): THORChain Crypto Signal & Technical Analysis 📊
🔴 SHORT | Entry 0.6267 - 0.6293 | TP1 0.6168 | SL 0.6392
👉 Tap $RUNE to place your trade fast
🕒 Updated: Oct 28, 20:00 UTC · price 0.628
While Bitcoin bounced after the Fed hold, THORChain did not join in. It is down 8.5% this week and keeps getting rejected under its 4H moving averages.
📌 THORCHAIN TRADING SIGNAL (Strong, 4/5 signals agree)
Entry: 0.6267 - 0.6293
Take profit 1: 0.6168 (-1.8%)
Take profit 2: 0.6078 (-3.2%)
Take profit 3: 0.5943 (-5.4%)
Stop loss: 0.6392 (+1.8%)
📊 RUNE TECHNICAL ANALYSIS (4H CHART)
Price sits below the EMA20 (0.6289) and the EMA50 (0.6363), and the EMA20 is sloping down. Every bounce since Oct 23 has stalled near 0.639. RSI at 47 leaves room to fall before oversold.
🔑 KEY LEVELS
Support: 0.618, then 0.612 (100-candle low)
Resistance: 0.636 (EMA50), then 0.639
📉 Bearish scenario: a 4H close under 0.618 opens TP2 and a retest of 0.612.
📈 Bullish scenario: reclaiming the EMA50 flips the bias. A close above 0.6392 cancels this signal.
💡 Bottom line: weak relative strength on a green day is a warning sign. Tight stop, small size.
👉 Tap $RUNE
to open the live chart. NFA
🔥 TRADE WITH LOWER FEES
✅ Get a 10% kickback on your Binance Futures trading fees
👇👇👇
Claim your 10% Futures fee kickback here
━━━━━━━━━━
Does THORChain lose 0.618 this week, or bounce first? 👇
Follow Crypto Signals and Analysis for daily signals.
#cryptosignals #RUNE #FOMCWatch
⚠️ Crypto is volatile: risk only what you can afford to lose.
6
·
--
Bullisch
Übersetzung ansehen
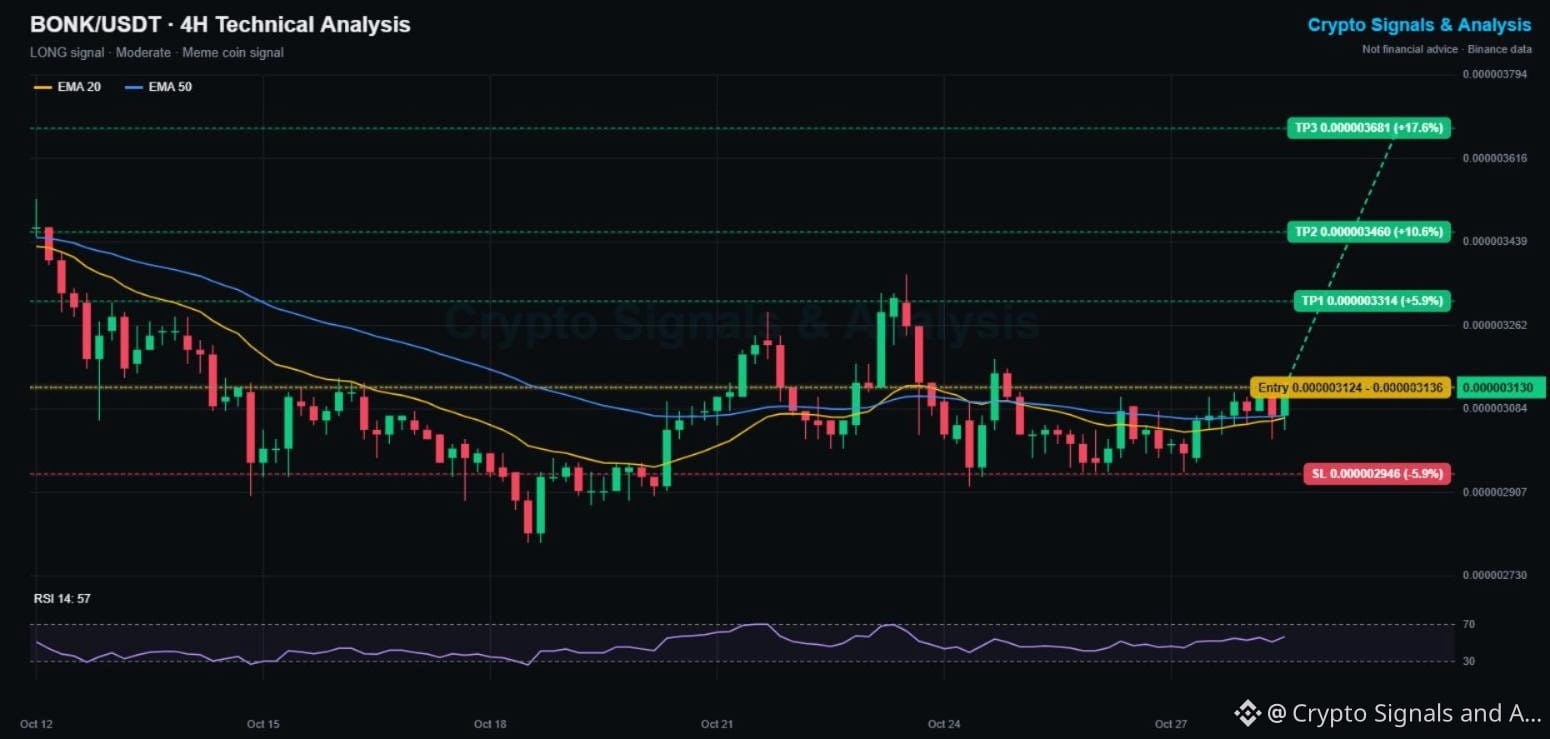
$BONK Price Prediction Today (Oct 28, Evening Update): Bonk Crypto Signal & Technical Analysis 📊
🟢 LONG | Entry 0.000003124 - 0.000003136 | TP1 0.000003314 | SL 0.000002946
👉 Tap $BONK to place your trade fast
🕒 Updated: Oct 28, 19:40 UTC · price 0.000003130
Bonk is up 2% today and just tagged a new 5-day high as meme coins bounce after the Fed hold. It held the 0.00000295 floor all week and is now sitting on top of both 4H EMAs.
📌 BONK TRADING SIGNAL (Moderate, 4/5 signals agree)
Entry: 0.000003124 - 0.000003136
Take profit 1: 0.000003314 (+5.9%)
Take profit 2: 0.000003460 (+10.6%)
Take profit 3: 0.000003681 (+17.6%)
Stop loss: 0.000002946 (-5.9%)
📊 BONK TECHNICAL ANALYSIS (4H CHART)
Price holds above the EMA20 (0.000003065) and EMA50 (0.000003070), and the EMA20 is sloping up. RSI at 57 favors buyers. The Oct 23 spike to 0.00000330 is the first real resistance, close to TP1.
🔑 KEY LEVELS
Support: 0.00000307 (EMAs), then 0.00000295
Resistance: 0.00000314, then 0.00000330
📈 Bullish scenario: a 4H close above 0.00000314 opens TP1 and the 0.00000346 zone.
📉 Bearish scenario: losing the EMAs sends Bonk back to its range. A close under 0.000002946 cancels this signal.
💡 Bottom line: Solana memes are waking up, and Bonk has the cleanest chart of the group.
👉 Tap $BONK
to open the live chart. NFA
🔥 TRADE WITH LOWER FEES
✅ Get a 10% kickback on your Binance Futures trading fees
👇👇👇
{spot}(BONKUSDT)
[Claim your 10% Futures fee kickback here](https://www.binance.com/join?ref=SQUAREGINOS)
━━━━━━━━━━
Best Solana meme right now: BONK, WIF or something new? 👇
Follow Crypto Signals and Analysis for daily signals.
#cryptosignals #BONK #FOMCWatch
⚠️ Crypto is volatile: risk only what you can afford to lose.
$BONK Price Prediction Today (Oct 28, Evening Update): Bonk Crypto Signal & Technical Analysis 📊
🟢 LONG | Entry 0.000003124 - 0.000003136 | TP1 0.000003314 | SL 0.000002946
👉 Tap $BONK to place your trade fast
🕒 Updated: Oct 28, 19:40 UTC · price 0.000003130
Bonk is up 2% today and just tagged a new 5-day high as meme coins bounce after the Fed hold. It held the 0.00000295 floor all week and is now sitting on top of both 4H EMAs.
📌 BONK TRADING SIGNAL (Moderate, 4/5 signals agree)
Entry: 0.000003124 - 0.000003136
Take profit 1: 0.000003314 (+5.9%)
Take profit 2: 0.000003460 (+10.6%)
Take profit 3: 0.000003681 (+17.6%)
Stop loss: 0.000002946 (-5.9%)
📊 BONK TECHNICAL ANALYSIS (4H CHART)
Price holds above the EMA20 (0.000003065) and EMA50 (0.000003070), and the EMA20 is sloping up. RSI at 57 favors buyers. The Oct 23 spike to 0.00000330 is the first real resistance, close to TP1.
🔑 KEY LEVELS
Support: 0.00000307 (EMAs), then 0.00000295
Resistance: 0.00000314, then 0.00000330
📈 Bullish scenario: a 4H close above 0.00000314 opens TP1 and the 0.00000346 zone.
📉 Bearish scenario: losing the EMAs sends Bonk back to its range. A close under 0.000002946 cancels this signal.
💡 Bottom line: Solana memes are waking up, and Bonk has the cleanest chart of the group.
👉 Tap $BONK
to open the live chart. NFA
🔥 TRADE WITH LOWER FEES
✅ Get a 10% kickback on your Binance Futures trading fees
👇👇👇
Claim your 10% Futures fee kickback here
━━━━━━━━━━
Best Solana meme right now: BONK, WIF or something new? 👇
Follow Crypto Signals and Analysis for daily signals.
#cryptosignals #BONK #FOMCWatch
⚠️ Crypto is volatile: risk only what you can afford to lose.
1
20
·
--
Bullisch
Übersetzung ansehen
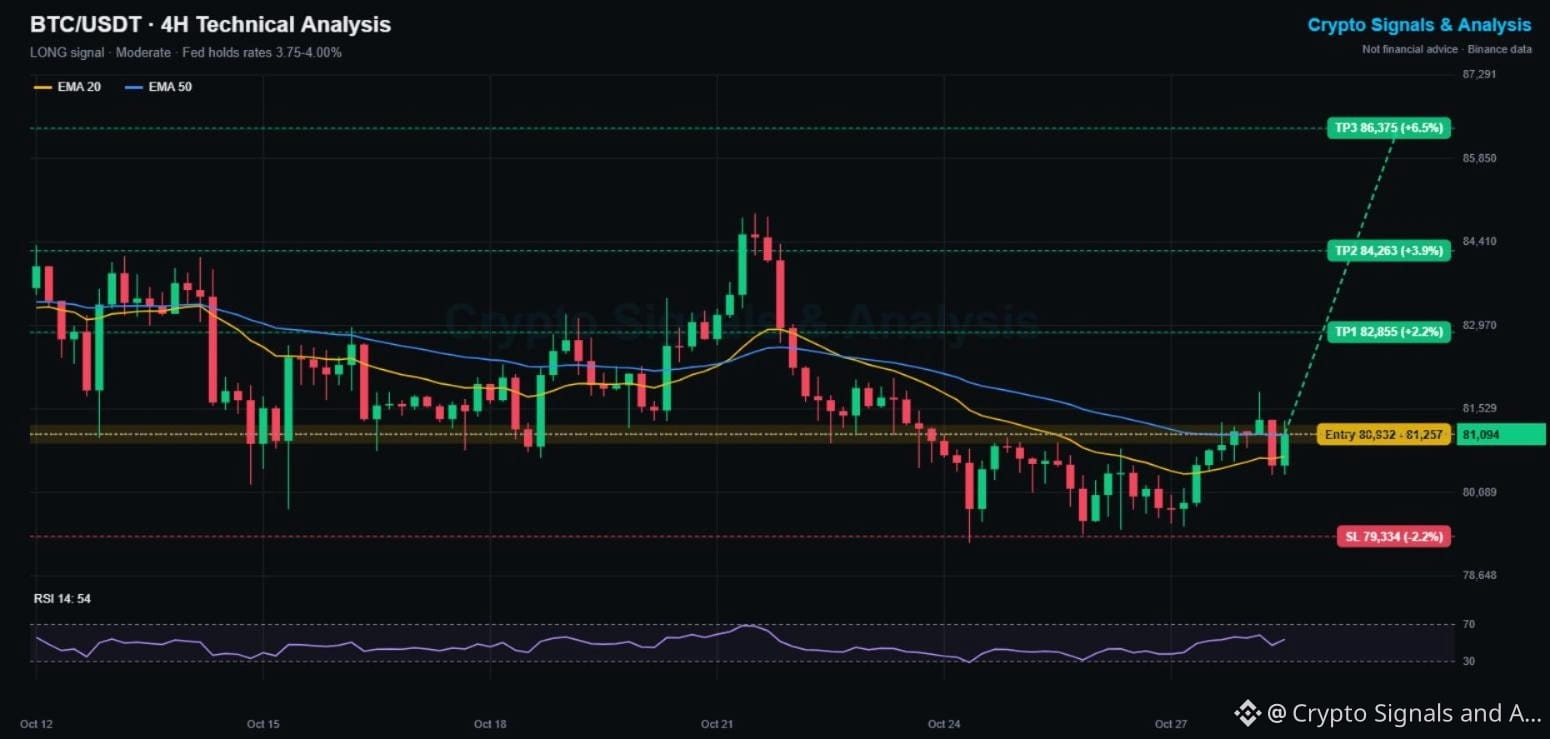
$BTC Price Prediction After the Fed (Oct 28, Evening Update): Fed Holds Rates, Bitcoin Signal Flips 🏛️
🟢 LONG | Entry 80,932 - 81,257 | TP1 82,855 | SL 79,334
👉 Tap $BTC to place your trade fast
🕒 Updated: Oct 28, 19:25 UTC · price 81,094
The Fed kept rates unchanged at 3.75% to 4.00% today, as markets expected The statement said inflation "remains elevated" while activity is expanding. Bitcoin's first reaction: a bounce back above 81K.
🔄 UPDATE ON THIS MORNING'S SIGNAL
Our 15:00 short (entry 80,400 to 80,722) did not reach TP1 at 79,274, and price climbed to 81,327 instead. The stop at 81,848 was not hit. We close that idea and follow the new trend.
📌 NEW BITCOIN SIGNAL (Moderate, 3/5 signals agree)
Entry: 80,932 - 81,257
Take profit 1: 82,855 (+2.2%)
Take profit 2: 84,263 (+3.9%)
Take profit 3: 86,375 (+6.5%)
Stop loss: 79,334 (-2.2%)
📊 BTC TECHNICAL ANALYSIS (4H CHART)
Price is back above the EMA20 (80,711) and just over the EMA50 (81,076), and the EMA20 is turning up. RSI at 54 leaves room to run. The weekly trend is still down (-4%), so the 81,800 high from earlier today is the line buyers need to break.
🔑 KEY LEVELS
Support: 80,711 (EMA20), then 79,370
Resistance: 81,823, then 82,900
📈 Bullish scenario: a 4H close above 81,823 confirms the post-Fed breakout toward TP1 and TP2.
📉 Bearish scenario: losing 80,700 means the Fed bounce failed. A close under 79,334 cancels this signal.
💡 Bottom line: no surprise from the Fed, and the market took it as a relief.
👉 Tap $BTC
to open the live chart. NFA
🔥 TRADE WITH LOWER FEES
✅ Get a 10% kickback on your Binance Futures trading fees
👇👇👇
{spot}(BTCUSDT)
[Claim your 10% Futures fee kickback here](https://www.binance.com/join?ref=SQUAREGINOS)
━━━━━━━━━━
Fed held rates. Is Bitcoin going to 85K or back to 79K first? 👇
Follow Crypto Signals and Analysis for daily signals.
#cryptosignals #FOMCWatch #BTC
⚠️ Crypto is volatile: risk only what you can afford to lose.
$BTC Price Prediction After the Fed (Oct 28, Evening Update): Fed Holds Rates, Bitcoin Signal Flips 🏛️
🟢 LONG | Entry 80,932 - 81,257 | TP1 82,855 | SL 79,334
👉 Tap $BTC to place your trade fast
🕒 Updated: Oct 28, 19:25 UTC · price 81,094
The Fed kept rates unchanged at 3.75% to 4.00% today, as markets expected The statement said inflation "remains elevated" while activity is expanding. Bitcoin's first reaction: a bounce back above 81K.
🔄 UPDATE ON THIS MORNING'S SIGNAL
Our 15:00 short (entry 80,400 to 80,722) did not reach TP1 at 79,274, and price climbed to 81,327 instead. The stop at 81,848 was not hit. We close that idea and follow the new trend.
📌 NEW BITCOIN SIGNAL (Moderate, 3/5 signals agree)
Entry: 80,932 - 81,257
Take profit 1: 82,855 (+2.2%)
Take profit 2: 84,263 (+3.9%)
Take profit 3: 86,375 (+6.5%)
Stop loss: 79,334 (-2.2%)
📊 BTC TECHNICAL ANALYSIS (4H CHART)
Price is back above the EMA20 (80,711) and just over the EMA50 (81,076), and the EMA20 is turning up. RSI at 54 leaves room to run. The weekly trend is still down (-4%), so the 81,800 high from earlier today is the line buyers need to break.
🔑 KEY LEVELS
Support: 80,711 (EMA20), then 79,370
Resistance: 81,823, then 82,900
📈 Bullish scenario: a 4H close above 81,823 confirms the post-Fed breakout toward TP1 and TP2.
📉 Bearish scenario: losing 80,700 means the Fed bounce failed. A close under 79,334 cancels this signal.
💡 Bottom line: no surprise from the Fed, and the market took it as a relief.
👉 Tap $BTC
to open the live chart. NFA
🔥 TRADE WITH LOWER FEES
✅ Get a 10% kickback on your Binance Futures trading fees
👇👇👇
Claim your 10% Futures fee kickback here
━━━━━━━━━━
Fed held rates. Is Bitcoin going to 85K or back to 79K first? 👇
Follow Crypto Signals and Analysis for daily signals.
#cryptosignals #FOMCWatch #BTC
⚠️ Crypto is volatile: risk only what you can afford to lose.
36
·
--
Bärisch
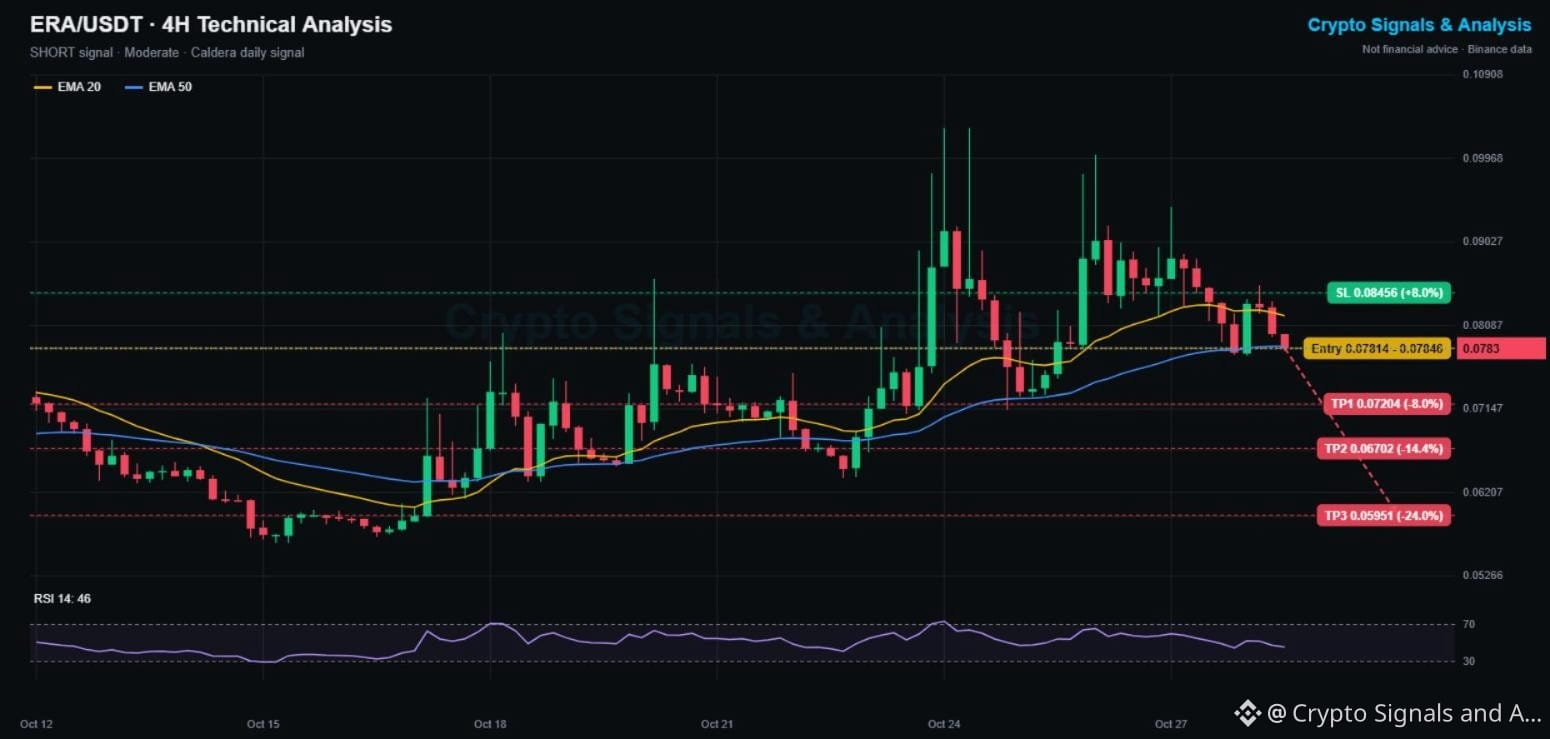
$ERA Kursprognose heute: Caldera-Krypto-Signal & technische Analyse 📊
🔴 SHORT | Einstieg 0.07814 - 0.07846 | TP1 0.07204 | SL 0.08456
👉 Tippe auf $ERA , um schnell deinen Trade zu platzieren
Caldera stieg diesen Monat von 0.056 auf 0.100, doch die letzten drei Anläufe auf 0.10 wurden alle mit langen Dochten abgewiesen. Heute fiel der Kurs um 6 % und unterschritt den 4H-EMA20. Jetzt liegt der Kurs direkt am EMA50.
📌 CALDERA-HANDELSSIGNAL (moderat, Momentum lässt nach)
Einstieg: 0.07814 - 0.07846
Take-Profit 1: 0.07204 (-8 %)
Take-Profit 2: 0.06702 (-14 %)
Take-Profit 3: 0.05951 (-24 %)
Stop-Loss: 0.08456 (+8 %)
📊 TECHNISCHE ERA-ANALYSE (4H-CHART)
ERA liegt unter dem EMA20 (0.0820), der sich nun nach unten dreht, und testet den EMA50 (0.0785). Der RSI fiel auf 46. Die wiederholten Dochte zwischen 0.096 und 0.100 zeigen dort ein starkes Verkaufsangebot. Vorsicht: Der Coin liegt diese Woche immer noch 11 % im Plus. Warte daher auf einen 4H-Schlusskurs unter dem EMA50, bevor du mit der vollen Positionsgröße einsteigst.
🔑 WICHTIGE KURSLEVELS
Unterstützung: 0.0785 (EMA50), danach 0.0731
Widerstand: 0.0820 (EMA20), danach 0.0880
📈 Bullisches Szenario: Eine Erholung vom EMA50 und ein Schlusskurs über 0.0846 halten den Aufwärtstrend am Leben und machen den SHORT ungültig.
📉 Bärisches Szenario: Ein 4H-Schlusskurs unter 0.0785 bestätigt das Hoch und eröffnet den Weg zu TP1 und TP2.
💡 Fazit: Drei gescheiterte Anläufe auf ein Hoch sind ein Warnsignal. Der EMA50 ist die entscheidende Marke.
👉 Tippe auf $ERA
, um den Live-Chart zu öffnen. Keine Anlageberatung (NFA)
🔥 HANDLE MIT NIEDRIGEREN GEBÜHREN
✅ Erhalte lebenslang 20 % Cashback auf deine Binance-Handelsgebühren
👇👇👇
{spot}(ERAUSDT)
[Claim your 20% Binance fee kickback here](https://www.binance.com/register?ref=X0NQWZ4N)
━━━━━━━━━━
Caldera: bullische Flagge oder dreifaches Hoch? Was meinst du? 👇
Folge Crypto Signals and Analysis für tägliche Signale.
#cryptosignals #ERA #EarningsSeason
⚠️ Kryptowährungen sind volatil: Riskiere nur, was du dir leisten kannst zu verlieren.
$ERA Kursprognose heute: Caldera-Krypto-Signal & technische Analyse 📊
🔴 SHORT | Einstieg 0.07814 - 0.07846 | TP1 0.07204 | SL 0.08456
👉 Tippe auf $ERA , um schnell deinen Trade zu platzieren
Caldera stieg diesen Monat von 0.056 auf 0.100, doch die letzten drei Anläufe auf 0.10 wurden alle mit langen Dochten abgewiesen. Heute fiel der Kurs um 6 % und unterschritt den 4H-EMA20. Jetzt liegt der Kurs direkt am EMA50.
📌 CALDERA-HANDELSSIGNAL (moderat, Momentum lässt nach)
Einstieg: 0.07814 - 0.07846
Take-Profit 1: 0.07204 (-8 %)
Take-Profit 2: 0.06702 (-14 %)
Take-Profit 3: 0.05951 (-24 %)
Stop-Loss: 0.08456 (+8 %)
📊 TECHNISCHE ERA-ANALYSE (4H-CHART)
ERA liegt unter dem EMA20 (0.0820), der sich nun nach unten dreht, und testet den EMA50 (0.0785). Der RSI fiel auf 46. Die wiederholten Dochte zwischen 0.096 und 0.100 zeigen dort ein starkes Verkaufsangebot. Vorsicht: Der Coin liegt diese Woche immer noch 11 % im Plus. Warte daher auf einen 4H-Schlusskurs unter dem EMA50, bevor du mit der vollen Positionsgröße einsteigst.
🔑 WICHTIGE KURSLEVELS
Unterstützung: 0.0785 (EMA50), danach 0.0731
Widerstand: 0.0820 (EMA20), danach 0.0880
📈 Bullisches Szenario: Eine Erholung vom EMA50 und ein Schlusskurs über 0.0846 halten den Aufwärtstrend am Leben und machen den SHORT ungültig.
📉 Bärisches Szenario: Ein 4H-Schlusskurs unter 0.0785 bestätigt das Hoch und eröffnet den Weg zu TP1 und TP2.
💡 Fazit: Drei gescheiterte Anläufe auf ein Hoch sind ein Warnsignal. Der EMA50 ist die entscheidende Marke.
👉 Tippe auf $ERA
, um den Live-Chart zu öffnen. Keine Anlageberatung (NFA)
🔥 HANDLE MIT NIEDRIGEREN GEBÜHREN
✅ Erhalte lebenslang 20 % Cashback auf deine Binance-Handelsgebühren
👇👇👇
Claim your 20% Binance fee kickback here
━━━━━━━━━━
Caldera: bullische Flagge oder dreifaches Hoch? Was meinst du? 👇
Folge Crypto Signals and Analysis für tägliche Signale.
#cryptosignals #ERA #EarningsSeason
⚠️ Kryptowährungen sind volatil: Riskiere nur, was du dir leisten kannst zu verlieren.
1
217
·
--
Bärisch
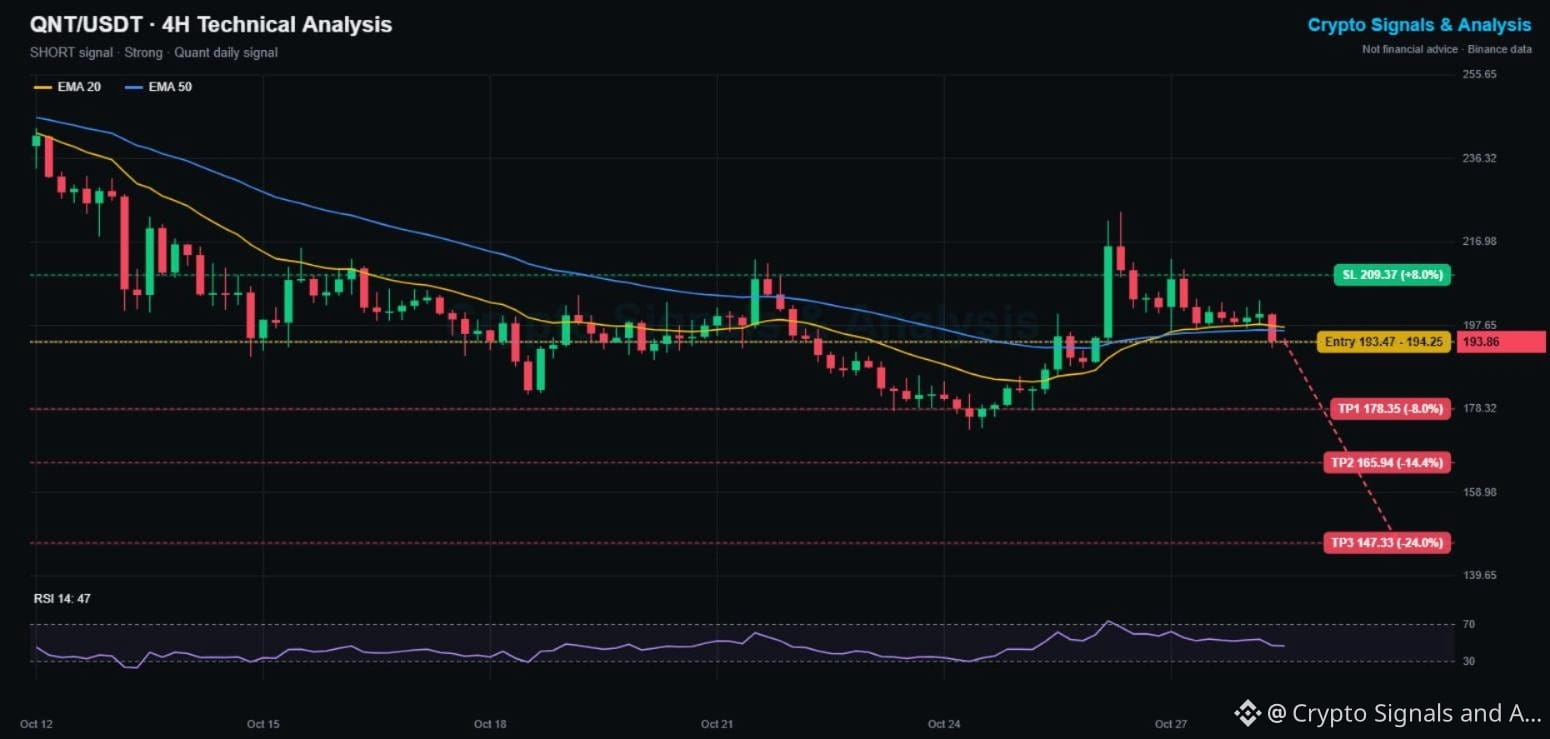
$QNT Kursprognose heute: Quant-Kryptosignal & technische Analyse 📊
🔴 SHORT | Einstieg 193.5 - 194.3 | TP1 178.4 | SL 209.4
👉 Tippe auf $QNT , um schnell deinen Trade zu platzieren
Quant stieg am 26. Okt. auf 224, konnte dieses Niveau jedoch nicht halten. Darauf folgten zwei Tage mit niedrigeren Hochs, und heute drückte ein Rückgang von 3.4 % den Kurs wieder unter beide 4H-EMAs. Der Anstieg sieht nun wie eine Bullenfalle aus.
📌 QUANT-TRADING-SIGNAL (Stark, 4/5 Signale stimmen überein)
Einstieg: 193.5 - 194.3
Take-Profit 1: 178.4 (-8%)
Take-Profit 2: 165.9 (-14%)
Take-Profit 3: 147.3 (-24%)
Stop-Loss: 209.4 (+8%)
📊 QNT-TECHNISCHE ANALYSE (4H-CHART)
QNT hat den EMA20 (197.2) und den EMA50 (196.4) unterschritten, und der EMA20 dreht nach unten. Der RSI liegt bei 47, ist neutral, fällt jedoch. Der langfristige Trend seit 243 Mitte Oktober zeigt weiterhin abwärts. Das Tief bei 181.8 ist die erste Zielzone, das Tief vom 24. Okt. bei 173.6 die nächste.
🔑 WICHTIGE NIVEAUS
Unterstützung: 181.8, danach 173.6
Widerstand: 197.2 (EMA20), danach 209
📈 Bullisches Szenario: Ein 4H-Schlusskurs über 209.4 erobert die Ausbruchszone zurück und macht den Short hinfällig.
📉 Bärisches Szenario: Ein Unterschreiten von 181.8 eröffnet den Weg zu TP2 und den Oktobertiefs.
💡 Fazit: Ein gescheiterter Kurssprung in Verbindung mit einem EMA-Durchbruch ist eine bärische Kombination. Beachte den Stop über 209.
👉 Tippe auf $QNT ,
um den Live-Chart zu öffnen. Keine Finanzberatung
🔥 HANDLE MIT NIEDRIGEREN GEBÜHREN
✅ Erhalte lebenslang 20 % deiner Binance-Handelsgebühren zurück
👇👇👇
{spot}(QNTUSDT)
[Claim your 20% Binance fee kickback here](https://www.binance.com/register?ref=X0NQWZ4N)
━━━━━━━━━━
War der Kurssprung von Quant auf 224 eine Falle? Schreib es unten in die Kommentare 👇
Folge Crypto Signals and Analysis für tägliche Signale.
#cryptosignals #QNT #CanGoogleDefendItsCore
⚠️ Kryptowährungen sind volatil: Setze nur so viel aufs Spiel, wie du dir leisten kannst zu verlieren.
$QNT Kursprognose heute: Quant-Kryptosignal & technische Analyse 📊
🔴 SHORT | Einstieg 193.5 - 194.3 | TP1 178.4 | SL 209.4
👉 Tippe auf $QNT , um schnell deinen Trade zu platzieren
Quant stieg am 26. Okt. auf 224, konnte dieses Niveau jedoch nicht halten. Darauf folgten zwei Tage mit niedrigeren Hochs, und heute drückte ein Rückgang von 3.4 % den Kurs wieder unter beide 4H-EMAs. Der Anstieg sieht nun wie eine Bullenfalle aus.
📌 QUANT-TRADING-SIGNAL (Stark, 4/5 Signale stimmen überein)
Einstieg: 193.5 - 194.3
Take-Profit 1: 178.4 (-8%)
Take-Profit 2: 165.9 (-14%)
Take-Profit 3: 147.3 (-24%)
Stop-Loss: 209.4 (+8%)
📊 QNT-TECHNISCHE ANALYSE (4H-CHART)
QNT hat den EMA20 (197.2) und den EMA50 (196.4) unterschritten, und der EMA20 dreht nach unten. Der RSI liegt bei 47, ist neutral, fällt jedoch. Der langfristige Trend seit 243 Mitte Oktober zeigt weiterhin abwärts. Das Tief bei 181.8 ist die erste Zielzone, das Tief vom 24. Okt. bei 173.6 die nächste.
🔑 WICHTIGE NIVEAUS
Unterstützung: 181.8, danach 173.6
Widerstand: 197.2 (EMA20), danach 209
📈 Bullisches Szenario: Ein 4H-Schlusskurs über 209.4 erobert die Ausbruchszone zurück und macht den Short hinfällig.
📉 Bärisches Szenario: Ein Unterschreiten von 181.8 eröffnet den Weg zu TP2 und den Oktobertiefs.
💡 Fazit: Ein gescheiterter Kurssprung in Verbindung mit einem EMA-Durchbruch ist eine bärische Kombination. Beachte den Stop über 209.
👉 Tippe auf $QNT ,
um den Live-Chart zu öffnen. Keine Finanzberatung
🔥 HANDLE MIT NIEDRIGEREN GEBÜHREN
✅ Erhalte lebenslang 20 % deiner Binance-Handelsgebühren zurück
👇👇👇
Claim your 20% Binance fee kickback here
━━━━━━━━━━
War der Kurssprung von Quant auf 224 eine Falle? Schreib es unten in die Kommentare 👇
Folge Crypto Signals and Analysis für tägliche Signale.
#cryptosignals #QNT #CanGoogleDefendItsCore
⚠️ Kryptowährungen sind volatil: Setze nur so viel aufs Spiel, wie du dir leisten kannst zu verlieren.
180
·
--
Bärisch
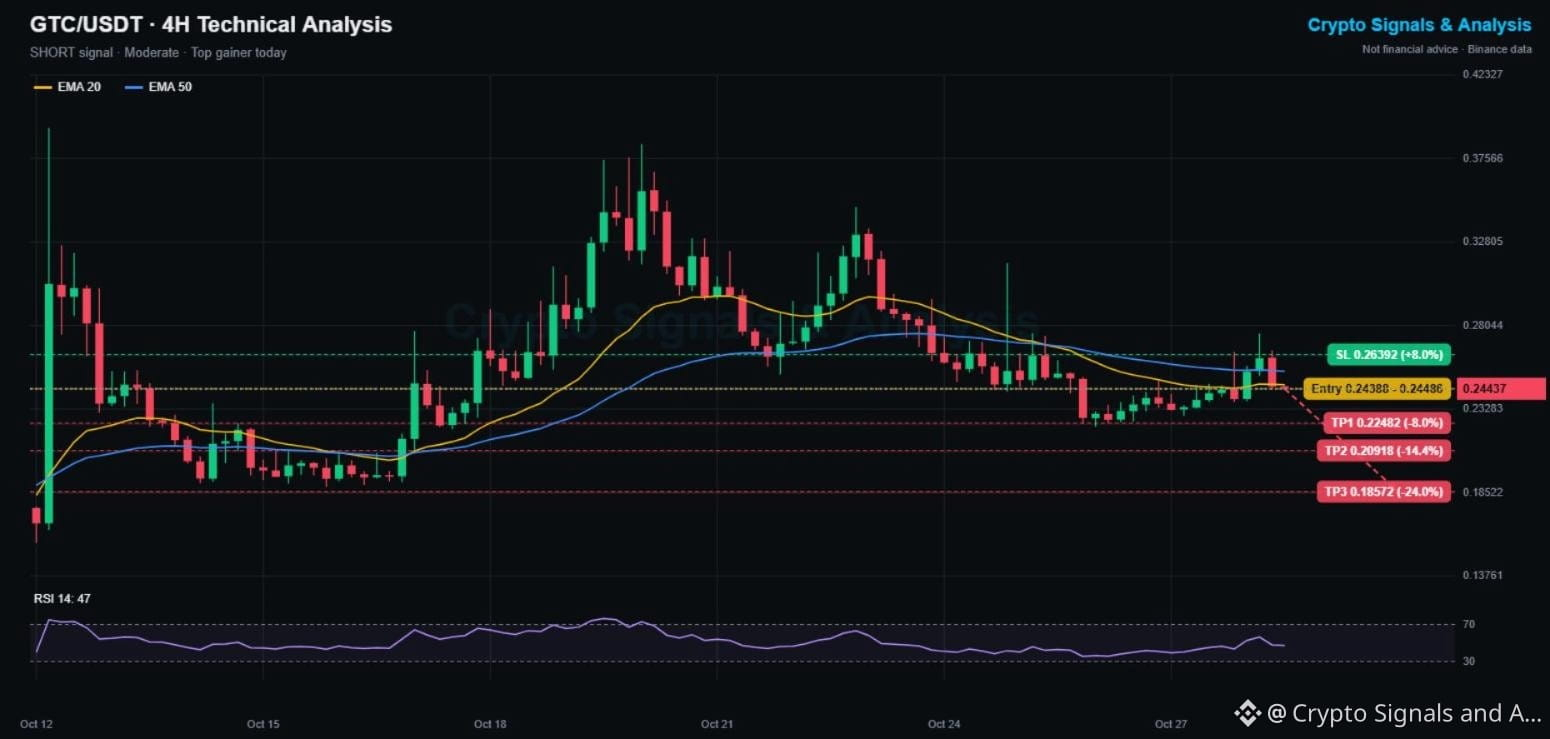
$GTC Kursprognose heute: Gitcoin-Kryptosignal & technische Analyse 📊
🔴 SHORT | Einstieg 0.2439 - 0.2449 | TP1 0.2248 | SL 0.2639
👉 Tippe auf $GTC , um schnell deinen Trade zu platzieren
Gitcoin schaffte es heute früher auf die Liste der größten Kursgewinner und stieg kurzzeitig auf 0.276. Doch direkt am fallenden 4H-EMA50 wurde der Anstieg stark abverkauft. Der lange obere Docht und die darauffolgende rote Kerze sind klassische Anzeichen für einen gescheiterten Ausbruch.
📌 GITCOIN-HANDELSSIGNAL (moderat, Setup mit gescheitertem Ausbruch)
Einstieg: 0.2439 - 0.2449
Take-Profit 1: 0.2248 (-8%)
Take-Profit 2: 0.2092 (-14%)
Take-Profit 3: 0.1857 (-24%)
Stop-Loss: 0.2639 (+8%)
📊 TECHNISCHE GTC-ANALYSE (4H-CHART)
GTC erreichte am 12. Okt. einen Höchststand von 0.393 und am 20. Okt. von 0.38. Seitdem bildete der Kurs tiefere Hochs bei 0.34, 0.31 und zuletzt 0.276. Der Kurs liegt wieder unter dem EMA20 (0.2467) und dem EMA50 (0.2544). Der RSI bei 47 ist neutral. Das Tief von 0.2227 vom 26. Okt. ist die entscheidende Unterstützung.
🔑 WICHTIGE KURSLEVELS
Unterstützung: 0.2227, danach 0.2090
Widerstand: 0.2544 (EMA50), danach 0.2758
📈 Bullishes Szenario: Ein 4H-Schlusskurs über 0.2639 und dem EMA50 macht das Short-Signal ungültig.
📉 Bearishes Szenario: Ein Rückgang unter 0.2227 eröffnet den Weg zu TP2 und möglicherweise TP3.
💡 Fazit: Listen der größten Kursgewinner können späte Käufer in die Falle locken. Dieser Chart zeigt, dass der Anstieg abverkauft wurde.
👉 Tippe auf $GTC ,
um den Live-Chart zu öffnen. Keine Anlageberatung (NFA)
🔥 HANDEL MIT NIEDRIGEREN GEBÜHREN
✅ Erhalte lebenslang 20 % Cashback auf deine Binance-Handelsgebühren
👇👇👇
{spot}(GTCUSDT)
[Claim your 20% Binance fee kickback here](https://www.binance.com/register?ref=X0NQWZ4N)
━━━━━━━━━━
Jagst du den größten Kursgewinnern hinterher oder wartest du auf einen Rücksetzer? 👇
Folge Crypto Signals and Analysis für tägliche Signale.
#cryptosignals #GTC #CanMicrosoftDeliverOnAI
⚠️ Kryptowährungen sind volatil: Setze nur so viel ein, wie du bereit bist zu verlieren.
$GTC Kursprognose heute: Gitcoin-Kryptosignal & technische Analyse 📊
🔴 SHORT | Einstieg 0.2439 - 0.2449 | TP1 0.2248 | SL 0.2639
👉 Tippe auf $GTC , um schnell deinen Trade zu platzieren
Gitcoin schaffte es heute früher auf die Liste der größten Kursgewinner und stieg kurzzeitig auf 0.276. Doch direkt am fallenden 4H-EMA50 wurde der Anstieg stark abverkauft. Der lange obere Docht und die darauffolgende rote Kerze sind klassische Anzeichen für einen gescheiterten Ausbruch.
📌 GITCOIN-HANDELSSIGNAL (moderat, Setup mit gescheitertem Ausbruch)
Einstieg: 0.2439 - 0.2449
Take-Profit 1: 0.2248 (-8%)
Take-Profit 2: 0.2092 (-14%)
Take-Profit 3: 0.1857 (-24%)
Stop-Loss: 0.2639 (+8%)
📊 TECHNISCHE GTC-ANALYSE (4H-CHART)
GTC erreichte am 12. Okt. einen Höchststand von 0.393 und am 20. Okt. von 0.38. Seitdem bildete der Kurs tiefere Hochs bei 0.34, 0.31 und zuletzt 0.276. Der Kurs liegt wieder unter dem EMA20 (0.2467) und dem EMA50 (0.2544). Der RSI bei 47 ist neutral. Das Tief von 0.2227 vom 26. Okt. ist die entscheidende Unterstützung.
🔑 WICHTIGE KURSLEVELS
Unterstützung: 0.2227, danach 0.2090
Widerstand: 0.2544 (EMA50), danach 0.2758
📈 Bullishes Szenario: Ein 4H-Schlusskurs über 0.2639 und dem EMA50 macht das Short-Signal ungültig.
📉 Bearishes Szenario: Ein Rückgang unter 0.2227 eröffnet den Weg zu TP2 und möglicherweise TP3.
💡 Fazit: Listen der größten Kursgewinner können späte Käufer in die Falle locken. Dieser Chart zeigt, dass der Anstieg abverkauft wurde.
👉 Tippe auf $GTC ,
um den Live-Chart zu öffnen. Keine Anlageberatung (NFA)
🔥 HANDEL MIT NIEDRIGEREN GEBÜHREN
✅ Erhalte lebenslang 20 % Cashback auf deine Binance-Handelsgebühren
👇👇👇
Claim your 20% Binance fee kickback here
━━━━━━━━━━
Jagst du den größten Kursgewinnern hinterher oder wartest du auf einen Rücksetzer? 👇
Folge Crypto Signals and Analysis für tägliche Signale.
#cryptosignals #GTC #CanMicrosoftDeliverOnAI
⚠️ Kryptowährungen sind volatil: Setze nur so viel ein, wie du bereit bist zu verlieren.
207
·
--
Bullisch
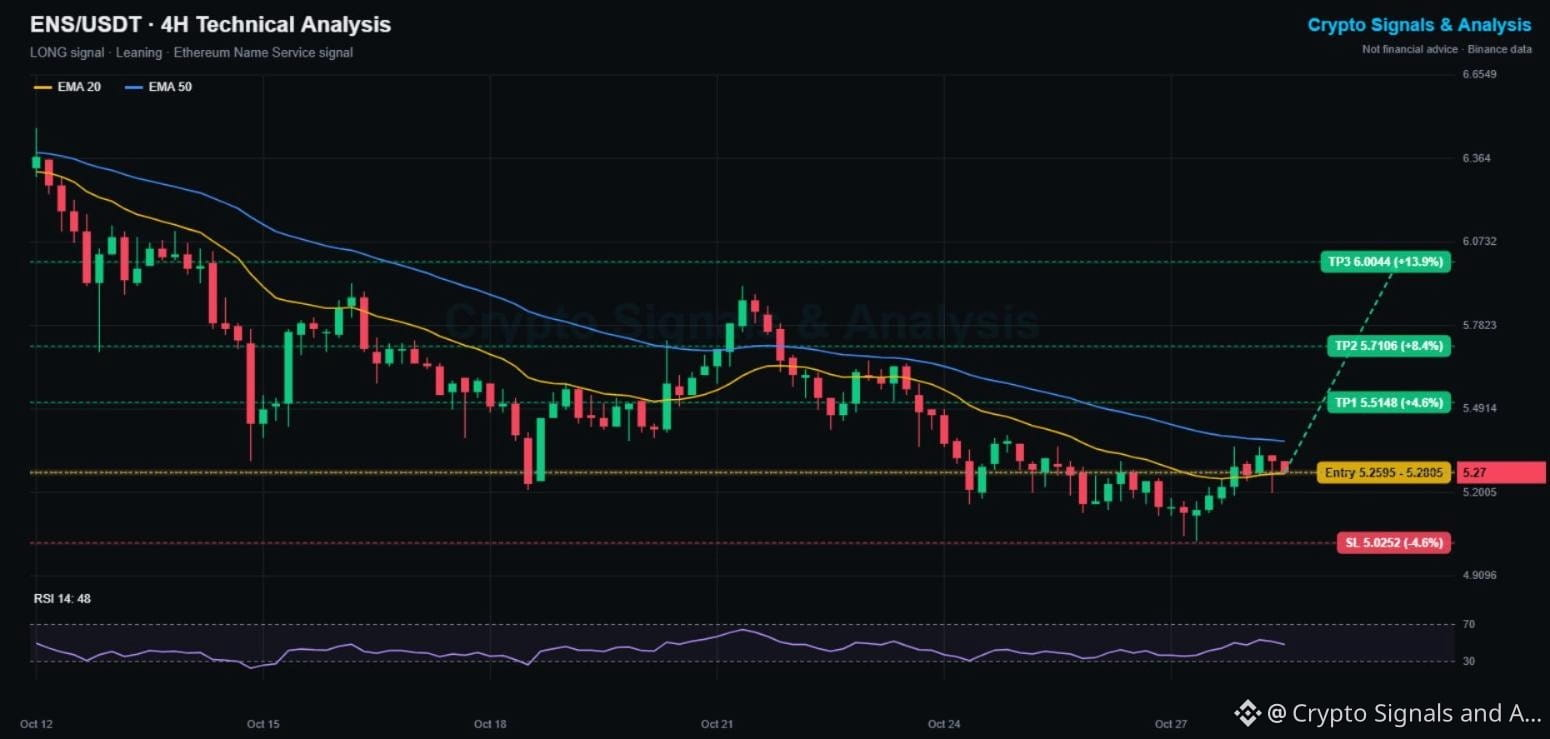
$ENS Ethereum Name Service: Kursprognose für heute – Krypto-Signal & technische Analyse 📊
🟢 LONG | Einstieg 5.260–5.281 | TP1 5.515 | SL 5.025
👉 Tippe auf $ENS , um schnell einen Trade zu platzieren
ENS hat nach einem Rückgang von 22 % von 6.47 bei 5.03 einen Boden gefunden, und die letzten 3 Kerzen zeigen ein höheres Tief. Der Kurs hat gerade seinen 4H-EMA20 zurückerobert und zieht sich nun zurück, um ihn erneut zu testen.
📌 ENS-TRADING-SIGNAL (Tendenz: frühes Umkehr-Setup)
Einstieg: 5.260–5.281
Take-Profit 1: 5.515 (+4.6%)
Take-Profit 2: 5.711 (+8.4%)
Take-Profit 3: 6.004 (+13.9%)
Stop-Loss: 5.025 (-4.6%)
📊 TECHNISCHE ENS-ANALYSE (4H-CHART)
Der EMA20 (5.266) beginnt sich nach oben zu drehen. Der fallende EMA50 (5.379) ist die Bestätigungslinie und hat seit dem 12. Okt. jede Rallye begrenzt. Der RSI bei 48 ist neutral. Ein Schlusskurs über 5.38 wäre der erste Durchbruch über den EMA50 seit mehr als zwei Wochen.
🔑 WICHTIGE NIVEAUS
Unterstützung: 5.266 (EMA20), danach 5.03
Widerstand: 5.379 (EMA50), danach 5.51
📈 Bullishes Szenario: Ein 4H-Schlusskurs über 5.38 bestätigt die Umkehr und eröffnet den Weg zu TP2 und TP3.
📉 Bearishes Szenario: Eine erneute Zurückweisung am EMA50 schickt ENS zurück auf 5.03. Ein Schlusskurs unter 5.025 macht dieses Signal ungültig.
💡 Fazit: eine frühe Umkehr mit engem Stop unter dem Boden. Der EMA50 entscheidet über den Trade.
👉 Tippe auf $ENS ,
um den Live-Chart zu öffnen. Keine Finanzberatung.
🔥 HANDLE MIT NIEDRIGEREN GEBÜHREN
✅ Erhalte lebenslang 20 % Cashback auf deine Binance-Handelsgebühren
👇👇👇
{spot}(ENSUSDT)
[Claim your 20% Binance fee kickback here](https://www.binance.com/register?ref=X0NQWZ4N)
━━━━━━━━━━
Besitzt du einen .eth-Namen? Schreib es unten in die Kommentare 👇
Folge Crypto Signals and Analysis für tägliche Signale.
#cryptosignals #ENS #EarningsSeason
⚠️ Kryptowährungen sind volatil: Setze nur, was du dir leisten kannst zu verlieren.
$ENS Ethereum Name Service: Kursprognose für heute – Krypto-Signal & technische Analyse 📊
🟢 LONG | Einstieg 5.260–5.281 | TP1 5.515 | SL 5.025
👉 Tippe auf $ENS , um schnell einen Trade zu platzieren
ENS hat nach einem Rückgang von 22 % von 6.47 bei 5.03 einen Boden gefunden, und die letzten 3 Kerzen zeigen ein höheres Tief. Der Kurs hat gerade seinen 4H-EMA20 zurückerobert und zieht sich nun zurück, um ihn erneut zu testen.
📌 ENS-TRADING-SIGNAL (Tendenz: frühes Umkehr-Setup)
Einstieg: 5.260–5.281
Take-Profit 1: 5.515 (+4.6%)
Take-Profit 2: 5.711 (+8.4%)
Take-Profit 3: 6.004 (+13.9%)
Stop-Loss: 5.025 (-4.6%)
📊 TECHNISCHE ENS-ANALYSE (4H-CHART)
Der EMA20 (5.266) beginnt sich nach oben zu drehen. Der fallende EMA50 (5.379) ist die Bestätigungslinie und hat seit dem 12. Okt. jede Rallye begrenzt. Der RSI bei 48 ist neutral. Ein Schlusskurs über 5.38 wäre der erste Durchbruch über den EMA50 seit mehr als zwei Wochen.
🔑 WICHTIGE NIVEAUS
Unterstützung: 5.266 (EMA20), danach 5.03
Widerstand: 5.379 (EMA50), danach 5.51
📈 Bullishes Szenario: Ein 4H-Schlusskurs über 5.38 bestätigt die Umkehr und eröffnet den Weg zu TP2 und TP3.
📉 Bearishes Szenario: Eine erneute Zurückweisung am EMA50 schickt ENS zurück auf 5.03. Ein Schlusskurs unter 5.025 macht dieses Signal ungültig.
💡 Fazit: eine frühe Umkehr mit engem Stop unter dem Boden. Der EMA50 entscheidet über den Trade.
👉 Tippe auf $ENS ,
um den Live-Chart zu öffnen. Keine Finanzberatung.
🔥 HANDLE MIT NIEDRIGEREN GEBÜHREN
✅ Erhalte lebenslang 20 % Cashback auf deine Binance-Handelsgebühren
👇👇👇
Claim your 20% Binance fee kickback here
━━━━━━━━━━
Besitzt du einen .eth-Namen? Schreib es unten in die Kommentare 👇
Folge Crypto Signals and Analysis für tägliche Signale.
#cryptosignals #ENS #EarningsSeason
⚠️ Kryptowährungen sind volatil: Setze nur, was du dir leisten kannst zu verlieren.
1
23
·
--
Bärisch
Übersetzung ansehen
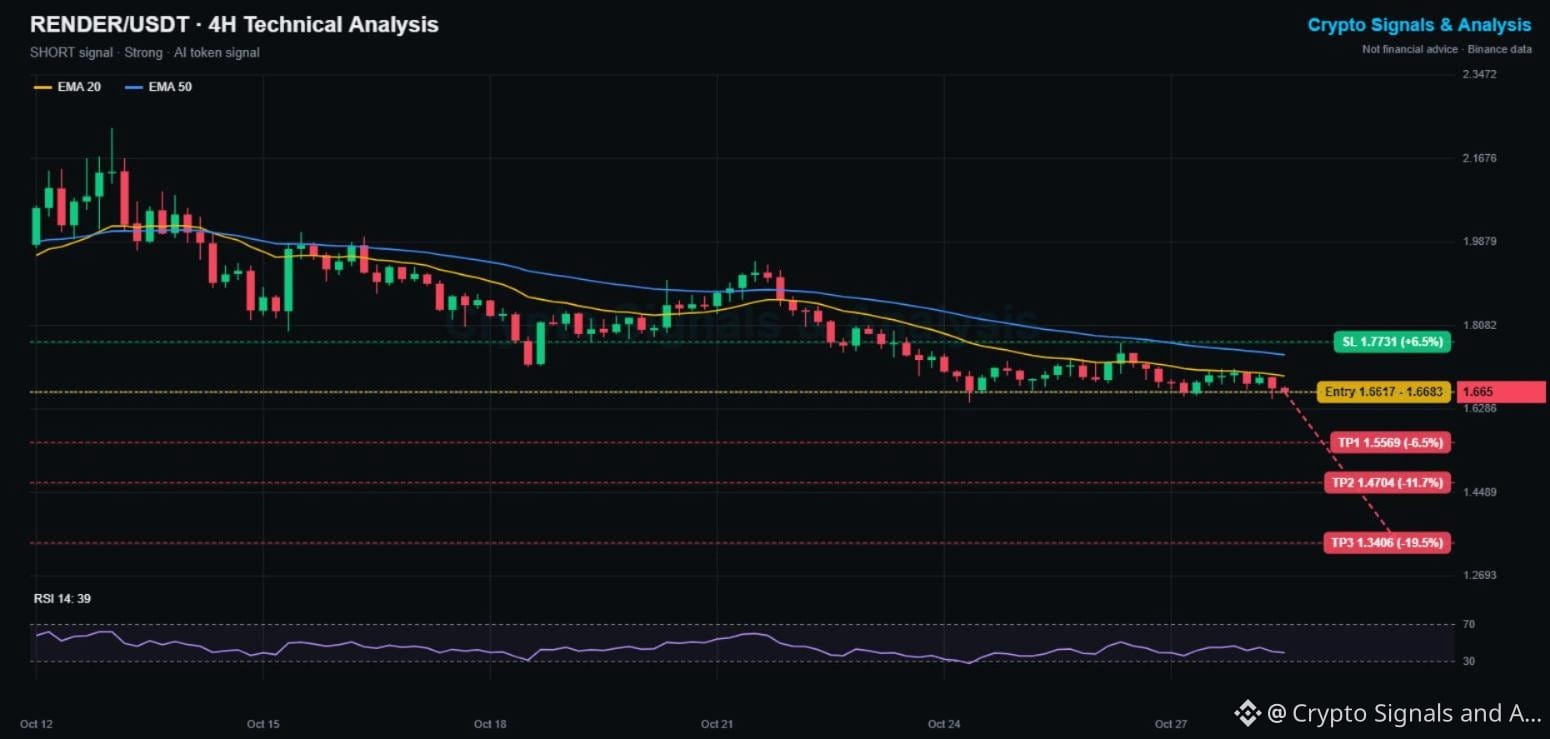
$RENDER Price Prediction Today: Render Crypto Signal & Technical Analysis 📊
🔴 SHORT | Entry 1.662 - 1.668 | TP1 1.557 | SL 1.773
👉 Tap $RENDER to place your trade fast
Render, the AI and GPU computing token, is down 13% this week and 25% since Oct 13 (from 2.23 to 1.65). It just slipped to a new low for the week, and the 4H EMAs keep pressing it lower.
📌 RENDER TRADING SIGNAL (Strong, 5/5 signals agree)
Entry: 1.662 - 1.668
Take profit 1: 1.557 (-6.5%)
Take profit 2: 1.470 (-11.7%)
Take profit 3: 1.341 (-19.5%)
Stop loss: 1.773 (+6.5%)
📊 RENDER TECHNICAL ANALYSIS (4H CHART)
Price is under the EMA20 (1.700) and EMA50 (1.745), both are falling, and RSI at 39 shows sellers in control. The 1.643 to 1.65 zone is the last support from Oct 24. A clean break below it has no nearby floor until the 1.50s.
🔑 KEY LEVELS
Support: 1.643, then 1.557
Resistance: 1.700 (EMA20), then 1.771
📈 Bullish scenario: a 4H close above 1.773 breaks the downtrend and cancels the short.
📉 Bearish scenario: a close under 1.643 confirms the breakdown toward TP1 and TP2.
💡 Bottom line: AI tokens are the weakest sector this week, and Render's trend is clearly down.
👉 Tap $RENDER
to open the live chart. NFA
🔥 TRADE WITH LOWER FEES
✅ Get a 20% kickback on your Binance trading fees, for life
👇👇👇
{spot}(RENDERUSDT)
[Claim your 20% Binance fee kickback here](https://www.binance.com/register?ref=X0NQWZ4N)
━━━━━━━━━━
AI crypto sell-off: buying opportunity or warning sign? 👇
Follow Crypto Signals and Analysis for daily signals.
#cryptosignals #RENDER #CanGoogleDefendItsCore
⚠️ Crypto is volatile: risk only what you can afford to lose.
$RENDER Price Prediction Today: Render Crypto Signal & Technical Analysis 📊
🔴 SHORT | Entry 1.662 - 1.668 | TP1 1.557 | SL 1.773
👉 Tap $RENDER to place your trade fast
Render, the AI and GPU computing token, is down 13% this week and 25% since Oct 13 (from 2.23 to 1.65). It just slipped to a new low for the week, and the 4H EMAs keep pressing it lower.
📌 RENDER TRADING SIGNAL (Strong, 5/5 signals agree)
Entry: 1.662 - 1.668
Take profit 1: 1.557 (-6.5%)
Take profit 2: 1.470 (-11.7%)
Take profit 3: 1.341 (-19.5%)
Stop loss: 1.773 (+6.5%)
📊 RENDER TECHNICAL ANALYSIS (4H CHART)
Price is under the EMA20 (1.700) and EMA50 (1.745), both are falling, and RSI at 39 shows sellers in control. The 1.643 to 1.65 zone is the last support from Oct 24. A clean break below it has no nearby floor until the 1.50s.
🔑 KEY LEVELS
Support: 1.643, then 1.557
Resistance: 1.700 (EMA20), then 1.771
📈 Bullish scenario: a 4H close above 1.773 breaks the downtrend and cancels the short.
📉 Bearish scenario: a close under 1.643 confirms the breakdown toward TP1 and TP2.
💡 Bottom line: AI tokens are the weakest sector this week, and Render's trend is clearly down.
👉 Tap $RENDER
to open the live chart. NFA
🔥 TRADE WITH LOWER FEES
✅ Get a 20% kickback on your Binance trading fees, for life
👇👇👇
Claim your 20% Binance fee kickback here
━━━━━━━━━━
AI crypto sell-off: buying opportunity or warning sign? 👇
Follow Crypto Signals and Analysis for daily signals.
#cryptosignals #RENDER #CanGoogleDefendItsCore
⚠️ Crypto is volatile: risk only what you can afford to lose.
29
·
--
Bärisch
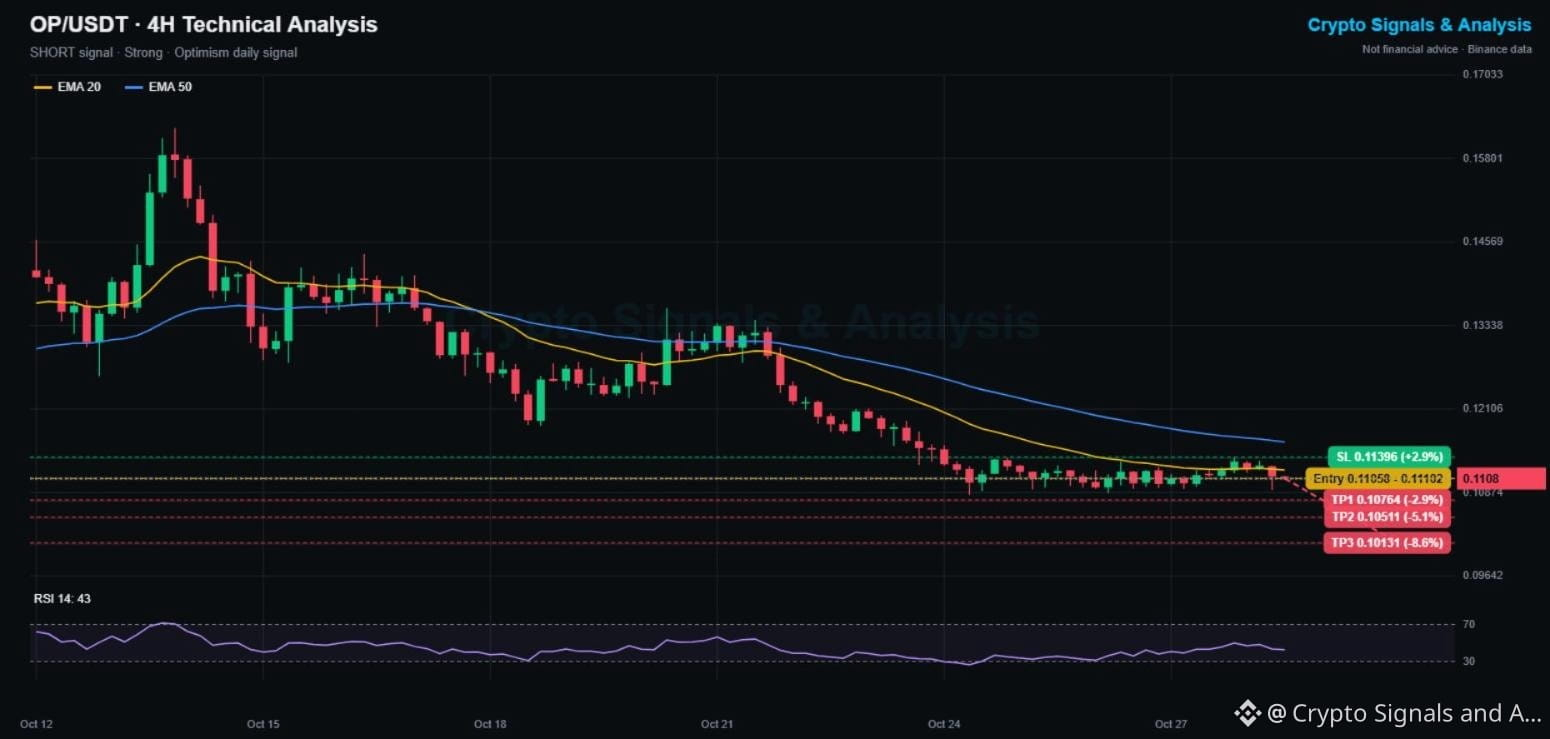
$OP Kursprognose für heute: Optimism-Kryptosignal & technische Analyse 📊
🔴 SHORT | Einstieg 0.1106 - 0.1110 | TP1 0.1076 | SL 0.1140
👉 Tippe auf $OP , um schnell deinen Trade zu platzieren
Optimism ist seit seinem Höchststand am 14. Okt. bei 0.1625 um 33 % eingebrochen und liegt diese Woche 16 % im Minus. Seit 5 Tagen bewegt sich der Kurs seitwärts zwischen 0.108 und 0.114, wobei der fallende 4-Stunden-EMA20 ihn jedes Mal nach oben begrenzt.
📌 OPTIMISM-TRADING-SIGNAL (stark, 5/5 Signale stimmen überein)
Einstieg: 0.1106 - 0.1110
Take-Profit 1: 0.1076 (-2.9 %)
Take-Profit 2: 0.1051 (-5.1 %)
Take-Profit 3: 0.1013 (-8.6 %)
Stop-Loss: 0.1140 (+2.9 %)
📊 TECHNISCHE OP-ANALYSE (4-STUNDEN-CHART)
OP notiert unter dem EMA20 (0.1121) und dem EMA50 (0.1162), die beide nach unten tendieren. Der RSI bei 43 deutet auf schwache Kaufbereitschaft hin. Die Tiefs bei 0.1084 bis 0.1087 sind entscheidend. Darunter ist die psychologisch wichtige Marke von 0.10 das nächste Kursziel.
🔑 WICHTIGE KURSLEVELS
Unterstützung: 0.1084, dann 0.1050
Widerstand: 0.1121 (EMA20), dann 0.1139
📈 Bullisches Szenario: Ein 4-Stunden-Schlusskurs über 0.1140 durchbricht die Handelsspanne und macht das Short-Signal hinfällig.
📉 Bärisches Szenario: Fällt der Kurs unter 0.1084, rücken TP2 und die runde Marke von 0.10 in Reichweite.
💡 Fazit: Optimism sucht weiterhin nach einem Boden. Geringe Volatilität, enger Stop-Loss, klare Richtung.
👉 Tippe auf $OP ,
um den Live-Chart zu öffnen. Keine Finanzberatung.
🔥 HANDELN MIT NIEDRIGEREN GEBÜHREN
✅ Erhalte lebenslang 20 % Cashback auf deine Binance-Handelsgebühren
👇👇👇
{spot}(OPUSDT)
[Claim your 20% Binance fee kickback here](https://www.binance.com/register?ref=X0NQWZ4N)
━━━━━━━━━━
Hält Optimism die Marke von 0.10, oder kommt ein neues Tief? 👇
Folge Crypto Signals and Analysis für tägliche Signale.
#cryptosignals #OP #CanMicrosoftDeliverOnAI
⚠️ Kryptowährungen sind volatil: Setze nur so viel aufs Spiel, wie du dir leisten kannst zu verlieren.
$OP Kursprognose für heute: Optimism-Kryptosignal & technische Analyse 📊
🔴 SHORT | Einstieg 0.1106 - 0.1110 | TP1 0.1076 | SL 0.1140
👉 Tippe auf $OP , um schnell deinen Trade zu platzieren
Optimism ist seit seinem Höchststand am 14. Okt. bei 0.1625 um 33 % eingebrochen und liegt diese Woche 16 % im Minus. Seit 5 Tagen bewegt sich der Kurs seitwärts zwischen 0.108 und 0.114, wobei der fallende 4-Stunden-EMA20 ihn jedes Mal nach oben begrenzt.
📌 OPTIMISM-TRADING-SIGNAL (stark, 5/5 Signale stimmen überein)
Einstieg: 0.1106 - 0.1110
Take-Profit 1: 0.1076 (-2.9 %)
Take-Profit 2: 0.1051 (-5.1 %)
Take-Profit 3: 0.1013 (-8.6 %)
Stop-Loss: 0.1140 (+2.9 %)
📊 TECHNISCHE OP-ANALYSE (4-STUNDEN-CHART)
OP notiert unter dem EMA20 (0.1121) und dem EMA50 (0.1162), die beide nach unten tendieren. Der RSI bei 43 deutet auf schwache Kaufbereitschaft hin. Die Tiefs bei 0.1084 bis 0.1087 sind entscheidend. Darunter ist die psychologisch wichtige Marke von 0.10 das nächste Kursziel.
🔑 WICHTIGE KURSLEVELS
Unterstützung: 0.1084, dann 0.1050
Widerstand: 0.1121 (EMA20), dann 0.1139
📈 Bullisches Szenario: Ein 4-Stunden-Schlusskurs über 0.1140 durchbricht die Handelsspanne und macht das Short-Signal hinfällig.
📉 Bärisches Szenario: Fällt der Kurs unter 0.1084, rücken TP2 und die runde Marke von 0.10 in Reichweite.
💡 Fazit: Optimism sucht weiterhin nach einem Boden. Geringe Volatilität, enger Stop-Loss, klare Richtung.
👉 Tippe auf $OP ,
um den Live-Chart zu öffnen. Keine Finanzberatung.
🔥 HANDELN MIT NIEDRIGEREN GEBÜHREN
✅ Erhalte lebenslang 20 % Cashback auf deine Binance-Handelsgebühren
👇👇👇
Claim your 20% Binance fee kickback here
━━━━━━━━━━
Hält Optimism die Marke von 0.10, oder kommt ein neues Tief? 👇
Folge Crypto Signals and Analysis für tägliche Signale.
#cryptosignals #OP #CanMicrosoftDeliverOnAI
⚠️ Kryptowährungen sind volatil: Setze nur so viel aufs Spiel, wie du dir leisten kannst zu verlieren.
147
·
--
Bullisch
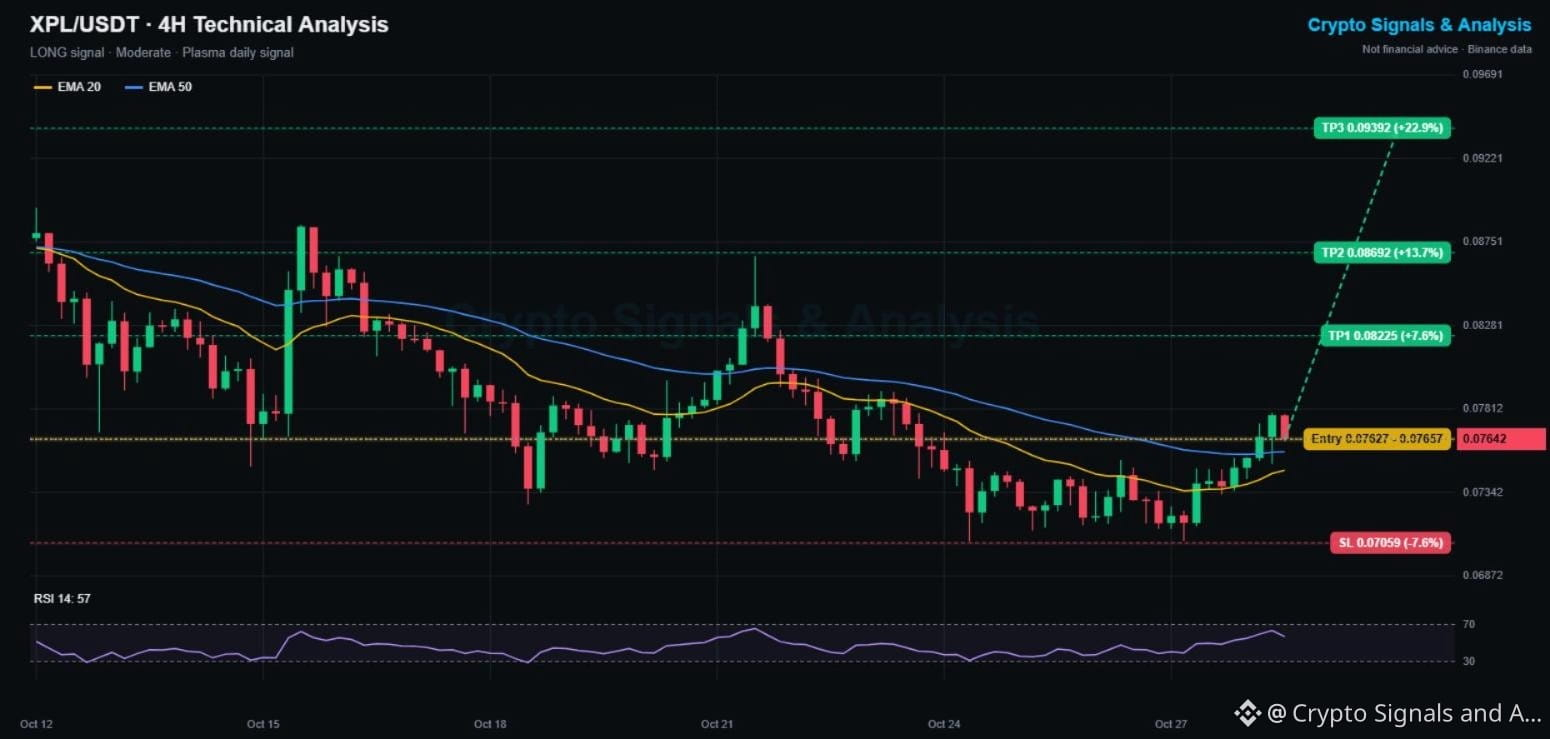
$XPL Kursprognose heute: Plasma-Kryptosignal & technische Analyse 📊
🟢 LONG | Einstieg 0.07627–0.07657 | TP1 0.08225 | SL 0.07059
👉 Tippe auf $XPL , um schnell deinen Trade zu platzieren
Plasma, die auf Stablecoins ausgerichtete Blockchain, legt heute um 3.2 % zu und ist zum ersten Mal seit dem 22. Okt. über ihren 4H-EMA50 gestiegen. Der Kurs hielt sich an einem Doppelboden bei 0.0707 und dreht nun den Trend.
📌 PLASMA-TRADING-SIGNAL (moderat, 4/5 Signale stimmen überein)
Einstieg: 0.07627–0.07657
Take-Profit 1: 0.08225 (+7.6 %)
Take-Profit 2: 0.08692 (+13.7 %)
Take-Profit 3: 0.09392 (+22.9 %)
Stop-Loss: 0.07059 (-7.6 %)
📊 XPL-TECHNISCHE ANALYSE (4H-CHART)
Der Kurs liegt über dem EMA20 (0.0747) und dem EMA50 (0.0757), und der EMA20 biegt nach oben ab und nähert sich einem bullischen Cross. Der RSI bei 57 spricht für Käufer. Das jüngste Hoch bei 0.0779 ist der erste Prüfpunkt. Darüber liegt die Spike-Zone vom 21. Okt. bei 0.082 bis 0.087 als wichtigstes Kursziel.
🔑 WICHTIGE NIVEAUS
Unterstützung: 0.0757 (EMA50), danach 0.0707
Widerstand: 0.0779, danach 0.0822
📈 Bullisches Szenario: Ein 4H-Schlusskurs über 0.0779 bestätigt den Ausbruch und richtet den Blick auf TP1 und TP2.
📉 Bärisches Szenario: Fällt der Kurs unter den EMA50, könnte sich der Ausbruch als Fehlausbruch erweisen. Ein Schlusskurs unter 0.07059 macht dieses Signal ungültig.
💡 Fazit: Ein Doppelboden zusammen mit der Rückeroberung des EMA50 ist ein solides Setup für einen frühen Trendbeginn.
👉 Tippe auf $XPL ,
um den Live-Chart zu öffnen. Keine Anlageberatung
🔥 HANDELN MIT NIEDRIGEREN GEBÜHREN
✅ Erhalte lebenslang 20 % Rückvergütung auf deine Binance-Handelsgebühren
👇👇👇
{spot}(XPLUSDT)
[Claim your 20% Binance fee kickback here](https://www.binance.com/register?ref=X0NQWZ4N)
━━━━━━━━━━
Stablecoin-Chains: das nächste große Narrativ? Was denkst du? 👇
Folge Crypto Signals and Analysis für tägliche Signale.
#cryptosignals #XPL #EarningsSeason
⚠️ Kryptowährungen sind volatil: Setze nur Geld ein, dessen Verlust du dir leisten kannst.
$XPL Kursprognose heute: Plasma-Kryptosignal & technische Analyse 📊
🟢 LONG | Einstieg 0.07627–0.07657 | TP1 0.08225 | SL 0.07059
👉 Tippe auf $XPL , um schnell deinen Trade zu platzieren
Plasma, die auf Stablecoins ausgerichtete Blockchain, legt heute um 3.2 % zu und ist zum ersten Mal seit dem 22. Okt. über ihren 4H-EMA50 gestiegen. Der Kurs hielt sich an einem Doppelboden bei 0.0707 und dreht nun den Trend.
📌 PLASMA-TRADING-SIGNAL (moderat, 4/5 Signale stimmen überein)
Einstieg: 0.07627–0.07657
Take-Profit 1: 0.08225 (+7.6 %)
Take-Profit 2: 0.08692 (+13.7 %)
Take-Profit 3: 0.09392 (+22.9 %)
Stop-Loss: 0.07059 (-7.6 %)
📊 XPL-TECHNISCHE ANALYSE (4H-CHART)
Der Kurs liegt über dem EMA20 (0.0747) und dem EMA50 (0.0757), und der EMA20 biegt nach oben ab und nähert sich einem bullischen Cross. Der RSI bei 57 spricht für Käufer. Das jüngste Hoch bei 0.0779 ist der erste Prüfpunkt. Darüber liegt die Spike-Zone vom 21. Okt. bei 0.082 bis 0.087 als wichtigstes Kursziel.
🔑 WICHTIGE NIVEAUS
Unterstützung: 0.0757 (EMA50), danach 0.0707
Widerstand: 0.0779, danach 0.0822
📈 Bullisches Szenario: Ein 4H-Schlusskurs über 0.0779 bestätigt den Ausbruch und richtet den Blick auf TP1 und TP2.
📉 Bärisches Szenario: Fällt der Kurs unter den EMA50, könnte sich der Ausbruch als Fehlausbruch erweisen. Ein Schlusskurs unter 0.07059 macht dieses Signal ungültig.
💡 Fazit: Ein Doppelboden zusammen mit der Rückeroberung des EMA50 ist ein solides Setup für einen frühen Trendbeginn.
👉 Tippe auf $XPL ,
um den Live-Chart zu öffnen. Keine Anlageberatung
🔥 HANDELN MIT NIEDRIGEREN GEBÜHREN
✅ Erhalte lebenslang 20 % Rückvergütung auf deine Binance-Handelsgebühren
👇👇👇
Claim your 20% Binance fee kickback here
━━━━━━━━━━
Stablecoin-Chains: das nächste große Narrativ? Was denkst du? 👇
Folge Crypto Signals and Analysis für tägliche Signale.
#cryptosignals #XPL #EarningsSeason
⚠️ Kryptowährungen sind volatil: Setze nur Geld ein, dessen Verlust du dir leisten kannst.
163
·
--
Bullisch
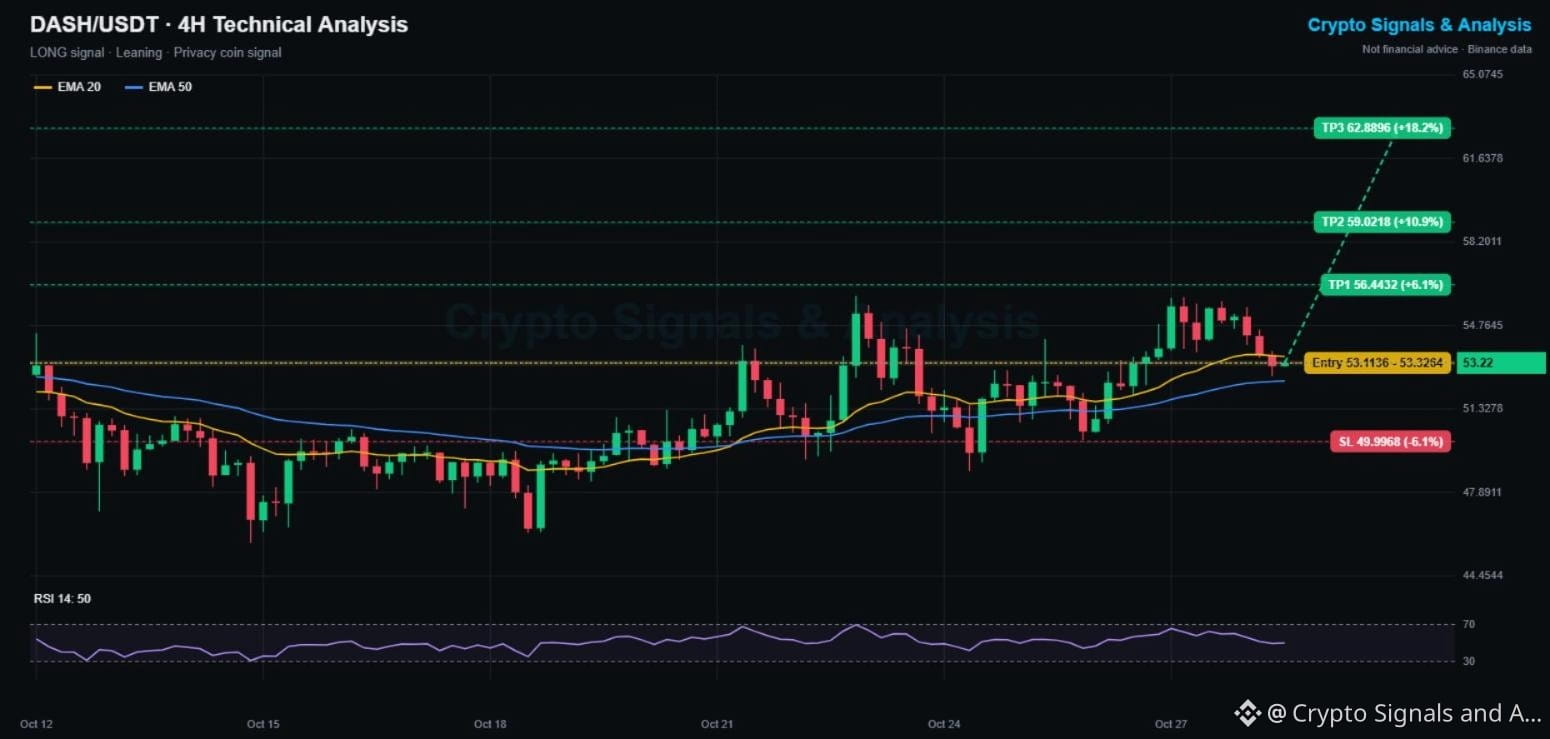
$DASH Kursprognose heute: Dash-Krypto-Signal & technische Analyse 📊
🟢 LONG | Einstieg 53.11–53.33 | TP1 56.44 | SL 50.00
👉 Tippe auf $DASH , um schnell deinen Trade zu platzieren
Dash gehört wie Zcash zu den wenigen Coins, die diesen Monat einen Aufwärtstrend verzeichnen. Seit dem 19. Okt. bilden sich höhere Tiefs (45.8, dann 49.0, dann 50.0). Nach einem heutigen Rücksetzer von 4 % liegt der Kurs genau auf dem steigenden 4H-EMA50 – einer klassischen Zone, um den Dip zu kaufen.
📌 DASH-TRADING-SIGNAL (Tendenz: Rücksetzer in einem Aufwärtstrend)
Einstieg: 53.11–53.33
Kursziel 1: 56.44 (+6.1 %)
Kursziel 2: 59.02 (+10.9 %)
Kursziel 3: 62.89 (+18.2 %)
Stop-Loss: 50.00 (-6.1 %)
📊 TECHNISCHE DASH-ANALYSE (4H-CHART)
Der übergeordnete Trend zeigt nach oben: Der EMA50 (52.49) steigt, und der Kurs liegt seit dem 21. Okt. darüber. Der kurzfristige Rücksetzer drückte den Kurs knapp unter den EMA20 (53.49), und der RSI fiel auf 50 zurück. Das Hoch bei 55.9 (Bereich eines Doppeltopps) ist der entscheidende Ausbruchspunkt.
🔑 WICHTIGE KURSLEVELS
Unterstützung: 52.49 (EMA50), danach 50.06
Widerstand: 53.49 (EMA20), danach 55.92
📈 Bullisches Szenario: Eine Erholung am EMA50 und ein Schlusskurs über 55.9 eröffnen den Weg zu TP2 und TP3.
📉 Bärisches Szenario: Ein Unterschreiten des EMA50 bringt den Aufwärtstrend in Gefahr. Ein Schlusskurs unter 50.00 macht dieses Signal ungültig.
💡 Fazit: Privacy-Coins entwickeln sich diesen Monat besser als der Markt. Dies ist ein Dip-Kauf in einem Aufwärtstrend – mit einem klaren Stop-Loss.
👉 Tippe auf $DASH ,
um den Live-Chart zu öffnen. Keine Anlageberatung.
🔥 HANDLE MIT NIEDRIGEREN GEBÜHREN
✅ Erhalte lebenslang 20 % deiner Binance-Handelsgebühren zurück
👇👇👇
{spot}(DASHUSDT)
[Claim your 20% Binance fee kickback here](https://www.binance.com/register?ref=X0NQWZ4N)
━━━━━━━━━━
Zcash oder Dash: Für welchen Privacy-Coin entscheidest du dich? 👇
Folge Crypto Signals and Analysis für tägliche Signale.
#cryptosignals #DASH #CanGoogleDefendItsCore
⚠️ Kryptowährungen sind volatil: Setze nur so viel aufs Spiel, wie du dir leisten kannst zu verlieren.
$DASH Kursprognose heute: Dash-Krypto-Signal & technische Analyse 📊
🟢 LONG | Einstieg 53.11–53.33 | TP1 56.44 | SL 50.00
👉 Tippe auf $DASH , um schnell deinen Trade zu platzieren
Dash gehört wie Zcash zu den wenigen Coins, die diesen Monat einen Aufwärtstrend verzeichnen. Seit dem 19. Okt. bilden sich höhere Tiefs (45.8, dann 49.0, dann 50.0). Nach einem heutigen Rücksetzer von 4 % liegt der Kurs genau auf dem steigenden 4H-EMA50 – einer klassischen Zone, um den Dip zu kaufen.
📌 DASH-TRADING-SIGNAL (Tendenz: Rücksetzer in einem Aufwärtstrend)
Einstieg: 53.11–53.33
Kursziel 1: 56.44 (+6.1 %)
Kursziel 2: 59.02 (+10.9 %)
Kursziel 3: 62.89 (+18.2 %)
Stop-Loss: 50.00 (-6.1 %)
📊 TECHNISCHE DASH-ANALYSE (4H-CHART)
Der übergeordnete Trend zeigt nach oben: Der EMA50 (52.49) steigt, und der Kurs liegt seit dem 21. Okt. darüber. Der kurzfristige Rücksetzer drückte den Kurs knapp unter den EMA20 (53.49), und der RSI fiel auf 50 zurück. Das Hoch bei 55.9 (Bereich eines Doppeltopps) ist der entscheidende Ausbruchspunkt.
🔑 WICHTIGE KURSLEVELS
Unterstützung: 52.49 (EMA50), danach 50.06
Widerstand: 53.49 (EMA20), danach 55.92
📈 Bullisches Szenario: Eine Erholung am EMA50 und ein Schlusskurs über 55.9 eröffnen den Weg zu TP2 und TP3.
📉 Bärisches Szenario: Ein Unterschreiten des EMA50 bringt den Aufwärtstrend in Gefahr. Ein Schlusskurs unter 50.00 macht dieses Signal ungültig.
💡 Fazit: Privacy-Coins entwickeln sich diesen Monat besser als der Markt. Dies ist ein Dip-Kauf in einem Aufwärtstrend – mit einem klaren Stop-Loss.
👉 Tippe auf $DASH ,
um den Live-Chart zu öffnen. Keine Anlageberatung.
🔥 HANDLE MIT NIEDRIGEREN GEBÜHREN
✅ Erhalte lebenslang 20 % deiner Binance-Handelsgebühren zurück
👇👇👇
Claim your 20% Binance fee kickback here
━━━━━━━━━━
Zcash oder Dash: Für welchen Privacy-Coin entscheidest du dich? 👇
Folge Crypto Signals and Analysis für tägliche Signale.
#cryptosignals #DASH #CanGoogleDefendItsCore
⚠️ Kryptowährungen sind volatil: Setze nur so viel aufs Spiel, wie du dir leisten kannst zu verlieren.
141
·
--
Bullisch
Übersetzung ansehen
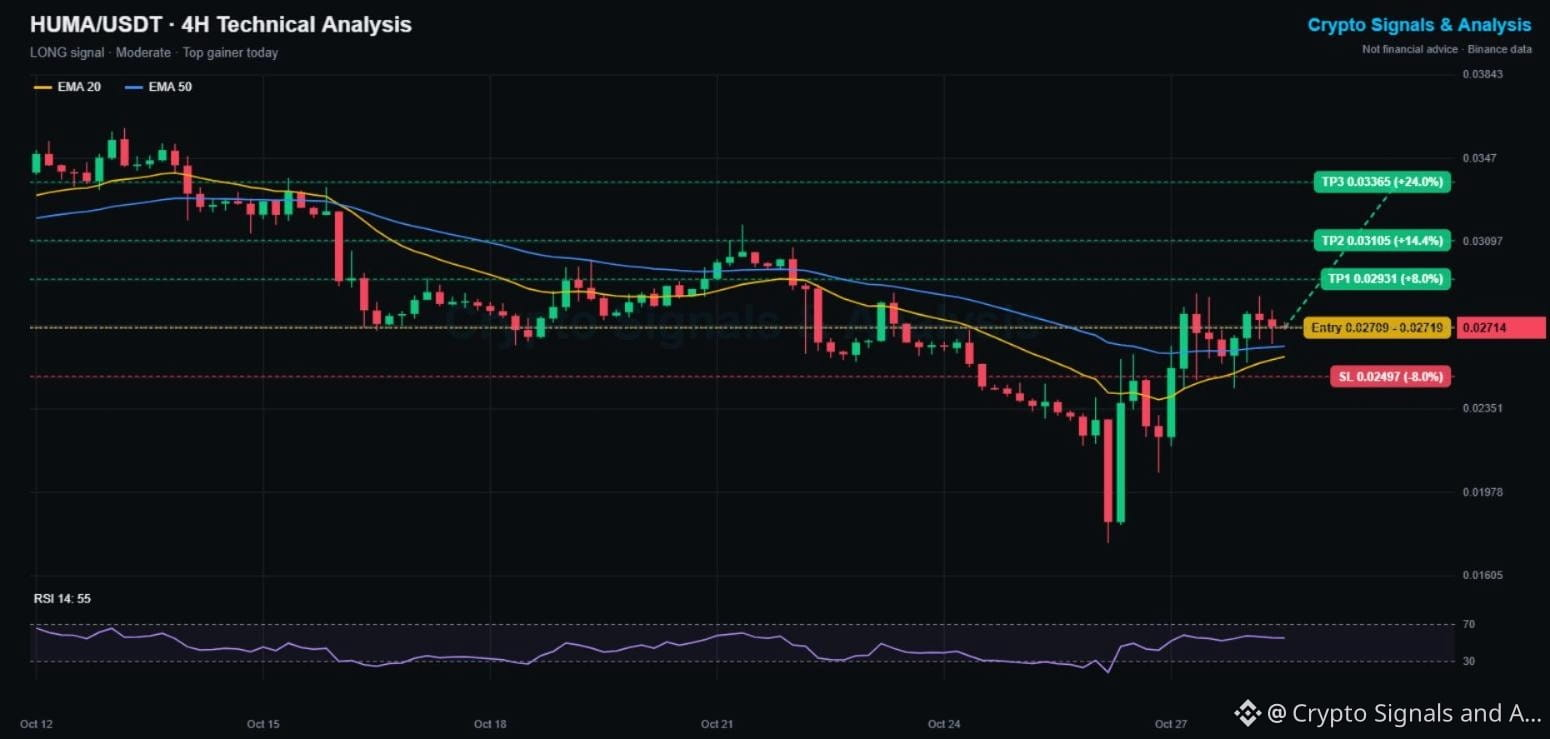
$HUMA Price Prediction Today: Huma Finance Crypto Signal & Technical Analysis 📊
🟢 LONG | Entry 0.02709 - 0.02719 | TP1 0.02931 | SL 0.02497
👉 Tap $HUMA to place your trade fast
Huma Finance printed a sharp V-bottom: a flush to 0.0175 on Oct 26, then a 55% rebound to 0.027. Price has now reclaimed both 4H EMAs and is holding above them, which shows buyers absorbing the dips.
📌 HUMA TRADING SIGNAL (Moderate, 4/5 signals agree)
Entry: 0.02709 - 0.02719
Take profit 1: 0.02931 (+8%)
Take profit 2: 0.03105 (+14%)
Take profit 3: 0.03365 (+24%)
Stop loss: 0.02497 (-8%)
📊 HUMA TECHNICAL ANALYSIS (4H CHART)
The EMA20 (0.0259) is rising toward a bullish cross with the EMA50 (0.0263). RSI at 55 has room to run. The 0.0287 high is the first barrier, and above it the Oct 21 high around 0.031 lines up with TP2.
🔑 KEY LEVELS
Support: 0.0263 (EMA50), then 0.0250
Resistance: 0.0287, then 0.0310
📈 Bullish scenario: a 4H close above 0.0287 confirms the reversal and opens TP2 and TP3.
📉 Bearish scenario: losing the EMAs sends HUMA back toward the 0.023 zone. A close under 0.02497 cancels this signal.
💡 Bottom line: V-bottoms are powerful when they hold. Keep the stop under the EMAs.
👉 Tap $HUMA
to open the live chart. NFA
🔥 TRADE WITH LOWER FEES
✅ Get a 20% kickback on your Binance trading fees, for life
👇👇👇
{spot}(HUMAUSDT)
[Claim your 20% Binance fee kickback here](https://www.binance.com/register?ref=X0NQWZ4N)
━━━━━━━━━━
Did you catch the Huma bounce, or are you waiting for a dip? 👇
Follow Crypto Signals and Analysis for daily signals.
#cryptosignals #HUMA #CanMicrosoftDeliverOnAI
⚠️ Crypto is volatile: risk only what you can afford to lose.
$HUMA Price Prediction Today: Huma Finance Crypto Signal & Technical Analysis 📊
🟢 LONG | Entry 0.02709 - 0.02719 | TP1 0.02931 | SL 0.02497
👉 Tap $HUMA to place your trade fast
Huma Finance printed a sharp V-bottom: a flush to 0.0175 on Oct 26, then a 55% rebound to 0.027. Price has now reclaimed both 4H EMAs and is holding above them, which shows buyers absorbing the dips.
📌 HUMA TRADING SIGNAL (Moderate, 4/5 signals agree)
Entry: 0.02709 - 0.02719
Take profit 1: 0.02931 (+8%)
Take profit 2: 0.03105 (+14%)
Take profit 3: 0.03365 (+24%)
Stop loss: 0.02497 (-8%)
📊 HUMA TECHNICAL ANALYSIS (4H CHART)
The EMA20 (0.0259) is rising toward a bullish cross with the EMA50 (0.0263). RSI at 55 has room to run. The 0.0287 high is the first barrier, and above it the Oct 21 high around 0.031 lines up with TP2.
🔑 KEY LEVELS
Support: 0.0263 (EMA50), then 0.0250
Resistance: 0.0287, then 0.0310
📈 Bullish scenario: a 4H close above 0.0287 confirms the reversal and opens TP2 and TP3.
📉 Bearish scenario: losing the EMAs sends HUMA back toward the 0.023 zone. A close under 0.02497 cancels this signal.
💡 Bottom line: V-bottoms are powerful when they hold. Keep the stop under the EMAs.
👉 Tap $HUMA
to open the live chart. NFA
🔥 TRADE WITH LOWER FEES
✅ Get a 20% kickback on your Binance trading fees, for life
👇👇👇
Claim your 20% Binance fee kickback here
━━━━━━━━━━
Did you catch the Huma bounce, or are you waiting for a dip? 👇
Follow Crypto Signals and Analysis for daily signals.
#cryptosignals #HUMA #CanMicrosoftDeliverOnAI
⚠️ Crypto is volatile: risk only what you can afford to lose.
38
·
--
Bärisch
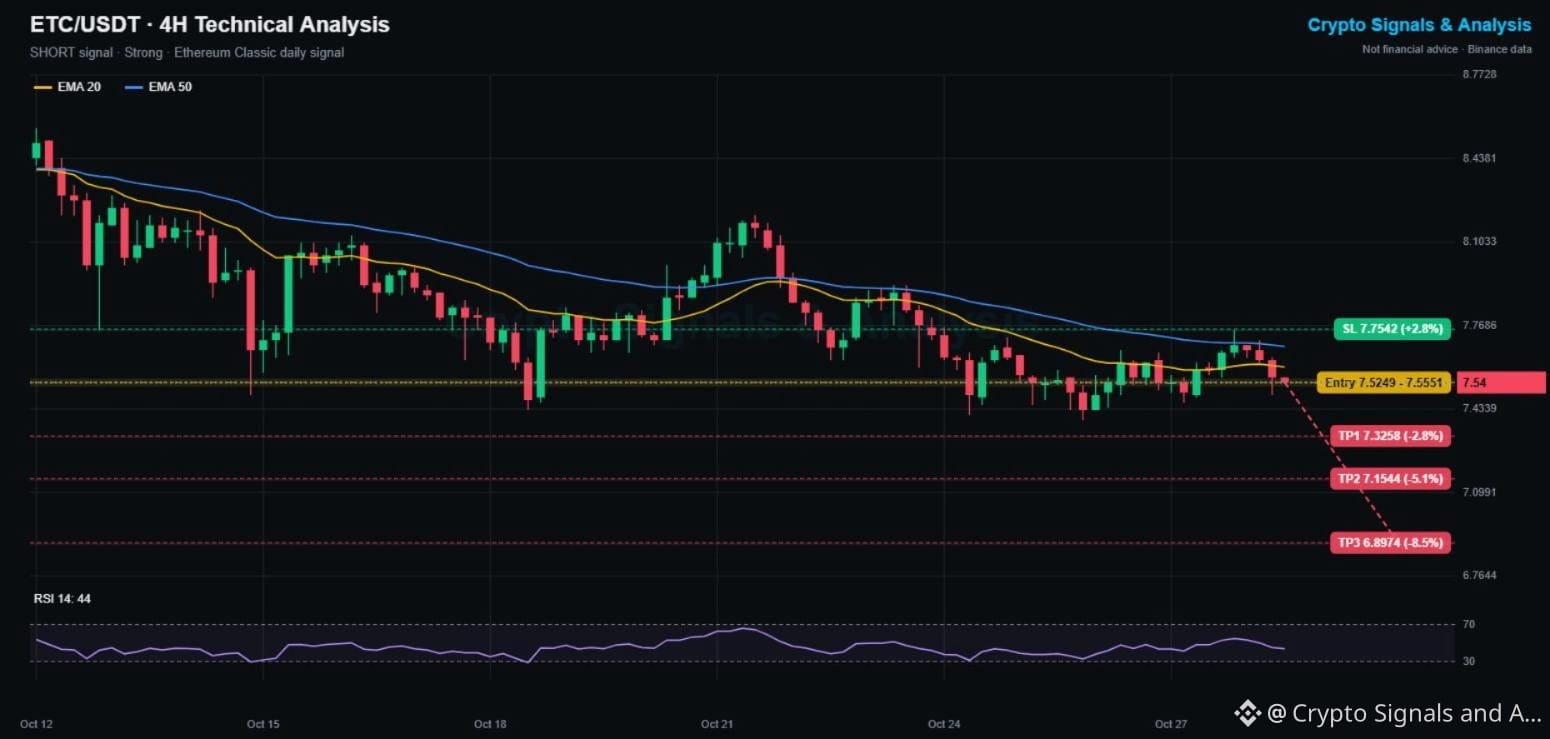
$ETC Ethereum Classic: Kursprognose für heute – Krypto-Signal & technische Analyse 📊
🔴 SHORT | Einstieg 7.525–7.555 | TP1 7.326 | SL 7.754
👉 Tippe auf $ETC , um schnell deinen Trade zu platzieren
Ethereum Classic testete gestern bei 7.75 seinen fallenden 4H-EMA50 und wurde erneut abgewiesen. Jetzt liegt der Kurs wieder unter beiden EMAs und bewegt sich auf das Wochentief bei 7.39 zu – ein Wochenminus von 7.6 %.
📌 ETHEREUM-CLASSIC-TRADING-SIGNAL (stark, 5/5 Signale stimmen überein)
Einstieg: 7.525–7.555
Take-Profit 1: 7.326 (-2.8 %)
Take-Profit 2: 7.154 (-5.1 %)
Take-Profit 3: 6.897 (-8.5 %)
Stop-Loss: 7.754 (+2.8 %)
📊 TECHNISCHE ANALYSE VON ETC (4H-CHART)
ETC ist seit dem 12. Oktober von 8.56 auf 7.39 gefallen. Dabei bildeten sich tiefere Hochs bei 8.2, 7.9 und 7.75. Der EMA20 (7.60) und der EMA50 (7.68) fallen und wirken als Widerstand. Der RSI bei 44 deutet auf eine bärische Tendenz hin. Ein Durchbruch unter 7.39 könnte den Bereich um 7.0 ins Spiel bringen.
🔑 WICHTIGE KURSNIVEAUS
Unterstützung: 7.39, danach 7.15
Widerstand: 7.60 (EMA20), danach 7.75
📈 Bullisches Szenario: Ein 4H-Schlusskurs über 7.754 durchbricht das Muster tieferer Hochs und macht das Short-Signal ungültig.
📉 Bärisches Szenario: Ein Schlusskurs unter 7.39 eröffnet den Weg zu TP2 und TP3.
💡 Fazit: Tiefere Hochs und fallende EMAs sprechen für einen Abwärtstrend. Short bei Erholungen in Richtung 7.6 bis 7.7.
👉 Tippe auf $ETC ,
um den Live-Chart zu öffnen. Keine Anlageberatung (NFA)
🔥 HANDLE MIT NIEDRIGEREN GEBÜHREN
✅ Erhalte lebenslang 20 % deiner Binance-Handelsgebühren zurück
👇👇👇
{spot}(ETCUSDT)
[Claim your 20% Binance fee kickback here](https://www.binance.com/register?ref=X0NQWZ4N)
━━━━━━━━━━
Erreicht Ethereum Classic zuerst 7 oder 8.5? Stimme unten ab 👇
Folge Crypto Signals and Analysis für tägliche Signale.
#cryptosignals #ETC #CanGoogleDefendItsCore
⚠️ Kryptowährungen sind volatil: Setze nur so viel aufs Spiel, wie du dir leisten kannst zu verlieren.
$ETC Ethereum Classic: Kursprognose für heute – Krypto-Signal & technische Analyse 📊
🔴 SHORT | Einstieg 7.525–7.555 | TP1 7.326 | SL 7.754
👉 Tippe auf $ETC , um schnell deinen Trade zu platzieren
Ethereum Classic testete gestern bei 7.75 seinen fallenden 4H-EMA50 und wurde erneut abgewiesen. Jetzt liegt der Kurs wieder unter beiden EMAs und bewegt sich auf das Wochentief bei 7.39 zu – ein Wochenminus von 7.6 %.
📌 ETHEREUM-CLASSIC-TRADING-SIGNAL (stark, 5/5 Signale stimmen überein)
Einstieg: 7.525–7.555
Take-Profit 1: 7.326 (-2.8 %)
Take-Profit 2: 7.154 (-5.1 %)
Take-Profit 3: 6.897 (-8.5 %)
Stop-Loss: 7.754 (+2.8 %)
📊 TECHNISCHE ANALYSE VON ETC (4H-CHART)
ETC ist seit dem 12. Oktober von 8.56 auf 7.39 gefallen. Dabei bildeten sich tiefere Hochs bei 8.2, 7.9 und 7.75. Der EMA20 (7.60) und der EMA50 (7.68) fallen und wirken als Widerstand. Der RSI bei 44 deutet auf eine bärische Tendenz hin. Ein Durchbruch unter 7.39 könnte den Bereich um 7.0 ins Spiel bringen.
🔑 WICHTIGE KURSNIVEAUS
Unterstützung: 7.39, danach 7.15
Widerstand: 7.60 (EMA20), danach 7.75
📈 Bullisches Szenario: Ein 4H-Schlusskurs über 7.754 durchbricht das Muster tieferer Hochs und macht das Short-Signal ungültig.
📉 Bärisches Szenario: Ein Schlusskurs unter 7.39 eröffnet den Weg zu TP2 und TP3.
💡 Fazit: Tiefere Hochs und fallende EMAs sprechen für einen Abwärtstrend. Short bei Erholungen in Richtung 7.6 bis 7.7.
👉 Tippe auf $ETC ,
um den Live-Chart zu öffnen. Keine Anlageberatung (NFA)
🔥 HANDLE MIT NIEDRIGEREN GEBÜHREN
✅ Erhalte lebenslang 20 % deiner Binance-Handelsgebühren zurück
👇👇👇
Claim your 20% Binance fee kickback here
━━━━━━━━━━
Erreicht Ethereum Classic zuerst 7 oder 8.5? Stimme unten ab 👇
Folge Crypto Signals and Analysis für tägliche Signale.
#cryptosignals #ETC #CanGoogleDefendItsCore
⚠️ Kryptowährungen sind volatil: Setze nur so viel aufs Spiel, wie du dir leisten kannst zu verlieren.
5
·
--
Bullisch
$TUT Preisprognose heute: Tutorial-Token-Kryptosignal & technische Analyse 📊
🟢 LONG | Einstieg 0.01977 - 0.01985 | TP1 0.02139 | SL 0.01823
👉 Tippe auf $TUT , um schnell deinen Trade zu platzieren
TUT, der Meme-Coin auf der BNB Chain, gehörte heute zu den größten Gewinnern. Er legte vom Tief bei 0.0167 um 25 % zu, stieg über beide 4H-EMAs und der EMA20 hat gerade den EMA50 von unten gekreuzt: ein frisches bullisches Kreuz.
📌 TUT-TRADING-SIGNAL (stark, alle 5/5 Signale stimmen überein)
Einstieg: 0.01977 - 0.01985
Take-Profit 1: 0.02139 (+8 %)
Take-Profit 2: 0.02266 (+14 %)
Take-Profit 3: 0.02456 (+24 %)
Stop-Loss: 0.01823 (-8 %)
📊 TUT-TECHNISCHE ANALYSE (4H-CHART)
Der Kurs hält sich deutlich über dem EMA20 (0.01865) und dem EMA50 (0.01852). Der RSI bei 63 ist stark, hat sich aber von 70 abgekühlt. Der Anstieg auf 0.0210 wurde teilweise abverkauft, daher ist vor dem nächsten Schub ein kleiner Rücksetzer in Richtung 0.0193 möglich. Das Hoch vom 12. Okt. bei 0.0226 ist das wichtigste Aufwärtsziel.
🔑 WICHTIGE NIVEAUS
Unterstützung: 0.0193, danach 0.01865 (EMA20)
Widerstand: 0.0210, danach 0.0226
📈 Bullisches Szenario: Ein 4H-Schlusskurs über 0.0210 eröffnet den Weg zu TP2 am Hoch vom 12. Okt.
📉 Bärisches Szenario: Fallen die EMAs, wäre der Ausbruch gescheitert. Ein Schlusskurs unter 0.01823 macht dieses Signal ungültig.
💡 Fazit: ein frischer Trendwechsel bei einem volatilen Meme-Coin. Kleine Positionsgröße wählen und bei TP1 Teilgewinne mitnehmen.
👉 Tippe auf $TUT
, um den Live-Chart zu öffnen. Keine Finanzberatung
🔥 HANDLE MIT NIEDRIGEREN GEBÜHREN
✅ Erhalte lebenslang 20 % Cashback auf deine Binance-Handelsgebühren
👇👇👇
{spot}(TUTUSDT)
[Claim your 20% Binance fee kickback here](https://www.binance.com/register?ref=X0NQWZ4N)
━━━━━━━━━━
Die Meme-Coins auf der BNB Chain erwachen. Welchen beobachtest du? 👇
Folge Crypto Signals and Analysis für tägliche Signale.
#cryptosignals #TUT #EarningsSeason
⚠️ Kryptowährungen sind volatil: Setze nur so viel aufs Spiel, wie du dir leisten kannst zu verlieren.
$TUT Preisprognose heute: Tutorial-Token-Kryptosignal & technische Analyse 📊
🟢 LONG | Einstieg 0.01977 - 0.01985 | TP1 0.02139 | SL 0.01823
👉 Tippe auf $TUT , um schnell deinen Trade zu platzieren
TUT, der Meme-Coin auf der BNB Chain, gehörte heute zu den größten Gewinnern. Er legte vom Tief bei 0.0167 um 25 % zu, stieg über beide 4H-EMAs und der EMA20 hat gerade den EMA50 von unten gekreuzt: ein frisches bullisches Kreuz.
📌 TUT-TRADING-SIGNAL (stark, alle 5/5 Signale stimmen überein)
Einstieg: 0.01977 - 0.01985
Take-Profit 1: 0.02139 (+8 %)
Take-Profit 2: 0.02266 (+14 %)
Take-Profit 3: 0.02456 (+24 %)
Stop-Loss: 0.01823 (-8 %)
📊 TUT-TECHNISCHE ANALYSE (4H-CHART)
Der Kurs hält sich deutlich über dem EMA20 (0.01865) und dem EMA50 (0.01852). Der RSI bei 63 ist stark, hat sich aber von 70 abgekühlt. Der Anstieg auf 0.0210 wurde teilweise abverkauft, daher ist vor dem nächsten Schub ein kleiner Rücksetzer in Richtung 0.0193 möglich. Das Hoch vom 12. Okt. bei 0.0226 ist das wichtigste Aufwärtsziel.
🔑 WICHTIGE NIVEAUS
Unterstützung: 0.0193, danach 0.01865 (EMA20)
Widerstand: 0.0210, danach 0.0226
📈 Bullisches Szenario: Ein 4H-Schlusskurs über 0.0210 eröffnet den Weg zu TP2 am Hoch vom 12. Okt.
📉 Bärisches Szenario: Fallen die EMAs, wäre der Ausbruch gescheitert. Ein Schlusskurs unter 0.01823 macht dieses Signal ungültig.
💡 Fazit: ein frischer Trendwechsel bei einem volatilen Meme-Coin. Kleine Positionsgröße wählen und bei TP1 Teilgewinne mitnehmen.
👉 Tippe auf $TUT
, um den Live-Chart zu öffnen. Keine Finanzberatung
🔥 HANDLE MIT NIEDRIGEREN GEBÜHREN
✅ Erhalte lebenslang 20 % Cashback auf deine Binance-Handelsgebühren
👇👇👇
Claim your 20% Binance fee kickback here
━━━━━━━━━━
Die Meme-Coins auf der BNB Chain erwachen. Welchen beobachtest du? 👇
Folge Crypto Signals and Analysis für tägliche Signale.
#cryptosignals #TUT #EarningsSeason
⚠️ Kryptowährungen sind volatil: Setze nur so viel aufs Spiel, wie du dir leisten kannst zu verlieren.
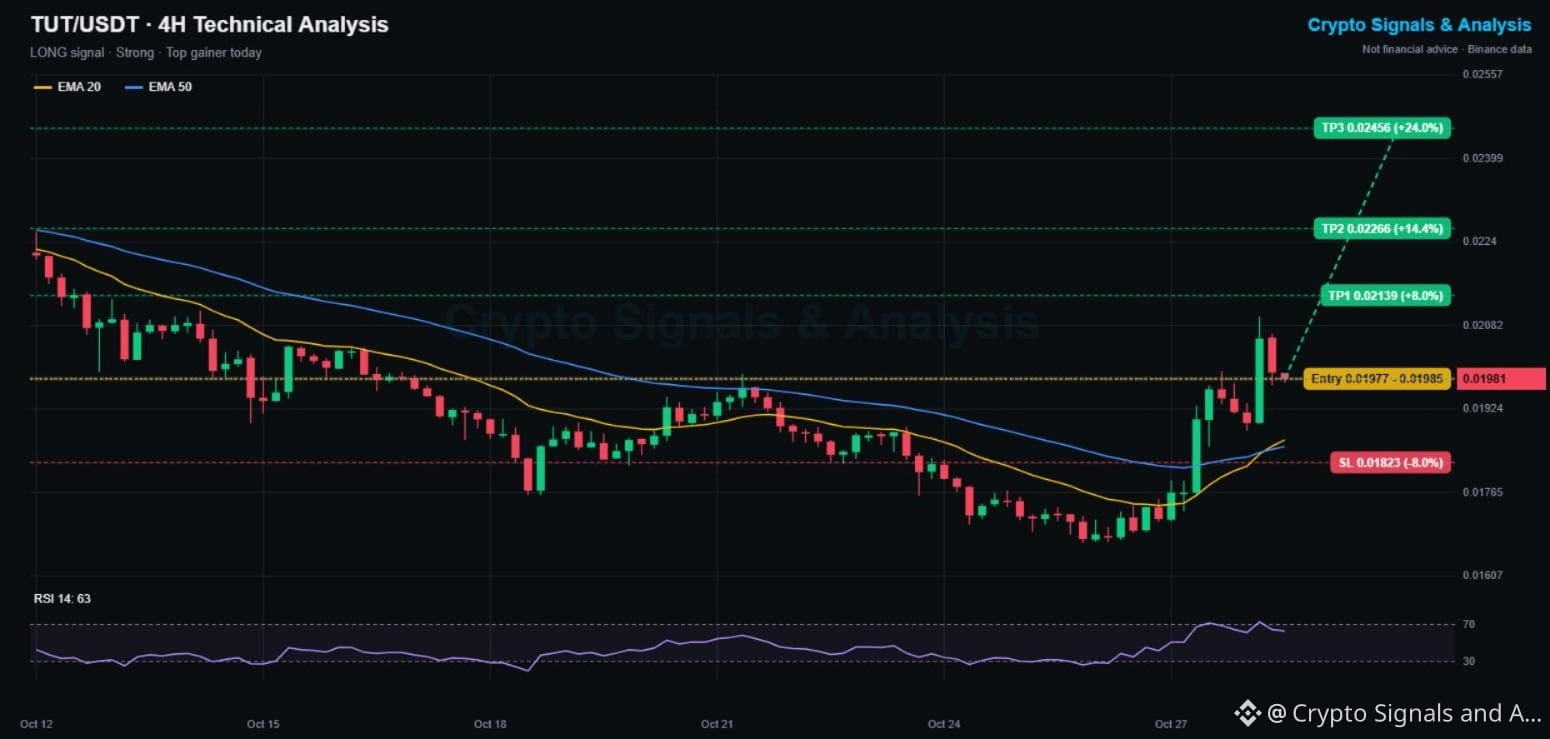
123
Anmelden und weiter Inhalte entdecken
Krypto-Nutzer weltweit auf Binance Square kennenlernen
⚡️ Bleib in Sachen Krypto stets am Puls.
💬 Die weltgrößte Kryptobörse vertraut darauf.
👍 Erhalte verlässliche Einblicke von verifizierten Creators.
E-Mail-Adresse/Telefonnummer
Trendthemen
CanMicrosoftDeliverOnAI
465,449 Aufrufe
3,377 Kommentare
Berichtssaison, Session 3: Übertreffen Google und Microsoft die Gewinnerwartungen?
Binance Square Official
·148 Likes
·81.6k Aufrufe
CanGoogleDefindItsCore
287,524 Aufrufe
2,383 Kommentare
EarningsSeason
6M Aufrufe
29,504 Kommentare