$GTC Price Prediction Today: Gitcoin Crypto Signal & Technical Analysis 📊
🔴 SHORT | Entry 0.2439 - 0.2449 | TP1 0.2248 | SL 0.2639
👉 Tap $GTC to place your trade fast
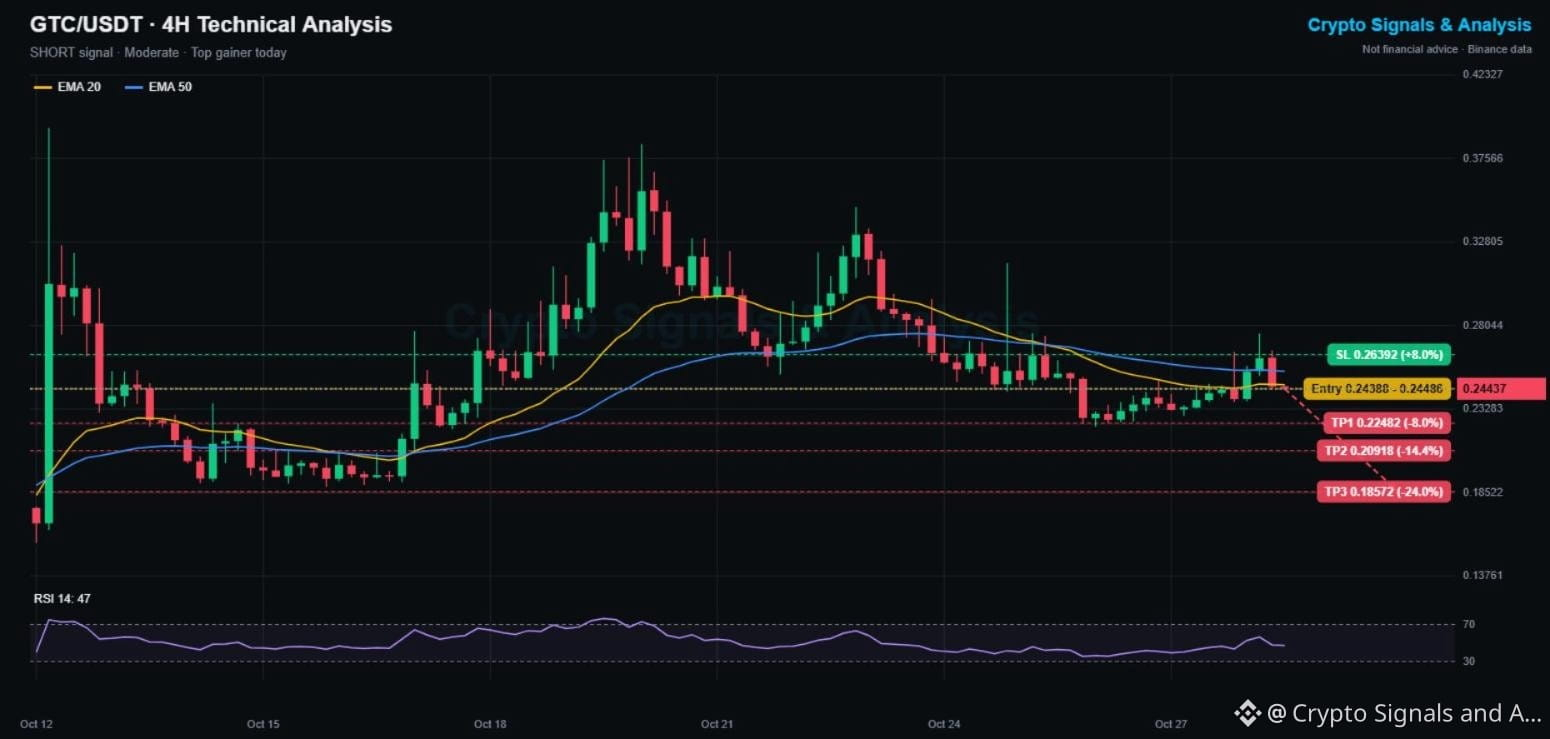
Gitcoin made the top gainers list earlier today with a spike to 0.276, but the move was sold hard right at the falling 4H EMA50. That long upper wick and the red candle that followed are classic signs of a failed breakout.
📌 GITCOIN TRADING SIGNAL (Moderate, failed breakout setup)
Entry: 0.2439 - 0.2449
Take profit 1: 0.2248 (-8%)
Take profit 2: 0.2092 (-14%)
Take profit 3: 0.1857 (-24%)
Stop loss: 0.2639 (+8%)
📊 GTC TECHNICAL ANALYSIS (4H CHART)
GTC peaked at 0.393 on Oct 12 and 0.38 on Oct 20. Since then it has made lower highs at 0.34, 0.31 and now 0.276. Price is back under the EMA20 (0.2467) and EMA50 (0.2544). RSI at 47 is neutral. The 0.2227 low from Oct 26 is the key support.
🔑 KEY LEVELS
Support: 0.2227, then 0.2090
Resistance: 0.2544 (EMA50), then 0.2758
📈 Bullish scenario: a 4H close above 0.2639 and the EMA50 cancels the short.
📉 Bearish scenario: losing 0.2227 opens TP2 and possibly TP3.
💡 Bottom line: top gainer lists can trap late buyers. This chart says the rally was sold.
👉 Tap $GTC
to open the live chart. NFA
🔥 TRADE WITH LOWER FEES
✅ Get a 20% kickback on your Binance trading fees, for life
👇👇👇
Claim your 20% Binance fee kickback here
━━━━━━━━━━
Do you chase top gainers or wait for the pullback? 👇
Follow Crypto Signals and Analysis for daily signals.
#cryptosignals #GTC #CanMicrosoftDeliverOnAI
⚠️ Crypto is volatile: risk only what you can afford to lose.