

Vani_Hassan
48 Beiträge

Vani_Hassan
Melden
Nutzer blockieren
0 Following
1 Follower
31 Like gegeben
Beiträge
Alle
Zitierungen
·
--
Übersetzung ansehen
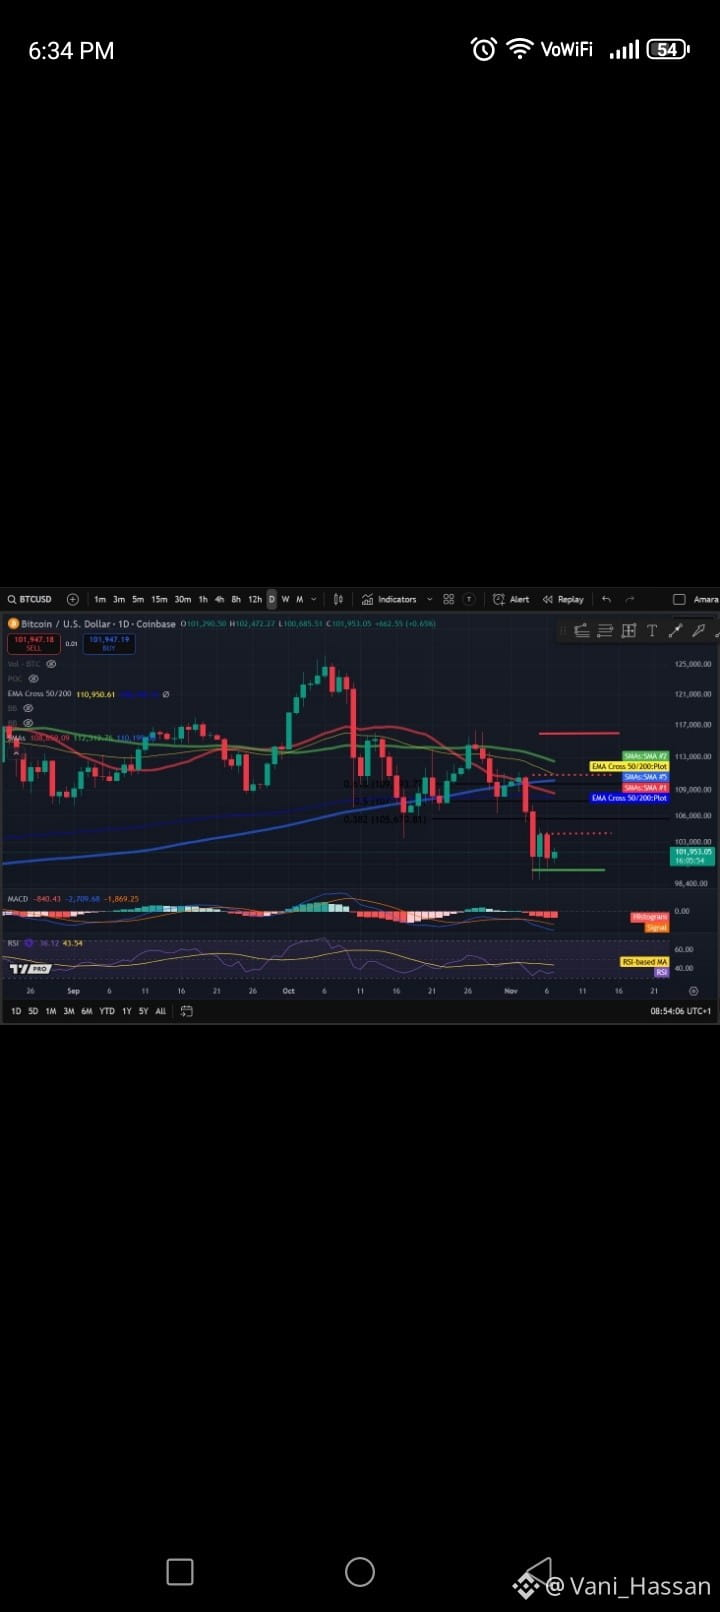
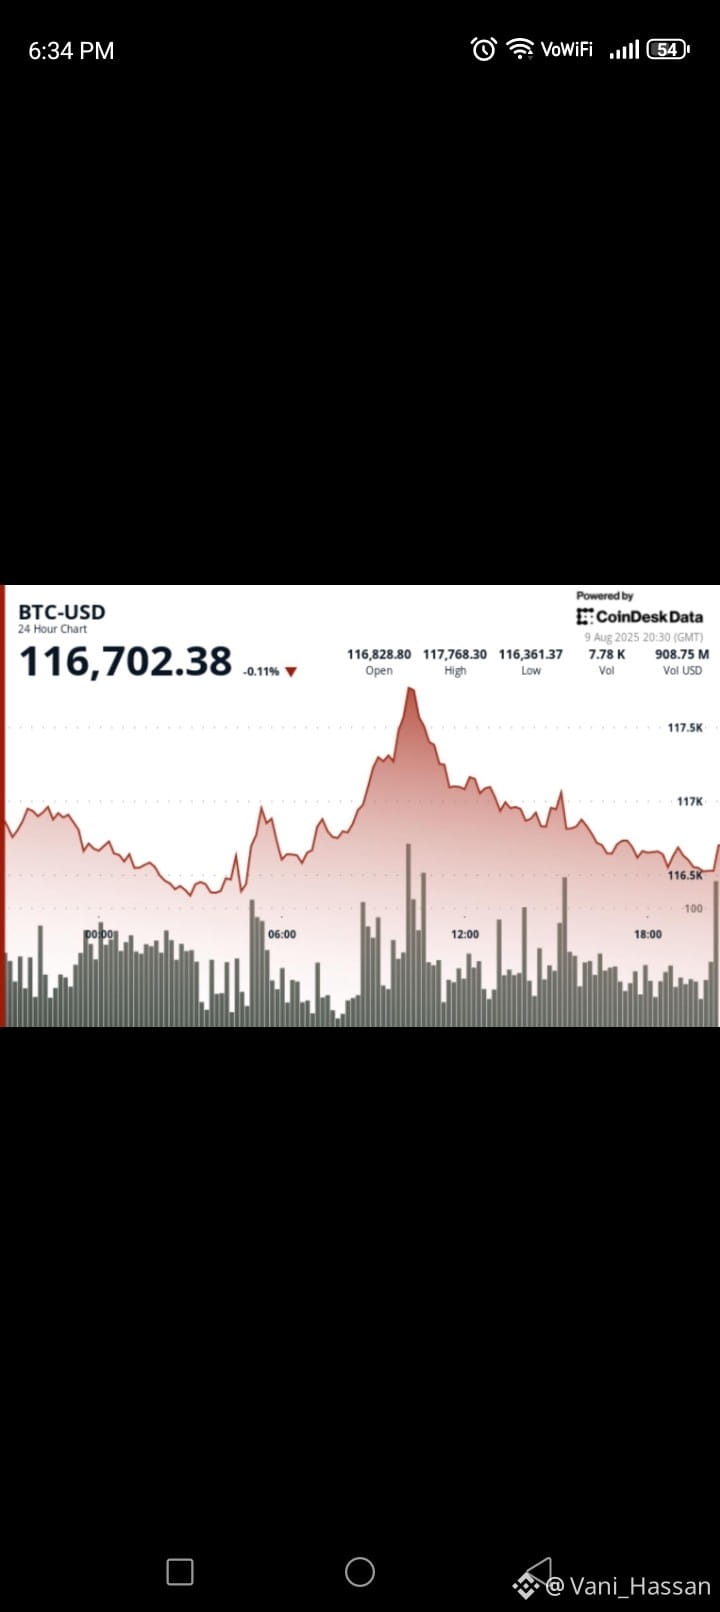
#$BTC — Today, October 2, 2026
Bitcoin (BTC) is trading around $84K–$86K, with today’s move showing renewed buying momentum. BTC briefly moved above $86,000, while traders are watching the U.S. jobs report and Treasury yields for the next major catalyst.
CoinDesk +1
Short analysis:
🔼 Resistance: ~$86,000–$87,000
🔽 Support: ~$82,000–$84,000
📈 Holding above $86K could strengthen short-term momentum.
⚠️ A rejection around $86K–$87K could bring another pullback.₿ $BTC — Today’s Graph
BTC is around $86,604, up about 2.9% in 24 hours. Today’s range is approximately $83,182–$86,794.
CoinGecko
Bitcoin $BTC — Today
BTC price range and current level for October 2, 2026.
BTC price
$86.6K
#NFPWatch #BitcoinFundingRateTriplesTo10% #ZcashFalls21%FromSeptemberPeak
1
58
·
--
Übersetzung ansehen
📊
📊
Vani_Hassan
·
--
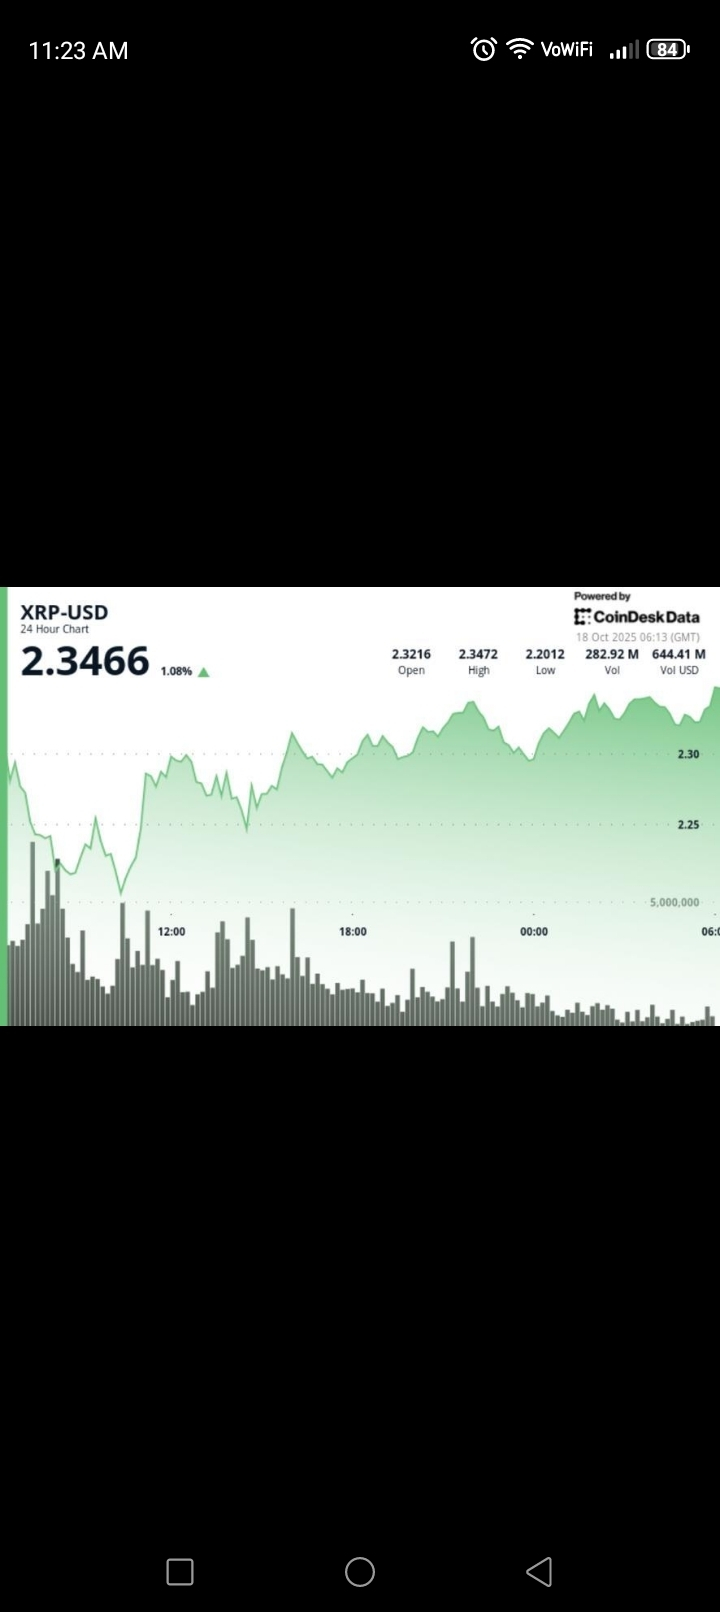
$XRP — Today (2 Oct 2026)
XRP is trading around $1.49–$1.51, with today’s movement relatively small.
CoinMarketCap +1
Short analysis: $XRP remains in a consolidation phase. Recent 7-day performance is slightly negative, while the 30-day trend is modestly positive, so price direction is still uncertain.
OKX
Key levels to watch:
🟢 Resistance: around $1.51–$1.55
🔴 Support: around $1.47–$1.48
📊 Above resistance could indicate stronger momentum; below support could increase selling pressure.
5
·
--
Übersetzung ansehen
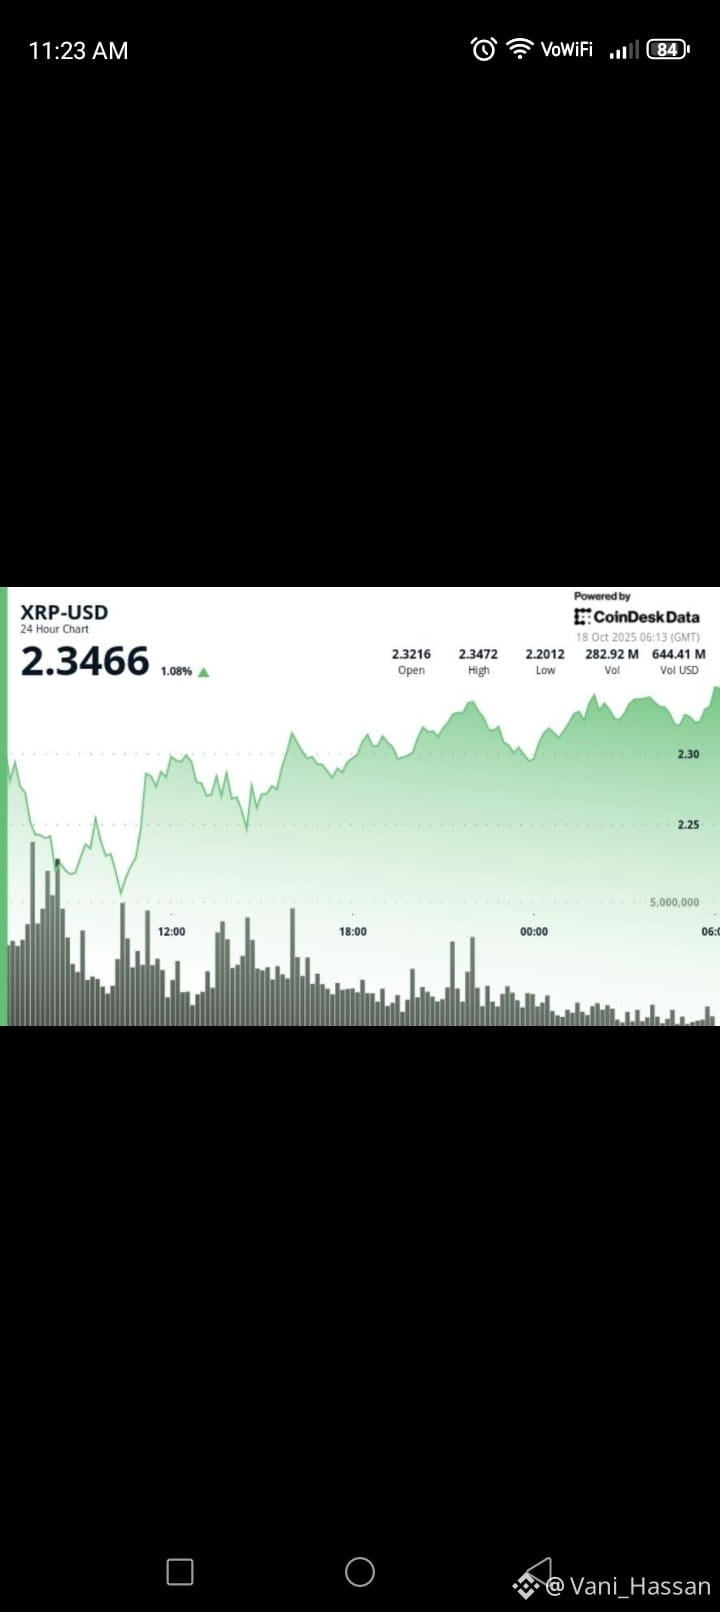
$XRP — Today (2 Oct 2026)
XRP is trading around $1.49–$1.51, with today’s movement relatively small.
CoinMarketCap +1
Short analysis: $XRP remains in a consolidation phase. Recent 7-day performance is slightly negative, while the 30-day trend is modestly positive, so price direction is still uncertain.
OKX
Key levels to watch:
🟢 Resistance: around $1.51–$1.55
🔴 Support: around $1.47–$1.48
📊 Above resistance could indicate stronger momentum; below support could increase selling pressure.
1
1
91
·
--
Übersetzung ansehen
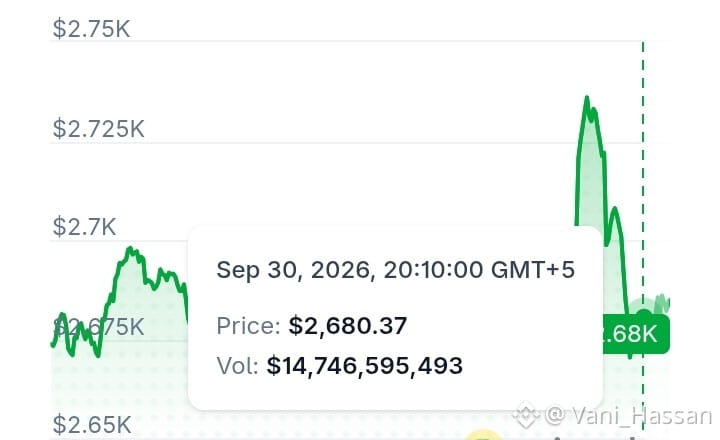
$ETH Today — 30 September 2026
Ethereum (ETH) is trading around $2,670–$2,680 today. CoinGecko reports about $2,676.80, with a 24-hour range of roughly $2,652–$2,743.
CoinGecko
Short analysis: $ETH is currently consolidating around $2,670. Short-term levels to watch are approximately $2,662 support and $2,686 resistance; a sustained move beyond either level could indicate the next direction.
The Cryptonomist
ETH price — recent daily trend
Ethereum daily closing prices, Sep 24–30, 2026.
$ETH price
$2670.17#AltcoinSeasonIndexHoldsAbove60For5Days #USADPAdds90000JobsInSeptember #USCorePCEEasesTo3%InAugust
49
·
--
Übersetzung ansehen
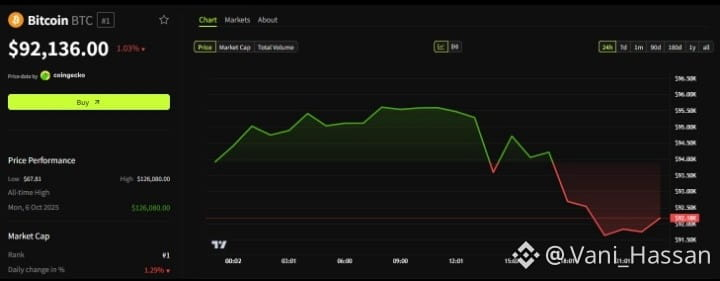
$BTC (Bitcoin) — 30 September 2026
Current price: around $83,600–$84,500, depending on the data source and exact time.
CoinGecko +1
Short analysis:
BTC recently reached around $87,400 before pulling back toward the $82K–$83K area.
CoinDesk +1
Support: roughly $82,000–$83,000.
Resistance: roughly $86,000–$87,400.
The broader trend has improved, but momentum has recently cooled; CoinDesk reports declining spot demand and increased profit-taking.
CoinDesk
A sustained move above the recent high would change the technical picture; losing the $82K area would increase downside risk. These are technical levels, not guaranteed predictions.
$BTC price trend — September 2026
Selected daily BTC closing prices from September 1–29, based on available historical market data.
$BTC price
$84.4K#AltcoinSeasonIndexHoldsAbove60For5Days #USADPAdds90000JobsInSeptember #USCorePCEEasesTo3%InAugust
106
·
--
Übersetzung ansehen
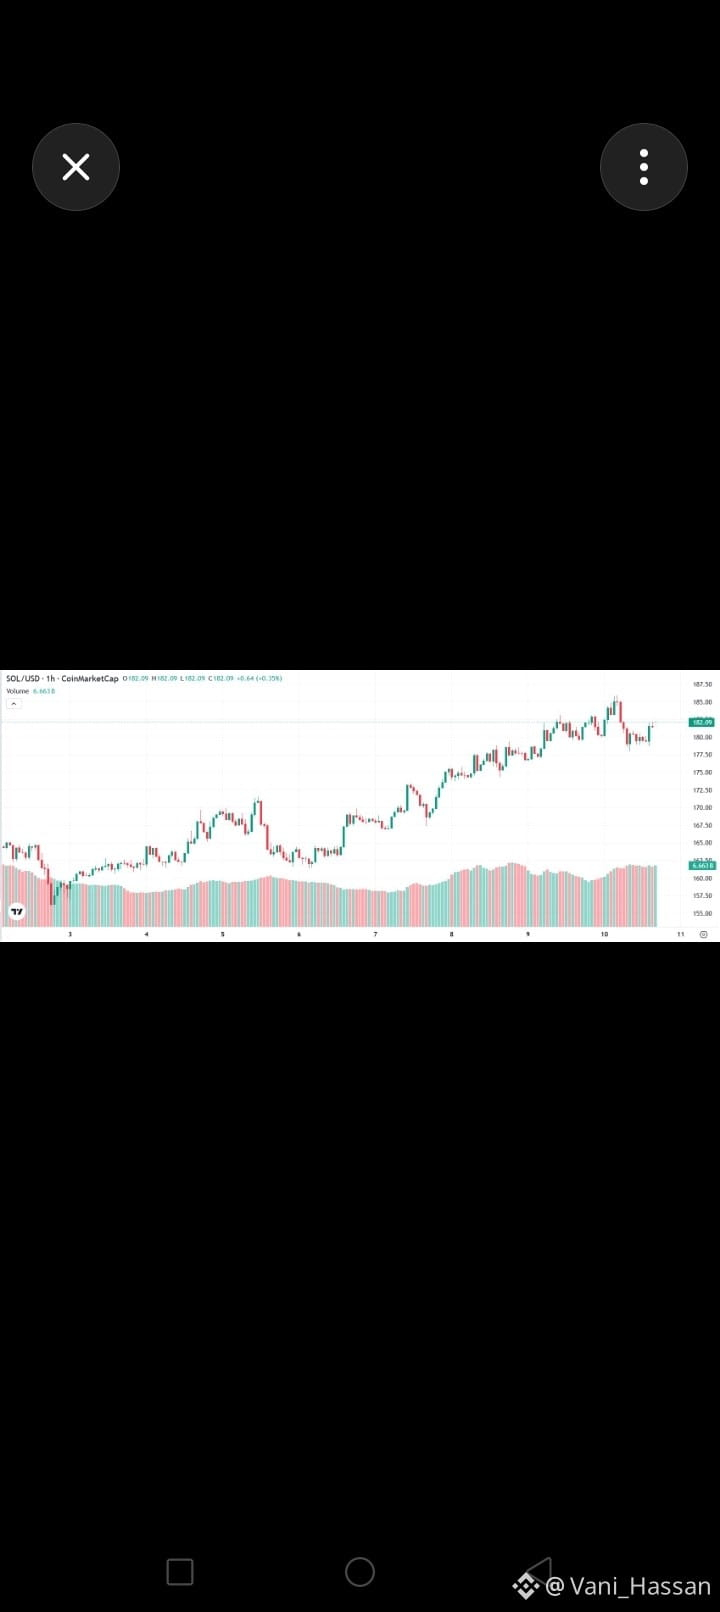
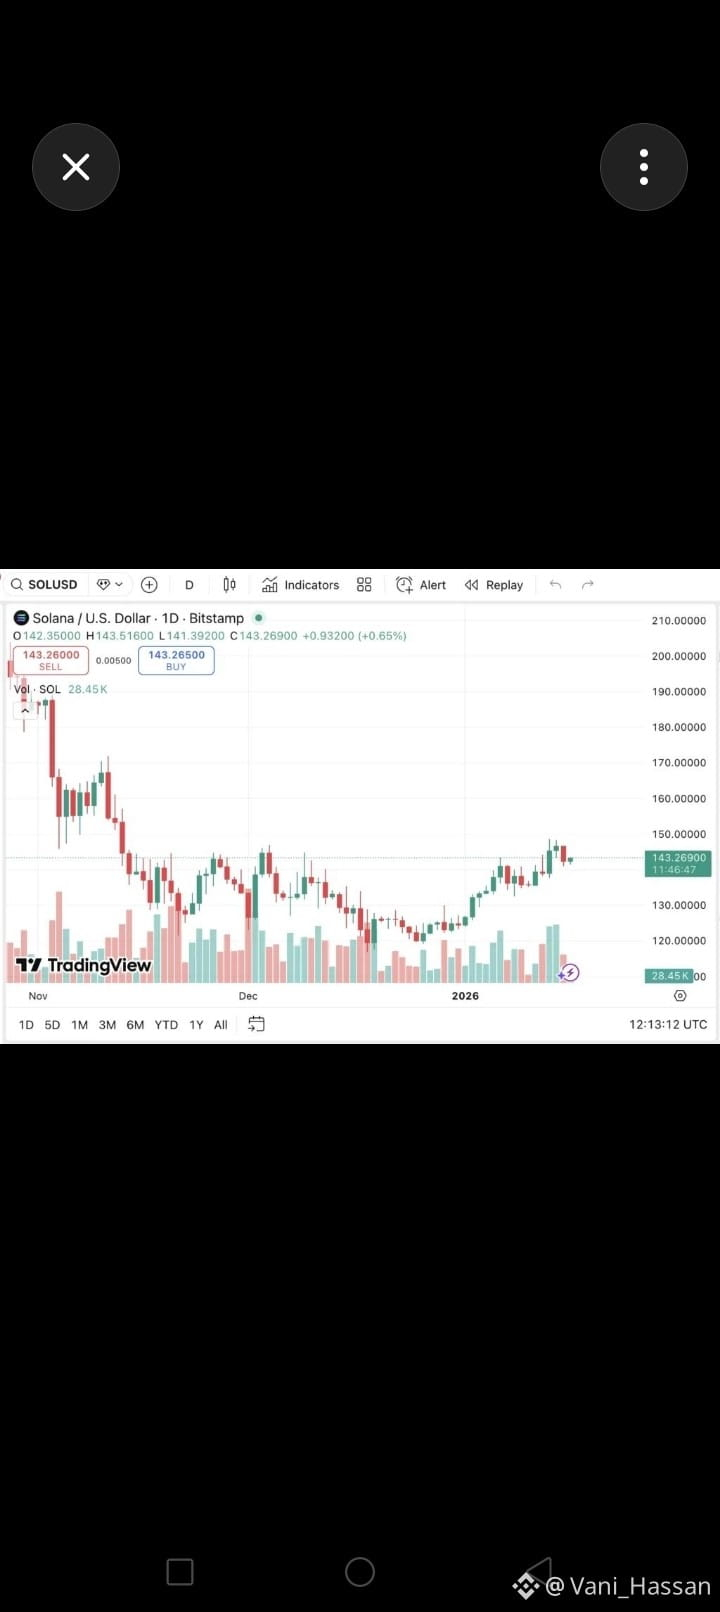
Solana (SOL) – Short Analysis (Today)
Current Market View:
Solana $SOL is trading around $76 and remains in a neutral-to-bullish short-term trend. Strong network activity and institutional interest continue to support the blockchain, but price is still facing resistance near $78.
CoinMarketCap +1
Technical Levels
Support: $74–75
Resistance: $78
Bullish target: $80 if resistance breaks
Bearish risk: A drop below $73 could lead to further downside toward the upper $60s.
CoinMarketCap
Overall Outlook:
Momentum is cautiously positive. Traders should watch whether $SOL can hold above the $74–75 support zone and break through $78 with strong trading volume. A confirmed breakout could strengthen the bullish trend, while losing support may increase selling pressure.
CoinMarketCap +1
#GrayscaleUrgesSenateVoteOnCLARITYAct #KOSPIWorstMonthlyDropSince2008
76
·
--
Übersetzung ansehen
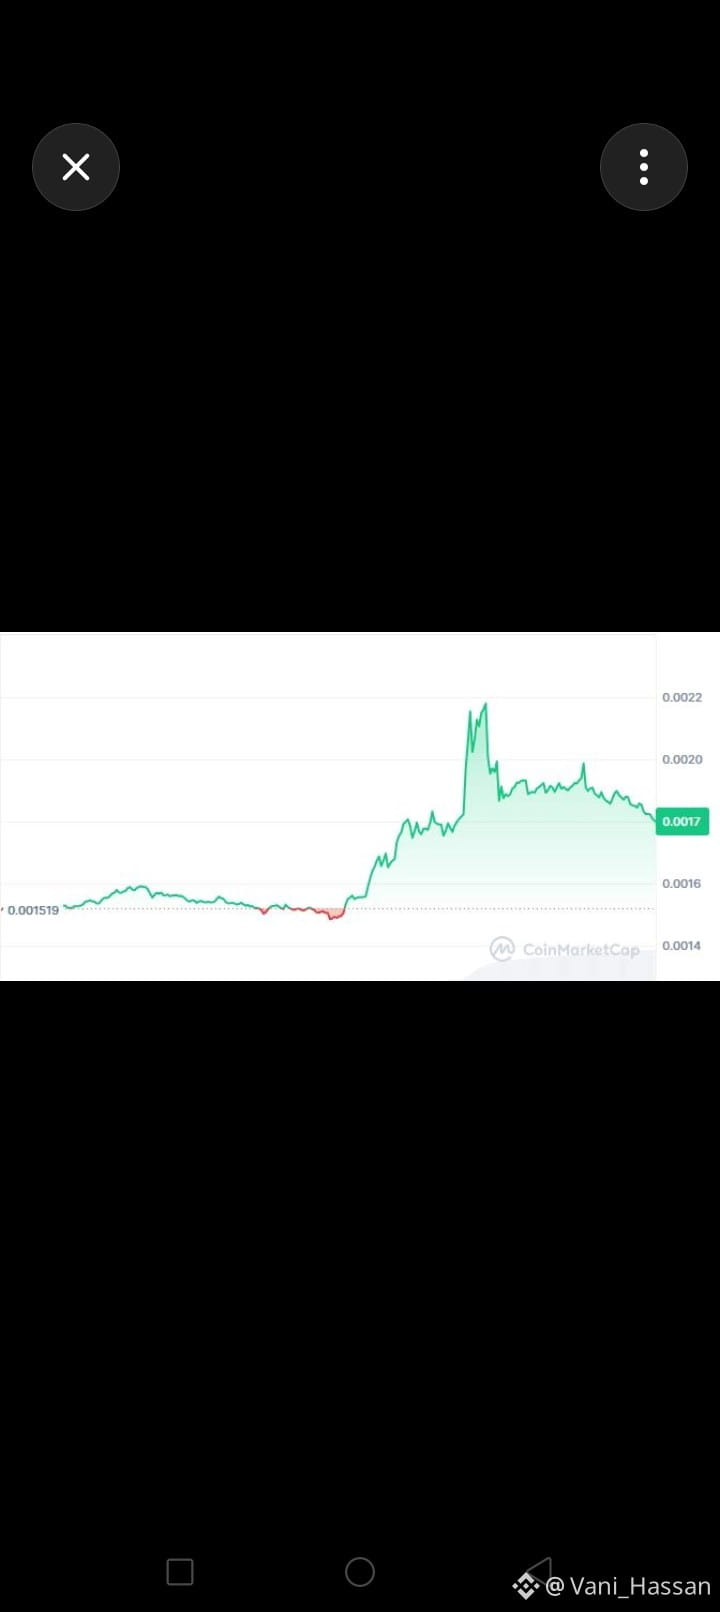
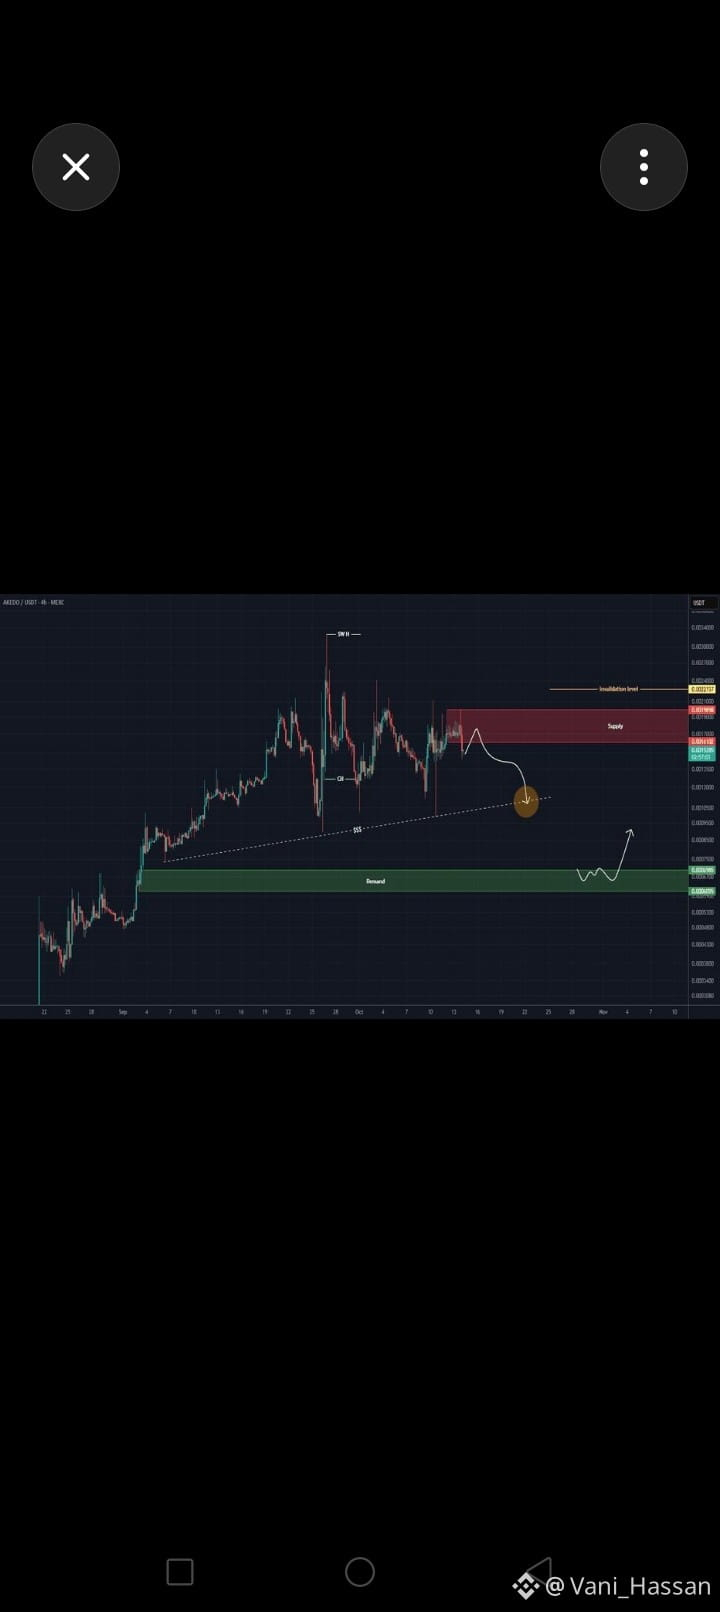
AKEDO (AKE) Coin – Short Analysis (Today)
Current trend: Bullish, with $AKE gaining roughly 35–45% over the last 24 hours and trading around $0.0042–$0.0043.
Binance +1
Momentum: Trading volume has increased significantly, indicating strong buying interest.
Binance +1
Resistance: Around $0.0049–$0.0055 (recent high).
Kraken +1
Support: Around $0.0035–$0.0038.
Kraken +1
Outlook: The short-term trend remains positive, but after such a sharp rally the coin could experience increased volatility or a pullback before another move higher. Traders should use risk management and avoid chasing rapid price spikes.
coinmarketcap.com +1
#BrentCrudeFallsAbout6% #CXMTStarMarketIPORaises57.9BYuan
1
139
·
--
Übersetzung ansehen
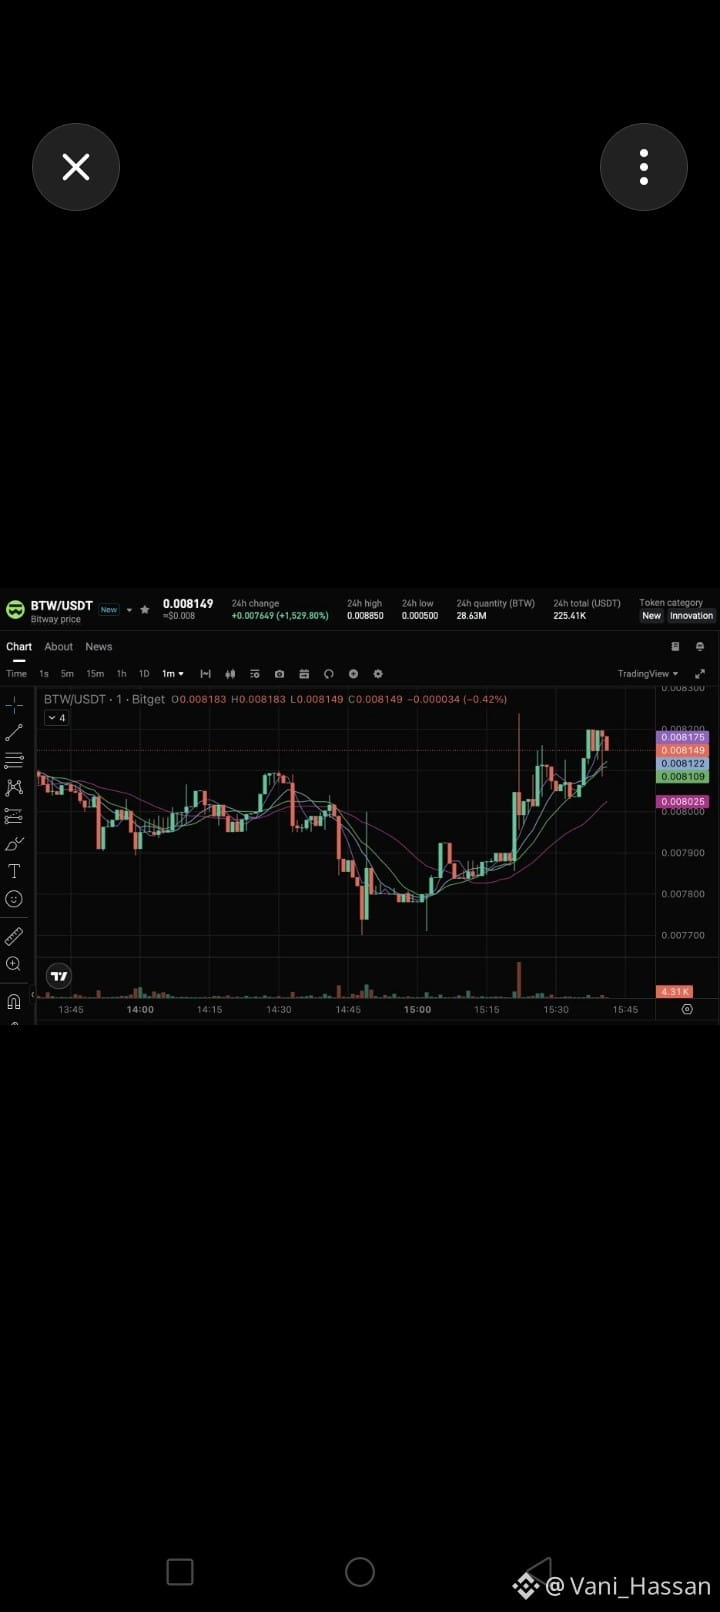
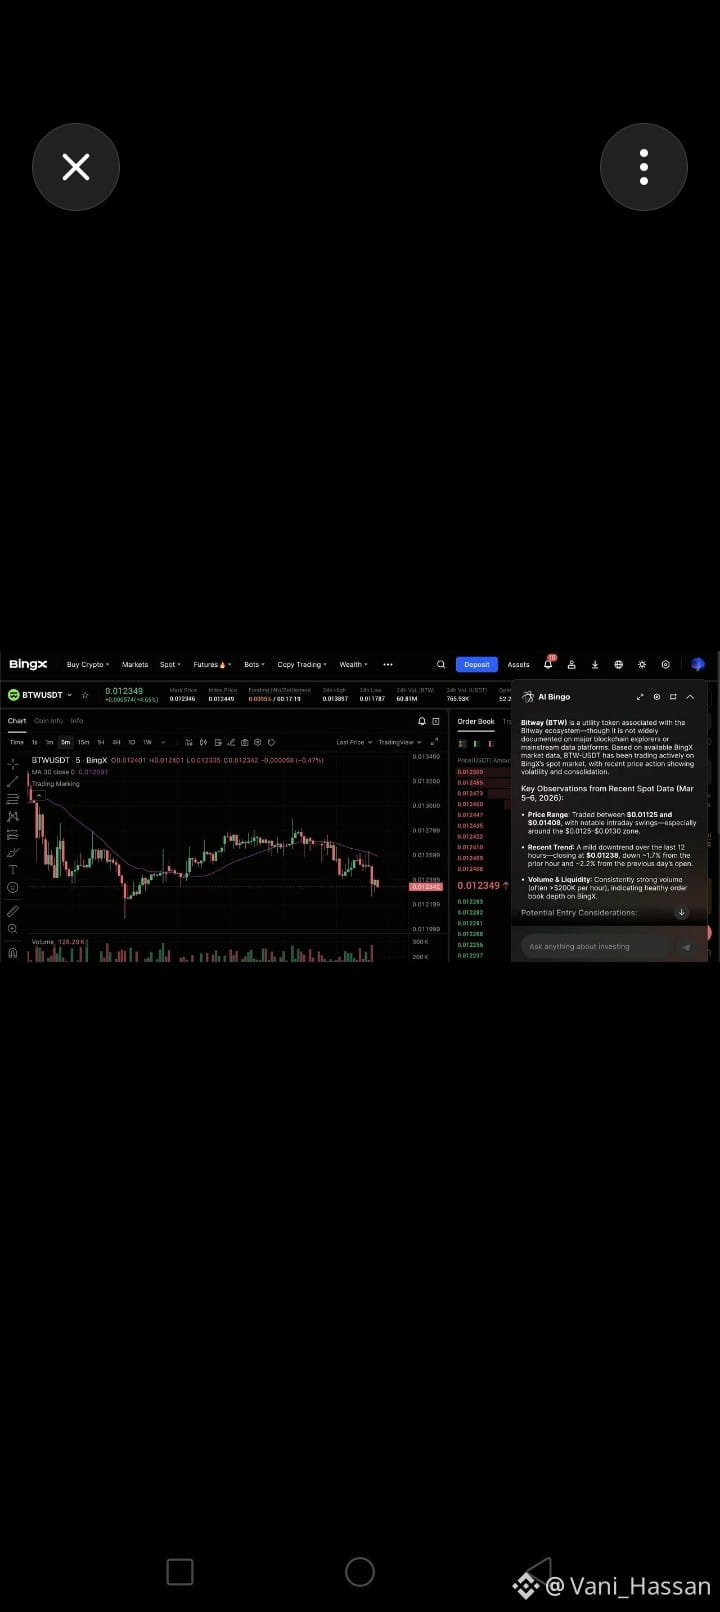
Bitway $BTW Coin – Short Note & Analysis (Today)
Current snapshot
Price: Approximately $0.069 per $BTW
24-hour change: +2–3%
24-hour trading volume: Around $8.5 million
Market trend: Mildly bullish with moderate trading activity.
CoinMarketCap +1
Technical Analysis
Trend: Short-term momentum remains bullish as the price is holding above recent support.
Support: Around $0.067
Resistance: Around $0.079
If the price breaks above resistance with strong volume, further upside is possible. If it falls below support, a short-term pullback may occur.
CoinMarketCap +1
Conclusion
Bitway $BTW is currently showing positive momentum, but like many cryptocurrencies it remains highly volatile. Traders should watch trading volume and key support/resistance levels before making decisions. This is not financial advice.
1
82
·
--
Übersetzung ansehen
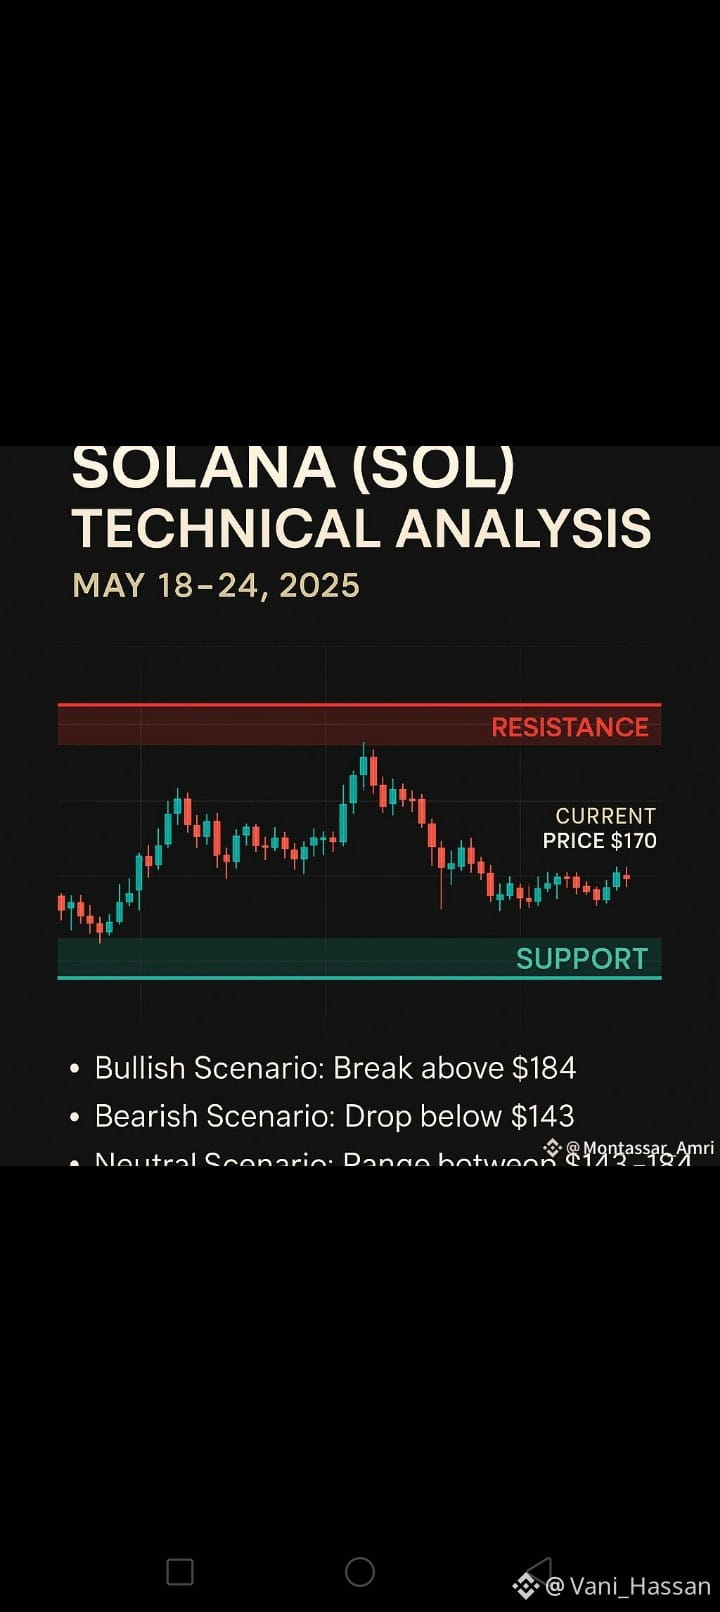
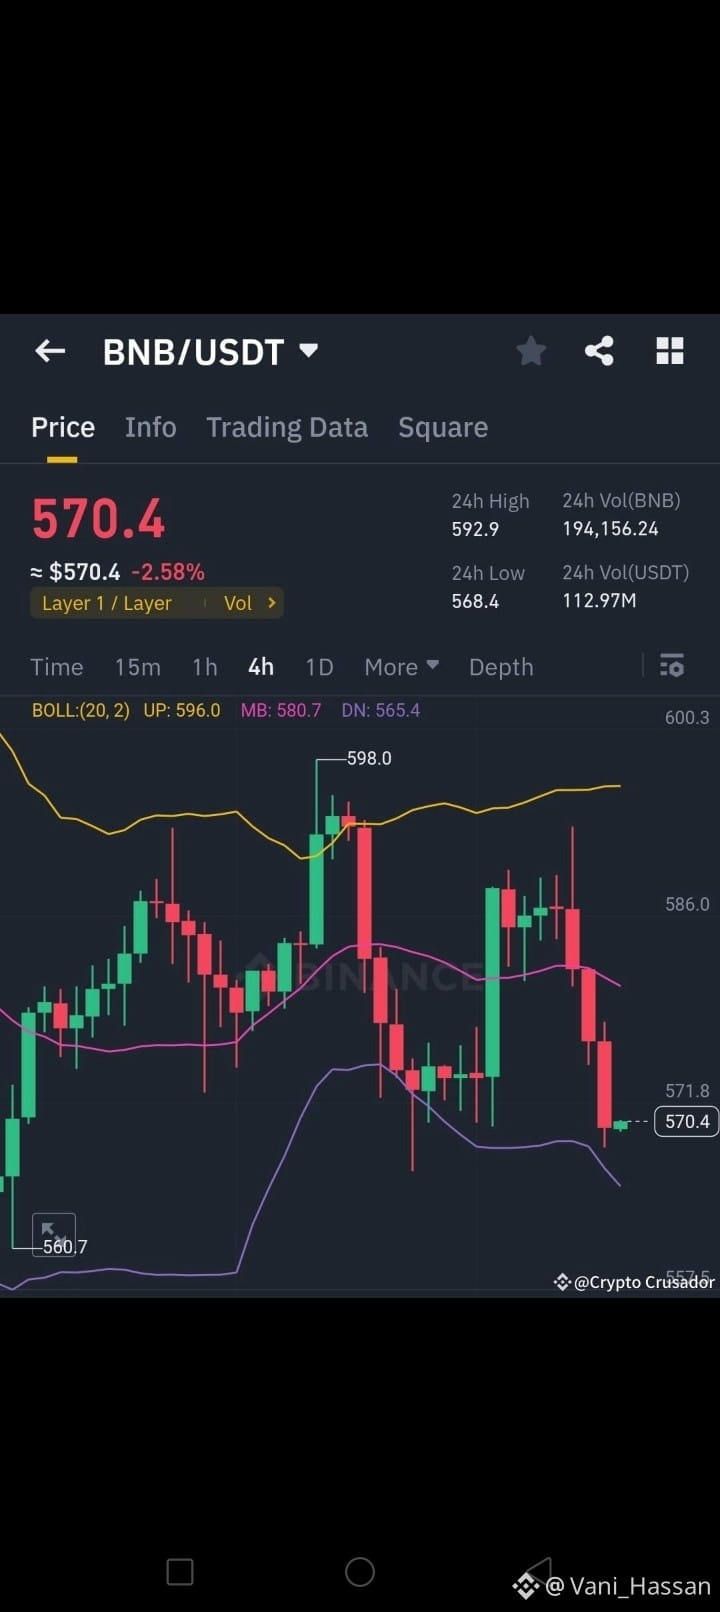
Current trend: $BTC is trading around $64.7K and remains in a consolidation phase after recovering from recent lows.
CoinMarketCap +1
Support: $64,000
Resistance: $65,000–$67,000
Outlook: Cautiously Bullish. A strong break above $65K could open the door to higher prices, while losing $64K may lead to another short-term pullback. Recent ETF inflows and improving technical indicators have strengthened market sentiment, although macroeconomic factors could still keep volatility high.
CoinMarketCap +2
Summary:
$BTC is showing signs of stabilization. Traders should watch the $65K resistance closely for confirmation of a stronger upward move. This is market analysis, not financial advice.
CentralBanksWeighResponseAsOilNearsC
62
·
--
Übersetzung ansehen
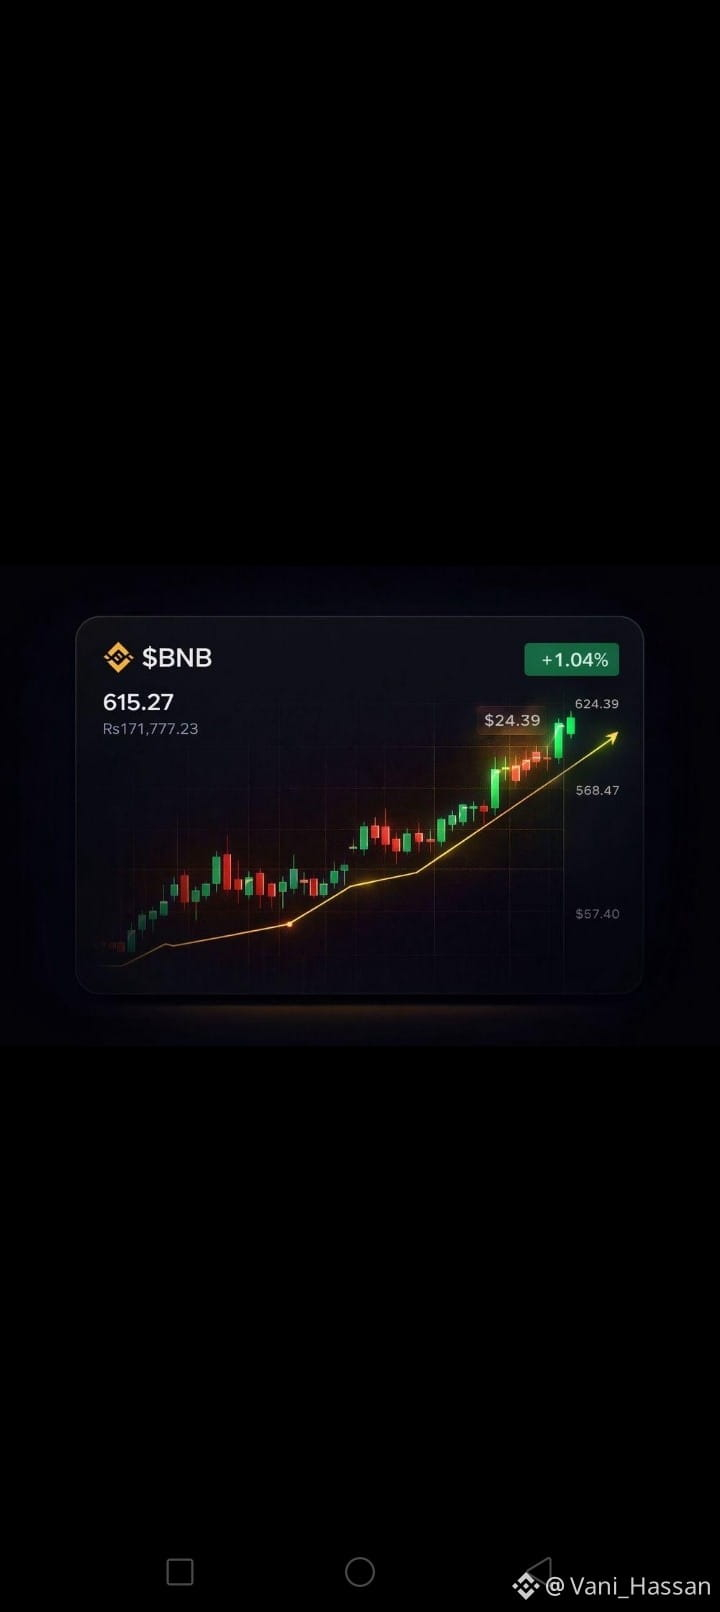
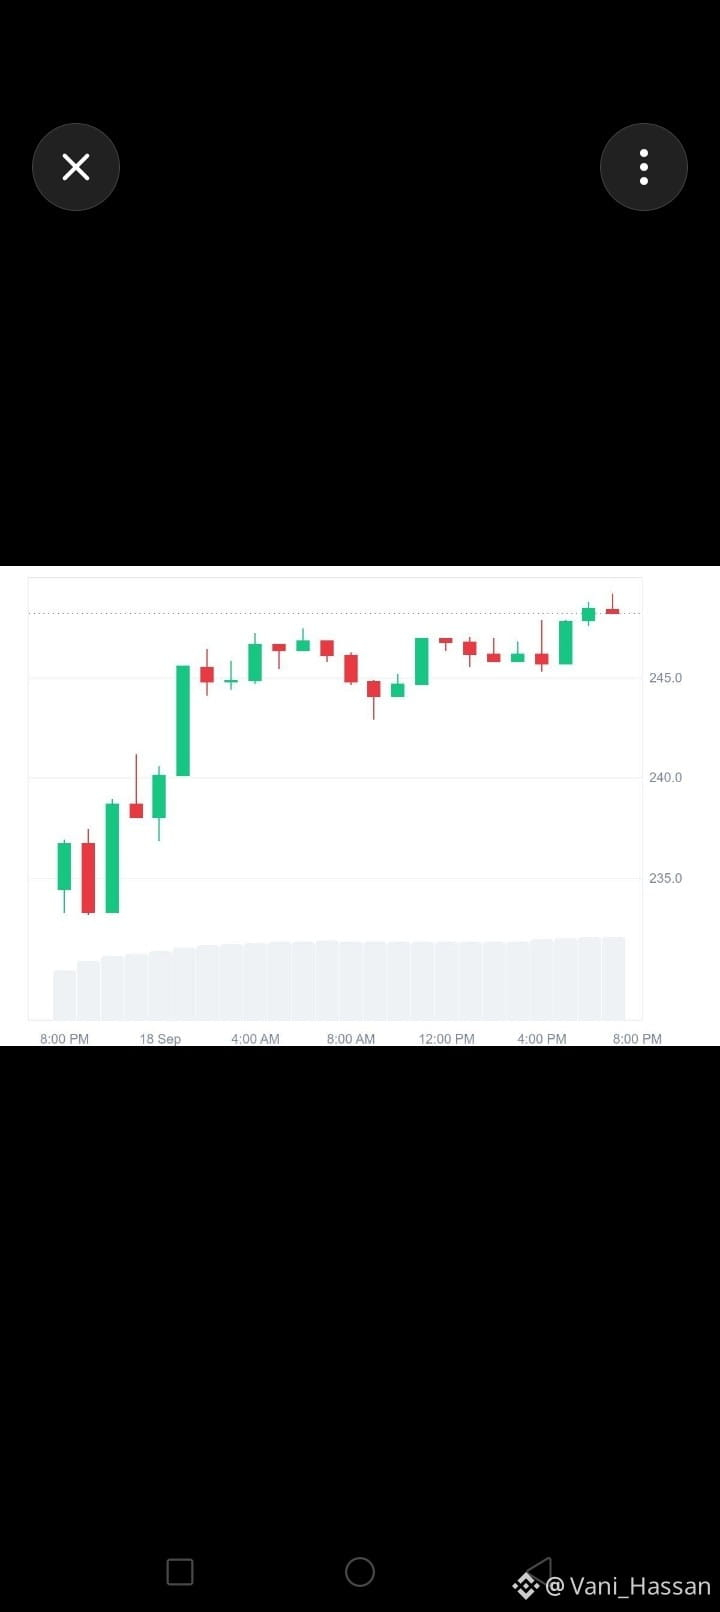
$BNB Coin Analysis — Today (July 26, 2026)
$BNB is showing mildly bullish momentum today. It is trading around $573, up about 1% over the last 24 hours, with buyers defending the $565–570 support zone.
Binance +1
Short analysis:
📈 Trend: Bullish to neutral
🟢 Support: $565–570
🔴 Resistance: $580–585
💡 Outlook: If BNB breaks above $580, it could continue higher. A drop below $565 may lead to short-term selling pressure.
CoinDCX +1
Overall Rating: 7.5/10 (Moderately Bullish)
*Crypto markets are volatile, so this is not financial advice. Always do your own research before investing.
CentralBanksWeighResponseAsOilNearsCe
85
·
--
Übersetzung ansehen
Solana (SOL) – Short Analysis (Today)
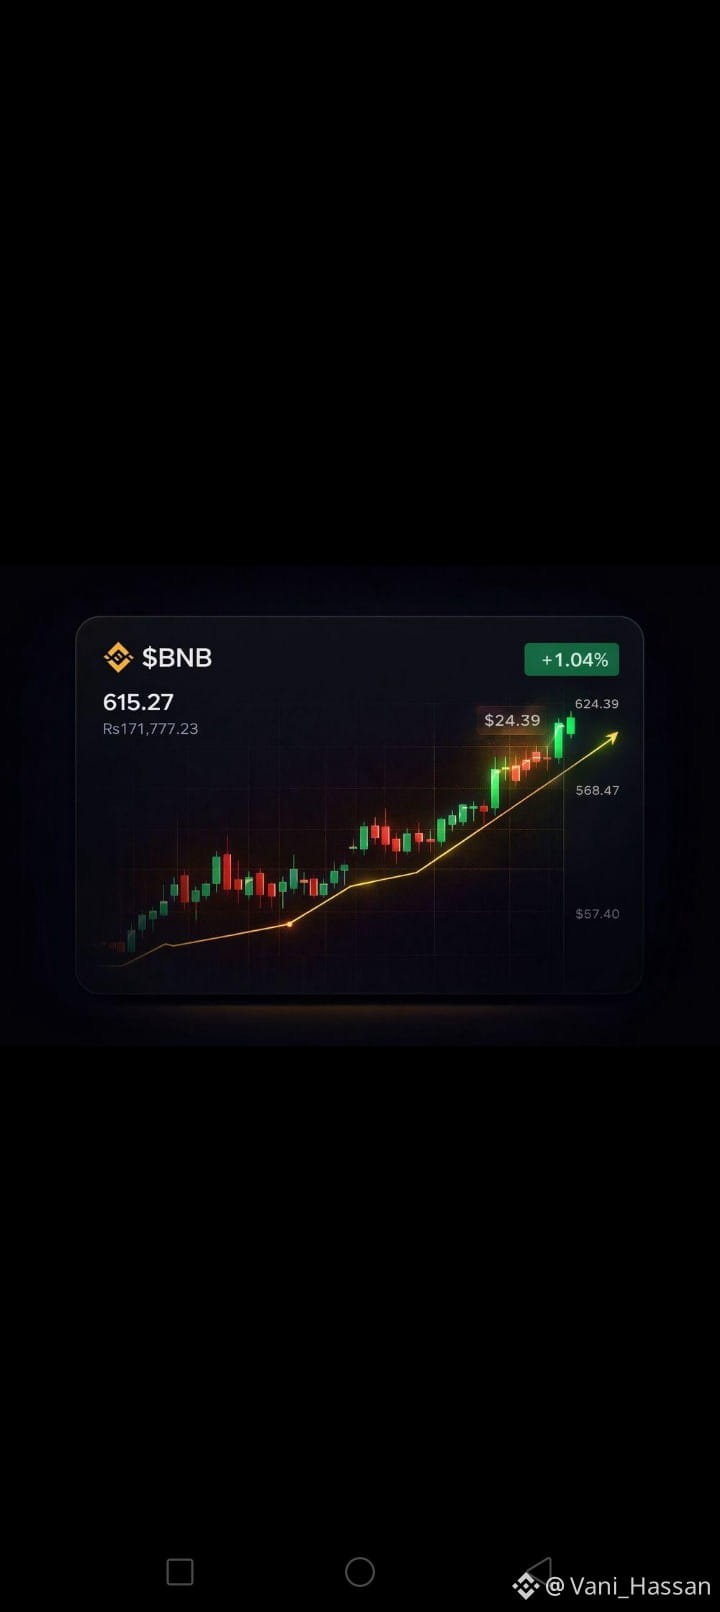
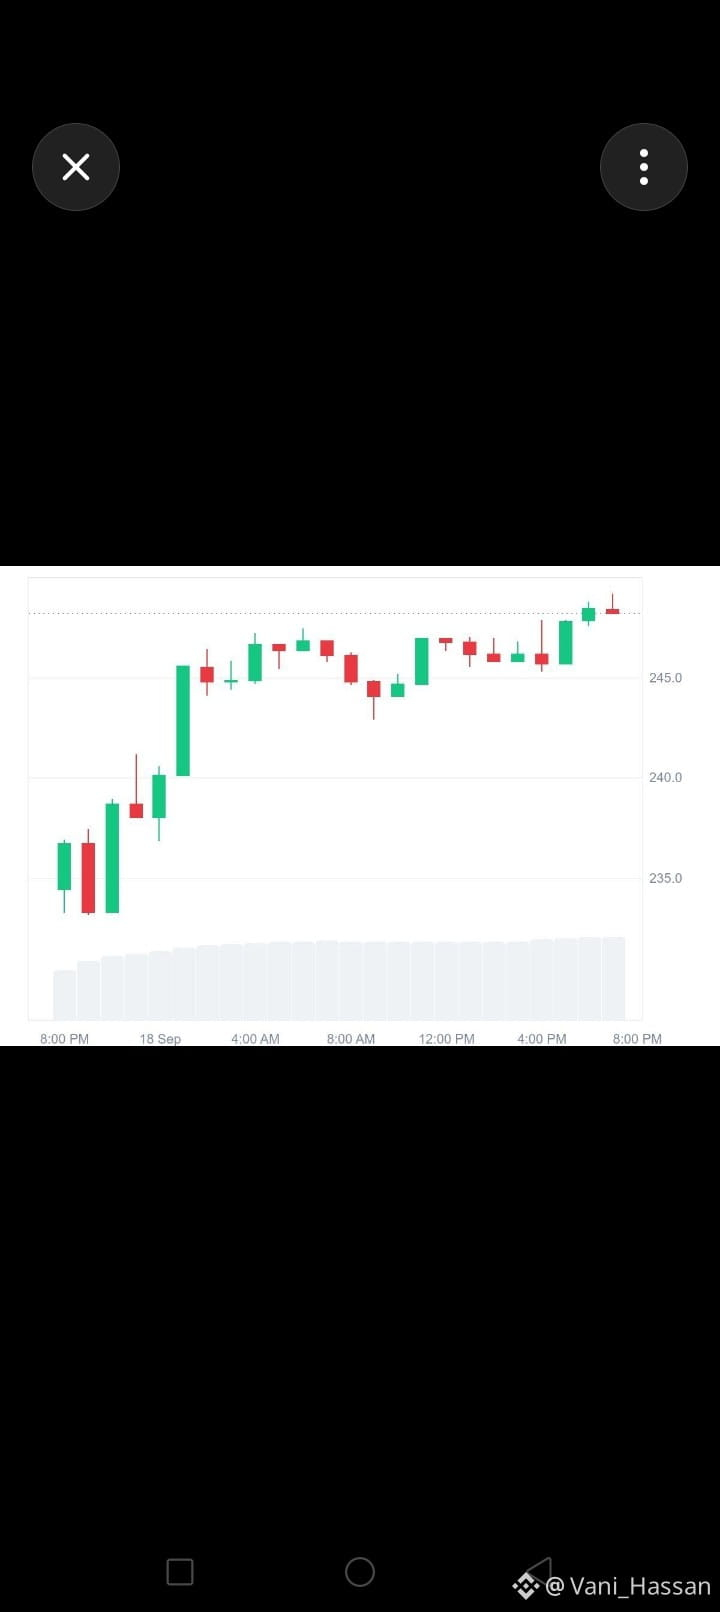
$SOL is one of the fastest Layer-1 blockchain networks, known for low transaction fees and high throughput. It is widely used for DeFi, NFTs, gaming, and AI-related blockchain projects.
Today's Analysis:
📈 Trend: Bullish to neutral.
🟢 Buyers are defending key support levels, indicating positive market sentiment.
🎯 If SOL breaks above the next resistance, it could continue higher in the short term.
⚠️ A drop below support may lead to a temporary pullback before another move upward.
Trading View:
Bias: Bullish
Support: Watch the nearest recent support zone.
Resistance: Watch the recent swing high for a breakout.
Risk: Cryptocurrency markets remain highly volatile—always use stop-losses and manage position size.
Overall Rating: ⭐⭐⭐⭐☆ (4/5) – SOL remains one of the stronger major cryptocurrencies, with solid ecosystem growth and generally positive technical momentum.
70
·
--
Übersetzung ansehen
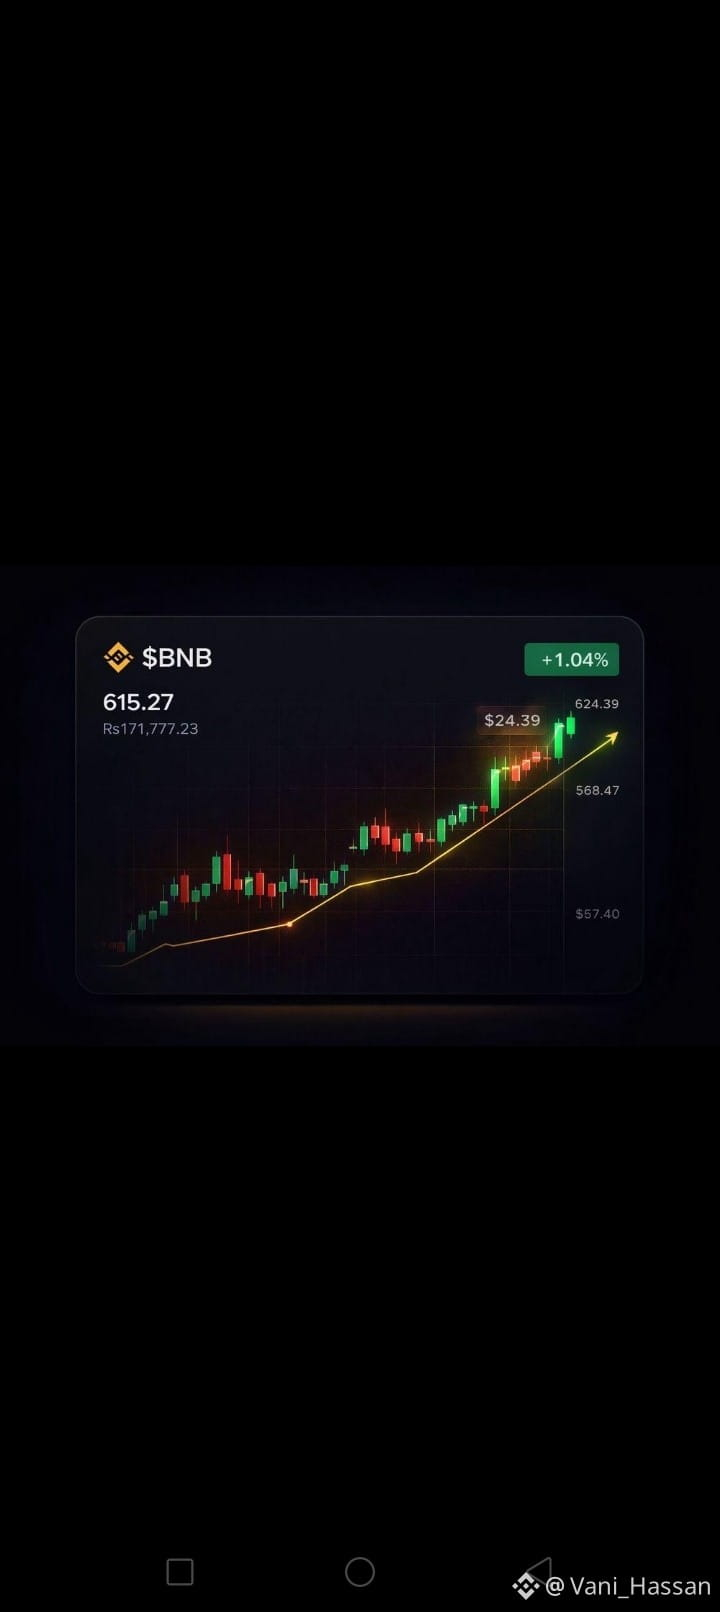
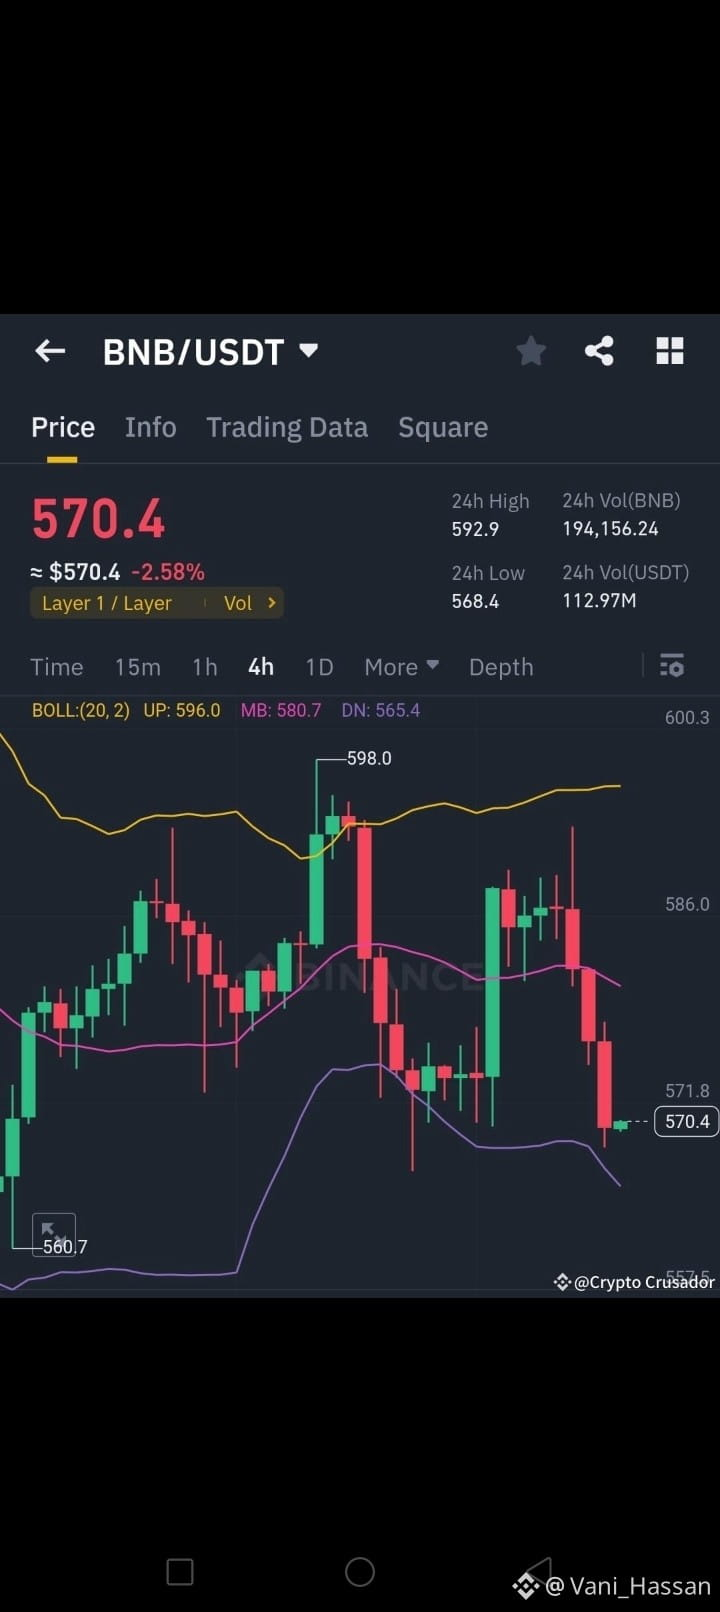
$BNB (Binance Coin) is the native cryptocurrency of the $BNB Chain ecosystem. It is used to pay transaction fees, participate in decentralized applications (dApps), staking, token launches, and to receive discounts on services within the Binance ecosystem.
Today's Market Analysis
Current Trend: 🟢 Bullish to Neutral
Market Sentiment: Positive, supported by steady demand and activity on the BNB Chain ecosystem.
Support Level: Around $760
Resistance Level: Around $800
If $BNB remains above the support level, it may continue moving toward the $800 resistance. A break above that level could strengthen bullish momentum. If it falls below support, the next important support zone is around $730–740.
Technical Outlook
Short-term: 🟢 Mildly Bullish
Long-term: 🟢 Positive, supported by regular token burns, strong ecosystem growth, and broad adoption.
Overall Rating Today: 8/10 (Bullish)
This is market analysis, not financial advice. Cryptocurrency prices are volatile, so always do your own research before investing#USFiresOnTankerBreakingIranBlockade $5BBitcoinOptionsClusterAt$70KAnd$72KStrikes#SaudiRoutesOilExportsViaSuez
62
·
--
Übersetzung ansehen
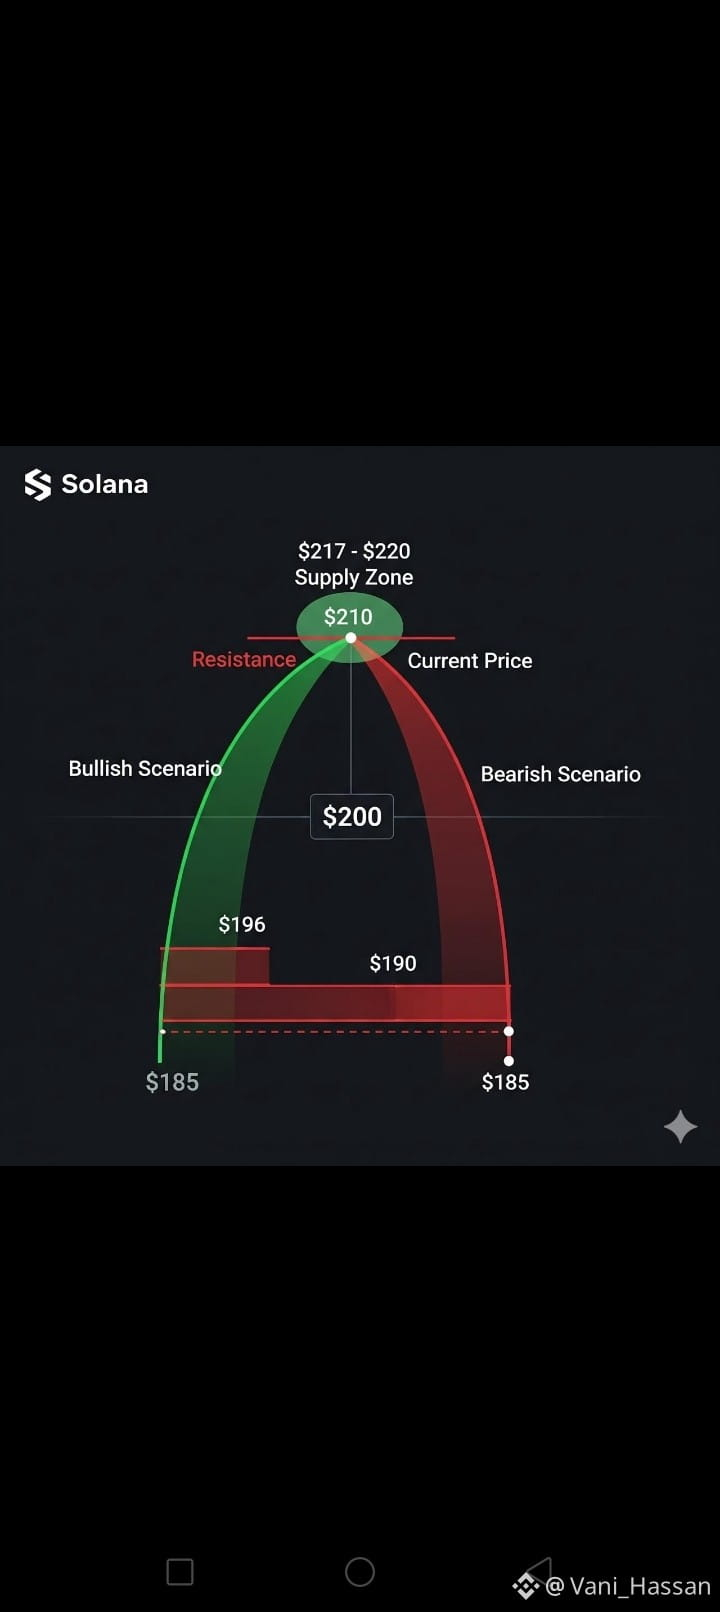
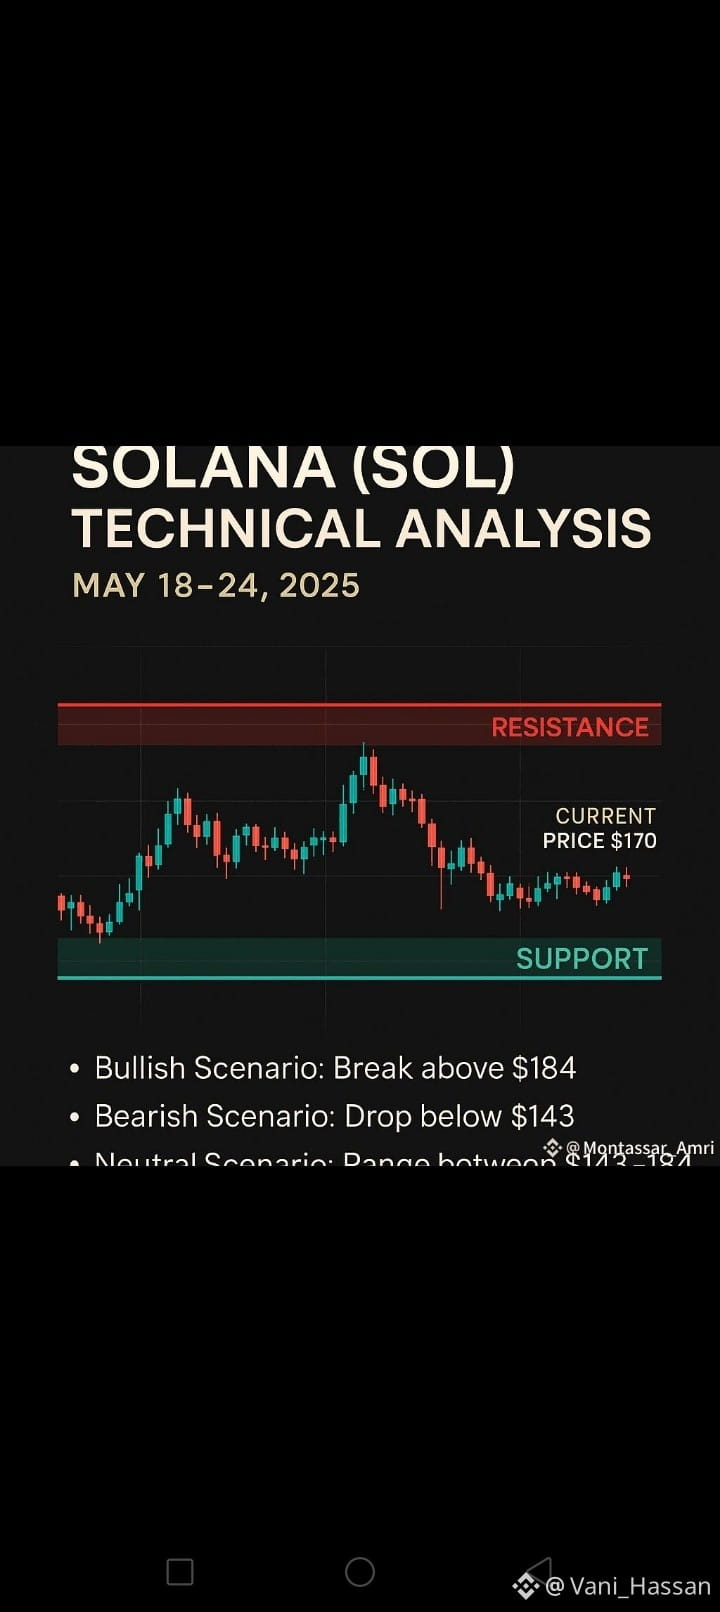
Solana $SOL is a high-performance blockchain designed for fast, low-cost transactions. It supports decentralized applications (dApps), DeFi, NFTs, and payments, making it one of the leading blockchain ecosystems.
Today's Market Analysis
Current Price: Around $74 USD
24-hour Trend: Slightly bearish (down about 2–3%)
Market Sentiment: Cautious due to overall crypto market weakness.
Support Level: $74
Resistance Level: $80
If $SOL stays above $74, it could attempt another move toward $80. If it falls below support, the next downside area is around $68–69.
CoinMarketCap +1
Technical Outlook
📉 Short-term: Bearish to neutral
📈 Long-term: Still considered a strong blockchain project because of its speed, low fees, and active ecosystem, but crypto markets remain highly volatile.
Investing.com UK +1
Overall Rating Today: 6.5/10 (Neutral to Slightly Bearish)
*This is market analysis, not financial advice. Always do your own research before investing.*#USFiresOnTankerBreakingIranBlockade #Nasdaq100FallsInBackToBackWeeklyLoss BrentCrudeTops$100
77
·
--
Übersetzung ansehen
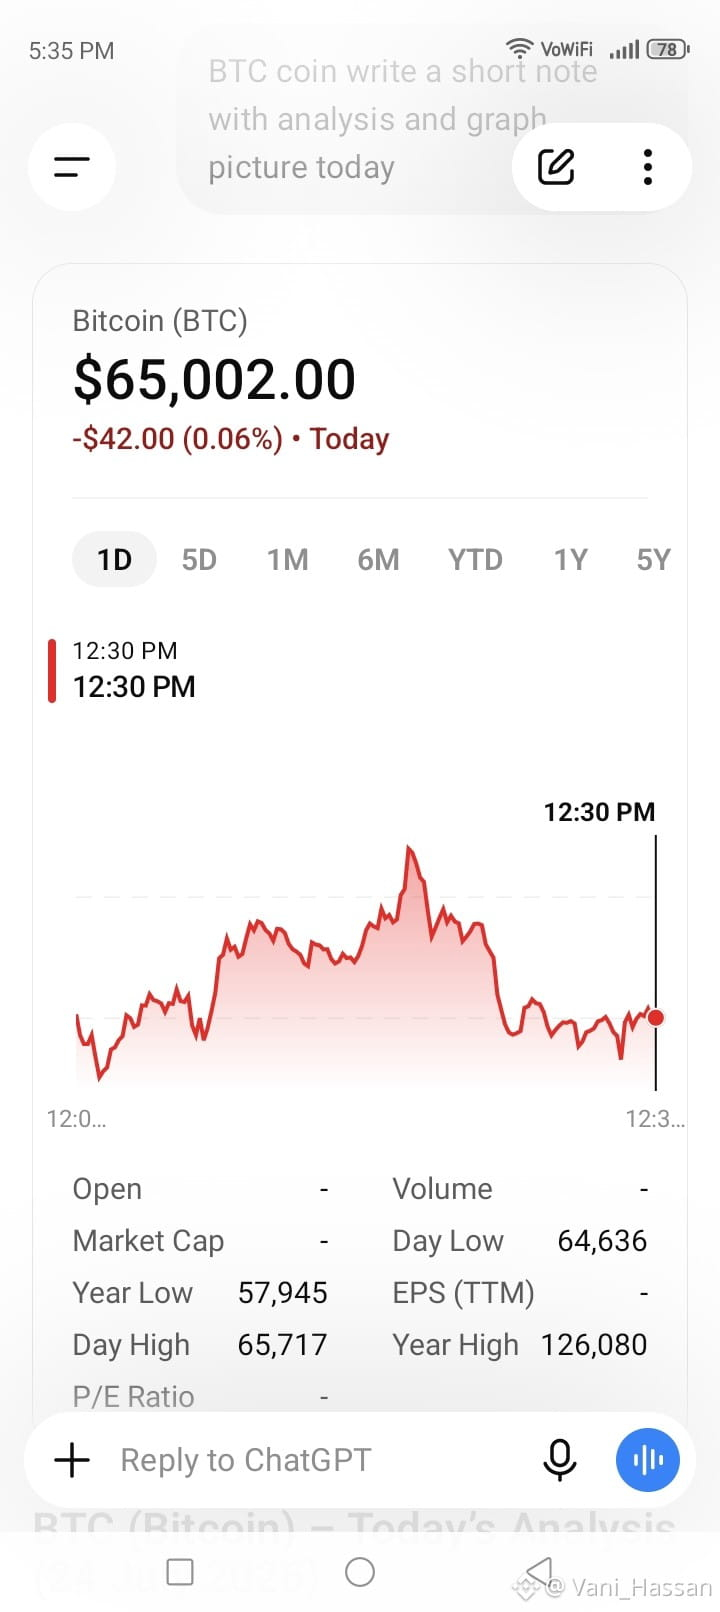
$BTC (Bitcoin) – Today’s Analysis (24 July 2026)
Short Note:
Bitcoin $BTC is trading around $65,000 today after a modest pullback. The broader trend is showing signs of stabilization following a recovery from July lows, but traders remain cautious ahead of upcoming macroeconomic events, including the U.S. Federal Reserve meeting.
Use The Bitcoin +1
Technical Analysis
📈 Trend: Neutral to mildly bullish
🟢 Support: $64,000–$65,000
🔴 Resistance: $66,500–$68,000
📊 A sustained move above $66.5K could strengthen bullish momentum, while a break below $64K may increase selling pressure toward lower support levels.
CoinMarketCap +1
Market Outlook
✅ Institutional ETF inflows remain supportive.
⚠️ Short-term volatility is likely due to macroeconomic uncertainty.
🎯 As long as BTC holds above $64K, the medium-term outlook remains constructive, but confirmation of a stronger uptrend requires a breakout above $67K–68K.
CoinStats +1
#KRXActivatesSellSideSidecar Magnificent7Loses$797Billion#WTIUp6.17%BrentUp7.04%
1
64
·
--
Übersetzung ansehen
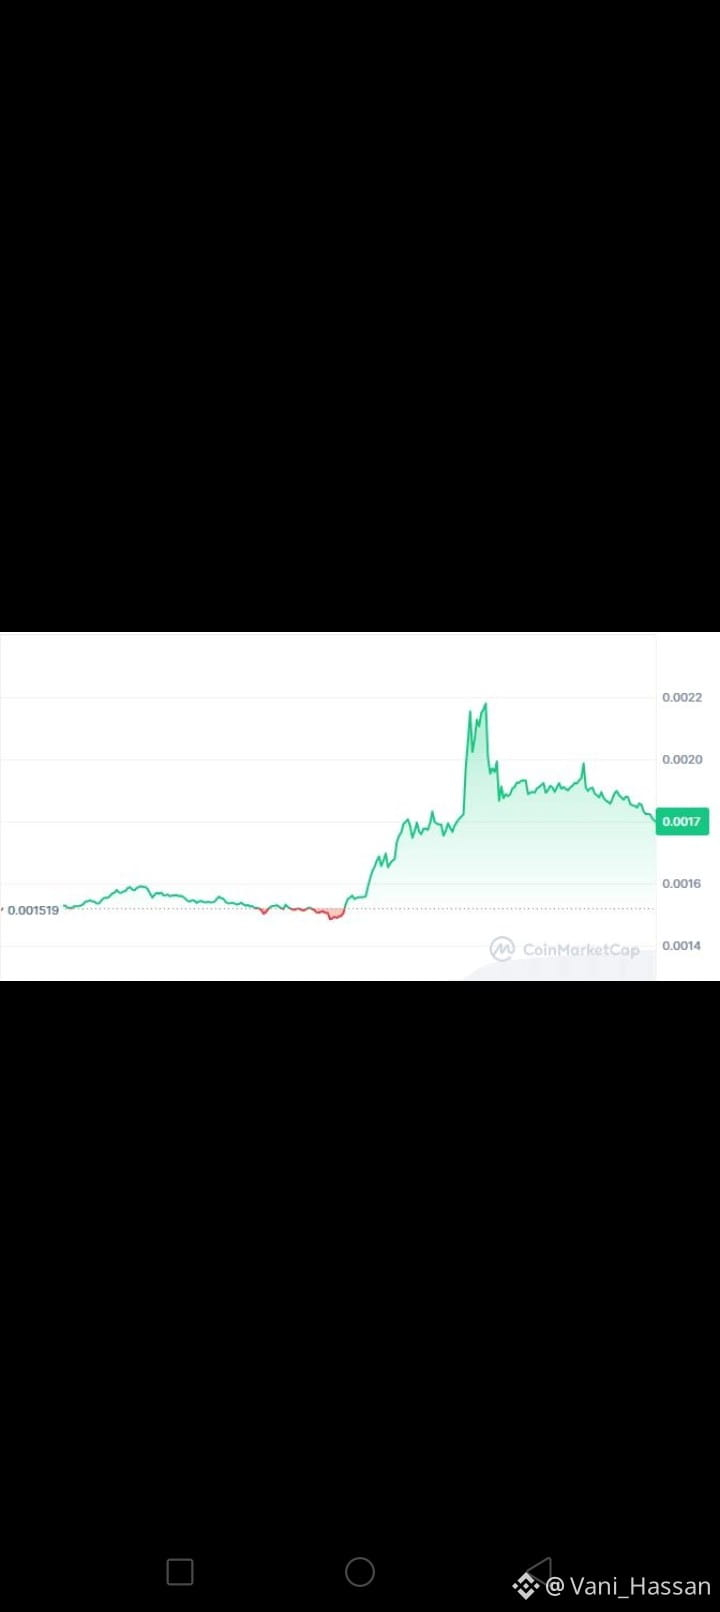
$AKE (AKEDO) Coin – Today’s Analysis (24 July 2026)
Current Price: Approximately $0.0023–$0.0025
24H Change: +20% to +35% (strong bullish momentum)
Trend: Bullish – $AKE has seen a sharp breakout with heavy trading volume and increased market attention.
CoinLore +1
Technical Analysis
✅ Momentum remains positive as buyers are in control.
📈 Support: Around $0.00224
🎯 Resistance: Around $0.0026–$0.0030
⚠️ After such a rapid rally, short-term profit-taking could lead to increased volatility.
CoinLore +1
Best analysis: $AKE (AKEDO) has emerged as one of today's strongest-performing small-cap crypto tokens. Rising trading volume and bullish sentiment have pushed the price significantly higher. If AKE holds above its support zone, it may attempt another move toward the $0.0030 level. However, because of its recent surge, traders should be prepared for sharp price swings and manage risk carefully.
kucoin.com +1
#FedSeptHikeOddsJumpToAbout82% #GlobalTechStocksExtendSelloff #SenateRejectsIranWarPowersResolution
1
277
·
--
Übersetzung ansehen
$BTC (Bitcoin) Analysis – Today (22 July 2026)
Short Note
Bitcoin $BTC remains the world's largest cryptocurrency by market capitalization and continues to lead the crypto market. Institutional demand and long-term adoption remain key drivers, while short-term price movements are influenced by macroeconomic news and market sentiment.
Technical Analysis:
Trend: Bullish (medium to long term)
Support: $116,000
Resistance: $122,000
RSI: Around 58 (healthy momentum, not overbought)
MACD: Bullish crossover, indicating positive momentum.
$BTC is trading above its 50-day and 200-day moving averages, suggesting the overall trend remains strong.
Outlook:
Bullish Scenario: A breakout above $122,000 could open the way toward $125,000–$128,000.
Bearish Scenario: If BTC falls below $116,000, the next support is around $112,000.
Overall Rating: ⭐⭐⭐⭐⭐ Buy on Dips / Hold
Bitcoin continues to show strong long-term strength, but short-term volatility is expected. Proper risk management is recommended before making any investment decisions.#BitcoinDominanceRisesTo59% #HongKongStorageStocksStrengthen BitcoinHits$66500OneMonthHigh
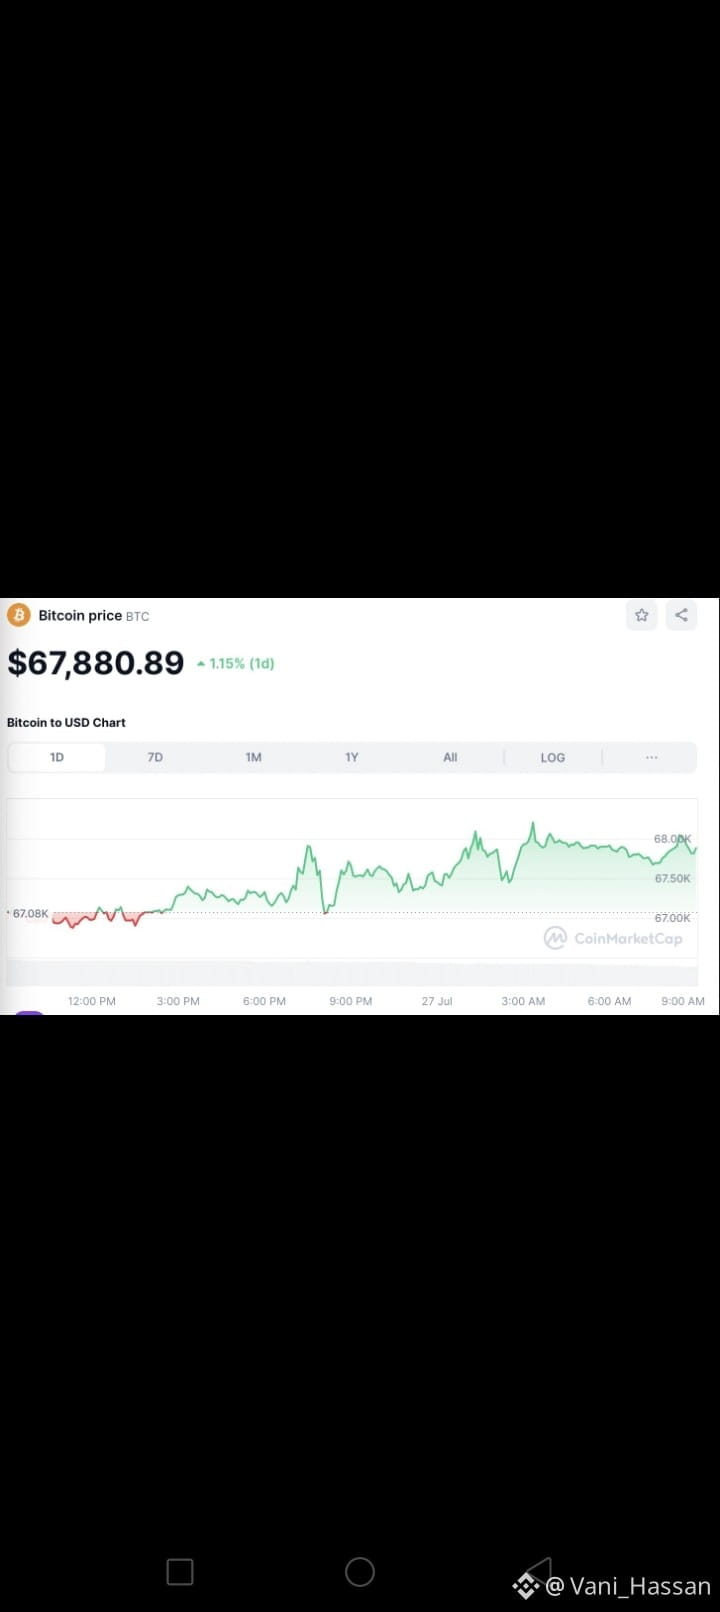
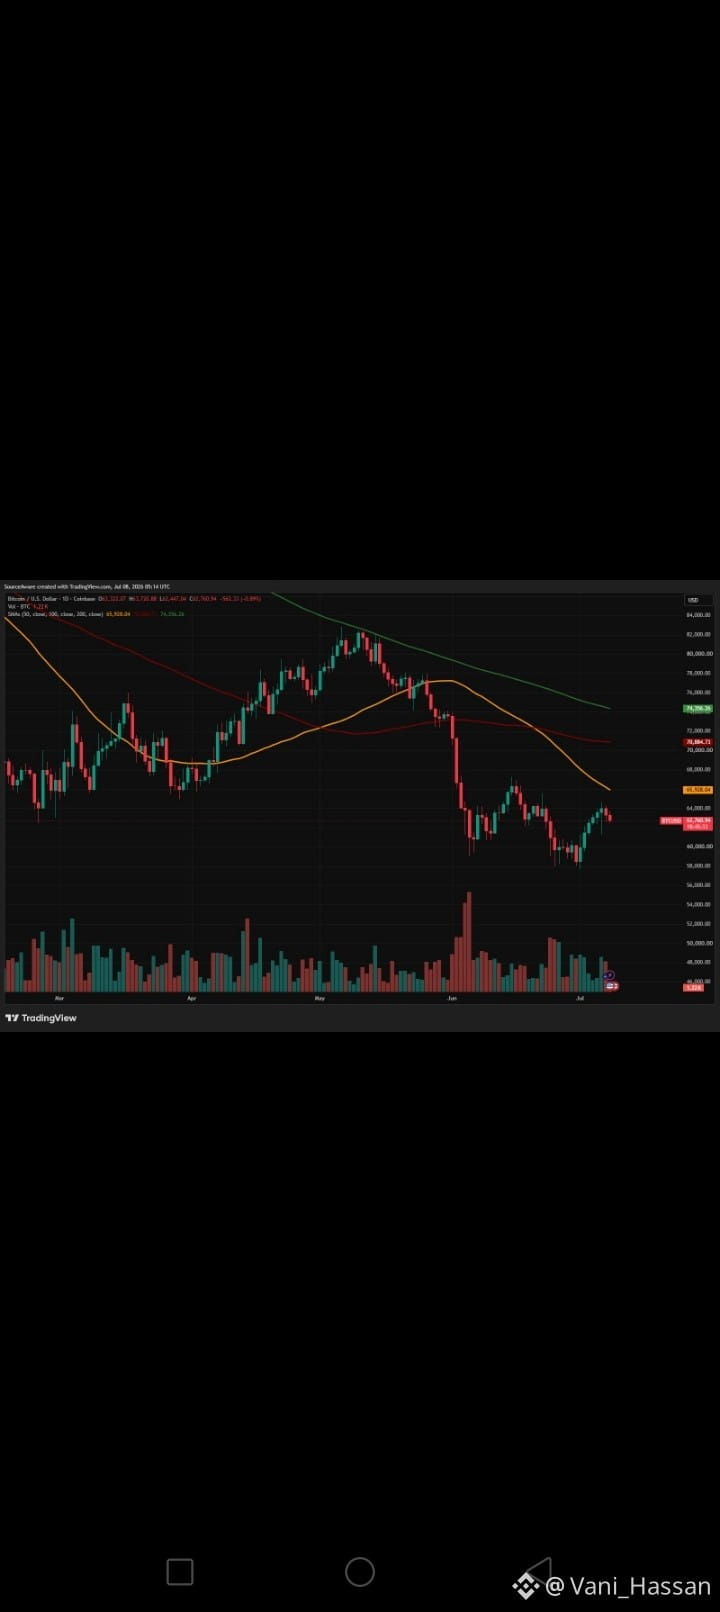
62
·
--
Übersetzung ansehen
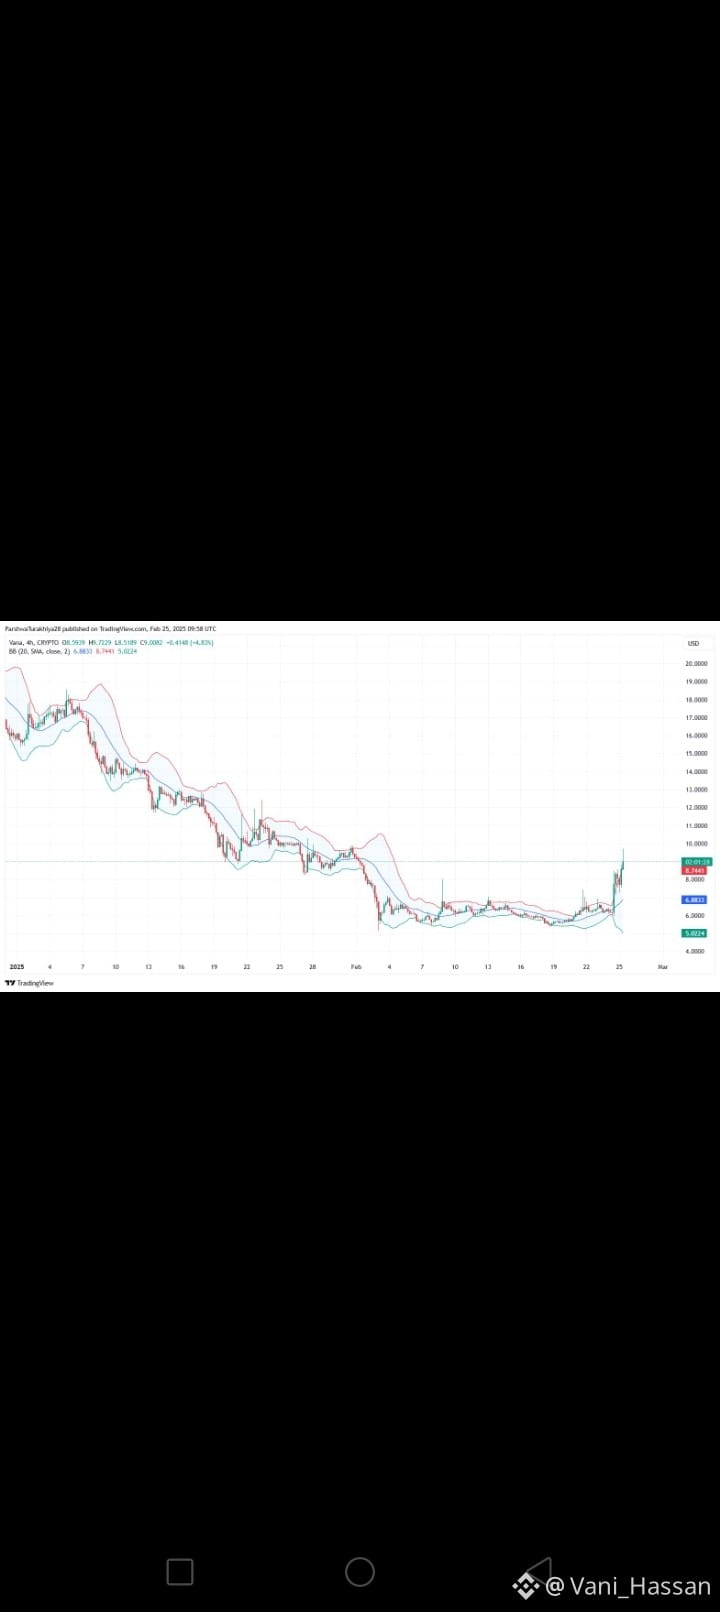
$VANA Coin Analysis – Today (22 July 2026)
Current Price: ≈ $1.17–$1.19
24h Change: Around -1% (slightly bearish)
CoinCodex +1
Short Note
$VANA is an AI and data-focused blockchain project that enables users to own, control, and monetize their personal data. The project aims to build decentralized data networks for AI applications.
Technical Analysis
🔥Trend: Neutral to slightly bullish.
Support: $1.12
Resistance: $1.25
RSI: Around 53 (neutral)
MACD: Neutral with a slight bullish bias.
Price is trading close to its 20-day moving average, indicating consolidation before the next move.
CoinLore +1
Outlook✅
Bullish: A breakout above $1.25 could target $1.35–$1.40.
Bearish: If $1.12 support breaks, the price could fall toward $1.00.
Overall Rating: Hold / Watch ⭐⭐⭐⭐☆
The trend is currently stable, so waiting for a confirmed breakout above resistance may be more prudent than chasing the price#BitcoinDominanceRisesTo59% BitcoinETFAUMReaches$80.9B#SecondFiToShutDownAfter16.1MADATheft

108
·
--
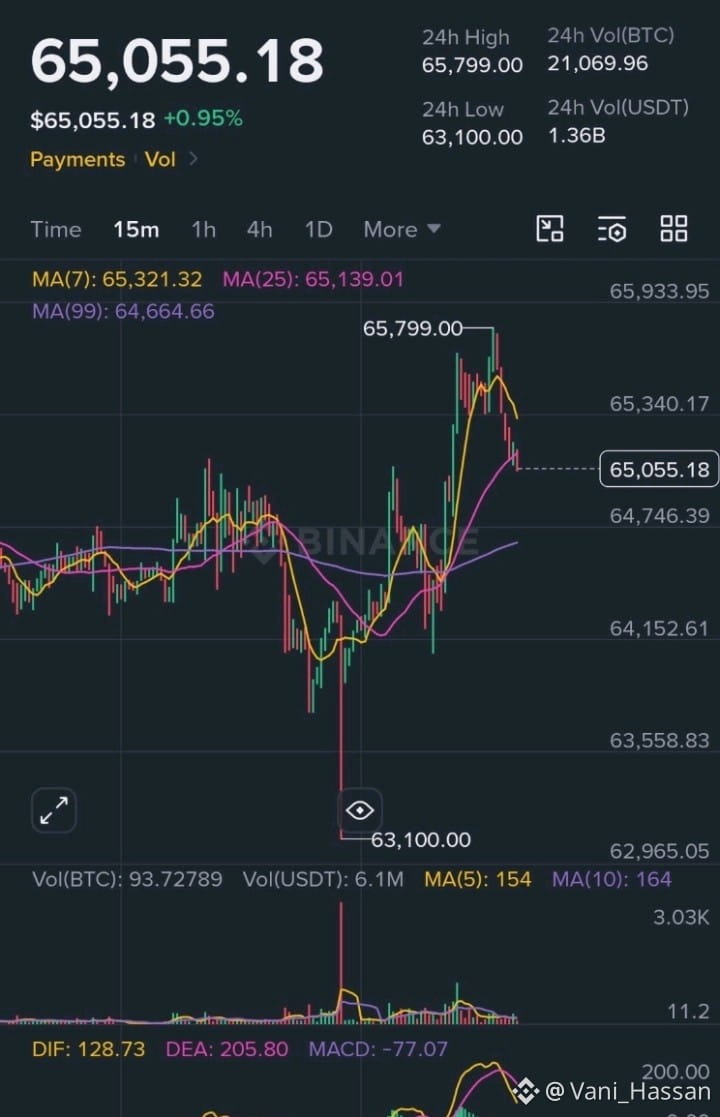
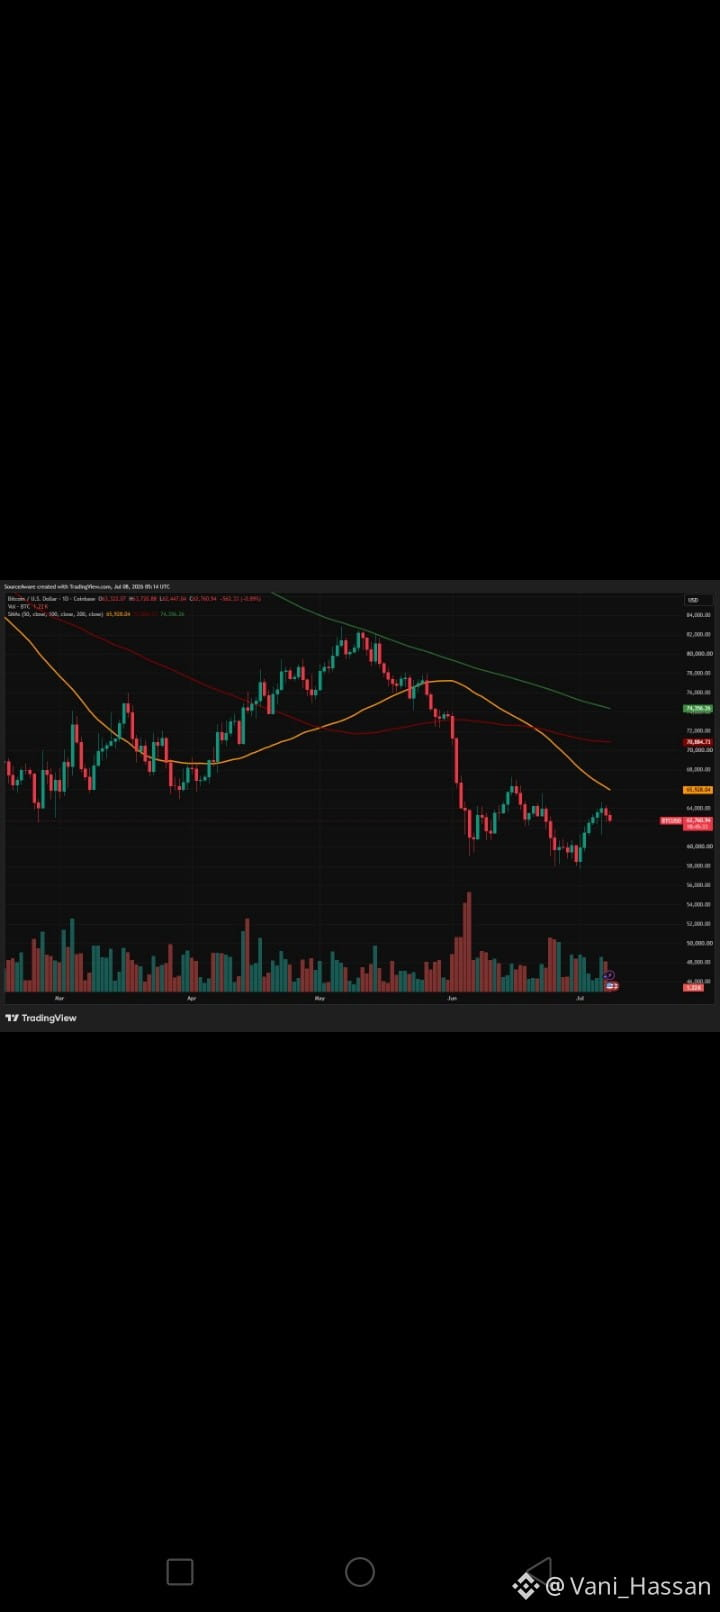
$BTC ehrlich gesagt habe ich den ganzen Morgen die BTC-Charts durchgeblättert und irgendwie fühlt es sich… komisch an. Ich weiß nicht, wie ich es ausdrücken soll. Das Daily schreit förmlich bullish – der Preis ist über den Short-MAs, der MACD hat gerade dieses Monster-Cross gemacht, und alle feiern. Ich wäre fast auch in den Hype reingerutscht.
aber dann habe ich mir das 15m angesehen. und das ist irgendwie eigenartig. der Preis rutscht unter die 7 MA, der MACD ist schon negativ, als würde der Motor stottern, bevor das Auto überhaupt aus der Garage gefahren ist. warte—vielleicht ist das nicht die richtige Metapher. aber du weißt, was ich meine. die unteren Zeiteinheiten faulen weg, während das große Bild herrlich aussieht. ich erinnere mich, dass ich letztes Jahr etwas Ähnliches gesehen habe: ein Setup, bei dem das Daily perfekt war, aber die 1h ist dann eingeknickt und wir haben innerhalb eines Tages zwei Wochen an Gewinnen wieder abgegeben. Ich sage nicht, dass das wieder passiert, aber es steckt mir im Kopf.
die 99 MA im Daily ist immer noch weit oben bei 70k, und wir tun so, als wäre das gar nicht da. warum? wir sind immer noch in einer Range. der 4h-MACD sieht okay aus, aber die Steigung flacht ab, statt sich zu beschleunigen. ich starre die 1h- und 15m-Moving-Average-Crossover an und die wirken einfach müde. so, als würde das Kaufinteresse ausdünnen.
i ch weiß nicht, vielleicht denke ich zu viel nach. vielleicht wird der Dip im 15m einfach wieder aufgekauft und niemanden interessiert’s. aber gerade fühlt es sich an, als würde der Markt ein Tor feiern, wenn der Ball die Linie noch gar nicht überschritten hat. ich versuche immer noch herauszufinden, was das hier wirklich verändert.
#Write2Earn
47
·
--
Übersetzung ansehen
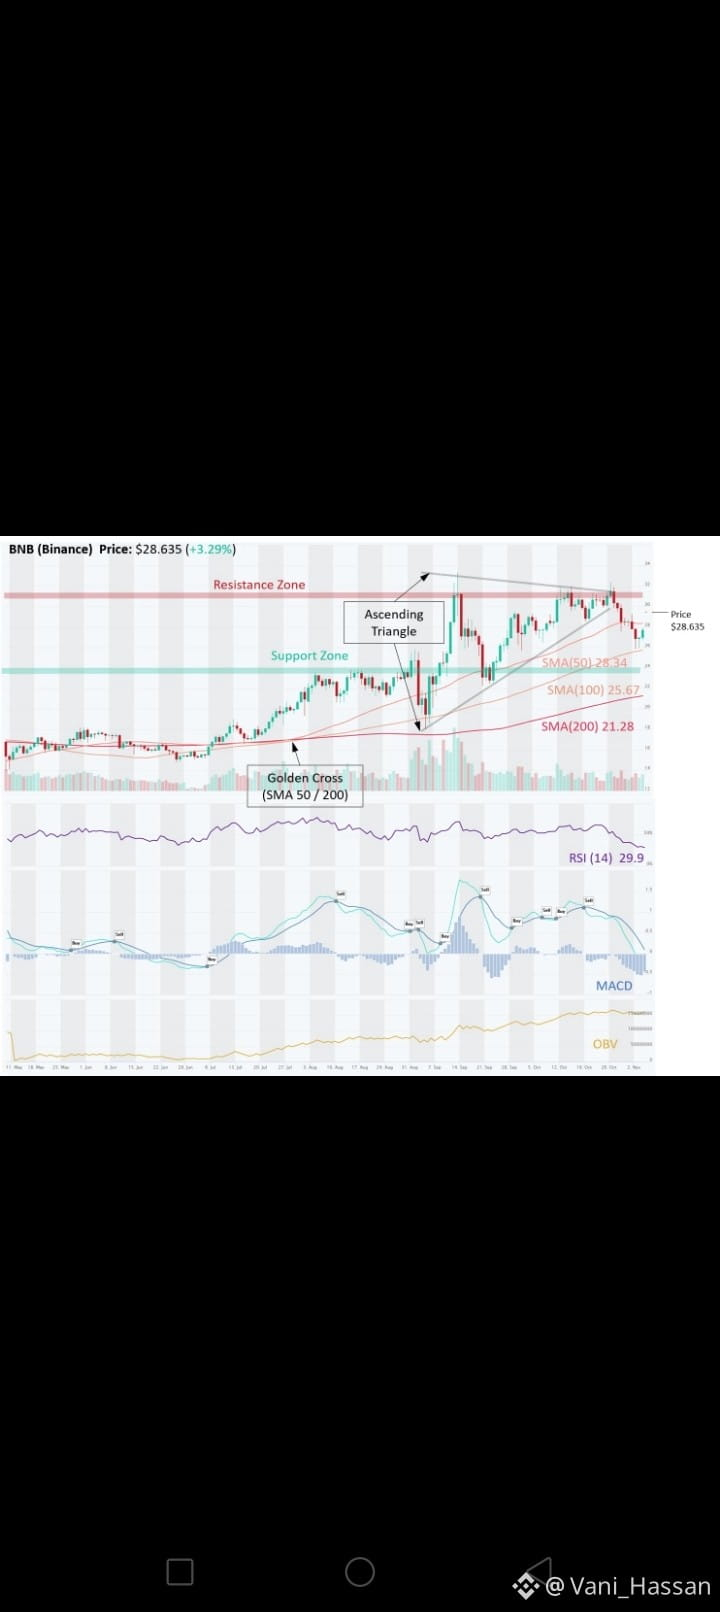
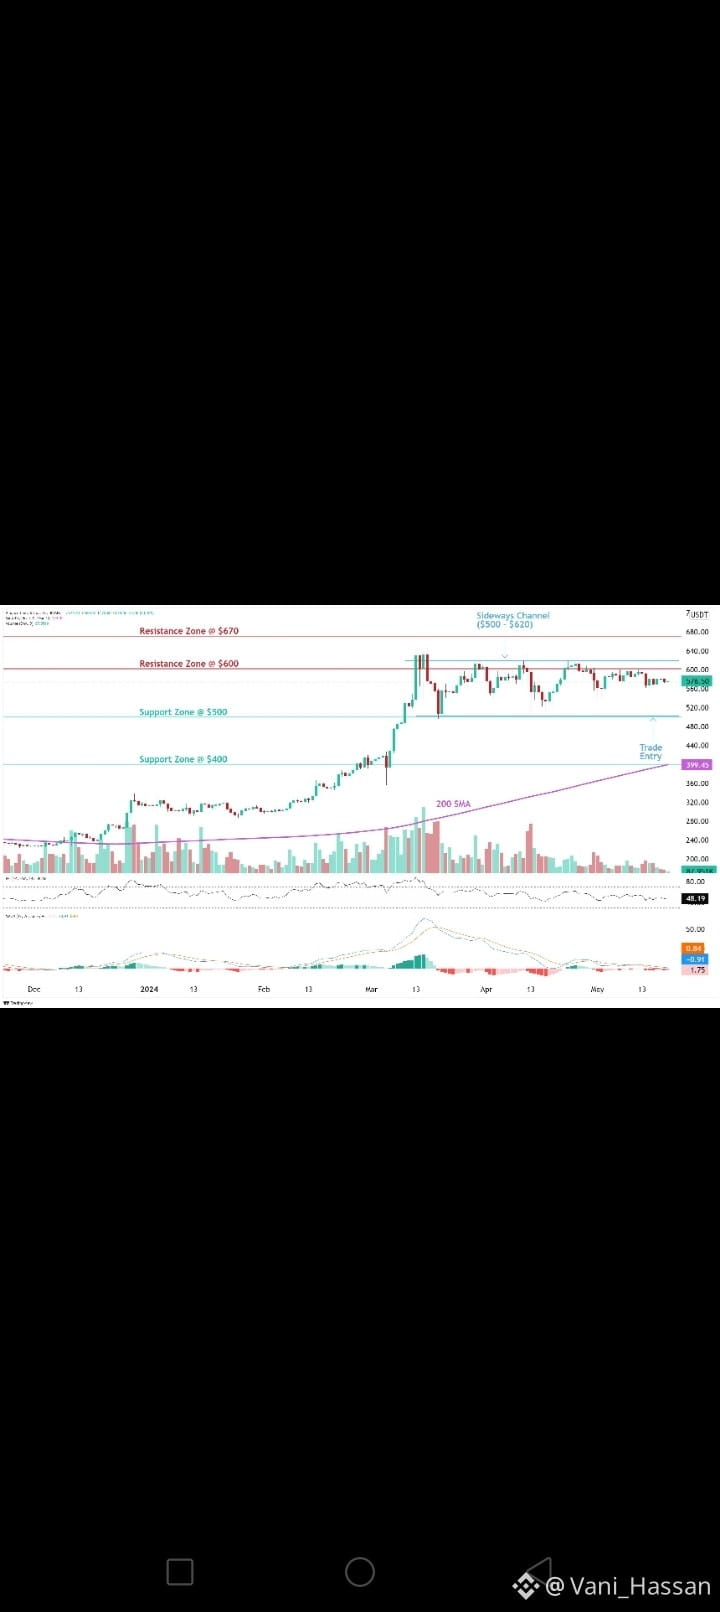
$BNB (BNB) Analysis – 21 July 2026
Current Market View: 🟡 Neutral to Slightly Bullish
Price: Around $563–568 (about PKR 160,000+, exchange-rate dependent).
Trend: $BNB is trading in a consolidation zone after facing resistance near $574. Buyers are defending the $560 support area.
Technical Analysis
✅ Support: $560, then $550
⚠️ Resistance: $574, then $586
RSI: Around 46 (neutral momentum)
Outlook📊: A break above $574 could lead to a move toward $590–600. A drop below $560 may send the price toward $550.
Best Analysis
Short-term (1–7 days): Neutral with a slight bullish bias if support at $560 holds.
Swing trade: Wait for a confirmed breakout above $574 before adding new positions.
Long-term: $BNB remains one of the strongest exchange ecosystem coins, supported by regular token burns that reduce supply over time. ✅
✅Overall Rating: 7.8/10 ⭐⭐⭐⭐⭐⭐⭐☆
Recommendation: Hold. Consider buying only after a confirmed breakout above resistance or on a strong bounce from support. BitcoinReclaims$65K#GoldAndSilverExtendGains #SpaceXFirstMajorShareUnlockSetForAug6 #IranPresidentSaysFullScaleWarWithUS
1
168
·
--
Übersetzung ansehen
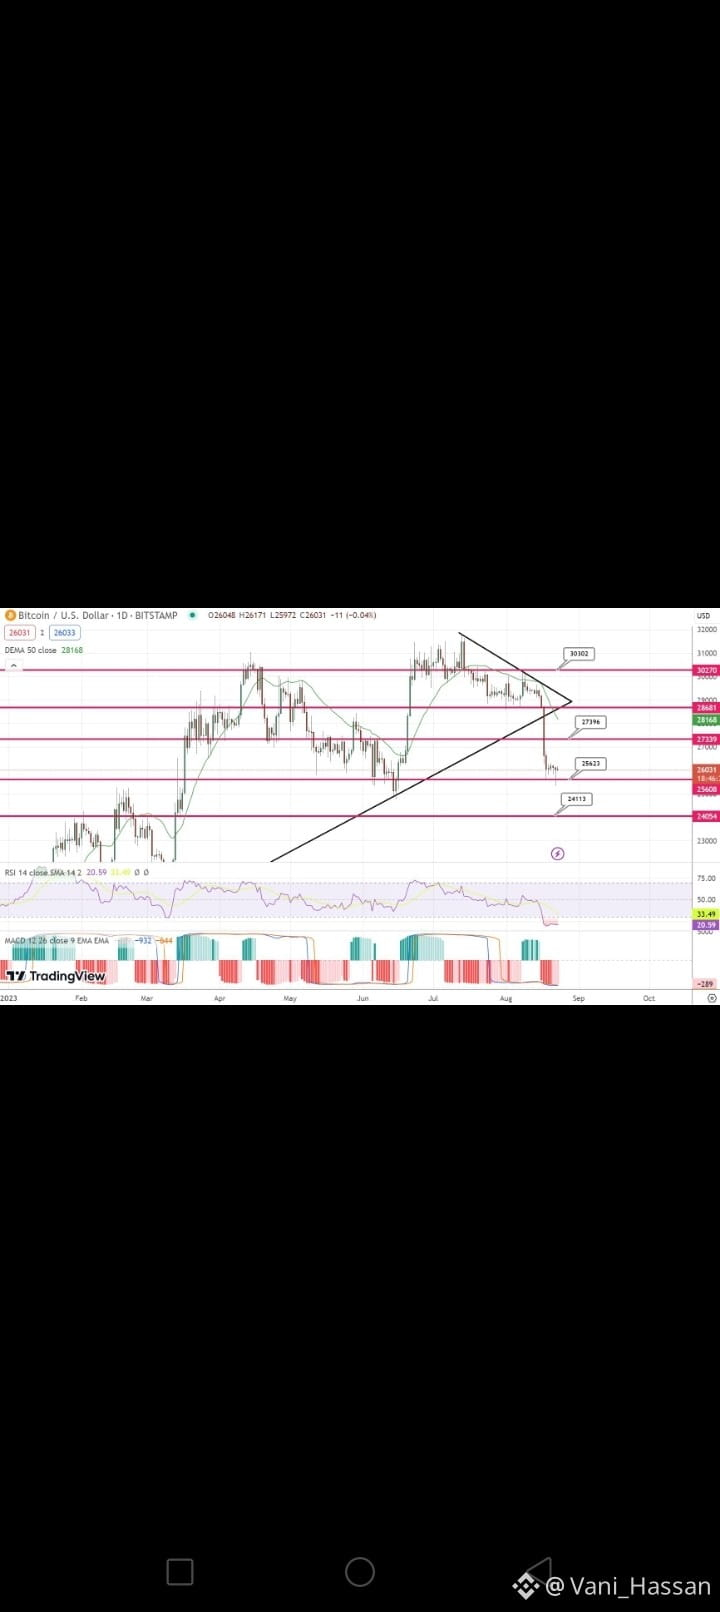
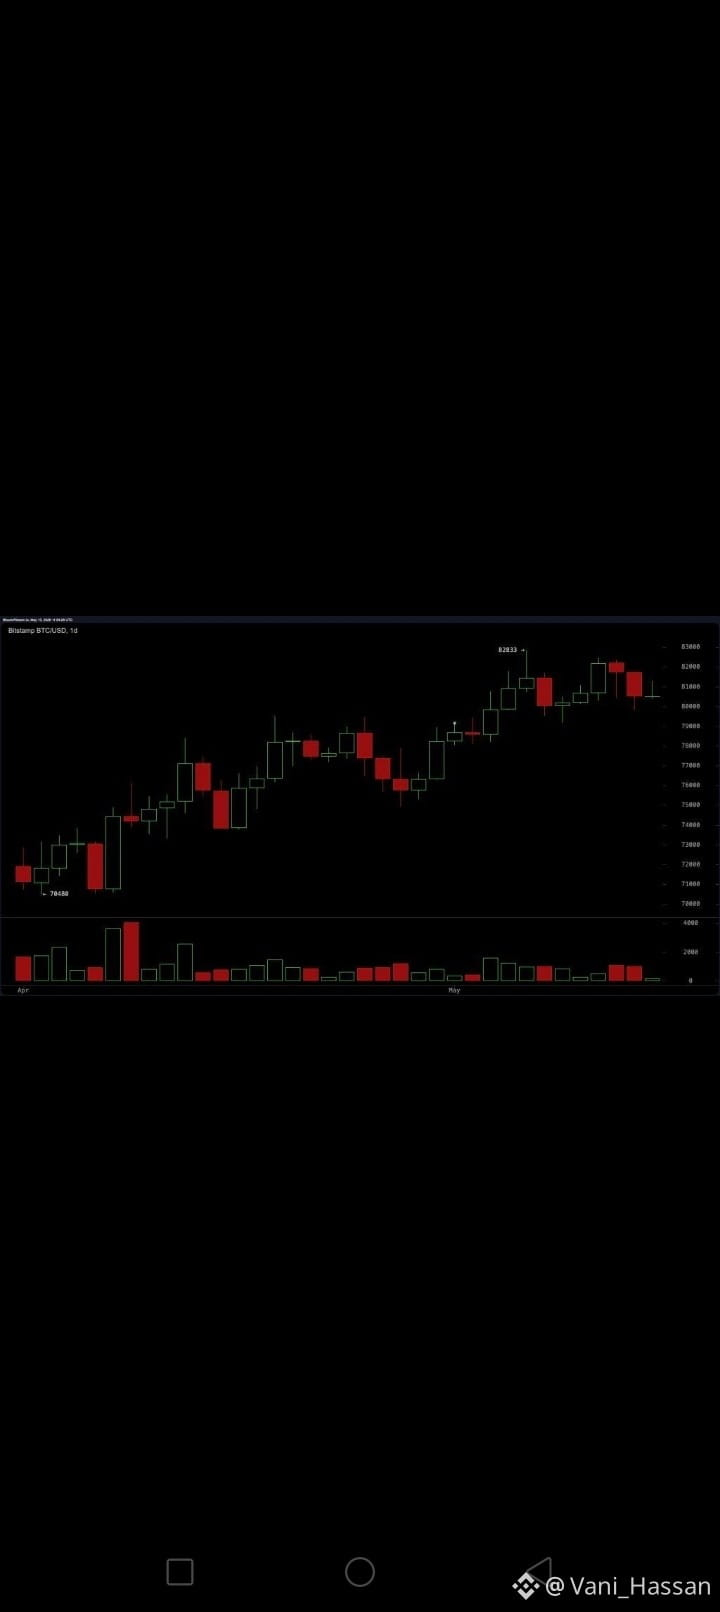
Bitcoin $BTC – Best Analysis (21 July 2026)
Current price: Around $66,000–$66,300 per $BTC . Bitcoin has rebounded above $65,000 and is testing a key resistance area near $66,000–$66,500.
Technical Analysis
Trend: 🟢 Bullish in the short term (higher highs and higher lows).
Support: $64,500–$65,000
Resistance: $66,500–$67,000
Momentum: Positive, supported by renewed institutional ETF inflows and improving market sentiment.
Outlook
Bullish scenario: A strong break above $66.5K could open the way toward $68K–$70K.
Bearish scenario: If $BTC falls below $65K, it may retest the $63.5K–$64K support zone.
Overall Rating
Trend: ⭐⭐⭐⭐☆ (4.5/5)
Short-term: Bullish
Long-term: Bullish, but expect continued volatility.
Trading view: Consider waiting for a confirmed breakout above $66.5K or buying near strong support levels with appropriate risk management. This is market analysis, not financial advice.
#BitcoinReclaims$65K#GoldAndSilverExtendGains #KoreanTradersCutLeverageToThreeMonthLow
71
Anmelden und weiter Inhalte entdecken
Krypto-Nutzer weltweit auf Binance Square kennenlernen
⚡️ Bleib in Sachen Krypto stets am Puls.
💬 Die weltgrößte Kryptobörse vertraut darauf.
👍 Erhalte verlässliche Einblicke von verifizierten Creators.
E-Mail-Adresse/Telefonnummer
Trendthemen
UniswapA16zSeekDeFiExemptionFromIllinoisCryptoTax
26,298 Aufrufe
764 Kommentare
#CryptoTax 🚨 KRYPTOMARKT- & REGULIERUNGS-UPDATE #HKDollarStablecoinHKDAPToLaunchOnSolana
#uniswapa16zseekdefiexemptionfromillinoiscryptotax UNISWAP, a16z & DeFi Education Fund stellen die Krypto-Steuerregeln von Illinois infrage
30. Oktober 2026 | Marktvolatilität & Branchenentwicklungen
📊 1. MARKTÜBERBLICK
Die Kryptomärkte zeigen gemischte Signale: Einige ausgewählte Vermögenswerte verzeichnen starke Gewinne, während mehrere große Kryptowährungen weiterhin unter Druck stehen.
📈 Größte gemeldete Gewinner
SOPH: +60.81% — $0.00238
BEAMX: +37.94% — $0.004701
SKDDB: +16.81% — $9.38
📉 Bemerkenswerte gemeldete Verlierer
INTWUSDT: −61.09% — $6.72
AKEUSDT: −31.47% — $0.013989
SNXXUSDT: −30.71% — $6.43
🔎 Große Krypto-Assets unter Druck
DOGE: −5.06%
PEPE: −4.91%
SUI: −4.83%
NEAR: −3.28%
XRP: −3.13%
Uniswap Labs, Andreessen Horowitz (a16z) und der DeFi Education Fund (DEF) setzen sich für Ausnahmen von Illinois’
#Uniswap #a16z #DeFi #CryptoRegulation #Illinois # #Web3 #BinanceSquare
#HKDollarStablecoinHKDAPToLaunchOnSolana #HKDAP #Stablecoin #CryptoNews #Blockchain #DeFi #DigitalPayments
⚖️ 3. UNISWAP, a16z & DIE KRYPTO-STEUERREGELN VON ILLINOIS
Uniswap Labs, Andreessen Horowitz (a16z) und der DeFi Education Fund sind an Bemühungen beteiligt, Ausnahmen von den vorgeschlagenen Krypto-Steueranforderungen in Illinois zu erwirken.
Die Debatte wirft eine zentrale Frage auf: Wie sollten steuerliche Meldepflichten für dezentrale gelten, die möglicherweise nicht wie traditionelle Finanzintermediäre funktionieren?
Das Ergebnis könnte die DeFi-Compliance, die Pflichten von Entwicklern und das künftige regulatorische Umfeld beeinflussen.
#BinanceSquare #CryptoNews #HKDAP #Stablecoin #Uniswap #a16z #DeFi #CryptoTax
CHASEPA SULUXù
·2 Likes
·235 Aufrufe
HKDollarStablecoinHKDAPToLaunchOnSolana
19,651 Aufrufe
484 Kommentare
$1.5BInLeveragedCryptoBetsLiquidated
43,121 Aufrufe
251 Kommentare