

OMI_ST
47 Beiträge

OMI_ST
Melden
Nutzer blockieren
Trade eröffnen
Regelmäßiger Trader
5.7 Jahre
0 Following
42 Follower
79 Like gegeben
Beiträge
Portfolio
Alle
Zitierungen
·
--
Bärisch
Übersetzung ansehen
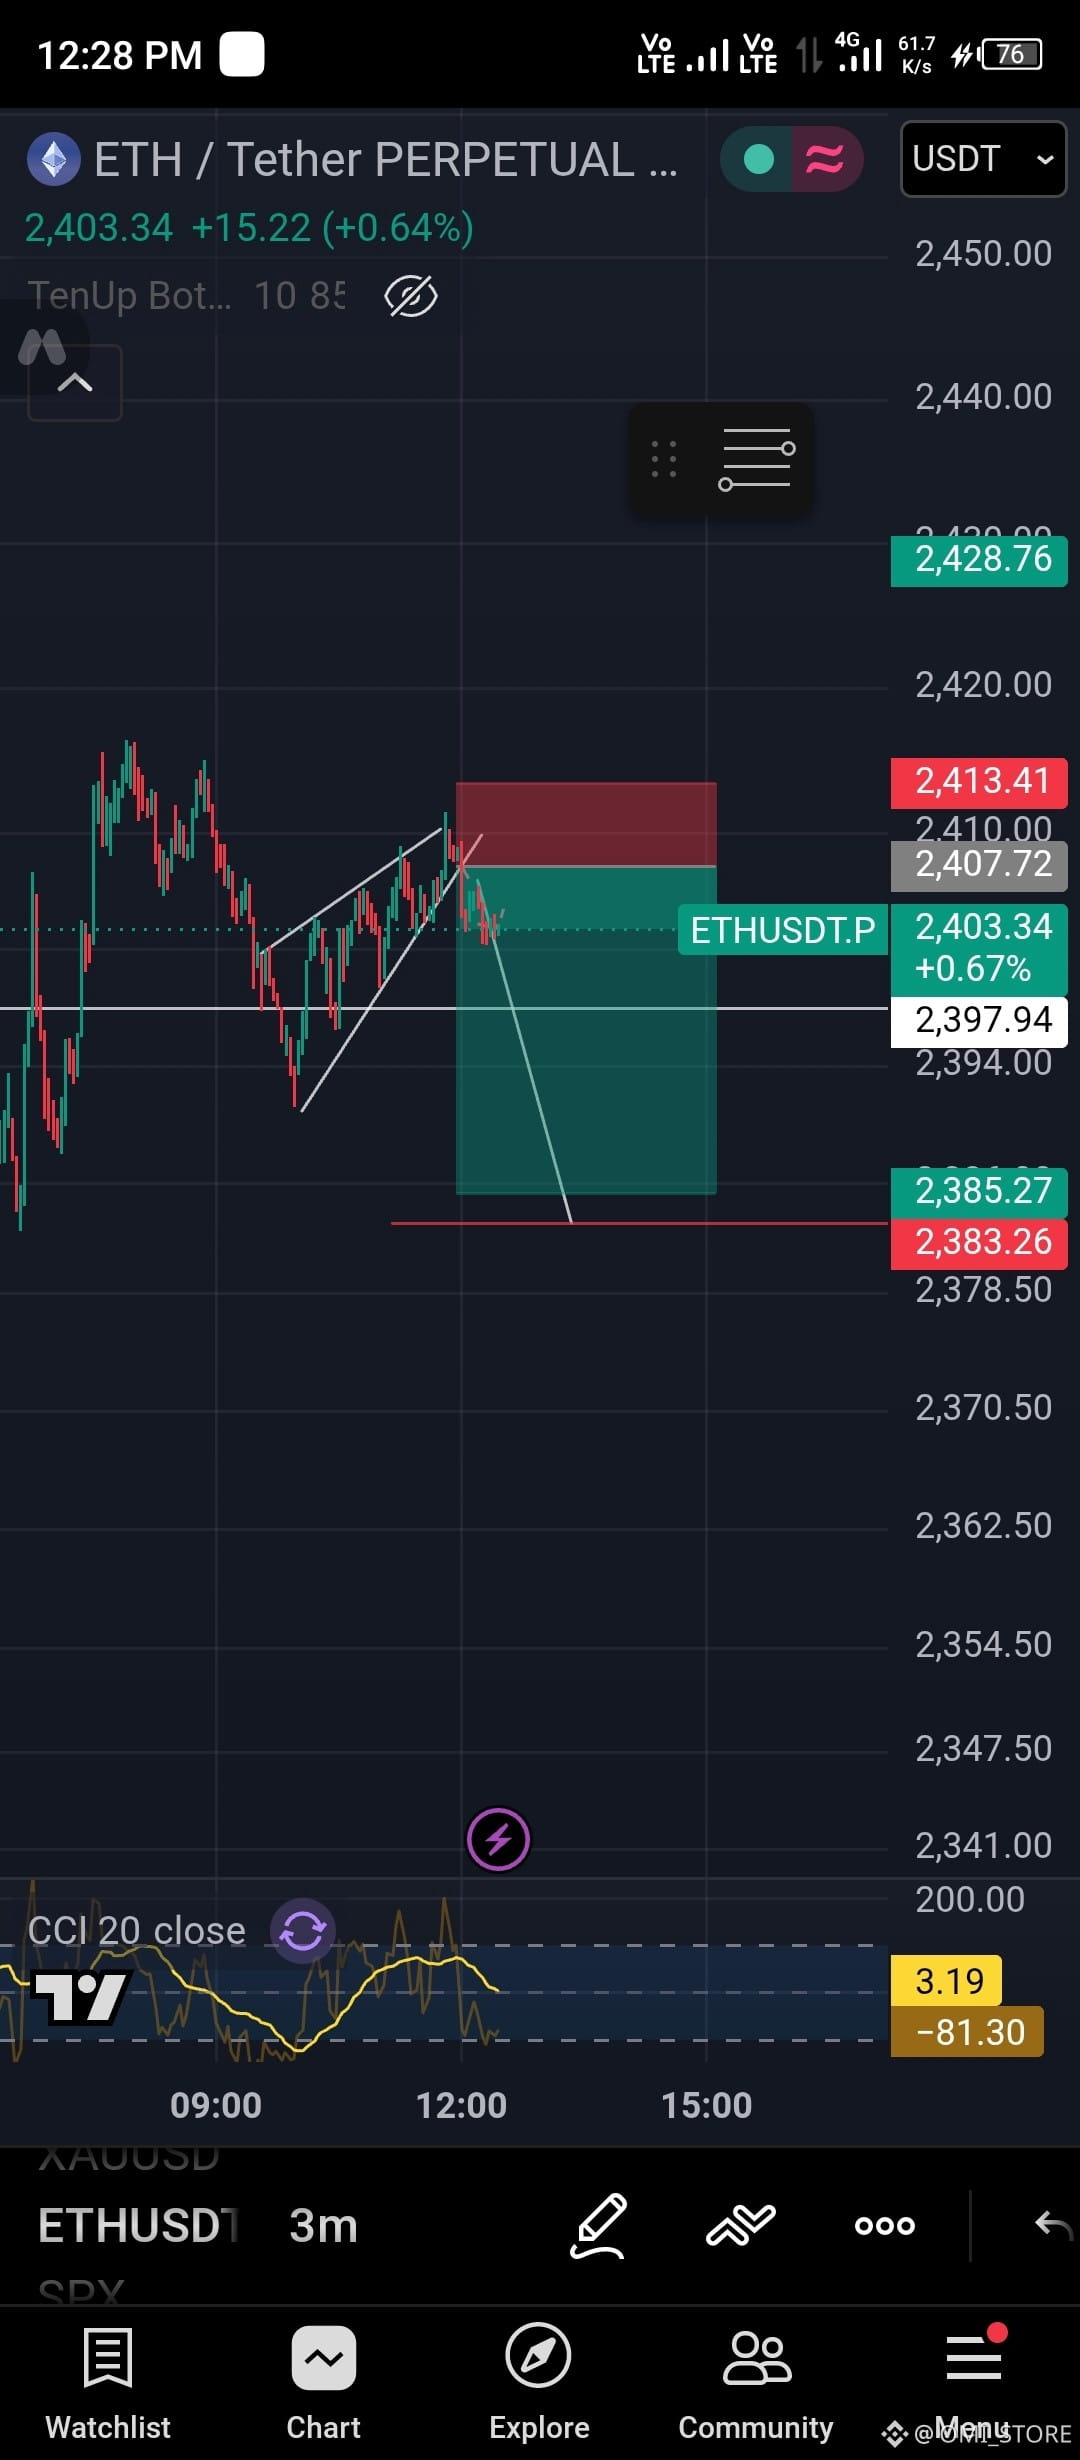
What Works Well in This Setup
Bearish Pattern / Wedge Breakdown:
You identified a rising wedge / ascending channel consolidation pattern after a downward drop.
Price broke down out of the lower trendline of the wedge, which structurally favors a short entry.
Risk/Reward Ratio (RRR):
Entry: Around ~2,407.72
Stop-Loss (SL): 2,413.41 (~5.7 USDT tight SL)
Take-Profit (TP): 2,385.27 (~22.4 USDT profit target)
Your Risk-to-Reward Ratio is roughly 1 : 4, which is statistically great for long-term trading consistency.
Important Things to Watch / Potential Risks
Shorting Directly into Horizontal Support:
Notice the horizontal white line drawn around 2,397.94. That represents immediate local support from the prior swing low.
Price often bounces or consolidates around local support before continuing downward. Be aware of potential chop or a retest of the broken trendline.
CCI Indicator Signals:
The CCI (20) at the bottom is around -81.30 and flattening out. If CCI drops below -100, momentum confirms a stronger breakdown, but if it hooks back up from oversold conditions, a minor pull-back toward your entry level could occur.
Very Tight Stop-Loss (3m Timeframe Noise):
On a 3-minute chart, a ~$5.70 stop-loss (2,413.41) can easily get wicked out by small volatility spikes/spreads even if the overall move eventually hits your TP. Consider keeping an eye on whether price retests the underside of the broken wedge.
Suggested Trade Execution Plan
If active: Keep your Stop-Loss at 2,413.41 strictly set to manage risk.
Partial Profits / Breakeven: If price drops to around 2,397.94 (local support), consider moving your SL to entry (Breakeven) or taking partial profits to secure your position.
What is your current leverage or trade size on this setup?
comment below the post
1
115
·
--
Bullisch
📊 Technische Chartstruktur
Ausbruch und Retest des wichtigen Widerstands/Abwärtstrendlinie:
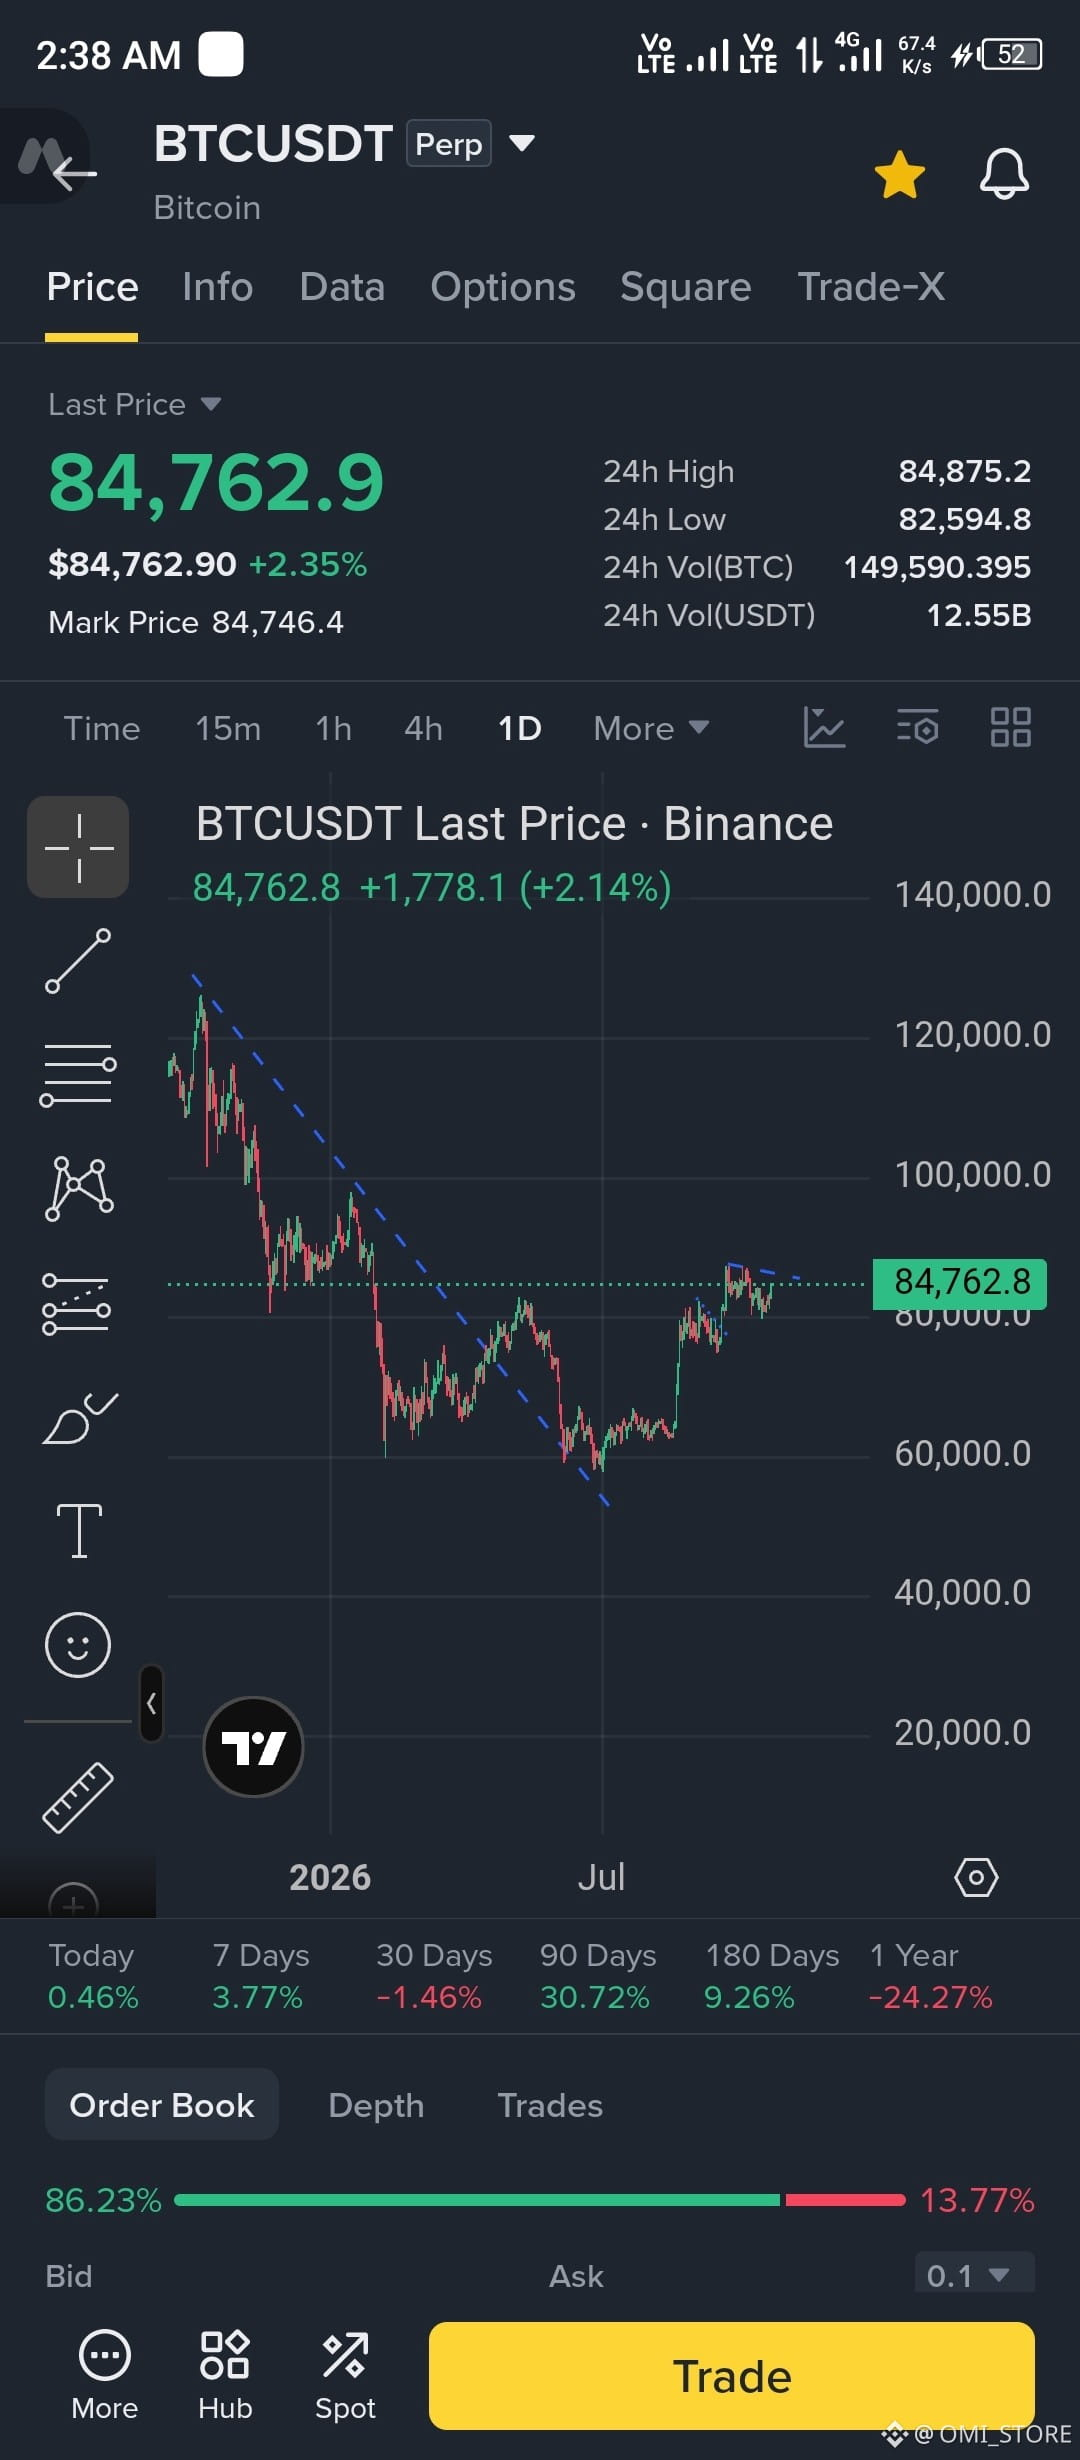
Eine wichtige Abwärtstrendlinie (gestrichelte blaue Linie), die vom lokalen Hoch nahe 128.000–130.000 $ bis Mitte 2026 gezogen wurde, wurde klar nach oben durchbrochen.
Der Kurs erholte sich aus der Doppelbodenregion bei etwa 58.000–60.000 $ (Tief im Juli) und hat die Zone von 84.000–85.000 $ zurückerobert.
Lokaler horizontaler Widerstand / Angebotszone:
Der Kurs stößt derzeit unmittelbar auf den lokalen horizontalen Widerstandsbereich bei etwa 85.000–87.000 $.
Der Docht des lokalen Hochs liegt bei etwa 87.000–87.400 $. Ein klarer Tagesschlusskurs über 87.000 $ ist erforderlich, um die nächste Impulswelle in Richtung 90.000–100.000 $ auszulösen.
🎯 Handelsoptionen (Einstiegs- und Ausstiegsniveaus)
Option 1: Ausbruchsbestätigung (Long-Strategie – bullische Expansion)
Einstiegsniveau:
Aggressiv: Aktuelles Niveau (etwa 84.700–85.000 $), wenn eine Position in Erwartung eines Ausbruchs eingegangen wird.
Konservativ: Nach einem Tagesschlusskurs über 87.200 $ (als Bestätigung eines klaren Ausbruchs über den lokalen Widerstand).
.
Stop-Loss (SL): 80.500–81.500 $ (unterhalb des jüngsten höheren Tiefs / der Nachfragezone um 80.000–82.000 $).
Kursziele (TP):
TP1: 92.000 $ (frühere strukturelle Unterstützungszone, die zum Widerstand geworden ist).
TP2: 100.000 $ (psychologisch wichtiger Widerstandsmeilenstein).
TP3: 115.000–120.000 $ (Kursziel für eine ausgedehnte makroökonomische Aufwärtsbewegung).
Option 2: Einstieg bei Rücksetzer / Retest (Long-Strategie – günstigeres Chance-Risiko-Verhältnis)
Einstiegsniveau: Retest der durchbrochenen Trendlinie / Unterstützungs-Konfluenzzone bei etwa 80.000–82.000 $.
Stop-Loss (SL): 77.000 $ (widerlegt die Struktur höherer Tiefs).
Kursziele (TP):
TP1: 87.000 $ (Retest der lokalen Bereichshochs).
TP2: 96.000–100.000 $.
Option 3: Short-Trade (Zurückweisung am Widerstand)
Einstiegsniveau: Zurückweisungsdochte bei 86.500–87.500 $.
Stop-Loss (SL): 88.500 $ (enger Stop oberhalb des Swing-Hochs).
Kursziele (TP):
TP1: 82.000 $.
TP2: 78.000 $.
#BTC #ETH #BTCUSDT.P
#KoreanRetailLost6.3TrillionWonOnLeveragedETPs
109
·
--
Übersetzung ansehen
TECHNICALLY!!Technical Analysis & Structure
Macro Context (Weekly Chart): The token experienced a massive initial run-up toward 0.0120 followed by a prolonged, brutal downtrend down to the 0.0013 low area.
Trendline Breakout Attempt: You have drawn a descending trendline connecting the recent lower highs. Current weekly price action (0.002318, up +74%) is attempting a breakout above this resistance trendline.
Support Level: The dashed horizontal blue line around 0.002296 acts as the immediate structural pivot/retest level.
Technical Strengths & Key Risks
Bullish Factors
High-Timeframe Breakout Signal: Breaking a downtrend on the Weekly timeframe carries significantly more weight than low-timeframe setups (like 15m).
Volume & Momentum: A strong green weekly candle (+74%) breaking past multi-month resistance shows strong buyer interest rebounding off macro bottom levels (~0.0013).
Risk Factors
Unclosed Weekly Candle: Since this is on the 1w timeframe, the candle is still active. A rejection before weekly close can turn this into a long upper wick (fakeout/bull trap).
Immediate Heavy Resistance Overhead:
Previous lower high consolidation sits around 0.0035 – 0.0040.
Strong structural resistance sits at 0.0060.
Potential Trading Scenarios
Scenario 1: Long Position (Breakout & Retest)
Entry Concept: Wait for the weekly candle to close firmly above the trendline (~0.002300), or enter on a lower-timeframe (1H/4H) retest of the 0.002200 – 0.002300 support zone.
Stop Loss (SL): Placed below the recent swing low / back inside the trendline structure (around 0.001800 - 0.001900).
Take Profit Targets:
TP1: 0.003500 – 0.003800 (First major resistance cluster)
TP2: 0.005800 – 0.006000 (Macro supply zone)
Scenario 2: Short Position (Fakeout / Rejection)
Entry Concept: If the 4H/1D candles start closing back below 0.002200, signaling a fake breakout above the weekly trendline.
Stop Loss (SL): Placed above the weekly wick high (~0.002450 - 0.002500).
Take Profit Targets:
TP1: 0.001800
TP2: 0.001350 (Macro range low)
#DYOR🟢
TECHNICALLY!!
Technical Analysis & Structure
Macro Context (Weekly Chart): The token experienced a massive initial run-up toward 0.0120 followed by a prolonged, brutal downtrend down to the 0.0013 low area.
Trendline Breakout Attempt: You have drawn a descending trendline connecting the recent lower highs. Current weekly price action (0.002318, up +74%) is attempting a breakout above this resistance trendline.
Support Level: The dashed horizontal blue line around 0.002296 acts as the immediate structural pivot/retest level.
Technical Strengths & Key Risks
Bullish Factors
High-Timeframe Breakout Signal: Breaking a downtrend on the Weekly timeframe carries significantly more weight than low-timeframe setups (like 15m).
Volume & Momentum: A strong green weekly candle (+74%) breaking past multi-month resistance shows strong buyer interest rebounding off macro bottom levels (~0.0013).
Risk Factors
Unclosed Weekly Candle: Since this is on the 1w timeframe, the candle is still active. A rejection before weekly close can turn this into a long upper wick (fakeout/bull trap).
Immediate Heavy Resistance Overhead:
Previous lower high consolidation sits around 0.0035 – 0.0040.
Strong structural resistance sits at 0.0060.
Potential Trading Scenarios
Scenario 1: Long Position (Breakout & Retest)
Entry Concept: Wait for the weekly candle to close firmly above the trendline (~0.002300), or enter on a lower-timeframe (1H/4H) retest of the 0.002200 – 0.002300 support zone.
Stop Loss (SL): Placed below the recent swing low / back inside the trendline structure (around 0.001800 - 0.001900).
Take Profit Targets:
TP1: 0.003500 – 0.003800 (First major resistance cluster)
TP2: 0.005800 – 0.006000 (Macro supply zone)
Scenario 2: Short Position (Fakeout / Rejection)
Entry Concept: If the 4H/1D candles start closing back below 0.002200, signaling a fake breakout above the weekly trendline.
Stop Loss (SL): Placed above the weekly wick high (~0.002450 - 0.002500).
Take Profit Targets:
TP1: 0.001800
TP2: 0.001350 (Macro range low)
#DYOR🟢
186
·
--
Bärisch
Übersetzung ansehen
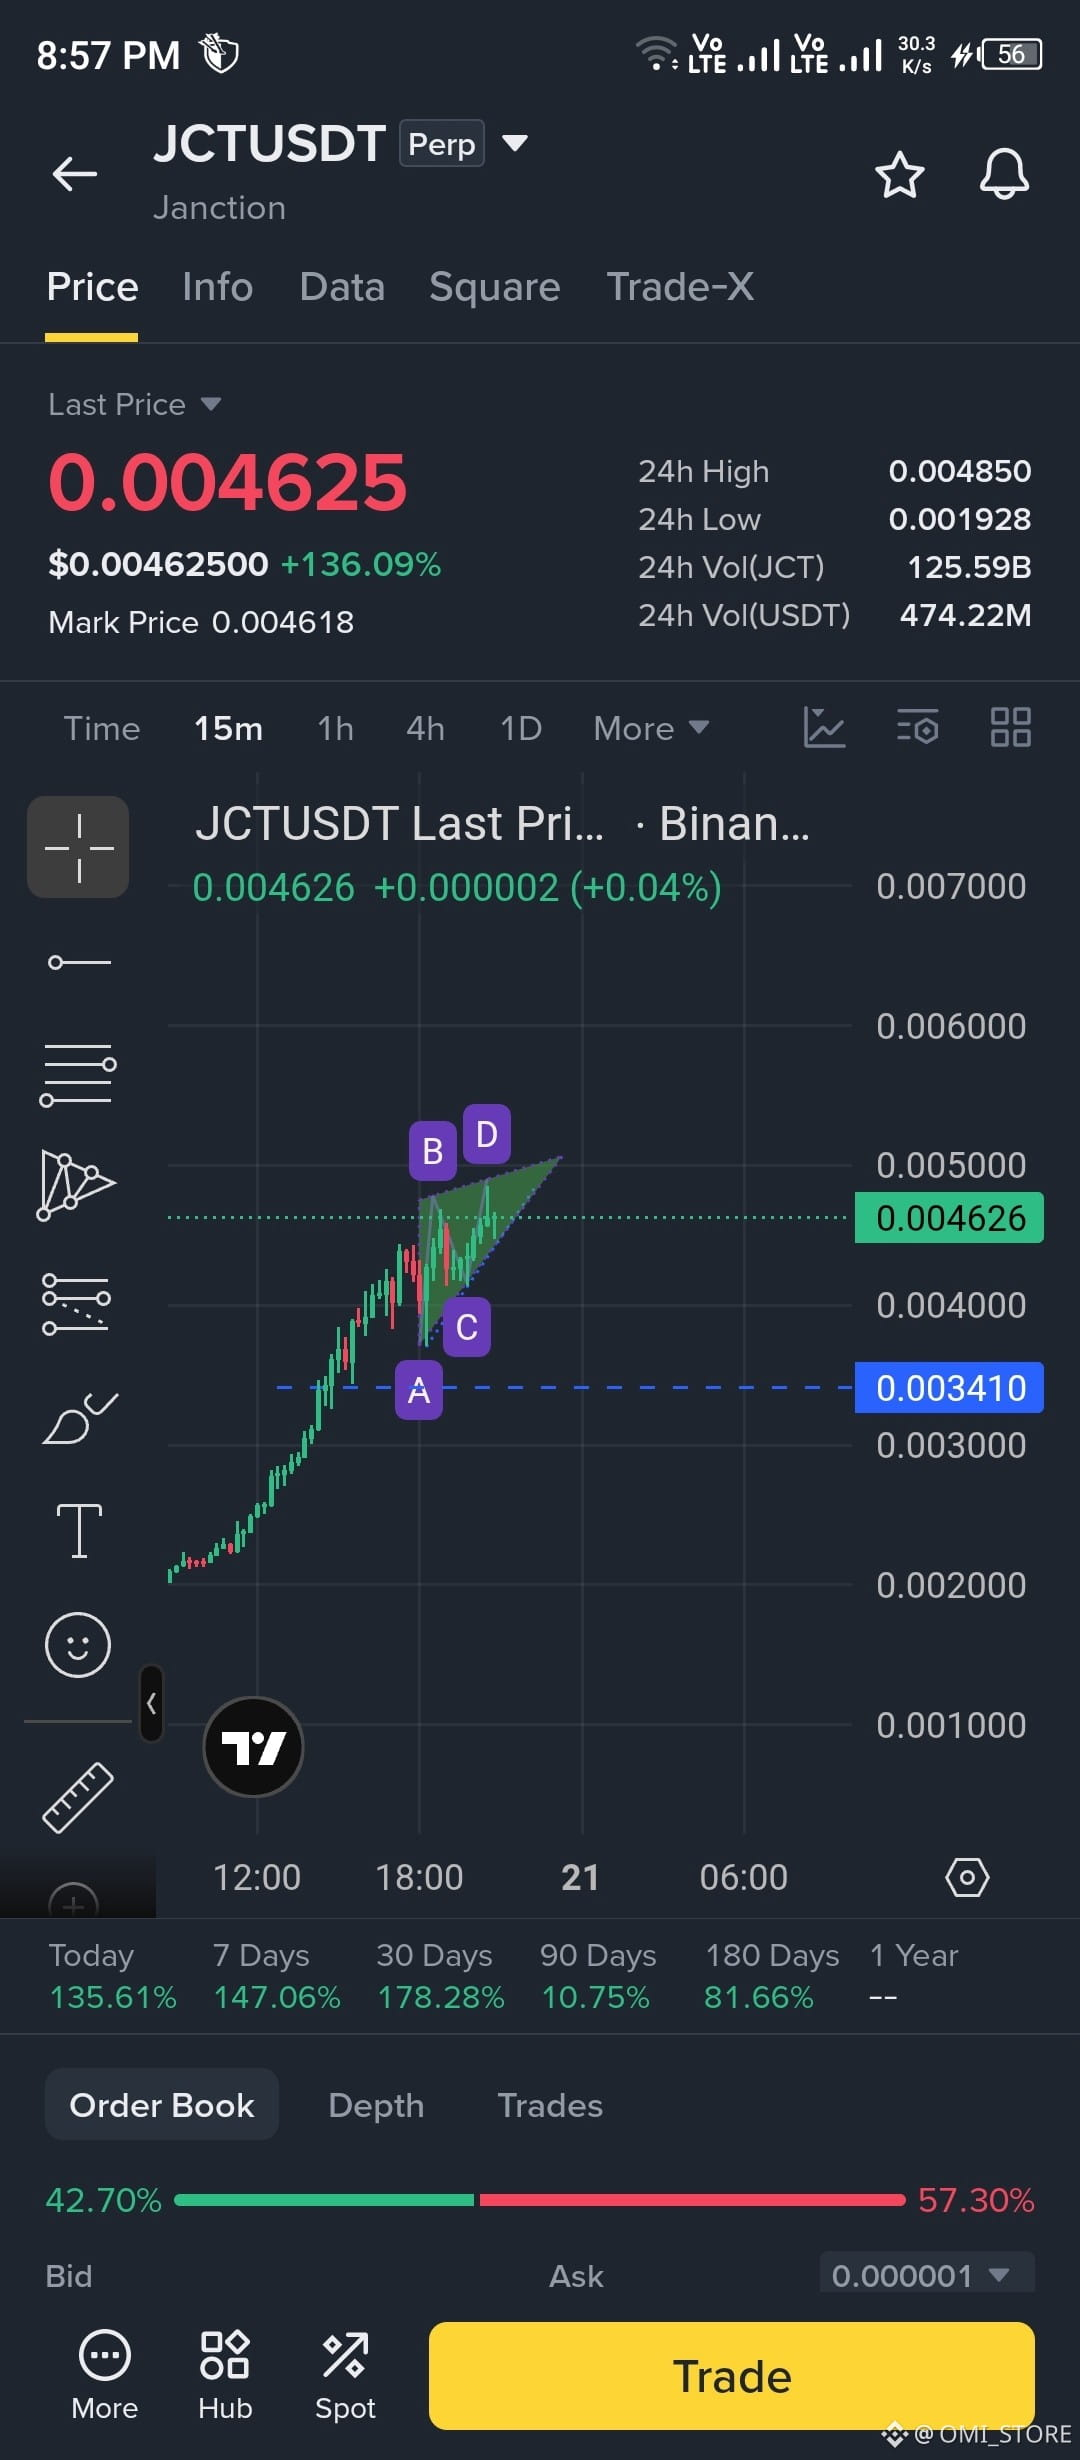
#JCTUSDT
Technical Analysis & Pattern Breakdown
Pattern Identified: You have drawn an Ascending Triangle or a Bullish Pennant / Flag following a massive upward impulse (the price is up +136% on the day).
Resistance Zone: Horizontal resistance is forming around the 0.004850 – 0.005000 area (peaks B & D).
Support Trendline: Higher lows (A & C) are forming along an ascending trendline, showing strong buying pressure on dips.
Technical Strengths & Risks
Pros (Bullish Factors)
Consolidation after Expansion: A high-volatility surge (+130%+) followed by tight consolidation near the highs usually signals continuation rather than immediate reversal.
Higher Lows: Buyers are defending higher price levels aggressively (Point C is significantly higher than Point A).
Cons & Key Risks (Bearish/Cautionary Factors)
Extreme Volatility: Low-cap / high-percentage gainers on 15m charts carry high risk of fakeouts (wicks above resistance followed by sharp dumps).
Double Top / Resistance Rejection Risk: Until a clear candle closes above 0.004850 - 0.005000, the resistance line remains strong, and price could reject back down toward trendline support or lower (~0.003410).
Potential Trade Execution Strategies
Scenario 1: Breakout Confirmation (Safer Long Entry)
Entry: Wait for a 15m candle close above 0.004850 - 0.005000 with healthy volume.
Stop Loss (SL): Placed back inside the triangle (e.g., around 0.004350 - 0.004400).
Take Profit (TP): Target the measured move height of the triangle base (~0.006000 – 0.006500).
Scenario 2: Rejection / Short Setup (If Resistance Holds)
Entry: If price gets rejected sharply at 0.004850 - 0.005000 with a bearish reversal candle (e.g., Shooting Star or Bearish Engulfing).
Stop Loss (SL): Placed just above the recent high (~0.004950 - 0.005050).
Take Profit (TP): Target 1 at trendline support (~0.004200), Target 2 at primary horizontal support (~0.003410).
#DYOR🟢
476
·
--
Heute sehen Sie viele negative Nachrichten über die Märkte, aber BTC hält jetzt eine wichtige Unterstützung von 70k, hier gibt es fast 70% Chancen, dass der Markt bald zurückkommt. Es gibt jedoch auch einige Umstände.
Wenn BTC diese 70k-Unterstützung 💔 bricht, können wir einen weiteren großen Rückgang sehen. Daher empfehle ich nur, im Spot-Wallet zu halten, damit zukünftige Nutzer Gewinne und Verluste buchen können, um größere Verluste oder Liquidationen zu vermeiden. Danke.
$BTC
{future}(BTCUSDT)
Heute sehen Sie viele negative Nachrichten über die Märkte, aber BTC hält jetzt eine wichtige Unterstützung von 70k, hier gibt es fast 70% Chancen, dass der Markt bald zurückkommt. Es gibt jedoch auch einige Umstände.
Wenn BTC diese 70k-Unterstützung 💔 bricht, können wir einen weiteren großen Rückgang sehen. Daher empfehle ich nur, im Spot-Wallet zu halten, damit zukünftige Nutzer Gewinne und Verluste buchen können, um größere Verluste oder Liquidationen zu vermeiden. Danke.
$BTC
Wenn BTC diese 70k-Unterstützung 💔 bricht, können wir einen weiteren großen Rückgang sehen. Daher empfehle ich nur, im Spot-Wallet zu halten, damit zukünftige Nutzer Gewinne und Verluste buchen können, um größere Verluste oder Liquidationen zu vermeiden. Danke.
$BTC

1
33
·
--
#vanar $VANRY
Die Ausführung funktionierte, als Menschen die Benutzer waren.
Es bricht zusammen, sobald Agenten übernehmen.
Unser COO Ash (@AshVanar) erklärt, warum zustandslose Systeme auf eine harte Grenze stoßen und was als nächstes geändert werden muss.
https://x.com/AshVanar/status/2016841839395983801
Die Ausführung funktionierte, als Menschen die Benutzer waren.
Es bricht zusammen, sobald Agenten übernehmen.
Unser COO Ash (@AshVanar) erklärt, warum zustandslose Systeme auf eine harte Grenze stoßen und was als nächstes geändert werden muss.
https://x.com/AshVanar/status/2016841839395983801

1
7
·
--
Bärisch
Überprüfen Sie meine BTC-Analyse genauem Rückgang des Marktes
soo ich hoffe, jemand bemerkt meine Analyse gud luck 🍀
Wenn jemand eine Analyse für Coins möchte, kommentieren Sie mir, ich 🙋 werde bald die Analyse posten ❤
Überprüfen Sie meine BTC-Analyse genauem Rückgang des Marktes
soo ich hoffe, jemand bemerkt meine Analyse gud luck 🍀
Wenn jemand eine Analyse für Coins möchte, kommentieren Sie mir, ich 🙋 werde bald die Analyse posten ❤
soo ich hoffe, jemand bemerkt meine Analyse gud luck 🍀
Wenn jemand eine Analyse für Coins möchte, kommentieren Sie mir, ich 🙋 werde bald die Analyse posten ❤
OMI_ST
·
--
BärischHier ist meine kurze Analyse 🆎über den Kryptomarkt
jetzt bewegt sich btc um 84K
jetzt erwarte ich, dass er weiter auf etwa 72K fällt, dann kann btc wieder gut zurückkehren 🍀 $BTC
jetzt bewegt sich btc um 84K
jetzt erwarte ich, dass er weiter auf etwa 72K fällt, dann kann btc wieder gut zurückkehren 🍀 $BTC


11
·
--
Bärisch
BREAKING:
Es ist nicht nötig, nach Dubai zu ziehen, Sie können jetzt den Burj Khalifa in Gold und Silber sehen. 😅
Tut mir leid für die, die Verlust haben.
BREAKING:
Es ist nicht nötig, nach Dubai zu ziehen, Sie können jetzt den Burj Khalifa in Gold und Silber sehen. 😅
Tut mir leid für die, die Verlust haben.
Es ist nicht nötig, nach Dubai zu ziehen, Sie können jetzt den Burj Khalifa in Gold und Silber sehen. 😅
Tut mir leid für die, die Verlust haben.

1
11
·
--
Über 3,15 BILLIONEN an Marktkapitalisierung wurden in den letzten 24 Stunden von Gold und Silber ausgelöscht 😳
Das ist mehr wert als Meta und Berkshire Hathaway ZUSAMMENGERECHNET #XAUUSD #GOLD_UPDATE
Über 3,15 BILLIONEN an Marktkapitalisierung wurden in den letzten 24 Stunden von Gold und Silber ausgelöscht 😳
Das ist mehr wert als Meta und Berkshire Hathaway ZUSAMMENGERECHNET #XAUUSD #GOLD_UPDATE
Das ist mehr wert als Meta und Berkshire Hathaway ZUSAMMENGERECHNET #XAUUSD #GOLD_UPDATE


1
12
·
--
Bärisch
Hier ist meine kurze Analyse 🆎über den Kryptomarkt
jetzt bewegt sich btc um 84K
jetzt erwarte ich, dass er weiter auf etwa 72K fällt, dann kann btc wieder gut zurückkehren 🍀 $BTC
Hier ist meine kurze Analyse 🆎über den Kryptomarkt
jetzt bewegt sich btc um 84K
jetzt erwarte ich, dass er weiter auf etwa 72K fällt, dann kann btc wieder gut zurückkehren 🍀 $BTC
jetzt bewegt sich btc um 84K
jetzt erwarte ich, dass er weiter auf etwa 72K fällt, dann kann btc wieder gut zurückkehren 🍀 $BTC


1
1
45
·
--
hier ist die BTC-Analyse zu meiner Vorhersage, wenn BTC die 80.000 $ nicht überschreitet, dann kann es jetzt leicht ATH von fast 163.000 $ erreichen
geben Sie mir Ihre Vorschläge müssen $BTC
{spot}(BTCUSDT)
hier ist die BTC-Analyse zu meiner Vorhersage, wenn BTC die 80.000 $ nicht überschreitet, dann kann es jetzt leicht ATH von fast 163.000 $ erreichen
geben Sie mir Ihre Vorschläge müssen $BTC
geben Sie mir Ihre Vorschläge müssen $BTC

1
31
·
--
Bullisch
#og #OGUSDT hier sind gute Nachrichten für ogusdt. p Diejenigen, die og-Münzen halten, werden bald fast einen schönen Gewinn erzielen. Hier teile ich mein tägliches Zeitrahmen-Diagramm, du kannst Unterstützung und den Marktrückgang sehen, aber sei vorsichtig, sei nicht gierig. Wenn BTC fällt, fällt OG auch wie ein Stein 🤘 also setze einen Stop-Loss und mache schnellen Gewinn für Portfolio-Händler, greife nach etwas OG und halte es ein paar Tage, du wirst bald einen ansehnlichen Gewinn machen 😍
Teile immer den Gewinn 😍 wie Glück und Lächeln.
Teile immer den Gewinn 😍 wie Glück und Lächeln.

1
5
·
--
Bärisch
Hier ist #BTC $BTC #BTC走势分析 #BTCUSDT
just eine normale Analyse für Scalper und auch für langfristige Investitionen hier ist ein kleines weiteres Dump wir können sehen, wenn der Markt die erste rote Linie erreicht, wird er bis zu 90k fallen, immer einen Stop-Loss hinzufügen ich hoffe, jeder wird Profit machen 😍 teile Gewinne mit anderen wie ein Lächeln 🙂
just eine normale Analyse für Scalper und auch für langfristige Investitionen hier ist ein kleines weiteres Dump wir können sehen, wenn der Markt die erste rote Linie erreicht, wird er bis zu 90k fallen, immer einen Stop-Loss hinzufügen ich hoffe, jeder wird Profit machen 😍 teile Gewinne mit anderen wie ein Lächeln 🙂

1
41

·
--
Bullisch
#kiteusdt jetzt ausbrechen, ich hoffe, Sie können schnell Gewinn erzielen
weitere Details Eintritt oder Austritt im Screenshot
#kiteusdt jetzt ausbrechen, ich hoffe, Sie können schnell Gewinn erzielen
weitere Details Eintritt oder Austritt im Screenshot
weitere Details Eintritt oder Austritt im Screenshot

339
·
--
Ich vermisse 🥲 Ich gebe auch 7$ ein, aber nur für ein paar $ Profit 🥲
Ich vermisse 🥲 Ich gebe auch 7$ ein, aber nur für ein paar $ Profit 🥲
Cowabungadingdong
·
--
$MLN 50$ bald
ich habe dir um 7$ gesagt
ich habe dir um 7$ gesagt
2
·
--
Bullisch
hier ist mein Beitrag und ich hoffe, dass dieses fallende Keilmuster für diesen Handel gültig ist. Ich werde damit einen kleinen Gewinn erzielen und bald aussteigen.
hier ist mein Beitrag und ich hoffe, dass dieses fallende Keilmuster für diesen Handel gültig ist. Ich werde damit einen kleinen Gewinn erzielen und bald aussteigen.

296
·
--
Liquidation jetzt können wir ein kleines Dump mehr sehen, wenn die Märkte stabil sind, dann ist es 2x bestätigt
Liquidation jetzt können wir ein kleines Dump mehr sehen, wenn die Märkte stabil sind, dann ist es 2x bestätigt

OMI_ST
·
--
Bullisch#MarketPullback
HIER ist #ZORAUSDT Analyse über die Pumpe, wir können deutlich sehen, dass die Lücke sich nach oben zieht und eine fallende Keilformation vollständig ausführt. Vielleicht sehen wir einen kleinen Dump für die Liquidation, aber dann geht es boom 💥 nach oben für Spot-Inhaber. Es sind gute Coins, um Gewinne zu erzielen, einige in das Portfolio aufnehmen.
Folgen Sie, liken Sie, kommentieren Sie für Analysen zu beliebigen Coins ❤
2
262
·
--
Bullisch
#MarketPullback
HIER ist #ZORAUSDT Analyse über die Pumpe, wir können deutlich sehen, dass die Lücke sich nach oben zieht und eine fallende Keilformation vollständig ausführt. Vielleicht sehen wir einen kleinen Dump für die Liquidation, aber dann geht es boom 💥 nach oben für Spot-Inhaber. Es sind gute Coins, um Gewinne zu erzielen, einige in das Portfolio aufnehmen.
Folgen Sie, liken Sie, kommentieren Sie für Analysen zu beliebigen Coins ❤

1
1
1
345
Anmelden und weiter Inhalte entdecken
Krypto-Nutzer weltweit auf Binance Square kennenlernen
⚡️ Bleib in Sachen Krypto stets am Puls.
💬 Die weltgrößte Kryptobörse vertraut darauf.
👍 Erhalte verlässliche Einblicke von verifizierten Creators.
E-Mail-Adresse/Telefonnummer
Trendthemen
UniswapA16zSeekDeFiExemptionFromIllinoisCryptoTax
22,332 Aufrufe
724 Kommentare
#CryptoTax 🚨 KRYPTOMARKT- & REGULIERUNGS-UPDATE #HKDollarStablecoinHKDAPToLaunchOnSolana
#uniswapa16zseekdefiexemptionfromillinoiscryptotax UNISWAP, a16z & DeFi Education Fund stellen die Krypto-Steuerregeln von Illinois infrage
30. Oktober 2026 | Marktvolatilität & Branchenentwicklungen
📊 1. MARKTÜBERBLICK
Die Kryptomärkte zeigen gemischte Signale: Einige ausgewählte Vermögenswerte verzeichnen starke Gewinne, während mehrere große Kryptowährungen weiterhin unter Druck stehen.
📈 Größte gemeldete Gewinner
SOPH: +60.81% — $0.00238
BEAMX: +37.94% — $0.004701
SKDDB: +16.81% — $9.38
📉 Bemerkenswerte gemeldete Verlierer
INTWUSDT: −61.09% — $6.72
AKEUSDT: −31.47% — $0.013989
SNXXUSDT: −30.71% — $6.43
🔎 Große Krypto-Assets unter Druck
DOGE: −5.06%
PEPE: −4.91%
SUI: −4.83%
NEAR: −3.28%
XRP: −3.13%
Uniswap Labs, Andreessen Horowitz (a16z) und der DeFi Education Fund (DEF) setzen sich für Ausnahmen von Illinois’
#Uniswap #a16z #DeFi #CryptoRegulation #Illinois # #Web3 #BinanceSquare
#HKDollarStablecoinHKDAPToLaunchOnSolana #HKDAP #Stablecoin #CryptoNews #Blockchain #DeFi #DigitalPayments
⚖️ 3. UNISWAP, a16z & DIE KRYPTO-STEUERREGELN VON ILLINOIS
Uniswap Labs, Andreessen Horowitz (a16z) und der DeFi Education Fund sind an Bemühungen beteiligt, Ausnahmen von den vorgeschlagenen Krypto-Steueranforderungen in Illinois zu erwirken.
Die Debatte wirft eine zentrale Frage auf: Wie sollten steuerliche Meldepflichten für dezentrale gelten, die möglicherweise nicht wie traditionelle Finanzintermediäre funktionieren?
Das Ergebnis könnte die DeFi-Compliance, die Pflichten von Entwicklern und das künftige regulatorische Umfeld beeinflussen.
#BinanceSquare #CryptoNews #HKDAP #Stablecoin #Uniswap #a16z #DeFi #CryptoTax
CHASEPA SULUX
·2 Likes
·149 Aufrufe
HKDollarStablecoinHKDAPToLaunchOnSolana
16,702 Aufrufe
459 Kommentare
$1.5BInLeveragedCryptoBetsLiquidated
36,356 Aufrufe
242 Kommentare