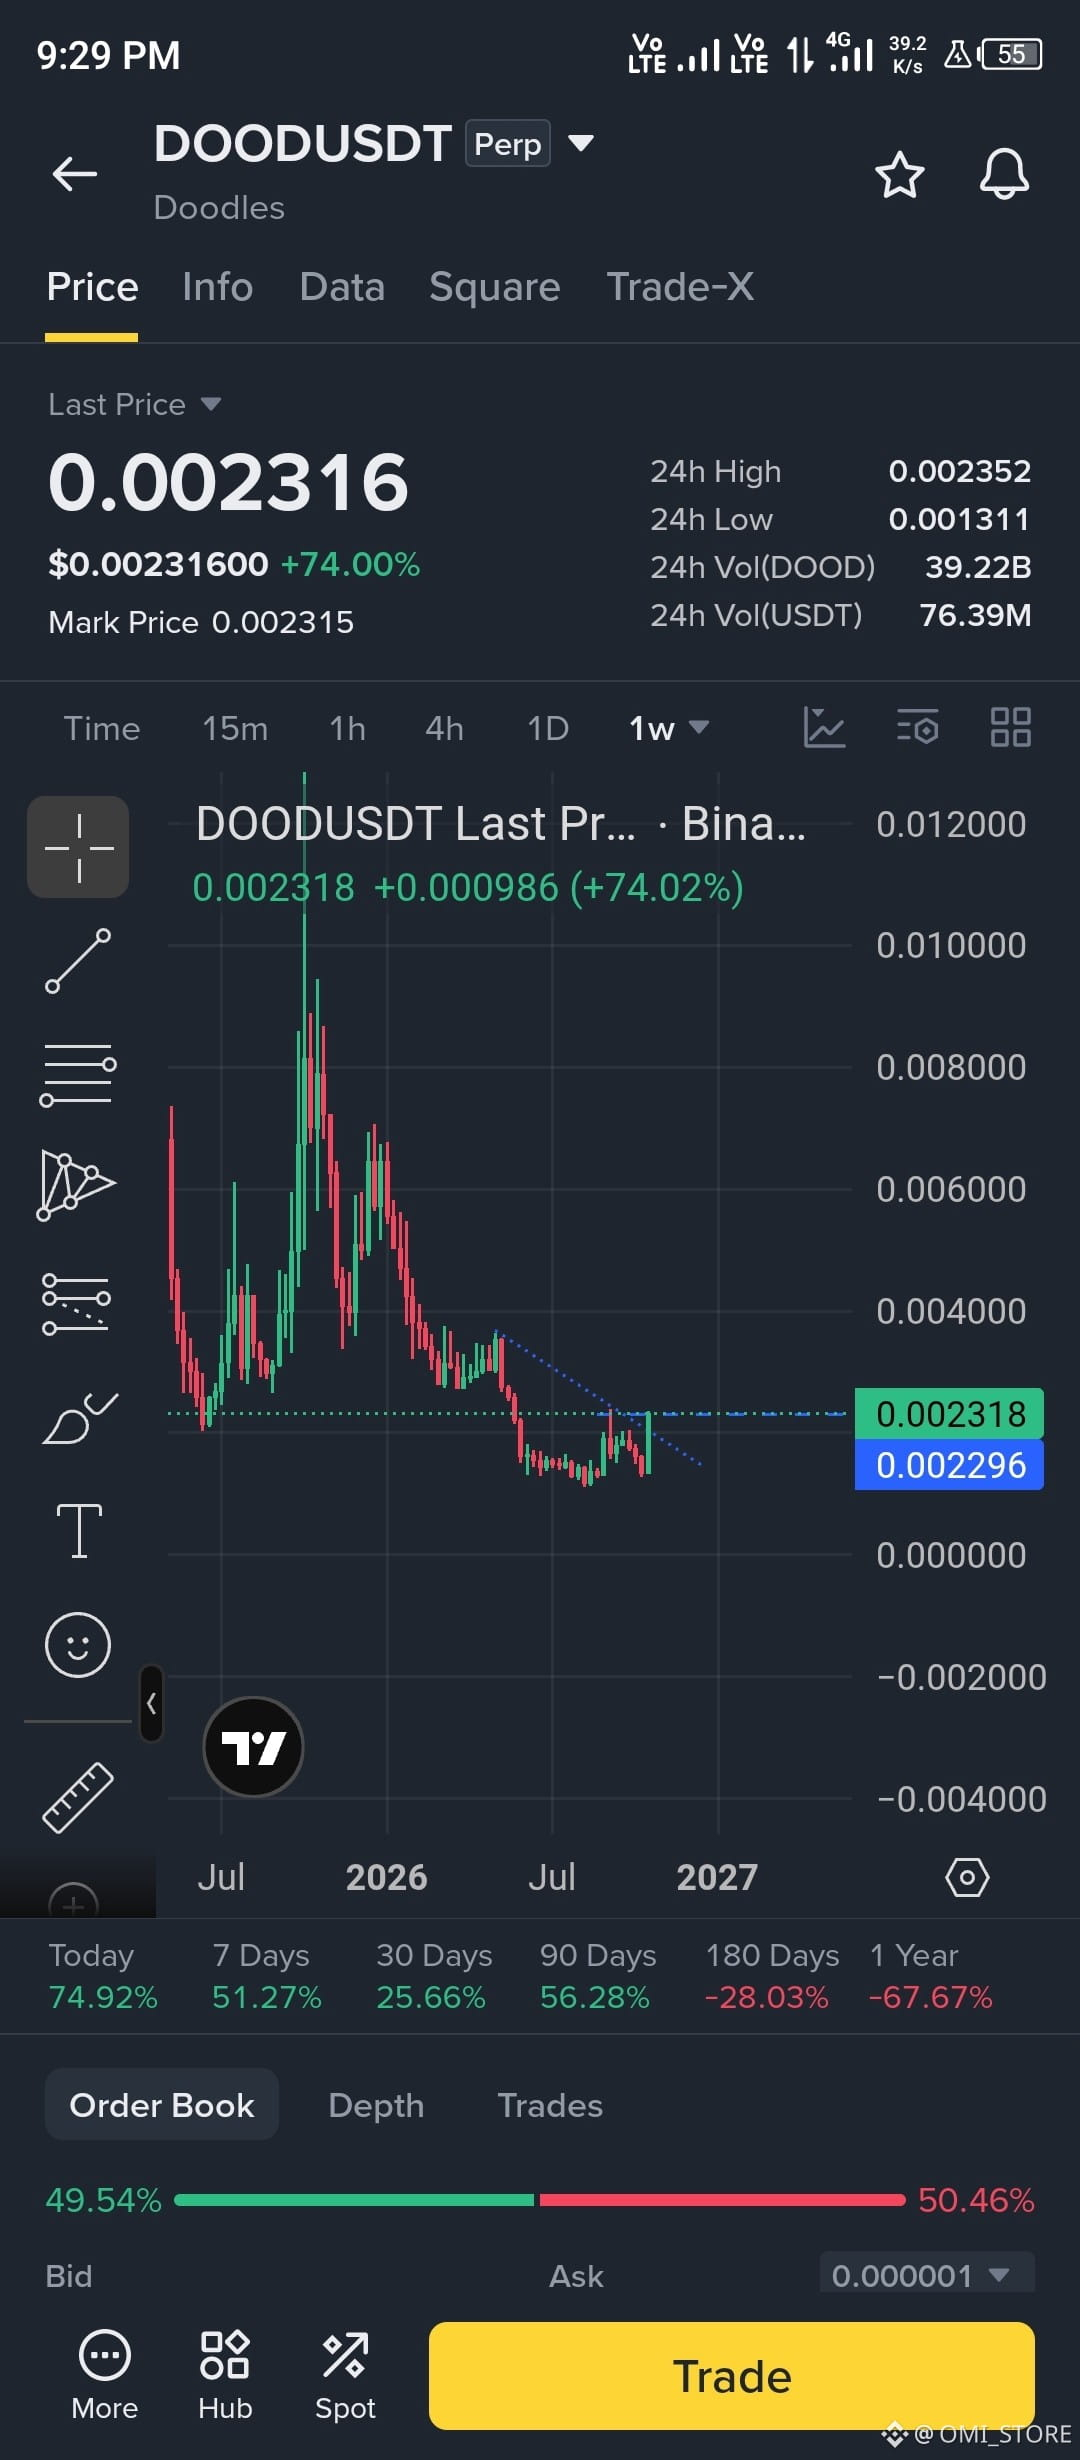
Technical Analysis & Structure
Macro Context (Weekly Chart): The token experienced a massive initial run-up toward 0.0120 followed by a prolonged, brutal downtrend down to the 0.0013 low area.
Trendline Breakout Attempt: You have drawn a descending trendline connecting the recent lower highs. Current weekly price action (0.002318, up +74%) is attempting a breakout above this resistance trendline.
Support Level: The dashed horizontal blue line around 0.002296 acts as the immediate structural pivot/retest level.
Technical Strengths & Key Risks
Bullish Factors
High-Timeframe Breakout Signal: Breaking a downtrend on the Weekly timeframe carries significantly more weight than low-timeframe setups (like 15m).
Volume & Momentum: A strong green weekly candle (+74%) breaking past multi-month resistance shows strong buyer interest rebounding off macro bottom levels (~0.0013).
Risk Factors
Unclosed Weekly Candle: Since this is on the 1w timeframe, the candle is still active. A rejection before weekly close can turn this into a long upper wick (fakeout/bull trap).
Immediate Heavy Resistance Overhead:
Previous lower high consolidation sits around 0.0035 – 0.0040.
Strong structural resistance sits at 0.0060.
Potential Trading Scenarios
Scenario 1: Long Position (Breakout & Retest)
Entry Concept: Wait for the weekly candle to close firmly above the trendline (~0.002300), or enter on a lower-timeframe (1H/4H) retest of the 0.002200 – 0.002300 support zone.
Stop Loss (SL): Placed below the recent swing low / back inside the trendline structure (around 0.001800 - 0.001900).
Take Profit Targets:
TP1: 0.003500 – 0.003800 (First major resistance cluster)
TP2: 0.005800 – 0.006000 (Macro supply zone)
Scenario 2: Short Position (Fakeout / Rejection)
Entry Concept: If the 4H/1D candles start closing back below 0.002200, signaling a fake breakout above the weekly trendline.
Stop Loss (SL): Placed above the weekly wick high (~0.002450 - 0.002500).
Take Profit Targets:
TP1: 0.001800
TP2: 0.001350 (Macro range low)